Department of Natural Resources Fire Suppression...
76
State of Washington Joint Legislative Audit and Review Committee (JLARC) Department of Natural Resources Fire Suppression Study Report 05-11 June 22, 2005 Upon request, this document is available in alternative formats for persons with disabilities.
Transcript of Department of Natural Resources Fire Suppression...

State of Washington Joint Legislative Audit and Review Committee (JLARC)
Department of Natural Resources Fire Suppression Study
Report 05-11
June 22, 2005
Upon request, this document is available in alternative formats for persons with disabilities.

JOINT LEGISLATIVE AUDIT AND REVIEW COMMITTEE 506 16th Avenue SE PO Box 40910 Olympia, WA 98501-2323 (360) 786-5171 (360) 786-5180 Fax http://jlarc.leg.wa.gov
Committee Members SENATORS Brad Benson
Jeanne Kohl-Welles
Bob Oke
Linda Evans Parlette, Vice Chair
Debbie Regala
Phil Rockefeller, Asst. Secretary
Pat Thibaudeau
Joseph Zarelli
REPRESENTATIVES Gary Alexander, Secretary
Glenn Anderson
Kathy Haigh
Janéa Holmquist
Ross Hunter, Chair
Fred Jarrett
Kelli Linville
Deb Wallace
INTERIM LEGISLATIVE AUDITOR Ann Daley
The Joint Legislative Audit and Review Committee (JLARC) carries out oversight, review, and evaluation of state-funded programs and activities on behalf of the Legislature and the citizens of Washington State. This joint, bipartisan committee consists of eight senators and eight representatives, equally divided between the two major political parties. Its statutory authority is established in RCW 44.28. JLARC staff, under the direction of the Committee and the Legislative Auditor, conduct performance audits, program evaluations, sunset reviews, and other policy and fiscal studies. These studies assess the efficiency and effectiveness of agency operations, impacts and outcomes of state programs, and levels of compliance with legislative direction and intent. The Committee makes recommendations to improve state government performance and to correct problems it identifies. The Committee also follows up on these recommendations to determine how they have been implemented. JLARC has, in recent years, received national recognition for a number of its major studies.

DEPARTMENT OF
NATURAL RESOURCES FIRE
SUPPRESSION STUDY
REPORT 05-11
REPORT DIGEST
JUNE 22, 2005
STATE OF WASHINGTON
JOINT LEGISLATIVE AUDIT AND REVIEW COMMITTEE
STUDY TEAM John Woolley Lisa Jeremiah
INTERIM LEGISLATIVE AUDITOR Ann Daley
Copies of Final reports and Digests are available on the JLARC website at:
http://jlarc.leg.wa.gov
or contact
Joint Legislative Audit & Review
Committee 506 16th Avenue SE
Olympia, WA 98501-2323 (360) 786-5171
(360) 786-5180 FAX
The Department of Natural Resources (DNR) is the state’s fire department for fires on private and state-owned forestlands. DNR protects some 12.2 million of the 22 million forested acres in the state. This includes small rural parcels, large commercial forestland, and 2.3 million acres of state-owned land that DNR manages.
While the amount the state spends fighting wildland fires varies greatly from year to year, the spending trend is rising.
Historically, state budget writers based DNR budgets on the answer to the question, “How much money do you think you need?” In addition to adding $23 million for fire fighting in the 2004 Supplemental Budget, the Legislature asked JLARC to investigate why expenditures are increasing and to help policymakers understand how DNR fights forest fires.
When JLARC began to research answers to the Legislature’s questions, we found that agency data systems either did not contain or were too poorly set up to provide data essential to answering the question of why costs are increasing. DNR cooperated fully in this analysis, but getting answers to some basic questions – such as the cost of hiring a firefighter over the past few years – was often frustrating and time consuming. In other instances, the data required simply did not exist at DNR.
The Legislature recognized and addressed this problem when it passed the 2005-2007 Biennial Budget — just as this report was in production. The biennial budget provides DNR with $250,000 to improve the agency’s financial and statistical systems. Such an improvement will be key to helping policymakers understand the factors causing expenditures to increase at DNR.
In spite of the data access challenges we encountered at DNR, this report explains how DNR operates its fire suppression program, offers explanations for spending increases, and suggests changes that, if implemented, will enhance the Legislature’s understanding of why fire suppression spending is rising.
Source: JLARC analysis of DNR budget submission data: controlled for inflation.
$27,391,900
$4,534,900
$9,594,300
$5,705,600
$9,448,800
$13,818,500
$30,700,600
$15,454,200$14,683,500
$24,813,000
$0
$5,000,000
$10,000,000
$15,000,000
$20,000,000
$25,000,000
$30,000,000
$35,000,000
1995 1996 1997 1998 2001 2002 2003 20041999 2000
Exp
endi
ture
s
Fiscal Year
Trending Upward: DNR Expenditures From the State General Fund to Fight Wildland Fires

Is There One Thing Driving Expenditure Increases? No single factor is causing spending to rise for fire suppression. But increasing costs are closely tied to the number of acres burned. So when conditions are ripe for wildfires and they do burn more acres, policymakers can expect expenditures to go up.
Does DNR Comply with Policies Set in Statute? DNR complies with statutory direction to fight wildfires aggressively, but attempts to protect structures as well. This may conflict with statutory direction to make trees a higher priority than structures.
DNR is not currently complying with another statutory direction: to routinely compare its fire suppression costs with those of private-sector vendors. Such a comparison helps to analyze alternatives to current practices.
Who Pays for Fighting Forest Fires? Most of DNR’s funding to fight fires comes from the state general fund. But DNR also receives funding from landowner fees and recovers costs from landowners who through their negligence start fires.
Federal agencies reimburse DNR when it helps suppress fires on federal land. This relationship is growing in importance, but tracking reimbursements is cumbersome. And when DNR reports its annual fire suppression efforts, it does not include fires on federal land.
Can DNR Control Costs Even if More Acres Burn? DNR is taking steps to control costs. For instance, DNR tries to set rates for services before engaging those services — a basic and necessary first step in controlling costs.
The agency, however, will continue to have difficulty monitoring and controlling its costs without more thorough data gathering and analysis. DNR needs to upgrade financial information systems so that managers can more readily tell what they spent and how much they paid for services as they compare costs and build budgets.
Why are Supplemental Budgets So Big? Supplemental budget requests for fire suppression are almost guaranteed because of the unpredictability of fire seasons. One lightning storm can make a fire season severe and expensive. A single, well-timed rain storm can significantly reduce a fire season’s severity and cost.
Nevertheless, we believe DNR can develop a more consistent budget by relying on more predictable information. For instance, DNR could review the costs of fighting small fires separately from the costs associated with fighting large fires.
Recommendations We recommend that DNR undertake the following short- and long-term strategies to help the Legislature and the agency itself better understand wildland fire fighting costs:
1. Provide more complete information on all fires, including those where DNR participates in suppressing fires on federal land;
2. Meet statutory requirements for public/private cost comparisons;
3. Update and upgrade financial systems to include information on unit costs and units used;
4. Enhance the accuracy of budgeting by using more reliable categories such as fire size or management complexity, and encourage policymakers to consider fire suppression and pre-suppression budgets together.
5. Standardize agreements with local fire districts; and
6. Include all costs associated with the helicopter program in the pre-suppression budget, and develop a prospective rate methodology for the helicopter program.

TABLE OF CONTENTS CHAPTER ONE: INTRODUCTION .............................................................................................................1
UNDERSTANDING THE DEPARTMENT OF NATURAL RESOURCES WILDLAND FIRE SUPPRESSION PROGRAM ......1 DNR FIGHTS WILDLAND FIRES ON BOTH PUBLIC AND PRIVATE LANDS ..........................................................1 RECENT HISTORY OF FIRES ON DNR-PROTECTED LAND .............................................................................2 AN EXAMINATION OF DNR’S FIRE FIGHTING EFFORTS..................................................................................4
CHAPTER TWO: DNR’S ROLE IN FIGHTING FIRES ― A REVIEW OF STATUTE................................7 OVERVIEW..................................................................................................................................................7 STATUTORY DIRECTION...............................................................................................................................7 CONCLUSION ..............................................................................................................................................9
CHAPTER THREE: PAYING FOR FIRE SUPPRESSION ― THE SOURCES OF FUNDING ................11 OVERVIEW................................................................................................................................................11 FIRE SUPPRESSION FUNDING SOURCES.....................................................................................................11 PROBLEMS IN TRACKING WHO PAYS ..........................................................................................................15 CONCLUSION ............................................................................................................................................15
CHAPTER FOUR: FIGHTING FIRES: DNR’S EXPENDITURES FOR FIRE SUPPRESSION................17 OVERVIEW................................................................................................................................................17 RELATIONSHIP BETWEEN ACRES BURNED AND TOTAL EXPENDITURES.........................................................17 DNR’S RESPONSE WHEN A FIRE IS REPORTED ..........................................................................................17 HOW DNR DETERMINES WHICH RESOURCES TO USE ................................................................................18 RATES FOR PRIVATE CONTRACTORS..........................................................................................................20 EXPENDITURE TRENDS 1995 - 2004 ..........................................................................................................22 OTHER MAJOR FACTORS INFLUENCING THE COST OF FIGHTING WILDLAND FIRES........................................26 CONCLUSION ............................................................................................................................................27
CHAPTER FIVE: DEVELOPING BUDGETS FOR FIRE SUPPRESSION ...............................................29 OVERVIEW................................................................................................................................................29 SUPPRESSION BUDGETS: GUESSING WHETHER LIGHTNING WILL STRIKE.....................................................29 A SECOND BUDGETING ISSUE: THE COST OF BEING PREPARED..................................................................31 CONCLUSION ............................................................................................................................................32
CHAPTER SIX: CONCLUSIONS AND RECOMMENDATIONS ― BETTER INFORMATION IS REQUIRED TO UNDERSTAND FIRE SUPPRESSION AND CONTROL COSTS ...................................33
FIRST AREA FOR IMPROVEMENT: DNR’S FIRE STATISTICS ..........................................................................33 SECOND AREA FOR IMPROVEMENT: MEETING CURRENT REQUIREMENT FOR COST COMPARISONS ...............35 THIRD AREA FOR IMPROVEMENT: FINANCIAL INFORMATION .........................................................................35 FOURTH AREA FOR IMPROVEMENT: THE BUDGET PROCESS ........................................................................36 FIFTH AREA FOR IMPROVEMENT: AGREEMENTS WITH FIRE PROTECTION DISTRICTS ....................................37 SIXTH AREA FOR IMPROVEMENT: UNDERSTANDING HELICOPTER COSTS......................................................37 AGENCY RESPONSES ................................................................................................................................38 ACKNOWLEDGEMENTS...............................................................................................................................38
APPENDIX 1 – SCOPE AND OBJECTIVES .............................................................................................39
APPENDIX 2 – AGENCY RESPONSES....................................................................................................41
APPENDIX 2A – JLARC’S COMMENTS ON AGENCY RESPONSES ....................................................49
APPENDIX 3 – STATE AUDITOR’S REVIEW OF INTERNAL CONTROLS AND COMPLIANCE..........51

APPENDIX 4 – LOOKING AT COSTS PER ACRE...................................................................................57
APPENDIX 5 – WASHINGTON STATE STATUTE AND FIRE.................................................................59
APPENDIX 6 – ARIZONA STATE ANNUAL REPORT: FIRE SUPPRESSION REVOLVING FUND.....63

CHAPTER ONE: INTRODUCTION UNDERSTANDING THE DEPARTMENT OF NATURAL RESOURCES WILDLAND FIRE SUPPRESSION PROGRAM When the 2003-2005 Biennial Budget was finalized, the Legislature had anticipated providing DNR with a total of $8.4 million in state funds to fight wildland fires in Fiscal Year 2004.
This increased to $31.9 million in the 2004 supplemental budget to cover an increase in the estimated costs to fight fires during the fire season. When the Legislature provided this funding—most of which DNR had already spent—the budget directed JLARC to conduct a performance audit of DNR’s wildland fire suppression program. The Legislature wanted to know more about how the program operates so it could understand why this additional money was needed. Exhibit 1 below illustrates the recent upward trend in suppression expenditures. This report presents the results of JLARC’s analysis of DNR’s fire suppression efforts.1
$27,391,900
$4,534,900
$9,594,300
$5,705,600
$9,448,800
$13,818,500
$30,700,600
$15,454,200
$24,813,000
$14,683,500
$0
$5,000,000
$10,000,000
$15,000,000
$20,000,000
$25,000,000
$30,000,000
$35,000,000
1995 1996 1997 1998 1999 2000 2001 2002 2003 2004
Exhibit 1 – State Funding for DNR Wildfire Suppression is Growing (Controlled for Inflation)
Source: JLARC analysis of DNR budget submission data: some years include Disaster Response Account expenditures.
DNR FIGHTS WILDLAND FIRES ON BOTH PUBLIC AND PRIVATE LANDS Washington is a heavily forested state. Fifty-one percent of the total acreage in the state is estimated to be forestland (21.8 million of the total of 42.6 million acres). Exhibit 2 on the following page illustrates that 61 percent of the forestland in Washington State is publicly owned. Of the publicly owned forestland, 71 percent is owned by the federal government.
1 The $31.9 million total for FY 2004 includes both this general fund state money and money from the Disaster Response Account, an account established to pay for disaster response and recovery.
1

DNR Fire Suppression Study
Exhibit 2 – Forestland Ownership in Washington State
Tribal 1,269,000 acres
10%
County/Municipal 270,000 acres
2%
State Trust2,270,000 acres
17%Federal 9,541,000 acres
71%
Publicly Owned13,350,000 acres
61%Privately Owned 8,542,000 acres,
39%
W s ho Owns The 21.8 Million Acreof Forest?
Who Owns the 13.3 Million Acres of Public Forests?
Source: JLARC analysis of Washington Forest Protection Association and DNR data.
Statutorily, DNR is not responsible for fighting fires on federally owned forestlands. Thus, privately owned and state-owned forestland make up the bulk of the approximately 12.2 million acres where DNR is responsible for fighting fires.
Most of the fires DNR fight are on privately owned forestland. Only 10 percent of the fires DNR fought from 1980 through 2001 started on state-owned lands.
DNR is not the only wildfire suppression agency operating in Washington. Five federal land-management agencies also fight fires on the federal and tribal lands they manage. Local fire protection districts fight wildfires within their district boundaries. The local, state, and federal agencies work together to fight large fires on each other’s lands. Chapter 3 will describe this in more detail.
RECENT HISTORY OF FIRES ON DNR-PROTECTED LAND Historically, fires have had their greatest impact on the eastern portion of the state. Exhibit 3 on the following page illustrates that the two DNR eastern regions of state together account for the majority of the fires (53 percent) and most of the acres burned (96 percent).
2
DNR Fire Suppression Study
Exhibit 3 – Wildfires in the DNR Regions Over the Past 15 Years
Southeast
16% of the fires 53% of acres
Olympic
5% of the fires 1% of acres
Pacific Cascade
23% of the fires 2% of acres
Northeast
38% of the fires 43% of acres
South Puget Sound
9% of the fires 1% of acres
Northwest
9% of the fires 1% of acres
Source: JLARC analysis of DNR data.
Every year, DNR publishes statistics that show the number of fires and the number of acres burned on land the agency protects. Exhibit 4 below shows a ten-year history of the number of fires on DNR-protected land. The number varies every year, but there is a slight trend toward more fires.
Exhibit 4 – The Number of Fires on DNR-Protected
Land Is Increasing Slightly
657
861886 811
1,002992
932904
811781
0
200
400
600
800
1,000
1,200
1995 1996 1997 1998 1999 2000 2001 2002 2003 2004Calendar Year
Num
ber o
f Fire
s
Ten-Year Trend
Source: JLARC analysis of DNR data.
3

DNR Fire Suppression Study
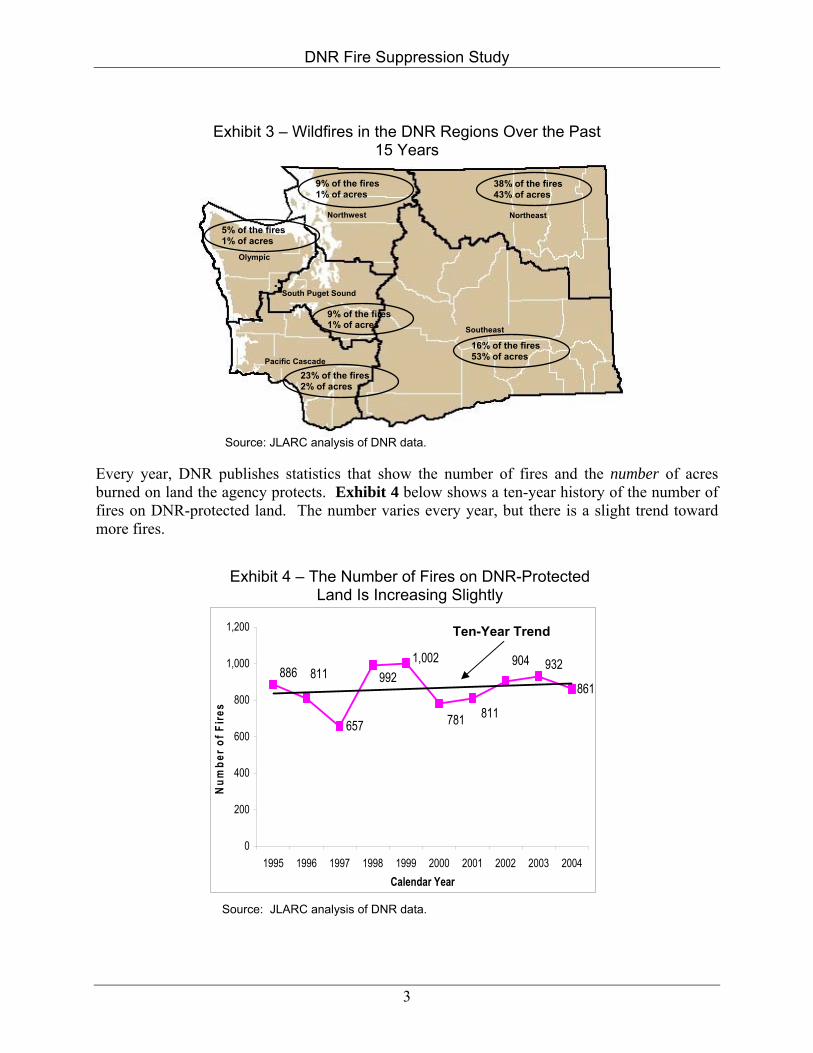
Exhibit 5 below shows the number of acres burned in fires on DNR-protected land. The number varies greatly each year, but the trend line shows a gradual increase over the last ten years.2
Exhibit 5 – The Number of Acres Burned on DNR-Protected Land Is Increasing Slightly
4,035
10,885
4,649
23,517
6,789
18,027
6,976
12,232
10,084
11,544
0
5,000
10,000
15,000
20,000
25,000
1995 1996 1997 1998 1999 2000 2001 2002 2003 2004
Calendar Year
Acr
es B
urne
d
Ten Year Trend
Source: JLARC analysis of DNR data.
AN EXAMINATION OF DNR’S FIRE FIGHTING EFFORTS This report is structured to provide information on DNR’s wildland fire fighting program and to address questions about what is driving up the cost to fight fires. The report focuses on a basic question: “Can we determine why expenditures are going up for wildland suppression?”
We did not find a definitive answer; no single factor accounts for the spending increases. We can say that while year-to-year variations are likely to continue, all indications are that wildland fires are likely to increase in size, complexity, and therefore cost in the future. Thus, efforts to fight fires—and information about those efforts—will take on more importance than when fires were less of a threat.
Chapter 2 looks at a fundamental issue by analyzing DNR’s role in fighting fires as outlined in statute and reviews DNR’s compliance with statutory direction on fire-suppression strategies and costs.
Chapter 3 analyzes how fire suppression is funded, the roles of other agencies in fighting fires, and how DNR recovers costs from other agencies and from landowners.
Chapter 4 reviews how DNR fights fires and specific areas of expenditure, such as personnel and equipment.
Chapter 5 analyzes how suppression budgets are developed.
Chapter 6 concludes the report with our recommendations for how to improve the information available to policymakers so they can better understand DNR’s suppression efforts.
2 Appendix 4 provides detail on another statistic published by DNR: cost per acre protected.
4

DNR Fire Suppression Study
A NOTE ON METHODOLOGY In conducting this audit, JLARC staff visited each of DNR’s six regions and had extensive discussions with staff in each of the regions. We were also at the center of operations of one of the major fires of the 2004 fire season, the “Pot Peak” fire on the shores of Lake Chelan. We visited the sites of fires in previous years, and saw efforts to prevent fires from starting.
However, the focus of this audit is on dollars-and-cents issues. In an attempt to understand trends in fire suppression expenditures, we sought detailed records on expenditure and fire statistics. While DNR is moving to improve access to such information, detailed data sets on expenditure trends (such as, how many units of service were purchased) and statistical trends (such as acres burned) are not easily accessible. There is also no data on the benefits of suppression efforts.
While DNR was able to provide us with some electronic files on the history of expenditures and electronic files with historic fire statistic data, they cautioned that since DNR had little experience in using these files, they were uncertain as to their accuracy.
Traditionally, these two sets of files are not linked. We might have been able to tell from the records the cost of each of the thousands of fires over the past ten years. But there was no link to information on how many acres each fire burned, how it was managed, where it started, or the damage caused by that fire.
For the first time, JLARC did link this information. Linking allowed us to better understand a number of the issues addressed in this report. We believe the information is useful for understanding trends. However, because this linkage has not been done before, and because there is little history in DNR of maintaining historical data electronically, it is possible that there are some errors in the data. Thus, it should not be used to set actual budget levels, but it can be used to better understand the details of the suppression budget.
5

DNR Fire Suppression Study
6

CHAPTER TWO: DNR’S ROLE IN FIGHTING FIRES ― A REVIEW OF STATUTE OVERVIEW This chapter describes DNR’s compliance with state law directing its fire suppression efforts. We found that while DNR does not fight structure fires, its efforts to keep structures from burning may not fully comply with statute. DNR is complying with its mandate to aggressively fight fire, but is not fully complying with directions on cost comparisons.
STATUTORY DIRECTION DNR’s direction for its fire suppression operations is found in Chapter 76.04 of the Revised Code of Washington (RCW). State law defines “suppression” as all activities involved in the containment and control of forest fires. “Forestland” is defined as land with enough trees to constitute a major fire menace. Sagebrush and grass areas east of the Cascade Mountains are included if they are adjacent to or intermingled with forested areas. “Protection” or “pre-suppression” are the activities necessary to be prepared to suppress fires—such as having people trained and ready—as well as fire prevention efforts.
Determining DNR’s suppression responsibilities requires careful reading of statute. An expectation is set in statute that forestland owners will provide protection against the spread of fire. When landowners do not, statute directs DNR to provide such protection and impose a fee: the Forest Fire Protection Assessment. DNR is then responsible for providing suppression services where it collects its protection assessment.
Statute clearly directs DNR to have direct charge of and supervision of all matters pertaining to the forest fire service of the state. Thus, DNR can be considered the fire department when it comes to fighting wildland forest fires on both privately owned and state-owned lands in Washington State.
We focused our detailed review of DNR’s compliance with statute on three issues: (1) DNR’s suppression priorities, (2) direction to aggressively fighting fires, and (3) guidance on cost controls.3
DNR’s Suppression Priorities RCW 76.04.167(2) directs that the primary mission of the department is protecting forest resources and suppressing forest wildfires, second only to saving lives. Further, it is the primary mission of rural fire districts and municipal fire departments to protect and suppress structural fires. Thus, the most effective way for DNR to protect structures is to focus on aggressively suppressing forest fires.
Although DNR does not fight fires in houses or other structures, it does change its tactics when structures are threatened. Exhibit 6 on the following page illustrates how strategies
3 Appendix 5 provides additional detail on RCW 76.04.
7

DNR Fire Suppression Study
might change when fires threaten houses. If no homes were in the area, firefighters would use a road as a fire line. A fire line is a boundary area that contains a fire because the area is cleared of burnable materials. But, if a home is between the fire and the road, the firefighters might create a fire line on the other side of the home rather than take advantage of the road.
These changes in tactics likely conflict with statute and may increase suppression costs. Statute sets DNR’s priority as protecting forest resources. Changing tactics to protect structures may jeopardize trees and increase the cost of fighting fires, according to DNR and national literature. Since statute states that saving lives is the highest priority, fire fighters justify placing a higher priority on structures by thinking of structure protection as a safety issue. DNR recognizes the tension for fire managers when houses are threatened.
Exhibit 6 – DNR May Change Its Suppression Tactics to Protect Structures
Structures Threatened No Structures Threatened
Top Priority: Aggressively Fight Forest Fires Statute says that uncontrolled fire on or threatening forestland is a public nuisance by reason of its menace to life and property. Since uncontrolled fire is a public nuisance, landowners must attempt to suppress fires. If the landowner does not control the fire, then DNR shall suppress the fire. We found that DNR is complying with the direction to aggressively suppress wildfires.
Because of this direction, DNR cannot let fires burn. Statute does recognize that fire under controlled conditions can be used to maintain healthy forests, but it very clearly charges DNR with suppressing uncontrolled fires. While the federal government does allow some fires to burn uncontrolled, this happens only after substantial planning has taken place to identify the potential effects of such uncontrolled fires.
Statute’s Direction to Compare Costs We also looked at compliance with statute related to the costs of fighting wildland fires. Statute directs DNR to annually create a list of its own fire suppression equipment and a roster of costs from private vendors. DNR is to compare these two lists and use the most effective and efficient resources available.
8

DNR Fire Suppression Study
While not formally contained in statute, when the Legislature directed DNR to make the cost comparisons outlined above, its intent was clear:
“The legislature finds that it is frequently in the best interest of the state to utilize fire suppression equipment from private vendors whenever possible in responding to incidents involving wildfires on department-protected lands. It is the intent of the legislature to encourage the department of natural resources to utilize kitchen, shower, and other fire suppression equipment vendors as allowed in RCW 76.04.015 (4)(b), when such utilization will be most effective and efficient.” (1995 c 113: Finding--Intent).
DNR is not fully complying with this mandate. DNR does have schedules of costs of private sector vendors, and does have an understanding of its unit costs, but DNR does not routinely produce analyses that identify what the most efficient and effective resources might be. DNR was able to answer specific inquires by JLARC, and DNR has done some analysis of specific resources, such as camp crews and kitchens. Yet, DNR does not conduct an annual analysis as the law directs it to.
Part of the challenge in completing a cost analysis/comparison is determining what is “efficient and effective.” Unit-cost data can determine which resource (private or public) is least expensive on an hourly basis. Such data should be readily available. But there are a number of other issues which must be taken into consideration, for example:
• How close to a fire the resources are located;
• How many hours will those resources be needed;
• Whether or not those resources will be available in a timely manner; and
• The training level and abilities of the resources needed.
CONCLUSION DNR is complying with statute to aggressively fight fires. Statute directs DNR to protect trees over homes, but statute also tells DNR that its first priority is to save lives. Thus, there is tension between protecting trees and homes since firefighters believe they are protecting homes in order to protect lives. We also found that DNR is not conducting annual cost comparisons as is directed in statute.
9

DNR Fire Suppression Study
10

CHAPTER THREE: PAYING FOR FIRE SUPPRESSION ― THE SOURCES OF FUNDING OVERVIEW DNR receives its funding for fire suppression from the state general fund, from landowners, and from federal and local government partnerships. These funding sources pay for DNR’s suppression efforts on specific fires as they occur. DNR also has a Fire Protection budget that funds activities necessary to prepare for the fire season. The Fire Protection budget is funded in part by a landowner assessment, the Forest Fire Protection Assessment.
FIRE SUPPRESSION FUNDING SOURCES The state general fund provides the majority of funding for DNR’s fire suppression program. As Exhibit 7 below illustrates, of the total of $167 million in expenditures over the past ten fiscal years, 86 percent has come from the state general fund. Other sources include federal funding (11 percent), payments from other states or local governments (0.3 percent), and the Landowner Contingency Fund (3 percent). These percentages can vary annually.
Exhibit 7 – The State General Fund Provides the Majority of Funding for Fire Suppression
Local0.3%
Landowner Contingency
3%
Federal11%
State - General Fund86%
$167 million in total expenditures, FY 1995 through FY 2004
Source: JLARC analysis of DNR data. State general fund includes Disaster Recovery Fund. Because of rounding, chart total does not equal 100 percent.
State General Fund The state general fund is the single largest source of funding for wildfire suppression costs. Statute (RCW 76.04.620) states that “biennial general fund appropriations to the Department of Natural Resources normally provide funds for the purpose of paying the emergency fire costs
11

DNR Fire Suppression Study
and expenses incurred and/or approved by the department in forest fire suppression or in reacting to any potential fire situation.”
Landowner Funding In addition to funding from the state general fund, DNR receives funding from landowners in two ways: through cost recovery when the landowner caused the fire, and through two ongoing landowner assessments.
Negligent Cost Recovery
DNR recovers some costs from landowners where fires are determined to result from landowner negligence. Exhibit 8 below illustrates how the amount of recoveries deposited into the state general fund varies annually, but is trending down. From 1995 - 2004, the total collected and deposited in the state general fund was $2.5 million.
Exhibit 8 – Costs Recovered from Negligent Landowners Are Decreasing
$0
$100,000
$200,000
$300,000
$400,000
$500,000
$600,000
$700,000
$800,000
95 96 97 98 99 00 01 02 03 04
Fiscal Year
Ten-Year Trend
Rec
over
ies
Source: JLARC analysis of DNR Data.
Recognizing this drop in negligence recoveries, DNR has recently made administrative changes in the way it manages such recovery efforts, such as rewriting its program for training fire investigators.
Landowner Contingency Account
When DNR determines that fires are the result of landowner operations, the Landowner Contingency Forest Fire Suppression Account pays for suppressing the fire (assuming no negligence is found). Such landowner operations are defined in statute to include “activities related to the growing and harvesting of forest products, the development of transportation systems, the utilization of minerals or other natural resources, and the clearing of land.” (RCW 76.04.005 (11)).
12

DNR Fire Suppression Study
Exhibit 9 shows a multiple-year history of expenditures from the account and the downward trend in the account’s expenditures
Exhibit 9 – Expenditures from the Landowner Contingency Account Are Trending Down
$0
$500,000
00,000
00,000
$2,000,000
$2,500,000
81 83 85 87 89 91 93 95 97 99 01 03
$1,0
$1,5
Fiscal Year
Exp
endi
ture
s
Trend line
Source: JLARC analysis of DNR data.
Statute directs DNR to set a rate for this assessment of no more than $7.50 per parcel for participating landowners owning forest parcels of 50 acres or less. In addition, for parcels greater than 50 acres, DNR may charge a flat per-acre fee not to exceed 15 cents per acre. Statute also directs DNR to set rates such that a balance of $3 million is maintained.
Since 1980, the per-acre rate has varied between 1 cent and 12 cents, with different rates set for eastern and western Washington. In November 2004, DNR suspended collection of assessments, as it believes that the fund balance (Fiscal Year 2004 ending balance of $6.1 million) exceeds probable use of the fund.
Forest Fire Protection Assessment
Another important source of funding is the Forest Fire Protection Assessment (FFP). This assessment is $14.50 per forestland parcel, with 50 cents going to counties. Landowners pay an additional 25 cents per acre for parcels over 50 acres. But this funding is not used for suppression; it is used for protection (activities such as fire prevention efforts and having resources in place to suppress fires).
Over the past five years―fiscal years 2000 through 2004―expenditures for such activities from the FFP have averaged $6 million per year. Total expenditures from all fund sources (state general fund, various federal funding sources, and amounts from air pollution control funds) have averaged $12.6 million per year during this period.
13

DNR Fire Suppression Study
Partnerships with Other Agencies Fire suppression efforts in Washington and around the country rely heavily on interagency partnerships. “Ownership” of a fire―who is responsible for suppression on the land where the fires started or where the fire may burn―will affect who eventually pays suppression costs.
Local Fire Protection Districts
Local fire districts are responsible for suppressing all fires in their jurisdiction. In some instances, both DNR and the fire district protect the same parcel of land. Landowners on this joint-jurisdiction land pay both the fire district levy and DNR’s forest fire protection assessment.
Typically, fire districts do not pay DNR for its assistance, but DNR does pay fire districts for their assistance. How DNR and the fire district work together is defined by agreements between the DNR region and the fire district.
Relationships between DNR regions and fire districts are not standard across the state. DNR regions in the eastern part of the state typically do not pay fire districts to fight a fire on joint-jurisdiction land. Other DNR regions do pay fire districts for their assistance after a certain amount of time (frequently between one-half and two hours) has passed.
We found that several DNR regions are moving away from agreements where DNR pays the fire district for its efforts on joint-jurisdiction land. Some fire districts are resisting such change as the district may lose revenue.
We share the concerns that are leading DNR to push for more balance in agreements with local fire protection districts. Currently, DNR is paying districts to fight a fire within the district’s own boundaries, even though the local district is collecting a levy on this land.
Washington State Patrol
When a local fire protection district has responsibility for a fire, but the fire overwhelms the abilities of that district and is threatening homes, the Washington State Patrol can declare a State Mobilization. The State Patrol’s emphasis is on structure protection so the engines and crews that they bring in will focus on the structures, although they may also fight the wildland portion of the fire. DNR may also be involved in suppressing the wildland fire.
Federal Land Management Agencies Five federal land management agencies have fire suppression responsibilities: U.S. Forest Service, Bureau of Land Management, Bureau of Indian Affairs, National Park Service, and Fish & Wildlife Service. When a fire burns on one agency’s land, other agencies will help, if they are able. Interagency agreements define certain instances when one agency may offer assistance without charging another. At other times, the cost of this assistance is reimbursed through a cost apportionment agreement developed after the fire has been suppressed and the agencies fully understand their mutual level of involvement.
Federal Emergency Management Agency
The Federal Emergency Management Agency (FEMA) is not directly responsible for fire suppression, but it does pay for the costs of fires that threaten to become major disasters where
14

DNR Fire Suppression Study
50 or more homes are threatened. FEMA pays for 75 percent of eligible suppression expenses. During the 2004 fire season, the Elk Heights fire in Kittitas County, Mud Lake fire in Yakima County, and the Fischer fire in Chelan County all received FEMA grants.
PROBLEMS IN TRACKING WHO PAYS After a fire occurs that involves multiple agencies—such as DNR and the U.S. Forest Service—a cost apportionment agreement is developed. These agreements define the basis for that agreement—such as actual acres burned or acres threatened—and then determine how the agencies will share the costs.
DNR’s electronic financial systems do not currently account for how DNR was reimbursed through a cost apportionment agreement. When we reviewed the accounting system at the individual fire level, we were unable to learn how much or for what activities DNR was reimbursed, although DNR does have paper records of reimbursement. Depending on the agreement, agencies either reimburse each other for each individual fire or for all of the fires in the entire fire season. This in part explains the lack of a fire-specific accounting record.
In order to provide better oversight of cost apportionment agreements, however, interagency agreements need to be changed and financial systems revised so that DNR records payments per individual fire. Current processes make such oversight very difficult.
CONCLUSION Most of DNR’s funding comes from the state general fund and from federal agencies when DNR assists them. DNR assesses landowners’ fees for fire protection, fees for fires caused by landowner operations, and recovers costs from landowners who start a fire through negligence. Landowners’ share of firefighting costs, however, is decreasing. DNR’s electronic data systems do not currently track cost recoveries by fire event, but for series of fires or for a fire season. DNR should enhance its data collection and reporting systems to ensure accountability and accuracy in cost sharing.
15

DNR Fire Suppression Study
16

CHAPTER FOUR: FIGHTING FIRES: DNR’S EXPENDITURES FOR FIRE SUPPRESSION OVERVIEW This chapter provides analysis of the resources DNR uses to fight fires and how DNR decides which resources to use. Not surprisingly, we found a strong connection between acres burned and expenditures.
The chapter also includes information on how DNR establishes rates for private vendors. For one set of rates, DNR appears to be doing a good job of limiting rate increases. A lack of data, however, prevented us from reaching a conclusion for all rates.
The chapter provides detail on the major items (people, equipment, etc.) that DNR has paid for as it has suppressed fires over the past ten years. The chapter concludes with a brief review of some of the major issues—such as more houses being built in or near forestlands—that are affecting the way fires are fought.
RELATIONSHIP BETWEEN ACRES BURNED AND TOTAL EXPENDITURES When analyzing fire suppression spending, JLARC first looked at whether a connection existed between total expenditures and total acres burned. DNR data showed a strong connection between expenditures and the number of acres burned in forest fires since 1980. This means that policymakers can expect spending to rise as more acres burn. A major driver in year-to-year changes in expenditures is year-to-year changes in the number of acres burning.4
DNR’S RESPONSE WHEN A FIRE IS REPORTED Those that fight wildland fires believe that the best way to control costs is to keep fires small. Thus, DNR is paying considerable attention to the dispatch process where the first decisions are made on the level of resources to commit to a fire. Although there are a variety of ways DNR learns about a fire, Exhibit 10 on the following page shows what typically happens when a fire is reported.
4 After controlling for inflation and using a standard test for correlation, we found a correlation coefficient of .62. A recent U.S. Forest Service study also found a correlation between federal expenditures and acres burned. (Calkin, Gebert, Jones, and Neilson, 2005, Forest Service Large Fire Area Burned and Suppression Expenditure Trends, 1970-2002.)
17

DNR Fire Suppression Study
Exhibit 10 – How DNR Responds to a Fire
If the fire becomes complex and goes into extended attack, dispatch notifies the regional managers of the agencies responsible for suppressing the fire. The region management staff becomes more involved in directing suppression efforts.
If fire is a wildland fire, 911 notifies DNR dispatch.
If fire is a structure fire, the local fire district responds. DNR does not respond unless fire threatens wildlands. Dispatch sends the closest forces available.
Before the fire season begins, DNR creates preplanned dispatch cards that identify which resources they will use depending on reported fire location and conditions.
The first fire engine to arrive at the fire assesses suppression needs based on a formal checklist, and notifies dispatch of their needs.
If the fire is not very complex and can be fought during initial attack, the engine puts out the fire with resources that are already present or a limited number of additional resources.
Someone sees smoke and calls 911.
Each of the six DNR regions and headquarters in Olympia has a dispatch center that responds to reports of wildfires. Each dispatch office then determines the approximate location and size of a fire and then sends fire fighters, engines, and other suppression resources to assess and fight the fire.
HOW DNR DETERMINES WHICH RESOURCES TO USE To fight fires, DNR uses its own people and equipment, the resources of federal and local wildfire suppression agencies, and contractors. Exhibit 11 on the following page illustrates the preferential order DNR uses to determine whose resources to use.
During the initial attack on a fire, DNR uses the fire fighters and suppression equipment that are closest to the fire, regardless of who owns those resources. They do this because they want to suppress the fire as quickly as possible to keep it small.
If the fire grows larger and more complicated requiring extended attack, DNR tries to use resources with which DNR—or one of the other federal or local wildfire suppression agencies—has a pre-season agreement. Such agreements set the contractor’s rate before the fire season begins.
18

DNR Fire Suppression Study
Exhibit 11 – Resources DNR Uses During Initial and Extended Attacks
Initi
al A
ttack
Exte
nded
Atta
ck
For all phases of attack: DNR’s resources Local fire districts Federal agency partners
For extended attack, local resources are replaced by: 1. Statewide DNR resources 2. Pacific Northwest
interagency vendor agreements
3. Vendors with pre-season agreements with DNR
4. Emergency hires
Local resources are used for initial attack:
1. Vendors with pre-season agreements with DNR
2. Emergency hires
When a fire grows more complicated, the fire managers may send home some of the local forces that had helped during initial attack in order to free them to respond to other initial attack assignments. The fire managers then use the contractors with pre-season agreements.
DNR Resources On all fires, DNR’s preferred option is to use its own suppression resources. During the 2004 fire season, these resources included the following:
People Aircraft and Engines Incident Support Structures
• About 700 DNR employees, most of whom work in non-fire programs but help as requested
• 350 to 400 seasonal employees hired for fire suppression
• 50-52 crews composed of 10 prison inmates
• 1 air-tanker under exclusive contract with DNR (meaning that DNR controls its use)
• 8 helicopters • 1 fixed-wing aircraft • 109 engines
• 5 kitchens • 5 local area network
(LAN) vans • 3 mobile command
posts • 1 shower unit
19

DNR Fire Suppression Study
Paying Federal Agency Partners and Local Fire Districts When DNR reimburses another agency for its assistance, it reimburses federal and career fire district employees at their normal pay rate. In some instances, DNR pays local fire districts “back fill”—the district’s cost to employ replacements because its employees were fighting DNR fires. DNR pays volunteer fire fighters at the rate established in the Interagency Wage and Equipment schedule, described below.
RATES FOR PRIVATE CONTRACTORS Since DNR uses private-sector vendors in its suppression efforts—everything from people to bulldozers—we focused on how they set rates for such services. We looked at how DNR sets these rates in advance, how these rates have changed over time, and how the rates compare to what is actually paid.
Setting Rates for Private Contractors DNR sets rates through pre-season agreements with specific vendors and through a rate schedule that it uses for most other vendors. DNR sets and reviews these rates in an attempt to reduce the amount of individually negotiated payments to vendors (a concern in emergency situations).
Pre-season agreements
DNR uses two types of pre-season agreements.
1) It works with Oregon and the federal land management agencies to create Pacific Northwest interagency vendor agreements for engines, tenders (water transportation vehicles), and crews.
2) DNR also enters into its own agreements for all aircraft used on DNR fires, and for many incident support structures. DNR regions also may develop pre-season agreements for suppression equipment. As shown in Exhibit 11, these pre-season agreements are used during both initial and extended attack.
A Rate Schedule When No Pre-season Agreement Exists
DNR, along with Oregon and the federal land management agencies, have created an Interagency Wage and Equipment Rate Schedule that they use for emergency hires (vendors that do not have a pre-season agreement with DNR or another agency). DNR pays vendors these rates unless vendors provide a specialized service and are not willing to work for the established rate. As shown in Exhibit 11, this rate schedule is primarily used during the initial attack phase of a fire.
Some Vendor Rates Remain Constant We reviewed the trends in rates set in these agreements and schedules to determine whether or not increases in vendor rates may be driving overall expenditure increases.
20

DNR Fire Suppression Study
After controlling for inflation, we found that the rates for major items in the Interagency Wage and Equipment Rate Schedule have remained constant over the last ten years. Exhibit 12 below illustrates the hourly rate trend for selected suppression resources: bulldozers, engines, tenders (water transportation trucks), and contract firefighters. Most have stayed fairly constant, with the hourly rate for bulldozers actually going down. Based on our analysis, DNR appears to be doing a good job limiting increases in Interagency Wage and Equipment Rates.5
We were not able to compare the pre-season agreement rate trends (DNR’s or interagency) as these rates vary by vendor. Not being able to analyze this trend data is especially significant since these resources are often used on extended attack fires. Such extended attack fires tend to have the highest total expenditure. We do know that these rates are generally higher than the Interagency Wage and Equipment Rates.
Exhibit 12 – Interagency Wage and Equipment Rates Have Remained Steady Over the Past Ten Years
Source: JLARC analysis of Interagency Wage and Equipment Rates for Wildfire Resources, 1994-2004. Analysis has controlled for inflation.
$0
$20
$40
$60
$80
$100
$120
1994 1996 1998 2000 2002 2004
Hou
rly R
ates
Contract Firefighter
Engine
Water Tender
Bulldozer
Rates vs. Actuals It is difficult to analyze the difference between published rates and what is actually paid. Through our detailed analysis of DNR’s historic accounting records (electronic), we are able to determine how much—in total—a vendor is paid. But there is no information in the electronic financial systems about how many units of service are provided by vendors. Such information is essential when reviewing expenditure trends, as controlling expenditures is accomplished by controlling rates and controlling the number of units purchased. 5 Equipment rates are single shift rates and do not include an operator. The rates in Exhibit 12 are for a power class 4 bulldozer, a 4 x 4 type 6 engine, a type 2 tender with a minimum of a 2500 gallon tank, and a firefighter 1. Generally, these rates are for initial attack only.
21

DNR Fire Suppression Study
Also, nothing in the financial systems ensures that published rates are followed. There is not an automatic linkage between the amounts to be paid to a vendor with a rate schedule. Such a linkage or “edit” can be used in financial systems to ensure that published rates are followed.
EXPENDITURE TRENDS 1995 - 2004 As part of our analysis of the cost of suppressing fires, we reviewed major expenditure trends over the past ten fiscal years. DNR provided some of this information directly, while some is based on JLARC’s analysis of electronic accounting records. After we carefully analyzed this data, we found that no one item stands out as a single cause for increased expenditures. The information is however helpful in illustrating the resources DNR uses to suppress fires and to help understand the operations of the program.
DNR Employees, Equipment, and Vendor Services Expenditures for suppressing fires can be grouped in three primary categories. Exhibit 13 below illustrates the split of the $167 million in fire suppression expenditures over the past ten fiscal years: Exhibit 13 – Fire Suppression Expenditures Fall into Two
Major Areas
Source: JLARC analysis of DNR year-end accounting reports, 1995 - 2004.
Other, $4,955,9773%
Salaries, Wages, Overtime, and
Benefits, $75,491,749
45%
Goods and Services,
$86,619,809 52%
From FY 95 through FY 04, a total of $167 million in expenditures for fire suppression
• 52 percent of expenditures went to Goods and Services: the equipment DNR employees use to suppress fires, the goods they use (groceries, axes, etc.) and the costs associated with all others assisting in suppressing fires (everything from rural fire districts, inmate crews, and private vendors).
• 45 percent of expenditures went to DNR employees: their salaries, wages, overtime, and benefits.
• 3 percent of expenditures went to all other costs: everything from travel to DNR charges for its overhead.
22

DNR Fire Suppression Study
Goods and Services There are a number of types of expenditures that fall into the general goods and services category. Exhibit 14 below illustrates some of the major types of expenditures over the past ten fiscal years. The single largest expenditure is for outside equipment which includes a variety of items, such as trucks, engines, and bulldozers.
Exhibit 14 – Goods and Services Expenditures, 1995 - 2004
Outside Equipment18%Contractual Services
17%
DNR Heavy Equpment3%
Aircraft and Helicopters15%
Rural Fire Districts4%
Groceries6%
Telecommunications4%
Approximately 60 Other Individual Expenditure
Areas33%
From Fiscal Year 1995 through Fiscal Year 2004, a total of $86.6 million in expenditures for goods and services
Source: JLARC analysis of DNR data.
Inmate crews are used in suppressing fires and are part of these goods and services expenditures. DNR has only recently begun to maintain data on the extent of their use of inmate crews and the total costs of using the inmate crews. Thus, no trend data is available to analyze prison inmate crew use over time.
Another useful view of this information is whether goods and services (such as equipment or helicopters) are owned by DNR or by vendors. As Exhibit 15 on the next page indicates, 81 percent of the Goods and Services expenditures during the ten-year period of FY 1995 through FY 2004 went to purchases from private vendors
DNR EMPLOYEES The majority of expenditures related to DNR personnel go toward paying for overtime and callback. (When an employee is on callback they may be required to return to work at an unscheduled time.) Exhibit 16 on the following page illustrates that during this same ten-year period, 53 percent of expenditures related to DNR personnel was used to pay for overtime and callback.
23

DNR Fire Suppression Study
Exhibit 15 – Eighty-One Percent Of Goods And Services Expenditures For Outside Vendors
Provided Through DNR, Such as DNR Helicopters
19%
Outside Vendors or Organizations
81%
From Fiscal Year 1995 through Fiscal Year 2004, a total of $86.6 million in expenditures for Goods and Services
Source: JLARC analysis of DNR data.
DNR uses permanent staff, career seasonal employees, temporary staff, and casual hires to suppress fires, tracking their use by measuring the amount of staff months expended suppressing fires.
Exhibit 16 – Personnel Expenditures Are Mostly for Overtime/Callback
Benefits14%
Overtime and Call Back
53%
Salaries and Wages
33% From FY 95 through FY 04, a total of $75.5 million in expenditures for DNR personnel
Source: JLARC analysis of DNR year-end accounting reports.
24

DNR Fire Suppression Study
Exhibit 17 below illustrates that over the ten-year period analyzed, the split has been roughly even between permanent and non-permanent staff.
Exhibit 17 – Permanent and Seasonal Staffing Costs Are About Even
Permanent49%
SeasonalTemporary
Casual51%
Source: JLARC analysis of DNR data.
HELICOPTERS During the course of our analysis, we analyzed the growth and use of DNR’s helicopter fleet. Helicopters help to fight fires by delivering huge amounts of water—300 gallons or more—directly to the fire and by reaching areas otherwise difficult to access by road or on foot.
DNR leases helicopters for essentially no cost through the Federal Excess Personal Property program. DNR however spends about $250,000 each to refurbish and ready the helicopters to fight fires. Over the past two years, DNR has more than doubled the size of its helicopter fleet, from four to nine. DNR reported total helicopter-related expenditures in Fiscal Year 2004 of $2.2 million.
The growth of the helicopter fleet—and associated personnel and equipment—is not readily visible in the budgeting process. DNR captures the costs associated with running the helicopters (people, gas, supplies, etc.) in its Equipment Fund. DNR has funded substantial refurbishment costs by charging the suppression budget more than it actually costs to run the helicopter to build a surplus, and using the surplus to pay for the refurbishment. DNR charges the suppression budget $2,500 per hour to operate the helicopters, including fuel, fire suppression chemicals, and personnel. DNR’s methodology for determining its hourly rate, however, is unclear and should be strengthened.
The expansion of DNR’s helicopter program (more than doubling the fleet) has taken place without legislative oversight.
25

DNR Fire Suppression Study
We are also concerned with future replacement costs. There are indications that the federal government will no longer be making helicopters available through Federal Excess Personal Property, thus making future replacements very expensive (at least $7 million each).
DNR’s firefighters—both headquarters and field based—told us that helicopters, while expensive, can be a highly effective tool. They spoke of helicopters’ usefulness in quickly accessing a remote fire and keeping it contained. Unfortunately, no data or analysis exists to support or detract from this belief in effectiveness.
Exhibit 18 below illustrates how the total charges to the suppression budget related to DNR helicopters have increased over the last ten years.
Exhibit 18 – Helicopter Expenditures Have Increased
$-
$500,000
$1,000,000
$1,500,000
$2,000,000
$2,500,000
1995 1996 1997 1998 1999 2000 2001 2002 2003 2004
Fiscal Year
Expe
nditu
res
Trend line
Source: JLARC analysis of DNR data.
OTHER MAJOR FACTORS INFLUENCING THE COST OF FIGHTING WILDLAND FIRES DNR staff and our review of the literature on fire suppression costs revealed four reasons for growing fire expenditures and increases in the number of acres burned by fires. We analyzed the literature on these subjects and spoke with many DNR field-based staff about their possible impact on the cost of fighting fires. Exhibit 19 on the following page describes how these issues might affect the cost of fighting wildland fires. Although we reviewed these issues in depth, we cannot quantify how much each factor has affected suppression costs.
26

DNR Fire Suppression Study
Exhibit 19 – Major Issues Impacting Suppression Costs
ISSUE HOW THIS INFLUENCES COSTS Increased Precautions to Ensure Firefighter Safety
DNR and U.S. Forest Service employees told us that fire managers have become increasingly cautious about putting firefighters in situations that may be dangerous. Rather than put someone on the ground fighting a fire, they may use aircraft, which is a high-cost suppression resource.
Forest Health Forest health is especially an issue on the east side of the state where many forestlands are overcrowded and/or bug-infested. This may lead to more fires, and these fires may be hotter and more severe.
Drought Another natural factor leading to the growing number of fires is the weather. Whether the trend is a short-term drought or long-term climate change, the literature on fire suppression agrees that the result is more fires that are more severe. Researchers expect more major fires in the future.
More Houses Near Forests: The Wildland/Urban Interface
Fighting wildfires becomes more complex as more people live in or near forests. DNR does not try to put out a structural fire, but does try to keep the structure from burning by adjusting its fire suppression strategies. (Chapter 2 describes this in greater detail.)
CONCLUSION Policymakers can expect expenditures to rise if more acres burn during a fire season. DNR has well-defined processes in place to respond to fires and to determine which resources it needs. It also has processes in place to set rates before the fire season begins. We were only able to compare one set of rates—the Interagency Wage and Equipment Rates—and found that when controlled for inflation, the costs for major items have remained constant. However, it is not possible to easily determine what rates DNR actually paid to vendors. JLARC also reviewed expenditure trends, but found that there is not a single cause for growing suppression expenditures, although helicopters are an area of concern.
27

DNR Fire Suppression Study
28

CHAPTER FIVE: DEVELOPING BUDGETS FOR FIRE SUPPRESSION OVERVIEW This chapter reviews the way Washington State develops its budget for fire suppression. We found that both the nature of fires and the current estimating process almost guarantee supplemental budgets. However, there may be methods for getting more accuracy in the budget process, such as dividing the budget into more focused components.
SUPPRESSION BUDGETS: GUESSING WHETHER LIGHTNING WILL STRIKE The Legislature directed JLARC to conduct this audit in part because of a $23.5 million supplemental budget request beyond the $8.4 million that had already been budgeted. This request by DNR was for costs largely already incurred. Such requests generally displease policymakers. The budgeting process is more generally based on the Legislature approving requests for spending and the service delivery it pays for prior to that spending taking place.
One of the problems with Fire Suppression Budgets is they rarely reflect what is likely to be the cost of suppressing fires: supplemental budget adjustments are almost guaranteed. This is primarily because of the unpredictability of a fire season. One lightning storm can make a fire season severe and expensive. One weather front with rain can significantly reduce a fire season’s severity and cost. Exhibit 20 below shows the wide variation between initial budgets and final expenditures over the last five years.
Exhibit 20 – Expenditures: Original Budget vs. Actual For All Fund Sources
Bud
get
Bud
get
Bud
get
Bud
get
Bud
get
Act
ual
Act
ual
Act
ual
Act
ual A
ctua
l
$0
$5,000,000
$10,000,000
$15,000,000
$20,000,000
$25,000,000
$30,000,000
$35,000,000
2000 2001 2002 2003 2004Fiscal Year
Exp
endi
ture
s
Source: JLARC analysis of DNR data.
29

DNR Fire Suppression Study
Currently, suppression budgets are based on an average of the last ten year’s expenditures (after eliminating the two highest and two lowest years of expenditures and controlling for inflation). This process needs to be revisited as these averages do not accurately predict final expenditures.
DNR has a considerable amount of historic information on the number of fires it fights and the severity of those fires (acres burned, how the fire was managed, timber damaged, etc.) They also have access to information on the actual costs of fires (per fire). Historically, DNR has not linked these two data-sets.
As part of this audit, JLARC did, for the first time, match these data-sets in an attempt to determine if there are ways of making the budget process more accurate. Significantly, DNR also recently developed the ability to make these matches, beginning with calendar year 2004 fire information.
Analysis of this data supports what everyone who fights fires already knows: there is tremendous year-to-year variation. We sought to determine if there are areas of expenditure that are predictable and help produce more accurate budget forecasts. The general answer is no: most everything is a moving target. But, there is somewhat more certainty in expenditures for suppressing small fires as compared to expenditures for large fires.
Budgeting Option: Dividing the Suppression Budget into Smaller Components Although the data we used to make this determination is less than exact, we do know that large fires have great variation in total cost. One large fire can cost millions of dollars. Thus a few large fires can play havoc with the budget. Exhibit 21 on the following page illustrates how total expenditures for fires under 100 acres are less erratic than expenditures for fires 100 acres and more.6
As part of the study, we looked at other states to see how they are structured and how they fund their suppression budgets. We found that California and Oregon have divided their suppression budgets into multiple parts. For example, Oregon has divided its suppression budget into three components: initial attack fires, large (or emergency) fires, and catastrophic fires.
Washington could consider a similar method of breaking the total suppression budget into more manageable components, such as by size (such as greater or less than 100 acres), by total expected cost, or by the five fire “types,” which reflect fire complexity. Another option is to split the budget between fires that only require initial attack and those that require extended attack.
6 Because of data set matching issues, these numbers cannot be used to set budget levels. They reflect only certain fires, do not include expenditures that could not be matched against a coded fire number, and exclude Fiscal Year 2002 because of coding problems in that year.
30

DNR Fire Suppression Study
Exhibit 21 – Expenditures by the Number of Acres Burned
$0
$2,000,000
$4,000,000
$6,000,000
$8,000,000
$10,000,000
$12,000,000
$14,000,000
$16,000,000
$18,000,000
$20,000,000
89 90 91 92 93 94 95 96 97 98 99 00 01 03
Exp
endi
ture
s
Fiscal Year Source: JLARC analysis of DNR data.
Fires of at least 100 acres
Fires less than 100 acres
Such a disaggregation, or splitting, of the budget would help policymakers understand what drives expenditures in fire suppression. This information is needed in an area of government activity that is becoming more complex and more costly with each year.
A SECOND BUDGETING ISSUE: THE COST OF BEING PREPARED Fire fighting in DNR is budgeted for in two ways. One is the Fire Suppression budget, which pays for suppression costs at specific fires. DNR also receives funding for its Pre-Suppression activities. Such pre-suppression includes:
• Activities related to what DNR calls Fire Control, or being prepared to suppress fires (sometimes referred to as the costs associated with being ready for the “fire bell to ring”).
• Activities related to what DNR calls Fire Regulation and Protection Assistance or preventing fires from taking place (such as fuels management, education, and mitigation efforts).
There is a very direct connection between being ready to fight fires (pre-suppression) and the ability to fight those fires (suppression). There may also be a connection between various mitigation and education efforts (prevention) and suppression costs. But because of the way policymakers review budgets, this connection may not be obvious.
Simply put, as a state, we are understating the cost of suppressing fires because we do not include all the costs associated with being ready to fight those fires. And DNR needs to do a better job of explaining to the Legislature the connection between prevention and fires—how prevention expenditures impact the need for suppression expenditures.
31

DNR Fire Suppression Study
Another way to look at this is viewing Fire Control (readiness) costs as somewhat “fixed.” Regardless of whether or not there are any fires, the state still must pay the costs of the crews, trucks, and equipment being ready to fight fires, just as a city maintains a fire department. This becomes more important as the state becomes increasingly involved with the federal government. Without including Fire Control costs, we may be understating the cost of the provision of those services when we “bill” the federal government for our participation in federal or joint-jurisdiction fires.
CONCLUSION The current budgeting process almost always results in supplemental budget requests because the severity of the fire season is unpredictable. By dividing the suppression budget between small and large fires, budgets may become more predictable. Another important step in improving budget information for policymakers is to consider the suppression and the pre-suppression budgets together. Such a combined view can help in understanding relationships between the cost of being ready and fighting fires as well as the relationship between prevention activities and fires.
32

CHAPTER SIX: CONCLUSIONS AND RECOMMENDATIONS ― BETTER INFORMATION IS REQUIRED TO UNDERSTAND FIRE SUPPRESSION AND CONTROL COSTS
DNR is taking steps to control costs. At headquarters, DNR has dedicated staff to cost containment. In our field work, we observed a great deal of concern on the part of DNR employees over the cost of suppressing fires. In other words, DNR understands cost is an issue and is seeking strategies to control costs.
But as we conducted our audit, we were frustrated by the lack of fundamental management information on costs and benefits. Without data, it is not possible to know whether the cost containment efforts DNR is implementing are effective. DNR’s sole performance target for fire suppression is to keep 95 percent of fires below ten acres. This is based on the understanding that keeping fires small is the best way to control fire costs: small fires can be contained without spending a lot of money, but big fires are expensive.
To truly understand effectiveness, some notion of the relationship between the amount of money spent and the number of fires less than ten acres must be available. Policymakers would want to know the effect of increases or decreases in funding in meeting this performance target. No such information exists.
While our analysis indicates that this lack of information is a problem in other states and in the federal government as well, we believe DNR can take steps to improve the information policymakers need to make informed budget decisions. Such information is essential for the Legislature to gain an understanding of whether DNR is spending too much, too little, or the right amount to control wildland fires.
Thus, our recommendations focus on improving the information available to decision makers: both those who make policy (legislators) and those that must fight fires. With such improvements, all parties will have a better understanding of the costs of their decisions.
FIRST AREA FOR IMPROVEMENT: DNR’S FIRE STATISTICS Most of the non-financial information that DNR publishes—total number of fires, acres burned, and the number of acres protected—and the information presented in this report shows only part of DNR’s total fire suppression effort. DNR’s published fire statistics intentionally exclude “miscellaneous fires.” These include out-of-state fires where DNR assisted, fires that began in areas protected by other agencies (such as national forests) and were expected to remain on that land. They also include DNR fires where the Federal Emergency Management Agency is involved.
33

DNR Fire Suppression Study
Exhibit 22 below illustrates that, on average, over the past three years, 54 percent of total expenditures went to efforts to suppress these “miscellaneous fires.” Based on our analysis of a lengthier data-set, it appears that the percent of total expenditures going toward such fires is increasing.
False Alarms1%
Regular Classified Fires45%
"Miscellaneous" Fires54%
Exhibit 22 – Majority of Expenditures Spent on Miscellaneous Fires Source: JLARC analysis of DNR fire statistics and expenditure data. Our concern with the traditional presentation of DNR’s suppression efforts, excluding part or all of these miscellaneous fires, centers on three areas:
1. By reporting only fires and acres burned on DNR protected land, DNR is significantly understating yearly suppression efforts.
2. Although we were able to confirm for a sample of fires that DNR had been reimbursed for their efforts in these “miscellaneous fires,” it was hard to do so. DNR’s records are paper, as their electronic financial systems do not track, by fire, payment source. As such, it is difficult to provide oversight of the payment process, to make certain that DNR’s suppression efforts are being reimbursed.
3. Given the scope of this “miscellaneous” fire effort, it appears that a substantial amount of DNR’s resources go toward suppressing these fires. This will likely impact DNR’s core mission: fighting fires on DNR protected land.
DNR shares these concerns and is looking for ways of better quantifying the impact of these fires on its infrastructure.
Appendix 6 contains an annual report for Arizona as an example of how another state presents information on all the fires it fights. In this report, detail is provided on not just fires on state jurisdiction, but also federal jurisdiction and the costs associated with pre-positioning of resources.
34

DNR Fire Suppression Study
Recommendation 1
As it reports its fire suppression efforts, DNR should include information on all fires. While this can be included in separate categories to maintain trend information, at a minimum it should include specific fires, expenditures, and expenditure recoveries on DNR protected land, federal, and out-of-state land.
Legislation Required: None Fiscal Impact: Minimal Reporting Date: April 2006
SECOND AREA FOR IMPROVEMENT: MEETING CURRENT REQUIREMENT FOR COST COMPARISONS In our review of statute and of the costs of fighting fires, we found that DNR is not complying with the requirement to compare their costs to those of private vendors on a yearly basis. Such a comparison—and the process of developing the comparison—will assist DNR and the Legislature in better understanding the cost of fighting fires. Recommendation 2
As required by statute, on June 1st of every year, DNR should prepare a unit cost analysis, comparing the costs of the private-to-public resources most often used in suppressing fires. At a minimum this should include the items currently called out in statute, as well as engines and crews, helicopters, and bulldozers.
Legislation Required: None Fiscal Impact: Minimal Reporting Date: June 2006
THIRD AREA FOR IMPROVEMENT: FINANCIAL INFORMATION As we conducted our analysis, we were frustrated with the lack of financial information system data on both the unit cost of services purchased from private vendors and the number of units actually purchased.
This creates two problems when reviewing costs. First, we were encouraged with DNR’s efforts at setting rates prior to needing a service as this is fundamental to cost control. But, it is very cumbersome to then determine if DNR actually adhered to those rates.
Second, it is very difficult to understand the total effort expended to suppress a fire. Information, such as the number of engines, the number of people, or the number of aerial tanker drops is not readily accessible. Policymakers can use such information to better understand what is needed to efficiently and effectively suppress fires.
Related to this is the need to collect better information on who has shared in the costs of paying to fight a fire. DNR is actively engaged with its partners to ensure both a fast response to fires—to contain them as quickly as possible—and to eliminate duplications in service. In particular, DNR’s relationship with the federal government is becoming more important each year.
35

DNR Fire Suppression Study
However, without ready access to information about sharing costs to fight individual fires, it is difficult to monitor these partnerships to ensure each party is paying its fair share.
Recommendation 3
DNR should prepare a plan for adapting its financial systems to include information on unit costs and units used. The plan should identify how such information can be collected at the individual fire level and how system changes will include a linkage between established rates and the amounts paid to vendors. The plan also should consider methods to track revenues, such as federal reimbursements and recoveries, at the individual fire level. DNR also should review ways to link financial data at the fire level to fire statistics. The plan should include costs and an implementation schedule.
Legislation Required: None Fiscal Impact: $10,000 – $20,000 Reporting Date: January 2006
FOURTH AREA FOR IMPROVEMENT: THE BUDGET PROCESS The nature of fires and the way DNR develops fire suppression budgets almost guarantee substantial supplemental budget revisions. And as the budget process currently works, legislators do not have information about the relationship between the money spent on pre-suppression efforts and the eventual total cost of suppressing fires. Simple changes can provide policymakers with both a more accurate forecast of costs and a more complete picture of those costs.
Recommendation 4
DNR should review options to improve its current approach to developing requests for suppression funding. DNR should consider classifications such as fire size or management complexity as a method of establishing more accuracy in budgets.
Legislation Required: None Fiscal Impact: Minimal Reporting Date: January 2006
Recommendation 5
The Legislature should consider reviewing DNR fire suppression and pre-suppression budgets together. This would include requiring that DNR provide additional detail on the cost of being prepared to fight fires and efforts to prevent fires and how such efforts impact the need for suppression funding.
Legislation Required: None Fiscal Impact: None Reporting Date: January 2006
36

DNR Fire Suppression Study
FIFTH AREA FOR IMPROVEMENT: AGREEMENTS WITH FIRE PROTECTION DISTRICTS As we conducted our field visits, we learned of the importance of DNR’s relationships with local fire protection districts. These districts are often the closest forces available to quickly respond to wildland fires, but they can become quickly overwhelmed with such fires. As more houses are built in or near forests, districts are often responsible for providing protection to houses on land where DNR is responsible for providing forest fire protection. This complicates determining who is responsible for suppressing the wildland fires and who is responsible for paying for that suppression.
Some DNR regions are moving away from agreements that obligate DNR to pay fire districts for district’s efforts on district land, but this is not consistent across the state. We are concerned that taxpayers may be paying twice for the same service. Taxpayers pay local fire districts through their property taxes, and some pay again with their DNR Forest Fire Protection Assessment.
Recommendation 6
DNR should report to the Legislature on its efforts at standardizing its agreements with fire districts. The report should include identification of the major agreements in place and the number and location of districts under each agreement. The report should identify the potential costs and benefits of moving towards a consistent agreement used by all regions.
Legislation Required: None Fiscal Impact: Minimal Reporting Date: January 2006
SIXTH AREA FOR IMPROVEMENT: UNDERSTANDING HELICOPTER COSTS DNR considers helicopters to be an important fire fighting tool. But at $2500 per hour, they are an expensive resource. There has been little legislative oversight of the expansion of the helicopter fleet, either in terms of the costs of the program or its effectiveness.
In addition, DNR’s current methodology for determining the hourly rate develops a rate structure that does not reflect the true cost of running the program. Changes in the way the program is budgeted and in the way rates are developed will help policymakers better understand the true cost of operating this expensive resource.
Recommendation 7
DNR should treat helicopters in the same manner as other DNR-operated suppression tools. Specifically, DNR employees and costs associated with the helicopter program should be included in the pre-suppression program area budget. Surpluses should be transferred back to the general fund, unless they are used for replacement costs appropriate to the equipment fund.
Legislation Required: None Fiscal Impact: Minimal Reporting Date: June 2006
37

DNR Fire Suppression Study
Recommendation 8
With the assistance of a consultant experienced in governmental rate analysis, DNR should develop a prospective rate methodology for the helicopter program. Such a rate should accurately reflect the costs of the helicopter program, and should include at least the following components:
• Amortization of refurbishment costs and/or life-cycle replacement costs;
• Non-personnel related operating, maintenance, and repair costs;
• Personnel related operating, maintenance, and repair costs; and
• Any other major costs associated with the helicopter program.
As part of the analysis of costs, the consultant should review relevant federal regulations to determine how pre-suppression costs might be reflected in the hourly rate charged to the federal government when DNR resources are used on joint jurisdiction or solely federal fires.
Legislation Required: None Fiscal Impact: $15,000 – $25,000 Reporting Date: June 2006
AGENCY RESPONSES We have shared the report with the Department of Natural Resources (DNR) and the Office of Financial Management (OFM) and provided them an opportunity to submit written comments. Their written responses are included as Appendix 2. JLARC’s comments on these agency responses follow as Appendix 2A.
ACKNOWLEDGEMENTS We appreciate the assistance provided by DNR staff in conducting this study.
Ann Daley Interim Legislative Auditor
On June 22, 2005, this report was approved for distribution by the Joint Legislative Audit and Review Committee.
Representative Ross Hunter Chair
38

APPENDIX 1 – SCOPE AND OBJECTIVES
Performance Audit of Department of Natural Resources
Wildfire Suppression Program
PROPOSED
SCOPE AND OBJECTIVES
JUNE 16, 2004
STATE OF WASHINGTON JOINT LEGISLATIVE AUDIT AND REVIEW COMMITTEE
STUDY TEAM
John Woolley Lisa Jeremiah
LEGISLATIVE AUDITOR
CINDI YATES
Joint Legislative Audit & Review
Committee 506 16th Avenue SE
Olympia, WA 98501-2323 (360) 786-5171
(360) 786-5180 Fax
Website: http://jlarc.leg.wa.gov e-mail: [email protected]
Why A Performance Audit of Wildland Fire Suppression?In its 2004 Supplemental Operating Budget, the Legislature provided the Department of Natural Resources (DNR) with a $23.5 million state general-fund supplemental appropriation for the costs of fighting wildland fires for the 12 months of fiscal year 2004. It also provided $150,000 to JLARC to “evaluate the full range of causes for such large increases in fire suppression costs.”
Wildfires Legislatures across the western United States are becoming increasingly alarmed at the damage caused by wildfires and the cost of fighting them. While there is an emerging consensus on why wildfires are causing more damage than in the past—weather, forest health, and more people living in or near wildlands—there is less agreement on what we can do to reduce fire risk and cost. Although most of the approximately 900 Washington wildfires in FY 2004 remained small, major fires can cost local, state, and federal governments tens of millions of dollars to control. The 19 major fires of the 2003 fire season (map on following page) cost DNR almost $19 million to control, with an estimated cost to all parties of $114 million.
Study Scope As directed, JLARC will focus this study on wildfire suppression costs. We will analyze DNR’s compliance with legislative policies setting fire suppression priorities and DNR’s policies and procedures for fighting fires. We will also review the roles of local, state, and federal organizations in fighting fires and how costs are allocated among these organizations.
State Auditor’s Role The 2004 Legislature also appropriated $100,000 to the State Auditor’s Office (SAO) to review DNR’s fire suppression costs. SAO will analyze payroll documents and invoices to determine if controls are in place to ensure that only appropriate costs are charged to the emergency fire suppression budget. SAO is directed to coordinate its study with JLARC’s performance audit. JLARC in turn is directed to include SAO’s findings and recommendations related to costs in our performance audit.
39

Fire Season 2003 Major Fires
STUDY OBJECTIVES
As directed in the 2004 Supplemental Operating Budget, JLARC’s audit will include: (1) A review of how current fire suppression practices comply with the policies and intent of
Chapter 76.04 RCW—Forest Protection.
(2) An examination of the factors contributing to recent wildfire suppression cost increases, including:
• The use of high-cost equipment and services;
• Changes in the level of reimbursement for contractors and employees;
• Changes in the use of permanent agency employees for fire suppression compared to the use of temporary employees, inmate labor, and contractors; and
• Changes in other significant costs.
(3) An analysis of the responsibilities of various state agencies, local fire districts, and federal agencies and the allocation of costs among agencies.
(4) An analysis of how DNR determines the proportion of fire suppression costs charged to private parties and the Landowner Forest Fire Contingency Account.
(5) Inclusion of any findings and recommendations from the State Auditor’s Office related to fire suppression costs.
Timeframe for the Study
JLARC’s final report is due by June 30, 2005.
JLARC Staff Contact for the Study
John Woolley (360) 786-5184 [email protected] Lisa Jeremiah (360) 786-5293 [email protected]
40

APPENDIX 2 – AGENCY RESPONSES
• Department of Natural Resources
• Office of Financial Management
JLARC’s comments on agency responses follow as Appendix 2A.
41

DNR Fire Suppression Study
42


APPENDIX 2A – JLARC’S COMMENTS ON AGENCY RESPONSES We are pleased that OFM and DNR concur or partially concur with the study’s eight recommendations. A number of areas of DNR’s concurrences or partial concurrences require some clarification on our part. Recommendation 4: This recommendation suggests that DNR look at ways of dividing its suppression budget into more components—such as small fires and large fires—in an effort to establish more accuracy in fire suppression budget estimates. We are not suggesting that DNR examine alternative ways to fund suppression efforts. Recommendation 5: (a recommendation to the Legislature): With this recommendation we are suggesting that the Legislature review pre-suppression and suppression budgets together so that they can better understand the relationship between the two efforts. For instance, fire prevention efforts are funded in the pre-suppression budget. The Legislature would want to know the impact of changes in funding levels for such prevention efforts on the need for suppression funding. This recommendation does not suggest changing how pre-suppression is funded. Recommendation 7: With its partial concurrence, DNR mentions the need to maintain a contingency reserve in the equipment fund to pay for unexpected equipment expenses, such as requirements for compliance with mandatory federal aviation directives. Here, DNR should confer with the State Auditor, OFM, and legislative fiscal committee staff to determine if such a reserve is considered appropriate. Recommendation 8: This recommendation suggests that DNR hire a consultant to develop a prospective rate methodology for costs associated with its fire suppression helicopters. DNR concurs with this recommendation, provided that funding is made available to conduct the analysis. We estimate a cost range of $15,000 to $25,000 for this study. It is our understanding that such an analysis is consistent with the $250,000 in funding provided to DNR in the 2005-2007 Biennial Budget for improvements in its fire related financial and performance management systems.
49

DNR Fire Suppression Study
50

APPENDIX 3 – STATE AUDITOR’S REVIEW OF INTERNAL CONTROLS AND COMPLIANCE
Department of Natural Resources Fire Suppression Study
Review of Internal Controls and Compliance State Auditor’s Office
June 22, 2005 Objectives and Scope The 2004 Legislature directed the State Auditor’s Office to review the payroll and vendor costs of fire suppression at the Department of Natural Resources. Our objectives were to:
• Determine if controls are in place to help ensure that only appropriate costs are charged to the fire suppression program.
• Determine if costs charged were allowable.
We performed a preliminary analysis of the combined $48,455,682 charged during fiscal years 2003 and 2004 and found approximately 47 percent was for payroll and employee benefits and another 49 percent was for goods and services (See Schedule A for further details.). We found most of the expenditures were made by headquarters in Olympia and by four regional offices: Northeast, Southeast, Pacific Cascade, and South Puget Sound. Therefore, we focused our work on payroll and goods and services transactions processed during fiscal years 2003 and 2004 at headquarters and the four regional offices. Payroll We reviewed internal controls over employee payroll processing at all five locations and found them to be adequate to help ensure only appropriate emergency fire suppression costs are charged to the program budget. We identified monthly payroll costs charged to the emergency fire suppression program and reviewed payroll documents for 70 Department employees for one month each during the peak fire months of each year. We focused on overtime charges because they represented an average of 64 percent of total payroll costs. We concluded that payroll costs were appropriately charged to the emergency fire suppression program.
51

Other Non-Payroll Expenditures We reviewed internal controls over the Department’s processing of vendor payments and found them to be generally adequate to help ensure only appropriate emergency fire suppression program charges are paid with these funds. We identified potential areas for improvement at various offices and have described related recommendations at the end of this document. We also reviewed the allowability of costs as follows:
Payments to Vendors
Of the non-payroll charges, 72 percent were direct vendor payments, including the costs of employee travel. For the two-year period, we reviewed 392 of these payments, or 24 percent of the total, to determine whether the costs were proper for emergency fire suppression. Schedule B details the amounts and percentages we reviewed at the various offices. With a few minor exceptions, we found costs were appropriate, supported by adequate documentation, and calculated based on the correct rates. The cost exceptions we found were isolated errors, with no indication of systemic problems.
Journal Vouchers
Although it was not a requirement that we review this area, we noted a significant portion of non-payroll emergency fire suppression expenditures (28 percent) were actually processed by journal voucher, rather than by direct payment. These costs were primarily Department-owned equipment and supplies originally paid for out of an equipment fund and later allocated, through an accounting transfer, to the programs and funds using them. Because the amounts were significant, we reviewed a selection of these vouchers. We reviewed $571,500 of journal voucher charges for helicopter use and found the costs were allowable and accurate. We noted that pilot and supervisory approval signatures are not required on the supporting documentation and have addressed that issue in the recommendation section below. We also reviewed $56,565 of journal voucher charges for other types of equipment and supplies and found two errors:
• Although the charge was an allowable cost in nature, the Department could not locate the supporting documentation for one transaction of $8,395.
• An input error resulted in an overcharge of $25,620; the Department is correcting
the mistake.
These exceptions have prompted us to include a Department-wide review of journal voucher transactions during our fiscal year 2005 audit.
52

Recommendations We recommend the following for strengthening the Department’s controls related to emergency fire suppression:
• Ensure documentation of payments to external parties contains proper support, such as:
a. A note regarding the purpose of the expenditure and why it is being charged to fire suppression.
b. Sufficient documentation to enable a reviewer to know what was purchased.
c. Evidence of review of the invoiced rates with Pre-Season Agreements, where
applicable.
d. Approval from appropriate personnel.
• Perform periodic reviews of reimbursement requests from the Department of Corrections and the Department of Social and Health Services to ensure they are appropriate.
• Ensure rates charged for transportation are appropriate, based on whether the state travel
rate or the Department’s Wage and Equipment Handbook rates should be used.
• Establish a better system to document whether per diem meals and lodging were warranted for out-of-state fires.
• Establish a requirement for helicopter pilots to sign the form attesting to the hours flown
and a requirement for supervisory approvals on that form.
53

DNR Fire Suppression Study
SCHEDULE A -- FISCAL YEARS 2003 AND 2004 FIRE SUPPRESSION EXPENDITURES BY TYPE
% % Expenditure Description 2004 Amount Total 2003 Amount Total STATE CLASSIFIED $2,626,020.36 $2,469,502.90STATE EXEMPT 441,569.84 425,383.52STATE OTHER 505,575.71 736,544.21SICK LEAVE BUY-OUT - (637.56)TERMINAL LEAVE 4,168.91 4,724.58OVERTIME AND CALL-BACK 6,675,805.67 6,096,185.12 Total Salaries and Wages $10,253,140.49 40.9% $9,731,702.77 41.6% OLD AGE AND SURVIVORS INSURANCE 598,705.47 559,047.63RETIREMENT AND PENSIONS 112,448.37 96,047.22MEDICAL AID & INDUSTRIAL INSURANCE 179,935.00 140,169.69HEALTH, LIFE & DISABILITY INSURANCE 344,317.73 309,834.28UNEMPLOYMENT COMPENSATION 61,728.47 142,390.71HOSPITAL INSURANCE (MEDICARE) 140,018.84 131,043.30 Total Employee Benefits 1,437,153.88 5.7% 1,378,532.83 5.9% SUPPLIES AND MATERIALS 1,732,427.02 1,939,865.61COMMUNICATIONS 23,051.48 31,440.48UTILITIES 19,793.83 16,347.90RENTALS AND LEASES 7,690,242.55 6,011,567.70REPAIRS, ALTERATIONS & MAINTENANCE 27,672.38 1,200.98PRINTING AND REPRODUCTION 9,840.06 4,632.39SUBSCRIPTIONS 26.63 19.10NONCAPITALIZED ASSETS 598.92 5,755.78OTHER PURCHASED SERVICES 2,882,997.27 2,591,972.48VEHICLE MAINTENANCE & OPERATING CST 75,899.39 26,545.98OTHER GOODS AND SERVICES 28,561.38 572,629.13 Total Goods and Services 12,491,110.91 49.8% 11,201,977.53 47.9% IN-STATE SUBSISTENCE & LODGING 124,811.87 83,882.46IN-STATE AIR TRANSPORTATION 2,469.72 (4,219.00)PRIVATE AUTOMOBILE MILEAGE 28,019.82 33,933.37OTHER TRAVEL EXPENSES 7,219.10 16,150.11OUT-OF-STATE SUBSISTENCE & LODGING 10,146.77 76,781.27OUT-OF-STATE AIR TRANSPORTATION 5,400.00 21,748.00MOTOR POOL SERVICES 709,643.91 846,076.57 Total Travel 887,711.19 3.5% 1,074,352.78 4.6%
Total All Expenditures $ 25,069,116.47 $ 23,386,565.91
Source: Agency Financial Reporting System (AFRS) data.
54

DNR Fire Suppression Study
SCHEDULE B -- NON-PAYROLL COST TEST COVERAGE BY LOCATION
Fiscal Year 2004 Fiscal Year 2003
Total
Expenditure Amount % Total
Expenditure Amount % Location Amount Tested Tested Amount Tested Tested
Northeast Region $5,355,418.15 $1,438,525.50 27% $3,563,458.98 $373,036.31 10% Southeast Region 1,300,549.25 627,627.12 48% 1,181,687.06 575,039.95 49% Headquarters 1,256,003.71 637,600.23 51% 2,354,421.89 613,831.01 26% Pacific Cascade Region 729,687.97 599,936.17 82% 462,127.32 277,850.45 60% South Puget Sound Region 426,729.11 273,612.16 64% 179,804.36 110,896.56 62% Northwest Region 336,399.76 - - 184,519.22 - - Olympic Region 243,493.14 - - 456,909.23 - - Journal voucher* 3,730,541.01 336,114.42 9% 3,897,263.81 291,950.69 7% Total All Non-Payroll Costs $13,378,822.10 $3,913,415.60 29% $12,280,191.87 $2,242,604.97 18%
* DNR-owned equipment and supplies originally paid for out of an equipment fund, and then allocated to various programs/funds based on use. Source: Agency Financial Reporting System (AFRS) data.
55

DNR Fire Suppression Study
56

APPENDIX 4 – LOOKING AT COSTS PER ACRE The exhibit below illustrates another of the statistics DNR publishes annually, the increase in DNR’s suppression costs-per-acre protected. Dividing total suppression expenditures by the total number of acres that DNR protects (note, this is not acres burned), demonstrates that, while varying year-to-year, the cost-per-acre has been increasing.
This is important information, but a focus on cost per acre can be misleading. For instance, a very large fire can be expensive in terms of the total amount spent to suppress it. But on a cost-per-acre basis, it may seem inexpensive. Highly valuable timber can be lost in a fire. It may be deemed an “inexpensive” fire, but the analyses focuses only on expenditures and doesn’t consider the result of those expenditures (benefits). There is little analysis at the state or nation level of the relationship between costs and benefits.
Exhibit 23 – Cost-per-Acre Protected
$2.32
$0.40
$0.82
$0.49
$1.33
$0.88
$1.40
$3.70
$2.60
$2.18
$-
$0.50
$1.00
$1.50
$2.00
$2.50
$3.00
$3.50
$4.00
1995 1996 1997 1998 2000 2001 2002 2003 2004
Cos
t Per
Acr
e Pr
otec
ted
1999Fiscal Year
Source: DNR with JLARC use of implicit price deflator (2004 = 1) to control for inflation.
57

DNR Fire Suppression Study
58

APPENDIX 5 – WASHINGTON STATE STATUTE AND FIRE
During the course of this audit, we reviewed state statute to meet one of the directions of the budget proviso directing the study: DNR compliance with statute. In the body of the report, we focused on three areas: (1) DNR’s suppression priorities, (2) direction to aggressively fight fires, and (3) guidance on cost controls.
Below is more detail on RCW Chapter 76.04, provided to show some of the additional definitions and requirements contained in that chapter.
RCW Citation What is Defined? Summary of Wording
76.04.095 Cooperative Protection
If timber owners can establish a systematic means of providing forest protection in cooperation with the state, DNR may designate suitable areas to be cooperative districts and substitute cooperative services for state-provided services.
76.04.155 DNR Fire Fighters
DNR may employ enough people to extinguish or prevent the spreading of fire that may be in danger of damaging or destroying and timber or other property on department-protected lands.
76.04.005(4) DNR Protected Land
All lands subject to the forest protection assessment or covered under a cooperative agreement.
76.04.015 (2) DNR Role DNR to have direct charge of and supervision of all matters pertaining to the forest fire service of the state.
76.04.016 Duty to Prevent and Suppress Fires
DNR fire prevention and suppression is a duty owed to public in general and not to any individual person.
76.04.167(1a) Fire Danger Forest wild fires are a threat to public health and safety.
76.04.750 Fire is a Public Nuisance
Uncontrolled fire on or threatening forestland is a public nuisance by reason of its menace to life and property. Landowners must make reasonable efforts to suppress fire. If not suppressed by owner, DNR shall summarily suppress the fire.
76.04.610 Forest Fire Protection Assessment
If forest owner neglects or fails to provide adequate protection, DNR shall provide and annually impose a Forest Fire Protection Assessment. $14.50 per parcel plus 25 cents on each acre exceeding 50 acres.
59

DNR Fire Suppression Study
RCW Citation What is Defined? Summary of Wording
76.04.005(8) Forestland Unimproved land with enough trees to constitute a fire menace. Sagebrush and grass areas east of the Cascade Mountains included if adjacent to or intermingled with areas supporting tree growth. For protection purposes, forestland does not include structures.
76.04.175 (2) Natural Role of Fire
Legislature acknowledges natural role of fire in forest ecosystems; fire under controlled conditions can be used to maintain healthy forests and eliminating sources of fuel.
76.04.600 Owner Responsibility
Every owner of forestland shall furnish adequate protection against the spread of fire.
76.04.005(12) Participating Landowner
Owner of forestland subject to the forest fire protection assessment.
76.04.167(2) Priorities Second only to saving lives, in suppressing fires, DNR’s mission is protecting forest resources and suppressing forest wild fires.
76.04.015(4)(b) Rules DNR may adopt rules for prevention, control, and suppression of forest fires.
76.04.167 (2) Rural Fire Districts
A primary mission of rural fire districts and municipal fire departments is protecting improved property and suppressing structural fires.
76.04.005(8) Structures For protection purposes, forestland does not include structures.
76.04.005(15) Suppression Containment and control of forest fires.
76.04.005(16) Unimproved Land
Supports grass, brush, and tree growth when not cleared or cultivated.
76.04.175 (1) Comparing Costs
June 1 of each year, DNR shall establish list of fire suppression equipment provided by DNR so that cost by unit or category can be determined and compared to expense of utilizing private vendors.
76.04.630 Landowner Contingency Forest Fire Suppression Account Assessment
An assessment on forestland owners, established to pay the cost of fire suppression when fires are started as the result of landowner operations. Rate established by DNR, with a balance to be maintained of $3 million. Flat fee to be no more than $7.50 per parcel with a maximum of 15 cents per acre for parcels over 50 acres.
60

DNR Fire Suppression Study
RCW Citation What is Defined? Summary of Wording
76.04.620 Landowner Responsibility
If fire started as result of landowner operation, the Landowner Contingency Forest Fire Suppression Account will refund General Fund.
76.04.175 (2) Costs: Quotes by Private Vendors
A roster of quotes by vendors to be established and used to compare vendor costs to DNR costs. DNR shall utilize the most effective and efficient resource.
76.04.175 (Intent)
Costs: Vendor or DNR
Legislature finds that it is frequently in the best interest of the state to use equipment from private vendors.
76.04.177 Costs: Vendors Before constructing or purchasing equipment on cost comparison list, DNR shall compare the per-use cost of the equipment with the cost of utilizing private equipment.
76.04.177 Vendors: When to Use
If utilizing private equipment is more effective and efficient, the department may not construct or purchase the equipment but shall use the equipment from the lowest responsive bidder.
76.04.167(1)(e) Paying for Fire Protection
Intent of Legislature that cost of fire protection be equitably shared between the forest protection assessment and state contributions.
76.04.750 Paying for Fire Suppression
If not the result of negligence or landowner operations, no costs are to be recovered from the landowner.
61

DNR Fire Suppression Study
62

APPENDIX 6 – ARIZONA STATE ANNUAL REPORT: FIRE SUPPRESSION REVOLVING FUND
63

Annual Report
Fire Suppression Revolving FundSFY 2004
Submitted by: Kirk RowdabaughState ForesterState Land Department

Sources and Disposition of FundsFire Suppression Revolving Fund ( Fund 2360)
SFY 2004
Sources and Uses
Balance Forward from Prior Year 4,713.60
Receipts 17,055.70Total Receipts 21,769.30
Transfers In 0.00Total Available 21,769.30
Total Non-Appropriated Disbursements 17,397.50
Balance Forward to Next Year 4,371.80
Sources of Revenues
4211 Federal Grants 1,893.604339 Fees & Charges for Service 51.404699 Miscellaneous Receipts 5,313.604821 Prior Year Reimbursements 6,797.104901 Operating Transfers In 3,000.00
Total 17,055.70
Expenditures
6000 Personal Services 652.76100 Employee Related Expenses 100.86200 Professional & Outside Services 16422.16500 In State Travel 46.46600 Out of State Travel 43.96700 Food 06800 Aid to Organizations and individuals 0.47000 Other Operating Expenses 131.6 8500 084008100 Capital Projects8600 Debt Service 09000 Cost Allocation / Indirect Costs 09100 Transfers 0
Total Operating Budget Disbursements 17397.9
Non Lapsing Authority from Prior Years 0Number of FTE Positions 1.5
F/FireAnnualReportSFY2004 TAB A Date: 31 August 2004 LAST UPDATE: Print Scale 90%
Equipment

FIRE SUPPRESSION REVOLVING FUND
Listed in the table below is a breakout of the various types of incidents and activities conducted within the Fund.
Type of Incident Number Incurred Incurred Total Class Sizeof Paid Unpaid Liabilities or
Incidents Liabilities Liabilities Type
(Payments)
State and Private Land Fires 434 $844,705.24 $1,071,574.06 $1,916,279.30 A,B,C,D,E,F,G
False alarms 179 $25,953.03 $33,440.23 $59,393.26 K,L
Federal Fire Assists In State 155 $3,349,920.38 $357,402.62 $3,707,323.00 M
Out of State 57 $4,059,248.23 $2,329.95 $4,061,578.18 MTotal 212 $7,409,168.61 $359,732.57 $7,768,901.18
All Risk 0 $0.00 $0.00 $0.00 M
Pre-positioning of Resources 1 $639,179.59 $540,820.41 $1,180,000.00 K
FEMA FIRES 9 $1,290,451.50 $28,545.37 $1,318,996.87 M
Grand Total 835 10,209,457.97 2,034,112.64 12,243,570.61
NOTES: 1. This report reflects the number of incidents under a particular category which occurred during State Fiscal Year 2004.2. This table reflects both paid and unpaid incurred liabilites. Many times paid liabilities (payments) cross fiscal years.3. Incurred liabilities include labor distribution costs (payroll costs) and vendor costs.4. Incurred liabilites is not the same concept as expenditures or total payments. 5. Expenditure numbers are based on reports generated on December 9, 2004. Numbers cross fiscal years.6. The "All Risk" incidents are reimbursed either by the Arizona Division of Emergency Services or the requesting federal agency.7. FEMA fire costs are reimbursed at the 75% of FEMA determined eligible cost amounts.
F/FireAnnualSFY2004 TAB B Print Scale 95%

Detail Breakout of Classes & Costs
Fires - Size and Class Categories Zero to 1/4 acre A1/4 acre to .9 of an acre B1 acre to 9.999 acres C10 acres to 49.999 acres D50 acres and above E1000 acres to 4,999 acres F5000 acres or more GFalse Alarms with costs KFalse Alarms with no cost LReimbursable Incidents M
Size Incurred Incurred Total Total Number of Class Paid Unpaid Liabilities Acres Incidents
Liabilities Liabilities
State & Private FiresA
Jul-Dec 2003 25,384.69 0.00 25,384.69 14.35 112Jan-Jun 2004 52,080.72 162,912.33 214,993.05 19.76 137Total 77,465.41 162,912.33 240,377.74 34.11 249
BJul-Dec 2003 134,954.82 0.00 134,954.82 122.96 61Jan-Jun 2004 111,874.94 467,345.67 579,220.61 157.85 92Total 246,829.76 467,345.67 714,175.43 280.81 153
CJul-Dec 2003 162,816.88 0.00 162,816.88 324 12Jan-Jun 2004 145,190.40 291,765.14 436,955.54 396.00 12Total 308,007.28 291,765.14 599,772.42 720.00 24
DJul-Dec 2003 5,800.81 0.00 5,800.81 350.00 2Jan-Jun 2004 45,393.67 49,425.33 94,819.00 484 3Total 51,194.48 49,425.33 100,619.81 834.00 5
EJul-Dec 2003 7,265.20 0.00 7,265.20 485 1Jan-Jun 2004 7,976.55 23.45 8,000.00 630 1Total 15,241.75 23.45 15,265.20 1,115.00 2
FJul-Dec 2003 1,068.70 0.00 1,068.70 4,900 1Jan-Jun 2004 144,897.86 100102.14 245,000.00 2 0Total 145,966.56 100,102.14 246,068.70 4,902.00 1
GJul-Dec 2003 0.00 0.00 0.00 0 0Jan-Jun 2004 0.00 0.00 0.00 0 0Total 0.00 0.00 0.00 0.00 0
Total of State& Private 844,705.24 1,071,574.06 1,916,279.30 7,885.92 434
F\Fire AnnualReportSFY2004 TAB C

Detail Breakout of Classes & Costs
Class Incurred Incurred Total Total Number ofPaid Unpaid Liabilities Acres Incidents
Liabilities Liabilities
Total - False AlarmsK
Jul-Dec 2003 15,234.74 0.00 15,234.74 0.5 46Jan-Jun 2004 10,459.61 33,440.23 43,899.84 0 68Total 25,694.35 33,440.23 59,134.58 0.5 114
LJul-Dec 2003 258.68 0.00 258.68 3.3 65Jan-Jun 2004 0.00 0.00 0.00 0 0Total 258.68 0.00 258.68 3.3 65
Total of False Alarms 25,953.03 33,440.23 59,393.26 3.8 179
M In State - Federal Fire AssistsJul-Dec 2003 1,287,804.62 0.00 1,287,804.62 0 73Jan-Jun 2004 2,062,115.76 357,402.62 2,419,518.38 0 82Total 3,349,920.38 357,402.62 3,707,323.00 0 155
M Out of State - Federal Fire AssistsJul-Dec 2003 3,837,350.08 2,329.95 3,839,680.03 0 52Jan-Jun 2004 221,898.15 0.00 221,898.15 0 5Total 4,059,248.23 2,329.95 4,061,578.18 0 57
M Total - Federal Fire AssistsJul-Dec 2003 5,125,154.70 2,329.95 5,127,484.65 0 125Jan-Jun 2004 2,284,013.91 357,402.62 2,641,416.53 0 87Total 7,409,168.61 359,732.57 7,768,901.18 0 212
Total - Pre-Positioning ActivitiesJul-Dec 2003 0.00 0.00 0.00 0 0Jan-Jun 2004 639,179.59 540,820.41 1,180,000.00 0 1Total 639,179.59 540,820.41 1,180,000.00 0 1
Total - All Risk IncidentsJul-Dec 2003 0.00 0.00 0.00 0 0Jan-Jun 2004 0.00 0.00 0.00 0 0Total 0.00 0.00 0.00 0.00 0
Total - FEMA Fires Jul-Dec 2003 1,166,681.59 0.00 1,166,681.59 Category M 2Jan-Jun 2004 123,769.91 28,545.37 152,315.28 Category M 7Total 1,290,451.50 28,545.37 1,318,996.87 9
Grand Total 10,209,457.97 2,034,112.64 12,243,570.61 7,889.72 835
F\Fire AnnualReportSFY2004 TAB C

Incident Incident Timeframe Incurred Incurred Total Total Number of IncidentNumber Name Paid Unpaid Liabilities Acres Incidents Category
Liabilities Liabilities
Pre-Positioning ActivitiesJul-Dec 2003 0.00 0.00 0.00 0 0
2004-0083 Severity Jan-Jun 2004 639,179.59 540,820.41 1,180,000.00 0 1 KTotal 639,179.59 540,820.41 1,180,000.00 0 1
Arizona Revised Statutes provides for the Governor to authorize up to one million dollars to pre-position equipment andfire suppression resources to provide for enhanced initial attack on wild land fires during periods of extreme fire danger.The state has endured four years of drought. This has a major impact on vegatitive fuels. Because the vegetation is so dry it is more subsceptible to burning and burns quicker. Additionally the larger vegetation such as trees are extremely dry and are faced with the "Bark Beetle" problem. Because of these factors the State Land Departmentrequested that the Governor authorize the use of severity funds to mitigate the wild fire threat this past season.
FEMA FIRESJuly 1 thru 31 December, 20032003-0454 Kinishba July -Dec 2003 1,076,534.56 48,409.55 1,124,944.11 0 M2003-0461 In Support Kinishba July -Dec 2003 41,737.48 0.00 41,737.48 0Six Month totals 1,118,272.04 48,409.55 1,166,681.59 0 2
1 January thru 30 June 20042004-0288 Three Forks Jan - June 2004 838,463.65 16,084.98 854,548.63 0 M2004-0371 Willow Jan - June 2004 1,490,891.61 59,725.71 1,550,617.32 0Six Month totals 2,329,355.26 75,810.69 2,405,165.95 0 2
Kinishba Fire & In Support of KinishbaThe Kinishba fire started on July 13, 2003 on the Fort Apache Indian Reservation near the community of Whiteriver, Arizona.This fire spread rapidly to the north toward the comunities of Pinetop-Lakeside, Arizona. The Incident Management Teamdeclared the communities were threatened by the fire. The State requested a Federal Emergency Management Grant to helpwith potential suppression and emergency response costs based on the team's concerns. The fire burned 24, 734 acres and did not reach the threaten communities.
Three Forks FireThe Three Forks fire started June 8, 2004 some 11 miles west of Alpine, Arizona and east of Big Lake on the Apache SitgreavesNational Forest. On June 9th the State of Arizona requested assistance from the FEMA in the form of a Fire ManagementAssistance Grant to help with the management of the fire. The fire was a threat to the community of Nutrioso, Arizona.evacuated. Federal grant funds were used to pay for emergency response costs in the event that the community was evacuated.
Willow FireThe Willow fire started on June 25th in the Matazal Mountains on the Tonto National Forest by lightning. This fire burned forseveral days before the Fire Management Division of the Land Department requested assistance from the Federal EmergencyManagement Agency (FEMA). The Willow fire threatened the communities of Payson, Pine andStrawberry. The fire burned119,500 acres and was controlled 3.5 miles south of the community of Payson. Federal grant funds were used to help pay foremergency response costs in preparing for potential community evacuations.
All Risk IncidentsJuly 1 thru 31 December, 2003None July -Dec 2003 0.00 0.00 0.00 0.00 0
0.00 0.00 0.00 0.00 0
1 January thru 30 June 2004 0.00 0.00 0.00 0.00 0None Jan - June 2004 0.00 0.00 0.00 0.00 0
All Risk IncidentsDuring the reporting period of July 1, 2003 thru June 30, 2004 there were no requests or responses to any "All Risk Incidents".
F/FireAnnualReportSFY 2004 TAB Narrative Date: 30 Aug 2004 LAST UPDATE: 9-Dec-2004 Print Scale 90%

DNR Fire Suppression Study
64