DEPARTMENT OF NATURAL RESOURCES DIVISION QF …
62
STATE OF ALASKA DEPARTMENT OF NATURAL RESOURCES DIVISION QF GEOLOGICAL & GEQPEIYSICAL SURVEYS Walter J. Hickel, Governor Harry Noah, Commissioner Thomas E. Smith, State Geologist July 1993 This report is a preliminary publication o f DGGS. The aulhor is solely responsible for its content and will appreci- ate candid comments on the accuracy o f the data as well as suggestions to improve the report. Report of Investigations 93-2 GROUND-WATER QUALITY DATA COLLECTED F'ROM 30 WELLS IN JULY 199 1, WEST NMISKI, ALASKA BY Mary A. ~au;er
Transcript of DEPARTMENT OF NATURAL RESOURCES DIVISION QF …

STATE OF ALASKA
DEPARTMENT OF NATURAL RESOURCES
DIVISION QF GEOLOGICAL & GEQPEIYSICAL SURVEYS
Walter J. Hickel, Governor
Harry Noah, Commissioner
Thomas E. Smith, State Geologist
July 1993
This report is a preliminary publication of DGGS. The aulhor is solely responsible for its content and will appreci- ate candid comments on the accuracy of the data as well as suggestions to improve the report.
Report of Investigations 93-2
GROUND-WATER QUALITY DATA COLLECTED F'ROM 30 WELLS IN JULY 199 1, WEST NMISKI, ALASKA
BY Mary A. ~ a u ; e r
-
STATE OF ALASKA Department of Natural Resources
DMSION OF GEOLOGICAL & GEOPHYSICAL SURVEYS
According to Alaska Statute 4 1, the Alaska Division of Geological and Geophysical Surveys is charged with conducting "geological and geophysical surveys to determine the potential of Alaskan land for production of metals, minerals, fuels, and geothermal resources; the locations and supplies of ground water and construction materials; the potential geologic hazards to buildings, roads, bridges, and other installations and structures; and shall conduct such other .surveys and investigations as will advance knowledge of the geology of Alaska."
Administrative functions are performed under the direction of the State Geologist, who maintains his ofice in Fairbanks. The locations of DGGS offices are listed below:
794 University Avenue 400 Willoughby Avenue Suite 200 (3rd floor) Fairbanks, Alaska 99709-3645 Juneau, Alaska 99801 (907) 474-7 147 (907) 465-2533
Geologic Materials Center 18205 Fish Hatchery Road
P.O. Box 772116 Eagle River, Alaska 99577-2116
(907) 696-0079
This report, printed inFairbanks, Alaska, is for saleby DGGS for $3.00. DGGS publications maybe inspected at the following locations. Address mail orders to the Fairbanks office.
Alaska Division of Geological & Department of Natural Resource Geophysical Surveys Public Information Center
794 University Avenue, Suite 200 3601 C Street, Suite 200 Fairbanks, Alaska 99709-3645 Anchorage, Alaska 99510

CONTENTS
Page Introduction ..................................................................................................................................................... 1 Acknowledgments ......................................................................................................................................... 1
............................................................................................................... Previous investigations ............... .. 3 ................................................................................................................. Sampling and analytical procedures 3
Waterquality standards .............................. .. ............................................................................................... 3 ...................................................................................................................................... Results and discussion 4
Onsite measurements and analyses ............................................................................................................ 5 .................................................................................................................................. Laboratory analyses 5
............................................................................................. Comparisons of onsite and laboratory results 10 ...................................................................................................................... Interlaboratory comparisons 10
........................................................................................................................ Water-type classification 12 ................................................................................................................................ Summary and conclusions 15
............................................................................................................................................... References cited 15
FIGURES
Figure 1 . Location of waterquality sample sites. west Nikiski area. Alaska .................................................... 2 2 . Relation of total iron concentration measured onsite and in the laboratory ...................................... 11 3 . Histogram showing frequency distribution of onsite and laboratory iron data .................................. 11 4 . Relation of total hardness determined onsite and in the laboratory .................................................. 12 5 . Histogram showing frequency distribution of onsite and laboratory-calculated hardness data .......... 12 6 . Trilinear diagram showing water analyses of ground water collected from 30 wells in the west
....................................................................... Nikiski area during July 1991 ................... ... 14
TABLES
Table 1 . Sampled wells in Township 6 North. Range 12 West. Sections 1. 2. 11 and Township 7 North. Range 12 West. Sections 11. 13.15. 23.27. 35. 36. Seward Meridian .......................................... 4
2 . Results from DOW onsite water-quality measurements and analyses. taken at sites for which laboratory results are available .............. .. ................................................................................. 6
.................................. 3 . Results from laboratory analyses for inorganic and radioactivity constituents 7 4 . Results from laboratory analyses for volatile organic compounds ............................................... 9 5 . Comparisons of analytical results between the Alaska Division of Water laboratory and the U.S.
Geological S w e y laboratory ........................... ... ........................................................................ 13
APPENDIXES
Appendix A . State of Alaska Drinking-water Regulations. maximum contaminant concentration levels. ................................................................................................................. 18 AAC 80.070 17
B . Diagram showing derivation of local well number. based on the official subdivision of ............................................................... public lands. used by the U.S. Geological Survey 20
............................................................................. . C Laboratory waterquality analytical reports 21 D . Laboratory quality assurance evaluation on water samples collected for the phase IIIA project.
............................................................................................................. west Nikiski. Alaska 57

GROUND-WATER QUALITY DATA COLLECTED FROM 30 WELLS IN JULY 1991, WEST NIKISKI, ALASKA
by Mary A. ~ a u r e r '
INTRODUCTION
The Alaska Department of Natural Resources, Division of Water @OW) began a ground-water study of the west Nikiski area (fig. 1) on the Kenai Peninsula in 1990. This report summarizes results of onsitc and laboratory analyses of ground water collected from 30 wells in July 1991.
The Kenai Peninsula Ground-Water Task Force developed a four-phase project plan to study the ground water of the Kenai Peninsula (KPGWTF, 1990a). Phase I, completed in 1991, consisted of mapping and listing existing U.S. Geological Survey (USGS) water-quality data (Bullington, 1991). Phase I1 will examine the regional ground-water quality and flow systems (KPGWTF, 1990b). Phase I11 consists of detailed subsurface geologic, water-table, and water-quality mapping at the subregional scale WGWTF, undated). Phase IV will include long-term monitoring, ground-water protection, and educational activities.
KPGW'IT selected the west Nikiski area as the first phase 111 project because (1) most residents and businesses rely on ground water as a water supply, and (2) ground-water contamination has been identified there (Harding Lawson Inc., 1989). The water-quality objectives of this phase IIIA pilot project are to:
1. Survey ground-water quality by conducting onsite measurements of key water-quality properties and constituents
2. Collect ground-water samples and analyze them for selected inorganic, organic, and radioactive constituents
3. Show selected water-quality constituent concentrations on maps by using all available field and laboratory data
4. Describe ground-water quality in the west Nikiski area.
This report presents and evaluates the laboratory and onsite water quality results collected for objective 2.
ACKNOWLEDGMENTS
The autlior thanks the members of the KPGWTF who helped to develop the project, the Kenai Peninsula Borough, Alaska Oil and Gas Association, Unocal Oil and Gas, Unocal Chemical, ARC0 Alaska Inc., Marathon Oil Company, Phillips Petroleum Company, and Tesoro Alaska Petroleum Corporation for providing partial project funding.
Roy Glass (USGS), William Petrik, Roger Allely, Richard Noll, Stephen Weems, and Kellie Litzen @OW), Jim Jurgens (ADNR-Division of Management), and Hans Schweiger (student intern) assisted with data collection. Roy Glass (USGS), James Munter @OW), and Jean Bodeau, Alaska Department of Environmental Conservation (ADEC), reviewed and edited the report. I also thank the Nikiski area property owners who graciously allowed access to their property for water-quality data collection.
bivision of Water, Alaska Hydrologic Survey, P.O. Box 7721 16, Eagle River, AK 99577.

1 .Base from U.S. Geological Survey 151 O 2 0 '
Kenai [C-41, ~ l a i k a 1 9 5 1 (83,3601
Figure 1 . Location of warer-qualify sample sites, west Nikiski area, Alaska.

PREVIOUS INVESTIGATIONS
Previous ground-water investigations in the Nikiski area include Anderson and Jones (1942), Howland and Freethey (1978), and Nelson (1981). Three major aquifers were described by Nelson (1981): an unconfined aquifer, an upper confined aquifer, and a lower confined aquifer. The unconfined aquifer is composed of coarse a d and gravel with some silt. It ranges in depth from about 5 to 100 ft below land surface (Anderson 'and Jones, 1972). Most domestic wells in the Nikiski area tap this aquifer, which is underlain by a silt, clay, and sand unit that is termed the upper confLning layer (Nelson, 1981). The upper confined aquifer, composed of sand, gravel, and silty interbeds, ranges in depth from about 100 A to more than 300 A below land surface; several industrial wells tap this aquifer. It is underlain by a silt and clay confining unit which is generally more than 100 ft thick. The lower coilfined aquifer is poorly defiled but may consist of interconnected sand and gravel layers.
Even though the aquifers have been previously studied and identified, ground-water flow directions and the quality of wafer in the aquifers are poorly understmi.
SAMPLING AND ANALYTICAL PROCEDURES
Most water samples were taken from private domestic wells that were in daily use at the time of sampling. When possible, water sarnples were collected before they passed through water pressure tanks. If the tanks could not be bypassed, the tank volume was added to the total volume of water needed to be purged to obtain a sample representative of the well's aquifer. All water-treatment systems were bypassed.
A detailed description of sampling and analytical equipment and procedures is given in the quality-assurance plan (QAP) for this project (Maurer, 1991). Initially, a water-level measurement was taken in each well before turning on any faucet. An outside spigot was then turned on to purge water from the well casing. A Y-shaped valved adapter was attached to the spigot and split the waterflow into a long hose for purging and a short hose for monitoring and san~pling. A model-4041 Hydrolab, fitted with a flow cell, continually monitored the water's temperature, pH, and specific conductance during purging. Water for onsite and laboratory tests was collected only when at least four well casing volumes were purged and when pH and specific conductance fluctuated no more than 5 percent. Onsite total alkalinity was determined by potentiometric titration with Gran's graphical methods (Stumm and Morgan, 1981). Onsite analyses of total iron, total hardness, and nitrate-nitrogen concentrations were made using test kits manufactured by Hach Company, of Loveland, Colorado.
The actual sampling method differed only slightly from that outlined in the QAP. Radiological sample bottles and total trace element (iron and manganese) samples were filled from the outlet of the short hose. Water for dissolved major-ion and trace-element analyses was filtered by using an in-line filtration system. Silicone tubing attached to the outlet of the short hose carried water into a 142-mm Geotech filter assembly containing a 0.45-pm membrane filter. After the filter and assembly were flushed with about 1 liter of filtrate, the sample bottles for dissolved constituents were filled. Two volatile organic compound (VOC) septum vials were filled directly from the spigot. All other preservation and handling procedures were done according to QAP specifications.
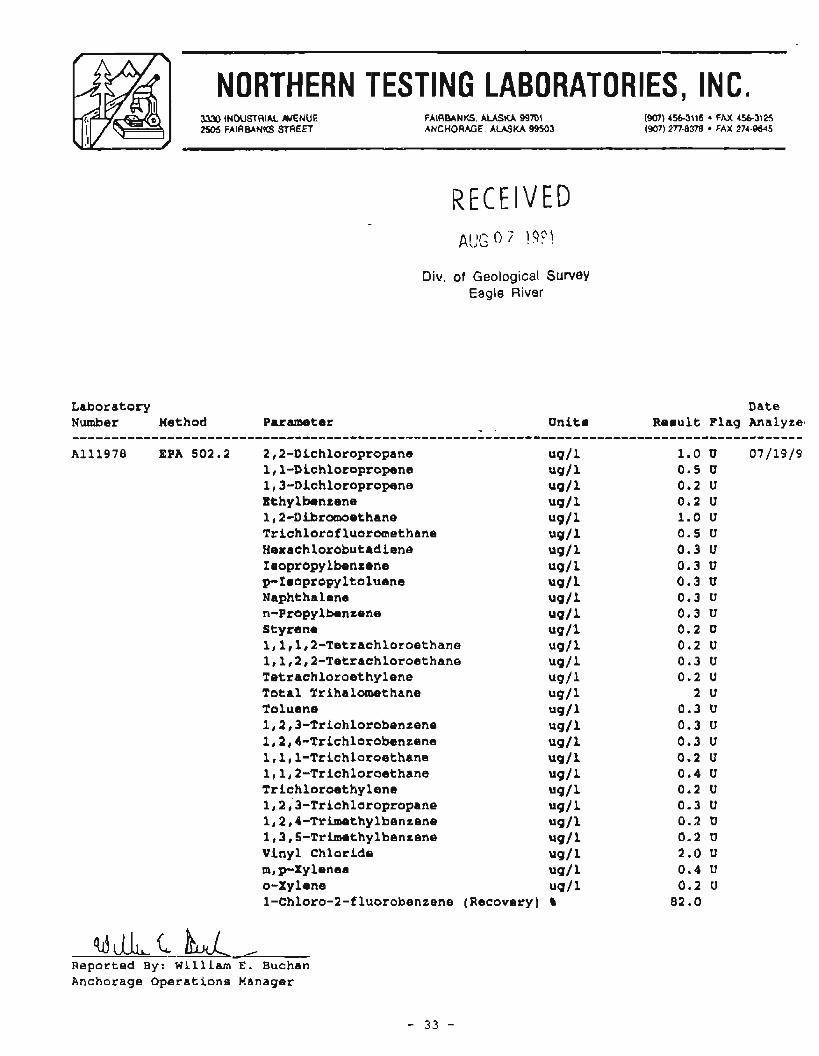
Inorganic constituent analyses of 36 water sample sets were conducted at the DOW Water Quality Laboratory in Fairbanks, Alaska; 11 VOC samples were analyzed at Northern Testing Laboratories in Anchorage. Nine gross-alpha and gross-beta radioactivity samples were analyzed at Core Laboratories in Casper, Wyoming. Laboratory quality-control procedures, data-quality objectives, and analytical methods are given in Maurer (1991).
WATER-OUALITY STANDARDS
The State of Alaska Drinking-Water Regulations (ADEC, 1991) specify the maximum concentration or level of a contaminant for public water systems (app. A). A contaminant is defined as any physical, chemical, biological, or radiological substance or material in water which, in sufficient quantity, makes water unfit for human consumption (ADEC, 1991). A primary maximum contaminant concentration level (PMCL) is health

related and is legally enforceable for suppliers of public drinking water. A secondary maximum contaminant concentration level (SMCL) applies to the aesthetic qualities of drinking water and is a recommended guideline for public water suppliers. Concentrations are reported in milligrams per liter ( m d ) or micrograms per liter @ g ) . The conversion is 1,000 pg/l= 1 mgtl; and 1 mg/l is about 1 part per million (ppm).
RESULTS AND DISCUSSTON
A listing of sampled wells, site numbers, and well characteristics is shown in table 1. Site numbers were arbitrarily assigned for this study, whereas the 'local well number' is based on the rectangular subdivision of public lands (app. B) and is a unique site identifier used by both the USGS and DOW. Well depths ranged from 3 1 to 303 A.
Table 1. Sampled wells in Township 6 North, Range 12 West, Sections 1, 2, 11 and Township 7 North, Range 12 West, Sections 11, 13-15, 23-27, 35, 36 Seward Meridian
umbers arbitrarily assigned for this project, see fig. 1 for location. 'The local well number is based on the official rectangular subdivision of public lands, see app. B. 3~ i s tance from land surface to bottom of hole, in feet. 4 ~ i t e 133 was measured and sampled by U.S. Geological Survey. AKDiv. of Water submitted volatile organic compound sample for analysis,
see app. C.

ONSITE MXASUREMENTS AND ANALYSES
Results from onsite measurements and analyses are shown in table 2. Water levels ranged from 9.82 to 96.71 ft below land surface. Water temperature ranged from 3.1 to 7.8"C. Specific conductance was typically less than 300 microsiemens per centimeter @S/cm), which is considered acceptable for domestic use. The pH values ranged widely and several sites were outside the SMCL m g e of pH 6.5-8.5 (ADEC, 1991); six sites had pH values of less than 6.5 and three sites had pH values of greater than 8.5. Total alkalinity ranged from 33 to 270 mg/l as CaC03, with a mean value of 69 mgA and a median value of 59.5 mgA. Total hardness ranged from 9 to 130 mgA as CaCO,, with a mean value of 49 mgfl and a medim value of 44.5 m a . Water having a hardness value less than 60 mgA is considered soft, 61-120 mg/l is considered moderately hard, and 121-180 mg/l is considered hard (Hem, 1985).
Total iron concentrations were highly variable, ranging from 0.1 to 14.4 m a . Concentrations of iron less than 0.3 rngh are desired for domestic uses. Nitrate-nitrogen (NO3 as N) concentrations were either undetectable or measured in concentrations less than 2 mg/l. Concentrations of nitrogen less than 10 m u are desired for domestic uses.
LABORATORY ANALYSES
The results of the laboratory analyses for water samples from the 30 wells are shown in tables 3 and 4. Complete analytical reports for each laboratory are given in appendix C and the quality-assurance evaluation report for each laboratory is presented in appendix D.
Most laboratory-analyzed inorganic constituents and trace elements did not exceed the PMCLs promulgated in the Alaska Drinking Water Regulations (ADEC, 1991). For example, the nitrate-nitrogen concentration ranged from KO, 1 to 4.45 mgA, substantially less than the nitrate PMCL of 10 mgA as nitrogen. Arsenic has a PMCL of 50 pgA. An arsenic concentration of 71 pg/l was measured from a sample collected at site 67 (fig. 1); the san~pled well is located less than 100 A from the Cook Inlet bluff, and at 303 ft deep is completed in the lower confined aquifer (W.A. Petrik, oral commun,, 1992). Arsenic concentrations in water from a few wells more than 200 ft deep in the west Nikiski area have exceeded 50 pgA, based on USGS historical data (USGS, 1998). Although elevated arsenic co~icentrations may not be common in water from shallow wells in the Nikiski area, they do occur sporadically in ground water elsewhere on the Kenai Peninsula (USGS, 1992; Munter and Maurer, 1991).
Concentrations of total (unfiltered) and dissolved (filtered) iron and manganese were analyzed. Besides pH, iron and manganese were the only analyzed inorganic constituents that had concentrations exceeding SMCLs (ADEC, 1991). Total iron concentrations ranged from 0.05 to 16.3 mg/l, and exceeded the SMCL of 0.3 mgA at 22 sites. Total manganese concentrations ranged from c0.005 to 0.94 mg/l, and exceeded the SMCL of 0.05 mgA at 20 sites. Dissolved iron and manganese concentrations exceeded their respective SMCLs at 19 sites. Both iron and manganese affect the taste and visuaI qualities of drinking water.
The absence of detectable VOCs in 10 of 11 ground-water samples suggests that VOC contamination is not an areawide problem in the residential west Nikiski area. The only detected VOC was 1 , 1 , I-trichloroethane (table 4). A concentration of 0.7 pg/l was measured in a sample collected at site 143, 0.2 miles east of Bernice Lake (fig. 1). For comparison, the PMCL for l,l,l-trichloroethane is 200 pgA (ADEC, 1991). The occurrence of 1,l ,I-trichloroe-thane has been neither confinned nor disproven with additional sampling.
The origin of 1,l ,I-trichloroethane is unknown. No detectable concentrations of selected VOCs were measured at site 144, which is located about 300 ft southwest of and downgrade from site 143, according to water- table contour maps (R.D. Allely, oral commun., 1992). Nevertheless, it is impossible to determine the origin or areal extent of 1,l ,I -trichloroethane in ground water based on the distribution of available analyses.
Water samples were collected from nine wells for radioactivity analysis (table 3). TotaI gross-alpha and total gross-beta radioactivities of sampled ground waters in the west Nikiski area were low compared to the PMCLs

Table 2. Resultsfi.om DOW on-site water-quality measurements and analyses, taken at sitesfor which laboratory results are available
umbers arbitrarily assigned for this project, see fig. 1 for location. 2~is tance below land surface, in feet. ' ~o ta l iron concentrations were determined onsite with Hach iron test kit, model IR-18B. itra rate concentrations were determined onsite with Hach low range nitrate test kit, Model NI-14. ' ~o ta l hardness concentrations were determined onsite with Hach total hardness test kit, model HA-DT 6NM = not measured. ' ~o ta l alkalinity collected and measured on 7-16-91. 'MCL = Maximum contaminant level (State of Alaska Drinking Water Regulations, 18 AAC 80).
Shaded area = value or concentration exceeds the MCL.
promulgated in the Alaska Drinking Water Regulations (ADEC, 1991). Gross-alpha radioactivity has a PMCL of 15 picocuries per liter (pCVl), and gross-beta radioactivity has a PMCL of 50 pCfl. All total gross-alpha radioactivity concentrations were less than the lower limit of detection (LLD), which ranged from 1.9 to 15.8 pCirl. Most total gross-beta radioactivity results are reported as less than the LLD concentrations.
Total gross-alpha and gross-beta particle count, error, and LLD concentrations in pCi/l are shown in appendix C. The 'error, It' is the analytical and counting error associated with the particle count. The LLD concentration is the result of background alpha and beta particle interferences. The total gross-alpha and total
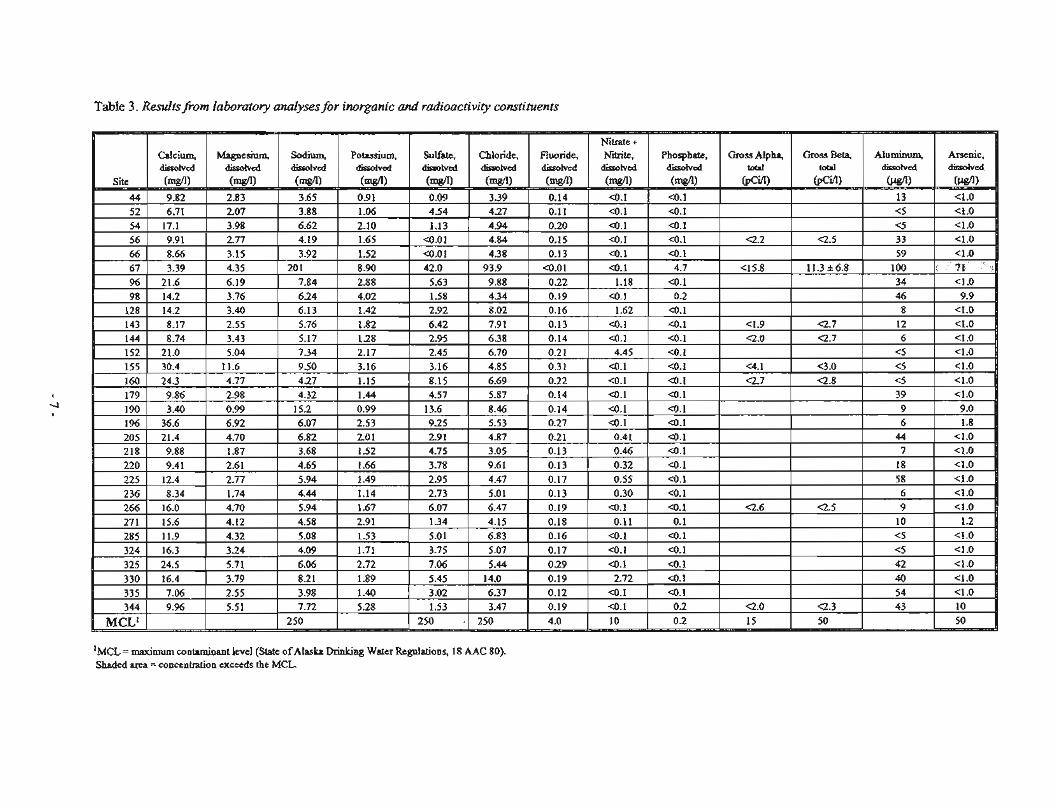
Table 3. Resu€tsfi-om laboratoly analyses for inorganic and radioactivity constituents
I
4 I
( MCL' 1 I ( 250 I 1 250 250 1 4.0 I 0.2 1 15 50 50 I - , ,
'MCL = maximum contaminant level (State of Alaska Drinking Water Regulations, 18 AAC SO). Shaded area = concentration exceeds the MCL.

Table 3 . Resultsfiorn laboratory analyses (cont.)
'MCL = maximum contaminant level (State of Alaska Drinking Water Regulations, 18 AAC 80). Shaded area = concentration exceeds the MCL.

Table 4 . Resultsfiom laboratory analyses for volatile organic compounds
'MCL = maximum conlamiaant level (Slate o f Alaska Drinking Water Regulations, 18 AAC 80) Shaded area = concentration exceeds the MCL.
- 9 -

gross-beta LLD concentrations of 15.8 and 10.4 pCi/l, respectively, for the sample collected at site 67 is high compared to other samples. The total dissolved solid W S ) concentration of a sample is a limiting factor in the sensitivity of the analytical method (USEPA, 1980). Specific conductance is an indirect indicator of TDS, and the comparatively high specific conductance (1473 pS/cm) of the ground water at site 67 probably contributes to the higher LLD concentrations.
COMPARISONS OF ONSITE AND LABORATORY RESULTS
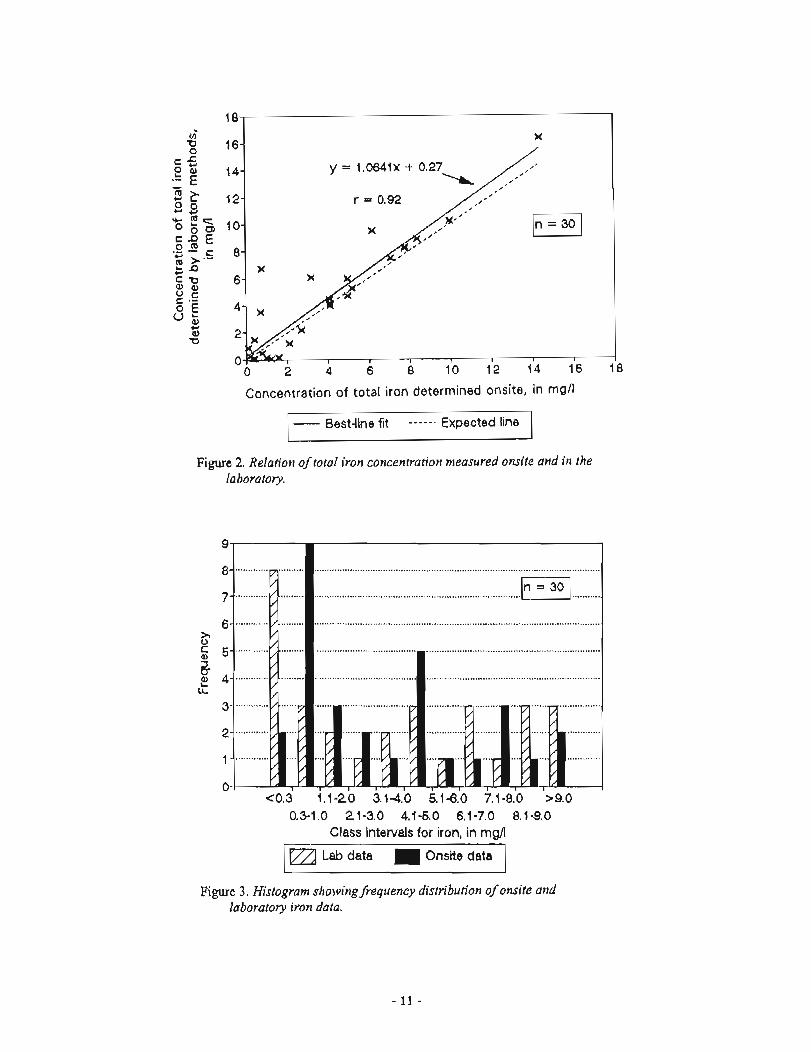
Total iron concentrations determined onsite (table 2) were compared to those determined in the laboratory (table 3). Figure 2 shows the relation between the two data sets, represented by the 'best-fit' line. A good linear relationship (r = 0.92) exists between onsite and laboratory results. The 'expected line' is how the data would plot if there was a perfect relationship (r = 1.00) between the two data sets.
A frequency distribution of iron concentrations show that 11 of 30 sites had concentrations 4 . 0 mgA, regardless of the testing method used (fig. 3). The difference between onsite and laboratory data at iron concentrations 4 . 0 mgA is attributed to the lower resolution of the onsite method. The onsite method has a detection limit of about 0.2 mgA, whereas the laboratory method has a detection limit of 0.03 mgA. Presumably, the laboratory method was better at quantifying iron concentrations <1.0 mgA. Onsite screening for iron was considered adequate only when iron concentrations were >1.0 mg/l.
Hardness values determined onsite (table 2) were compared to hardness values computed from laboratory data. A laboratory hardness value for each water sample was calculated by converting calcium and magnesium concentrations in mgA (table 3) to milliequivalents per liter (meq/l) and then multiplying the sum of calcium and magnesium in meqA by 50 (Hem, 1985). Figure 4 shows the actual relation (best-fit line) between the two data sets. A fairly good linear relationship (r = 0.80) exists between onsite and laboratory methods. Figure 5 shows the frequency distribution of hardness data for the two data sets. The onsite and laboratory results are in reasonably close agreement throughout the measured concentration range.
Nitrate (NO,) data comparisons are not graphically presented because most samples contained concentrations of nitrogen less than the detection levels of both the test kit and laboratory instnunents. Nitrite (NO,) concentrations are usually a very small part of the NO,+NO,-N ratio when the water is oxygenated and are not expected to significantly affect the relationship between data sets.
INTERLABORATORY COMPARISONS
The USGS collected and analyzed 27 ground-water samples in the greater Nikiski area during 1991 for the KPGWTF's regional hydrogeologic study of the Kenai Peninsula, referred to as the phase I1 project. Samples were analyzed at the USGS Laboratory in Denver by using the methods described in Fishman and Friedman (1985). The analytical results are presented in the USGS annual water-resource data report (USGS, 1992).
The Alaska DOW and the USGS concurrently sampled water from two wells, sites 66 and 344, to make interlaboratory comparisons of analytical results (table 5). The general reliability of laboratory analyses was checked by calculating the cation-anion balance for each data set. All four analyses are acceptable because the error in the cation-anion balance is less than 10 percent.
Generally, the two laboratories are in good agreement with respect to major-ion analytical results (table 5). Interlaboratory comparisons for many trace elements is not possible because most concentrations were below detection limits. Comparisons for concentrations of fluoride, aluminum, arsenic, and manganese were poor between laboratories; this is most likely due to the difficulty in quantifying trace elements at concentrations near the detection limit.
Concentration of total iron determined onsite, in mgll
- Best-line fit Expected line I Figure 2. Relation of total iron concentration measured onsite and in the
laboratory.
0.3-1.0 21-3.0 4.1-5.0 6.1-7.0 9.1-9.0 Class intervals for iron, in mgll -
I Lab data Onsite data I Figure 3. Histogram showingfrequency distribution of onsite and
laboratory iron data,

Bnsite determination of total hardness, in mg/l as CaCO,
- Best-fit line ----- Expected line
Figure 4. Relation of total hardness determined onsite and in the laboratory.
21 -30 41 -50 61 -70 >80 11 -2J 31 -40 51 SO 71 -&0
Class intervals for hardness, in mg/l
Lab data Onsite data
Figure 5. Histogram showingfiequency distribution of onsite and laboratory-calculated hardness data.
WATER-TYPE CLASSIFICATION
Trilinear diagrams can be used to show the chemical character of a water sample (Piper, 1944). Ratios of selected cations (calcium, magnesium, and sodium plus potassium) and anions (bicarbonate plus carbonate, chloride, and sulfate) for each water analysis are shown in the diagram as percentages of the total cations and anions, in meq/l. A water type can be described on the basis of predominant cations and anions found in the water.

Alkalinity (as HCO,)
Nitrate + nitrite (as N) Phosphom, ortho (as P)
Table 5 . Comparisons of amlytical results between the Alaska Division of Water laboratory and US. Geological Survey laboratory
I
C W I

Twenty-one sites sampled in the Nikiski area have ground water that is of the calcium-bicarbonate type (fig. 6). Seven sites have ground water of the 'mixed-cation1-bicarbonate type because the percentage of no single cation exceeds 50 percent. All 28 sites tap the unconfined or upper-confined aquifer (W.A. Petrik, oral commun., 1992).
C a C1
Cations Anions
Total rnilliequivalents/liter ( O h )
EXPLANATION
Svmbol Water t v ~ e - Site
Calcium bicarbonate 44, 54, 56, 96, 98, 128, 152, 155, 160, 179, 196, 205, 21 8, 220, 225, 236, 266, 271, 324, 325, 330
0 'Mixed-cation' bicarbonate 52, 66, 143, 144, 285, 335, 344
0 Sodium bicarbonate 67, 190
Figure 6. Trilinear diagram showing water analyses of ground water collectd from 30 wells in the west Nikiski area during July 1991.

Two sites have ground water of the sodium-bicarbonate type. Site 67 has a well depth of 303 ft and is the only well sampled that taps the lower-confined aquifer. Site 190 has a well depth of only 36 fl and taps the unconfined aquifer. According to Anderson and Jones (1972), most of the ground waters of the sodium- bicarbonate water type occur in wells ranging from 100 to 450 fl deep.
SUMMARY AND CONCLUSIONS
Generally, the ground waters sampled from 30 wells in the residential area of west Nikiski during 199 1 by BOW had low concentrations of inorganic and organic constituents; levels of radioactivity were acceptable for domestic use. No areawide contamination by volatile organic compounds was detected.
Most sampled ground waters had concentrations of naturally occurring iron and manganese that were higher than levels desired for domestic use.
All wells sampled had low nitrate concentrations.
One deep well had an arsenic concentration above drinking-water standards, but high concentrations of arsenic occur in scattered locations throughout the Kenai Peninsula in both shallow and deep wells.
Concentrations of gross-alpha and gross-beta radioactivity were low in water from nine wells.
Concentrations of 59 volatile organic compounds were analyzed from water samples from 11 wells. Only one volatile organic compound, l,l,l-trichloroethane, was detected. It was found in one well and had a concentration of 0.7 pgA.
REFERENCES CITED
Alaska Department of Environmental Conservation, 199 1, State of Alaska Drinking Water Regulations, 18 AAC 80: ADEC, Juneau, Alaska, 87 p.
Anderson, G.S., and Jones, S.H., 1972, Water resources of the Kenai-Soldotna area, Alaska: U.S. Geological Survey Open-File Report, 81 p.
Bullington, A.Z.R., 1991, Regional hydrogeologic study, Kenai Peninsula, Phase 1 project: Kenai Peninsula Ground-Water Task Force, February 15, 199 1, 10 p., 7 appendixes.
Fishman, M.J., and Friedman, L.C., 1985, Methods for determination of inorganic substances in water and fluvial sediments: U.S. Geological Survey Techniques of Water-Resources Investigations, book 5, chapter Al , 709 p.
f i d i n g Lawson Associates, 1989, Comprehensive inventory report, potential waste disposal sites and other reports/complaints, Kenai Peninsula Borough, Alaska: Prepared for Alaska Department of Environmental Conservation, Juneau, AK, 9 p, plus appendixes.
Hem, J.D., 1985, Study and interpretation of the chemical characteristics of natural water (3d ed.): U.S. Geological Survey Water-Supply Paper 2254,263 p.
Howland, M.D., and Freethey, G.W., 1978, Selected hydrologic data related to the water-table aquifer of the North Kenai area, Alaska: Alaska Division of Geological & Geophysical Surveys Open-File Report 112, 1 sheet, scale 1 :63,360.
Kerlai Peninsula Ground-Water Task Force, 1990a, Overview of plans for an areawide ground-water study, Kenai Peninsula, Alaska: Kenai Peninsula Ground-Water Task Force unpublished document, August 15, 1990,6 p.
1990b, Regional hydrogeologic study Kenai Peninsula Phase I1 project plan: Prepared by Kenai Peninsula Ground-Water Task Force unpublished document, August 15, 1990, 10 p.
undated, Kenai Peninsula Ground-Water Study Phase 111 Pilot Project: Prepared by Kenai Peninsula Ground-Water Task Force unpublished document, unpaginated.
Maurer, M.A., 1991, Quality assurance plan for the Kenai Peninsula ground-water study phase IIIA, pilot project, west Nikiski, Alaska: Alaska Division of Geological & Geophysical Surveys Public-Data File 91-27, 107 p.

Munter, J. A., and Maurer, M. A,, 199 1, Preliminary description of ground-water conditions at Sterling, Alaska: Alaska Division of Geological & Geophysical Surveys Public-Data File 9 1-3 1,25 p.
Nelson, G.L., 1981, Hydrology and the effects of industrial pumping in the Nikiski area: U.S. Geological Survey Water-Resources Investigations 8 1-685,22 p.
Piper, A.M., 1944, A graphic procedure in the geochemical interpretation of water analyses: Transactions of the American Geophysical Union, v. 25, p. 914-923.
Stumm, Werner, and Morgan, J.J., 1981, Aquatic chemistry: an introduction emphasizing chemical equilibria in natural waters: New York, John Wiley & Sons, 780 p.
U.S. Environmental hotection Agency, 1980, Prescribed procedures for measurement of radioactivity in drinking water: U.S. Environmental Protection Agency, EPA-60014-75-008, August 1980, 132 p.
U.S. Geological Survey, 1978, Water resources data for Alaska, water year 1977: U.S. Geological Survey Water- Data Report AK-77-1,439 p.
1 9 9 2 , Water resource data for Alaska, water year 199 1: U.S. Geological Survey Water-Data Report AK-91-1,440 p.

APPENDIX A
State of Alaska Drinking-water Regulations. maximum contaminant concentration levels. 18 AAC 80.070
Note: The following copy of 18 AAC 80.070 was current at the time of research and data compilation . The code has since been updated .
18 AAC 80.070. MAXIMUM CONTAMINANT CONCENTRATION LEVEI. S (MCLs) . (a) The primary maximum contaminant concentration levels (MCLs) for a public water system are for a public water system are
(1) Inorganic Chemical Contaminants
Contaminant Maximum Contaminant Level (ugll)
........................................................................................ Arsenic 50.0
.................................................................................. Barium 1,000.0 .................................................................................. Cadmium 10.0
................................................. ........................ Chromium .. 50.0 ................................................................................ Fluoride ..4,00 0.0
Lead ............................................................................................ 50.0 .......................................................................................... Mercury 2.0
............................................................... Nitrate (as Nitrogen) 10,000.0 ..................................................................................... Selenium 10.0
.......................................................................................... Silver 50.0 (2) Organic Chemical Contaminant
(A) Pesticides
Contaminant Maximum Contaminant Level (I@)
............................................................ ......................... Endrin ... 0.2 ......................................................................................... Lindane 4.0
............................................................................ Methoxychlor 100.0 ...................................... ........................................... Toxaphene .. 5.0
.............................................. ............................ 2, 4-D ... 100.0 ....................... ................................................ 2, 4, 5-TP Silvex .... 10.0
(B) Volatile Organic Chemicals (VOCs)
Contaminant Maximum Contaminant Level (ugn)
................................................................... 1. 1.Diclloroethylene 7.0 ............................... ........................... 1. 1. 1-Trichloreothane .. .200.0
............................................. ...................... 1. 2-Dichloroethane .. 5.0 .......................................................................................... Beizzene 5.0
....................................................................... Carbon tetrachloride 5.0 ................................................................. 4-Dichlorobenzene 75.0
.......................................................... ........ Trichloroethylene ... 5.0 ............................................................................ Vinyl chloride 2.0

VOCs for which an MCL has not yet been set, but which are subject to monitoring under this chapter, are set out in Tables H, I, and J, in 18 AAC 80.400(a).
(C) Total Trihalomethanes (?THMs)
Maximum Contaminant Level (ugfl)
Total Trihalomethanes ................................................................ .100.0
The sampling and analysis requirements for total trihalomethanes are set out at 40 C.F.R. 141.30, as amended August 15, 1989, the requirements of which are incorporated by reference in this chapter.
(3) Physical Contaminants
Contaminant Maximum Contaminant Level (nephelometric turbidity unit, NTU)
Turbidity ................................................................ 1.49 NTTJ as a monthly average of samples required, or 5.0 NTU as an average for two consecutive days. Exceeding either measure is a violation of this paragraph.
(4) Radioactive Contaminants (A) Natural radioactivity
Contaminant Maximum Contaminant Level (pCi/l)
............................................................................... Gross Alpha 15.0 Combined Radium-226 and 228 ...................................................... 5.0
(B) Manmade radioactivity
Contaminant Maximum Contaminant Level @Gin)
............................................ ..................... ............. Gross Beta .., ..... 50.0 Strontium-90 ................................................................................. 8.0
.............. Tritium ...................... .... ................................. ... .20,000.0
(5) Total Coliform Bacteria

Contaminant Maximum Contaminant Level
(A) Membrane Filter Technique No coliform may be present in any of the 100 milliliter routine samples.
(B) Fermentation Tube Method No gas production may be present in any of the five 10 milliliter portions in any routine sample.
(C) Minimal Media ONPGMUG No coliform may be present in (MMO-MUG) Test any of the routine samples any of
the routine samples.
@) The secondary maximum contaminant concentration levels (MCLs) for a public water system are
Contaminant Maximum Contaminant Level
Chloride ................................................................................. 250 mgA Color ..................................................................................... 15 units Copper ...................................................................................... 1 mgll
....................................................................... Corrosivity Noncorrosive Fluoride .............................................................................. 2,000 mg/l Foaming Agents.. .............. .. ............................................... 0.5 mg/l Iron .............. ..... ............................................................... 00.3 m g Manganese ............. .. ......................................................... 0.05 mg/l Odor .................................................................... 3 threshold odor no. pH ........................... ............ ..................................................... 6.5-8.5 Sodium .................................................................................. 250 mgll Sulfate ................................................................................... 250 mgfl Total Dissolved Solids ......................................................... 500 mgl Zinc ................................................................. .. ...................... 5 mg/l
(c) The secondary levels set by (b) of this section represent reasonable goals for drinking water quality and, it1 general, provide a guideline for public water suppliers. 'These secondary contaminants mainly S e c t the aesthetic qualities of drinking water, but, at considerably higher concentrations, health problems might exist. The department will, in its discretion, require a public water system to meet the secondary MCLs if public health is threatened or if there is a strong consumer objection to exceeding a listed MCL. (Eff. 6/14/91, Register 188)
Authority: AS 46.03.020 AS 46.03.070 AS 46.03.720 AS 46.03.050 AS 46.03.7 10

APPENDIX B
Diagram showing derivation of local well number, based on the official subdivision of public lands, used by the U.S. Geological Survey.

APPENDIX C
Laboratory waterquality analytical reports
INORGANIC CONSTITUENTS
Analyzed by Alaska Division of Water, Water Quality Laboratory, Fairbanks, Alaska All inorganic constituents are dissolved, unless otherwise noted.
DL = detection limit W D := relative percent difference
SEE FOLLOWING PAGE FOR SAMPLE BOTTLE KEY
VOLATILE ORGANIC COMPOUNDS
Analyzed by Northern Testing Laboratory, Inc., Anchorage, Alaska Key to laboratory numbers for volatile organic compo~inds analyzed by Northern Testing Laboratories, Inc.:
RADIOLOGICAL PARAMETERS
Analyzed by Core Laboratories, Casper, Wyoming LED - lower limit sf detection
Key to laboratory numbers for radioactivity samples analyzed by Core Laboratories:

Key to sample bottle numbers for inorganic constituent samples analyzed by Alaska Division of Water Laboratory.
' ~ n i o n s include fluoride, chloride, phosphate, and sulfate kations include calcium, magnesium, sodium, and potassium; trace elements include aluminum, arsenic, barium, cadmium,
chromium, copper, nickel, lead, zinc, iron, and manganese 3~ ie ld duplicate sample 4 ~ i e l d equipment-blank sample

Client: DNR/DOW - Eqk Rivcr
Submitted By Mary Ulunr
Date Submitted Summer 1991
Calcium Magncsitua Sodium Paassium I
Units mg/E mg/t mg/L mt/L EPA Method AESOM9 W o o 2 9 m.1 258.1
DelectiOo Limil 0.01 0.01 0.1 0.01 A M P Date 29 Oct 91 29On91 30Oct91 3OOet91
RPD 1.4 05 0.8 1.9 %Rccwery 102 100 100 1 W
Approved BY Date E L 41 C) Jim Vohden, Chemist
- 2 3 -

Date Submitted: Summer 1991
Units mg/L m%L mg P04'PIL m d L EPA Method 3x0 J00.0 300.0 m.0
Dctectioa Limit 0.01 0.01 0.1 0.01 AarJyrir Date 2 Aug 91 2 Aug 91 2 Aug 91 2 Aug 91
RPD 1.6 75 8.3 1.8
%-v 99 90 9 1 90

81'1 WY -fa > a 10> 8a.m l a > LUX -fa > 9w1 -fa > E U J ~ WP YZUl IP'P CZL3I -fa > zz~n -fa > IUX la 2 0 ~ 3 1 76> 6 W 1 -fa > 8WI Ui! LUX i a > ~ W I ?a > m l a > tun -fa > EWI la > zm IP'O IWI wo OKX ST0 BOUI E O 80LX LI'O UIL)I
OF0 90LX 4a > NX W I WU(
?a > w ?a> a x -fa > 1~~31:
?a> OOUI la> ~ r n la> m la > rn 9CI' %9x -la '
nulw + a u t ~
1661 J?arrenS
% ~~ a'ra

Client DNR/DOW-EqkRiKz
Submitted By M y hdrwcr
Date Submittat Summer 1991
I -pk Aluminum * M u m CadKIium
Units UdL Uan ug/L Uplr. u ~ L EPA Metbod A D 0029 ZOG! AES0029 2U.2 2lgZ
Detectioa bimit 5 1 .o 5 1.0 1.0 Anal* Date IS Nov9l 6 k 9 1 IS b 9 1 5 h 9 1 4DdC91
RPD 8.7 1.1 1.6 1.1 23 k Recovery 104 94 102 93 104
APP- 9. Date \%)kCq\

Client: DNR/DOW - Eagle River
Submitted By: Mary Mum
Date Submitted: Summer 1991
Lud Zinc
Units €PA M e t M
Deteaion Limit Aualysis Date
RPD 70 R~ec~vcry
Jim Vohden, *mist - 27 -

Units EPA Me tbd
Detection Limit Analyair Date
BPD %IlecQVEly


NORTHERN TESTING LABORATORIES, INC. 3330 INDUSTRIAL AVENUE 2505 FAIRBANKS STREET
(907) 456-3116 FAX 4564125 (907) 277- FAX 274.9645
-- -- - - -
Alaska Department of Natural Reeourcee Report Date: 08/05/91 DNR-DGGS P.O. Box 772116 RECEIVED Date Arrived: 07/12/91 Eagle River AK 99577 Date Sampled: 07/Q9/91
TFme Sampled: 1330 Attn: ~ a r y Maurer AUS 0 7 1991 Collected By: MAM
Div. of Geological Survey Flag Definitiono
Eagle River U = Below Detection Limit DL Stated in Reeult
Our Lab if: A111977 B - Below Regulatory Hin. ~ocation/Project: Nikiuki Ground Water IIIA H = Above Regulatory Max. Your Sample ID: Carroll Well E = Below Detection Limit Sample Matrix: Water Eethated Value conwents : Laboratory Date Number Method Parameter Unite Reeult Flag Analyzed ............................................................................................. A111977 EPA502.2 Benzene
Bromobenzens Bromochloromethane Bromodichloromethane Bromof o m Br-thane n-Butylbenzene eec-Butylbenzene tert-Butylbenzene Carbon Tetrachloride Chlerobenzene Dibromochloromethane Chloroethane Chlorof o m Chloromethane o-Chlorotoluene p-Chlorotoluene 1,2-DFbromo-3-Chloropfopane Dibromomethane 1,4-Dichlorobenzene m-Dichlorobenzene o-Dichlorobenzene Dichlorodifluoromethane 1,l-Dichloroethane 1,2-Dichloroethane I, 1-Dichloroethylene cia-1,2-Dichloroethylene trans-1,2-Dichloroethylene Methylene Chloride l,2-Dichloropropane
Reported By: William E. Buchan Anchorage Operations Manager

NORTHERN TESTING LABORATORIES, INC. 3330 INDUSTRIAL AVENUE FAIRBANKS. A U S K A 99701 (907) 456-3116 FAX 45&-3125 2505 FAIRBANKS STREET ANCHORAGE. ALASKA 99503 (901) 277-8378 FAX 274.9645
- RECEIVED
Biv. of Geological Survey Eagle River
Laboratory Date Number Met hod Parameter Unitm Result Flag Analyzed
- . ............................................................................................. 8111979 EPA 502.2 2,2-Dichloropropane ug/ 1 1.0 U 07/19/91
. . 1,l-Dichloroprspene ~ 9 1 1 Q.5 U 1,3-DFchloropropens ug/l Q.2 U Ethylbenzene ug/l 0.2 U l,2-bibromoethane ug/ 1 1.8 U Trichlorofluor~thane ug/l 0.5 U Xexachlarobutadiene ug/ 1 0.3 U Imopropylbeazene ug/l 0.3 U p-Ieopropyltoluene ug/ 1 0.3 U Naphthalene ug/ 1 0.3 U n-Propylbenzene ug/ 1 0.3 U Styrene ug/ 1 0.2 U l,l,l,2-Tetrachloroethane ug/ 1 0.2 U 1,1,2,2-Tetrachloroethane ug/ 1 0.3 U Tetrachloroethylene ug/l 0.2 U Total Trihalomethane ug/l 2 U Toluene ug/l (3.3 U 1,2,3-Trichlorobenzene ug/l 0.3 U 1,2,4-Trichlorobenzene ug/ 1 0.3 U l,l,l-Trichloroethane ug/ 1 0.2 U 1,1,2-Trichloroethane ug/ 1 0.4 U Triehloroethylene ug/ 1 0.2 U 1,2,3-Triehloropropane %?/ 1 Q.3 U 1,2,4-Trimethylbenzene ug/ 1 0.2 U 1,3,S-Trimethylbenzene UU/ 1 0.2 U Vinyl Chloride ug/ 1 2.0 U m,p-Xylenea ug/ 1 0.4 u s-Xy lene W / l 8.2 U 1-Chloro-2-fluorobenzene (Recovery) O 82.0
Reported By: William E. Buchan Anchorage Operations Manager

NORTHERN TESTING LABORATORIES, INC. 3330 INOUSTRIAL AVENUE M I R W K S . ALASKA 99161 (W) 456-3116 FAX 456.3125 2505 FAIRBANKS STREET ANCHORAGE. ALASKA 94563 (907) 2774378 * FAX 274.4645
Alaska Department of Natural Reoourcen Report Date: 08/05/91 Dm-DCCS p . 0 . Box 772116 RECEIVED Date Arrived: 07/12/91 Eagle River M 99577 Date Sampled: 07/09/91
AL'G 0 7 !9!?1 TFme Sampled: 1845 Attnr Mary Mauret Collected By: MAX
Dive of Geological survey Flag Definitions Eagle River U = elo ow Detection Limit
DL Stated in Result Our Lab #: A111938 B = Below Regulatory Min. Location/Projectf Nfki8kL Ground Water IIIA B = W o v e Regulatory Max. Your Sample ID8 Gordon Well C = Below Detection Limit Sample Xatrixr Water C o m n t s : Laboratory Numb.r Met hod Parlauter ......................................................... A111978 EPA 502.2 Banzene
Broc~obenzene Bromochloromethane lromodichloromethane Bromof o m Ilromomethane n-Butylbenzene aec-Butylbenzene tort-Butylbenzene Carbon Tetrachloride Chlorobenzene Dibromochloromethane Chloroethane Chlorof o m Chloromethane o-Chlorotoluene p-Chlorotoluene 1,2-Dibroaro-3-Chloropropane Dibr-thane 1 , 4-Dichlorobenzene m-Dichlorobenzene e-Dichlorobenzene Dichlorodifluoromethane 1,l-Dichloroethane 1,2-Dichloroethane 1,l-Dichloroethylene ci8-1,2-Dichloroethylene trane-1,2-Dichloroethylene Methylene Chloride 1,2-Dichloropropane
EmtFmated Value
Date Result Flag Analyzed .---------------------------
0.2 U 07/19/91 0.3 U 0.3 U 0.2 u 1.0 u 2 . 0 U 0 . 3 U 0.3 U 0 .5 U 0.2 u 0.2 U 0.4 U 2.0 U 0.2 U 2.0 u 0.3 U 0.2 u 2.0 U 0.4 U 0.2 U 0.2 U 0 .2 u 2.0 u 0.2 U 0.2 U 1.0 U 0.2 u 0.2 u 1.0 U 0.2 U 0.2 U
Reported By: ~ i l l i u . Buchan Anchorage Operations Manager
NORTHERN TESTING LABORATORIES, INC. 3330 INDUSTRIAL M N U E FAIRBANKS. ALASKA 99701 (907) 456-3116 FAX 456-3125 2505 FAIRWNG STREET ANCHORAGE. ALASKA 99503 (907) 2778378 FAX 274.%45
RECEIVED
Div. of Geological S~rveY Eagle River
Laboratory Date Number Method Parameter Unhto Lamult Flag AnaLyzec .- . -YI--Y--------P-U--__-..--------------------------------~----------~-----------------
A111978 EPA 502.2 2,P-DFshloropropane ug/l 1.0 U 07/19/9 1, 1-Diehloropropne ug/l 0.5 U l,3-Dichloropropene ug/ 1 0.2 U Bthylbanzene ug/l 0.2 U 1,2-BFtaromeethane ug/l 1.0 U Trichlorofluoromethane ug/l 0.5 U Hexachlorobutadiene ug/ 1 0.3 U Isopropylbnzene ug/l 0.3 U p-Ioapropyltoluene ug/ 1 0.3 U Naphthalene ug/l 0.3 U n-Prapylbenzene ug/l 0.3 U Styrene ug/l 0.2 U 1,1,1,2-Tetraehloroethane ug/l 0.2 U 1,1,2,2-Totrachloroethane ug/l 0.3 U Tetrachlaroethylene ug/l 0.2 U Total Trihalomethane ug/ 1 2 U Toluene ug/l 0.3 U 1,2,3-Trichlorobenzene ug/ 1 0.3 U 1,2,0-Trichlorebenzene ug/ 1 0.3 W l,l,l-Trichloroethane UP/L 0.2 U 1,1,2-Trichloroethane ug/l 0.4 U Trichloroethylene ug/l 0.2 61 1,2 ,'a-~richloropropane ug/ 1 0.3 U 1,2,4-Trimthylbenzene ugll 0.2 €I
1,3,4-Trimethylbenzene ug/l 0.2 U Vinyl Chloride ug/l 2.8 U m,p-Xylenee ug/ 1 0.4 U e-Xylene ug/l 0.2 U 1-Chloro-2-fluorobenzene (Recovory) I 82.8
e r L c L'L /
Reported By: William E. Buchan Anchorage Operations Manager

NORTHERN TESTING LABORATORIES, INC. 3330 INWSlRlM WEHUE FAIRBANKS, ALASKA 9glOl (gg7) 456-3116 FAX 4563125 2% FAmUNKS STREET ANCHORAGE. ALASKA 99503 (BOn ZT?-83?8 FAX 214.W
Alaska Department of Natural R&#ourcee DNR-DCCS P.O. Box 972116 Eagle River AK 99577
Attn: Mary Uaurer
Report Date: 08/05/91
Date Arrivedz 07/12/91
R-ECEIVED Date Sampled: 07/10/91 Tima Sampled: 1525 Collected By: HAM
Flag Definitions U = &low Detection Limit
Div. of Geological SurVeY DL Stated in Reault Our Lab #: A11197 9 Eagle River 8 Below Rvlatory Hin. ~ocation/Projectr Hikiskf Ground Water IIIA H - Above Regulatory Max. Your Sample ID: Leuenhagen We11 E = Below Detection Limit Sample Matrix: Water Emtimated Value Comiantm : ~aboratory Date Number net hod P u m t e t Unit. Result Flag Analyzed ........................................................................................... A111979 EPA 502.2 ~onzen. ug/ I 0.2 u 07/19/91
Bremobenzene ug/ 1 0.3 U Br?omochlor~thane ug/l 0.3 U Bromodlchloromethane ug/l 0.2 U Btoorof o m u!?/ 1 1.0 U Branoamthane ug/ 1 2.0 U n-lutylknzenu UO/ 1 0.3 U sac-Butylbenzene ug/ 1 0.3 U tart-Butylbenzene ug/l 0.5 U Carbon Tetrachloride ug/l 0.2 U Chlorolnnzene ug/l 0.2 U Dibroawrchloramthane ug/l 0.4 U Chloromthane ug/ 1 2.0 U Chloref o m ug/ 1 0.2 U Chloromethane ug/l 2.0 U o-Chlorotoluene ug/ 1 0.3 U p-Chlorotoluene ug/ 1 Q.2 U 1,2-Dibraw-3-Chloropropane ug/ 1 2.0 U Dfbrnmrmrthanr ug/ 1 0.4 U l,4-Dichlsrobenzene ug/ 1 0.2 U rDfchlorobentene ug/ 1 0.2 U o-Dichlorobmnzene ug/ 1 0.2 U Bichlorodifluorol~ethane ug/ 1 2.0 U 1,l-Dichloroethane ug/l Q.2 U 1,2-Dichloroethane ug/l 0.2 U 1,l-Dichloroethylene ug/l 1.0 U cia-1,2-Dichloroethylene ug/ 1 0.2 U trans-1,2-Dichloroethylene ug/ 1 0.2 U Methylene Chloride ug/ 1 1.0 U 1,2-Dichloropropane ug/l 0.2 U
(': 1,s-bichloropropane
Reported By: ~ i l l i a m k Buchan Anchorage operations Manager

NORTHERN TESTING LABORATORIES, INC. XU0 INOUSTRIAL AVENUE FAIRBANKS. ALASKA Will1 (907) 4-3116 FAX 456-3125 2505 FALRBANKS STREET ANCHORAGE. A M K A 99503 (907) 277-8378 FAX 274.9645
- R E C E I V E D
01 Geological Survey Eagle River
Laboratory Date Nutnber Met hod Parameter Unite Result Flag Analyzed -----P--~---~--OU-PI_0-8-P-IP--------------------~~--------------------.---------------~---------------
A111979 EPA 502.2 2,2-Dichlorepropene ug/ 1 1.0 U 07/19/91 1,l-Dichloropropne W/ 1 0.5 U 1,3-Dichloropropene ug/l 0.2 U Ethylbenzene 0.2 U 1,2-Dibromoethane ug/l 1.0 U Trichlorofluoromethane ug/l 0.5 U Hexachlorobutadiene ug/l 0.3 U Ioepropylbenzens ug/l 0.3 U p-Imopropyltoluone ug/P 0.3 U Naphthalene ug/ 1 0.3 U n-Propylbenzene ug/l 0.3 Y styrene ug/ 1 0.2 U 1,1,1,2-Tetrachloroethane ug/l Q . 2 U 1,1,2,2--Tetrachloroethane ug/l Q.3 U Tetrachloroethylene ug/l 0.2 U Total Trihalomethane ug/b 2 U Toluene ug/l 0.3 U 1,2,3-Trichlorobenzene ug/ 1 0.3 U f,2,4-Trichlotsbenzene ug/l (3.3 U l,l,l-Trichloroethane ug/a 0.2 U 1,1,2-Trichlorocethane ug/l 0.4 U Trichloroethylene ug/l 8 . 2 U 1,2,3-Trichlotepropane ug/ 1 0.3 U 1,2,4-Tri.umthylbenzene ug/ 1 0.2 11 1,3,5-Trimethylbenzene ug/ 1 0.2 U Vinyl Chloride ug/l 2.0 U m, p-Xyleneo ug/ 1 0.4 U e-xylene ug/ 1 0.2 U l-Chloro-2-fluorobenzgne (Recovery) % 69.0
Reported By: William E. Buchan Anchorage Operations Manager

NORTHERN TESTING LABORATORIES, INC. 3330 INDUSTRIAL MIENUE 2505 FMRBANKS STREET
FAIRBANKS ALASKA 99701 ANCHORAGE. ALASKA 99503
(907) 4563116 FAX 456-3125 (907) 277-0378 FAX 274-9645
- -- - -
Alaaka Deputsaent of Hatural Remourcem Report Date: 08/05/91 DNR-DGGS P.O. Box 972116 RECEIVED Date Arrived: 07/12/91 Eagle River AK 99577 Date Sampled: 07/11/91
T h e Sampled: 1335 Attn: Mary Maurer ~ 1 1 1 ' vu 0 7 !y'! Collected BY: MAX
Div. of Geological Survey Eagle River
Our Lab #: A111980 Eoc&tion/Project: Nikiski Ground Water IIIA Your Samplm ID: Van Sky Well Sample Matrix: Water ~ocmentn : Laboratory Number Met hod Parameter ....................................................... A111980 EPA 502.2 Benzene
Breambenzene Bromochloromethane B~ichlortnnethane Bromof o m Bromrwnethane n-Butylbsnzene sac-Butylbenzene tort-Butylbenzene Carbon Tetrachloride Chlorobenzene Dibromochloromethane Chloroethane Chlorof o m Chloremethane o-Chlorotoluene p-Chlorotoluene 1,2-Dibromo-3-Chloropropane DFbr-thane 1,4-Dichlorobenzene m-Dichlorobenzene o-Dichlorobenzene bichlorodifluoromethane 1, 1-Di chloroethane 1,2-Dichlsroethane 1,l-Dichloroethylene cia-1,2-Dichloroethylene trans-1,2-Dichloroethylene Methylene Chloride 1,2-Dichloropropane
sj& E L @d 1,3-Dichloropropane Reported 6 5 : William E.\~uchan Anchorage Operations Manager
Flag Definition6 U = Below Detection Limit
DL Stated in Remult B = Below Regulatory Min. R = Above Regulatory m x . E = Below Detection L i m i t
Emtimated Value
Date Unitm Result tlag Analyzed .................................. ug/l 0.2 U 07/19/91 ug/ 1 0.3 U ug/ 1 0.3 u ug/ 1 0.2 U ug/ 1 1.0 U UP/ 1 2.0 0 ug/l 0.3 U ug/ 1 0.3 U ug/ 1 0.5 U UP/ 1 0.2 u ug/ 1 0.2 U ug/ 1 0.4 U ug/ 1 2.0 u UP/ 1 0.2 u ug/ 1 2.0 U ug/ 1 0.3 U ug/ 1 0.2 U ug/l 2.0 U ug/ 1 0.4 U ug/ 1 0.2 rJ UP/ 1 0.2 u ug/ 1 0.2 u ug/l 2.0 u ug/l 0.2 U ug/l 0.2 U UP/ 1 1.0 U ug/l 0.2 u ug/ 1 0.2 U ug/ 1 1.0 u ug/l 0.2 U ug/ 1 0.2 u

NORTHERN TESTING LABORATORIES, INC. 3330 INWSTRLAL AVENUE FAIRBANKS ALASKA 99iU1 (W7) 456.3116 FAX 456.3125 2505 FAlABANKS STREET ANCHORAGE. ALASKA 99503 (907) 2778328 FAX 274.9645
RECEIVED
Diva of Geological Survey Eagle River
Laboratof y Number Method Parameter
Date Unitr Remult Flag Analyzed
-------~------Y---U---u---w----------------------------------------------------------------
A111980 EPA 502.2 2,2-Dichloropropane ug/l 1.0 U 07/19/91 1, 1-Dichloropropene ug/l 0.5 U l,3-Dichloropropene ug/ 1 0.2 U Ethylbenzene ug/ 1 0.2 U 1,2-Dibrsmoetkane ug/ 1 1.0 U Trichlorofluorsmethane ug/ 1 0.5 U Bexachlorobutadiene ug/ 1 0.3 U Imopropylbenzene ug/ 1 0.3 U pIaopropyltoluene ug/ 1 0.3 u Naphthalene ug/ 1 0.3 U n-Prepylbenzene ug/ 1 0.3 U styrene ug/ 1 0.2 U 1,1t1,2-Tetrachloroethane us311 0.2 u 1,1,2,2-Tetrachloroethane ug/ 1 0.3 U Tetrachloroethylene ug/l 0.2 U Total Trihalomethane ug/l 2 U Toluene ug/l Q.3 U 1,2,3-Trichlorobanzene ug/l 0.3 U 1,2,4-Trichlorobenzene ug/ 1 0.3 U f,l,l-Trichloroethane ug/l 0.2 U l,lt2-Trichloroethane ug/ 1 0.4 U Trichloroethylene ug/ 1 0.2 U 1,2,3-Trichloropropane ug/ 0.3 U 1,2,4-Trimethylbenzene KT/ 1 0.2 U 1,3,5-Trimethylbenzene ug/ 1 0.2 W Vinyl Chloride Wl/ 1 2.0 U m,p-Xylenee ug/ 1 0.4 U o-Xylene ug/ 1 0.2 u 1-Chloro-2-fluorobenzene (Recovery) % 74.0
Reported By: William E. Buchan Anchorage Operatione Manager

NORTHERN TESTING LABORATORIES, INC. 3330 INDUSTRIAL AVENUE FAIRBANKS. A M K A I19ml (907) 4W3116 FAX 4563125 2505 FAICIBANKS STREET A N C W E . A W 99503 (907) 2778328 FAX 274.9645
Alamka Department of Natural Re8ources Dm-DGCS P.Q. Box 772116 Eagle River AK 99577 RECEIVED Attn: nary Maurer
Our Lab #: Location/Projactt Your Sampla ID: Sample Matrix: comment a : Lhratory umber net hod
Div. of Geological Survey Eagle River
A111981 Hikimki Ground Water IIIA Travel Blank Water
Repert Date: 08/05/91
Date Arrived: 07/12/91 Date Srmpled: 07/09/91 Time Sampledr - Collected By: M M
Flag Definitions U = Below Datection Lhit
DL Statad in Result B = 8mlow Regulatory Mfn. H = Above Regulatory Max. E = -low Dotaction Lhbt
Emtimatad Valua
Date Units Remult ?lag Analyzed
--------------- -- - ---- -- -- -
~1119a1 EPA 502.2 Benzene ug/ 1 0.2 u 07/19/91 Erromohnzene u9/ 1 0.3 tl Brooochloromethane ug/ 1 0.3 U BroQodichlormethane ug/l 0.2 U B~~lasform ug/l 1.0 u Bramamethane ua ll 2 - n u n-Butylbenzene sac-Eutylbenzene tert-Butylbenzene Carbon Tetrachloride Chlorobenzene Dibrunochloromethane Chloroethane Chlorof o m Chloromethane o-Chlorotoluene p-Chlorotoluene 1,2-Dibromo-3-Chloropropane DiBrrmmvthane l,4-Dichlorobenzene m-D~chlorobenzene o-Dichlorobenzene Dichlorodidluoromethane 1,l-Dichloroethane 1,2-Dichloroethane 1,l-Dichloroethylene cia-1,2-Dichloroethylene tranr-1,2-Dichloroethylene Uathylene Chloride 1,2-Dichloropropane 1,3-Dishloropropane
Reported By: William E.-uchan Anchorage Operatione Manager

NORTHERN TESTING LABORATORIES, INC. 3330 INDUSTRIAL AVENUE FAIRBANKS. ALASKA 99701 (907) 456-3116 FAX 456.3125 2505 FAIRBANKS STREET ANCHORAGE. ALASKA 99503 (407) 277438 FAX 274-9645
RECEIVED
Div. of Geological Survey Eagle River
Laboratory Number Mat hod Parameter
Date Units Reoubt Flag Analyzed
A111981 EPA 502.2 2,2-Dichlorapropane ug/l 1, 1-Dichloropropene ug/l l,3-Dichloropropene ug/l Ethylbenzene ug/ 1 1,2-Dibromoethane UQ/ 1 Trichlorofluor~thane ug/ 1 Hexachlorobutadiene ug/ 1 Isopropylbencene UP/ 1 p-~mopropyltoluone ug/l Naphthalene ug/l n-Propylbenzene ug/ 1 Styrene ug/l 1,1,1,2-Tetrachloroethane ug/l l,f,2,2-Tetrachloroethane ug/l Tetrachloroethylene ug/l Total Trihalomethane ug/l Toluene ug/l 1,2,3-Trichlorobenzene ug/l 1,2,4-Trichlorobenzene ug/l l,l,l-Trichloraethane ug/ 1 ltl,2-Trichloroethana ug/ 1 Trichlorsethylene ug/l 1,2t3-Trichloropro~ne ug/ 1 1,2,4-Trhethylbentena ug/ 1 1,3,5-Trimethylbenzune ug/ 1 Vinyl Chloride u9/l m,p-Xylenee ug/ 1 o-Xylene ug/ 1 1-Chloro-2-fluorobenzene (Recovery) %
-- Reported By: W i l l i a m E. Buchan Anchorage Operations Manager

NORTHERN TESTING LABORATORIES, INC. 3UO INWSTRIAL AVENUE FAIRBANKS. AUSKA ~ m 1 (907) 4563116 FAX 456.3125 2505 F A I R W K S STREET ANCHORAGE. AUSKA 89503 (907) 277-8378 FAX 274-9645
Alaska Division of Wafer Report Date: 08/13/91 P.0, Box 772116 Eagle River AK 99577
R E C E I V E D Date Arrived: 07/19/91 Date Sampled: 07/12/91 T h e Sampled: 1330
Attn: Mary A. Uaurer E ! ic 1 ;, ]9?!. Collected By: KAM
Flag Definitions Div. of Geological Survey U = Below Detection hit
Eagle River DL Stated in Result Our - -- Lab #:
.* 2 -- l C I - - . L - - L - -carLon/ r r w j r r ; r ; L J ~ U ~ S
Your Sample ID: Bowlin Well - . * , - *.- L - ~-
B = Below Regulatory Uin. . - . - - . L .._ n = rrwve KeguLacory nu . E = Below Detection Limit
- . . . . - - . aampre nazr~x: warer EBC matea value Comments r Laboratory Date Number Met hod Parameter Units Result Flag Analyzed ........................................................................................... A112158 EPA 502.2 Benzene ug/l 0.2 U 08/04/91
Bromobenzene ug/l 0.3 U Branochlorornethane ug/l 0.3 U Bromadiehlormethane ug/ 1 0.2 U B r m f o m ug/ 1 1.0 U Bromomethane us11 2.0 U n-Butylbenzene ug/l 0.3 U eec-Butylbenzene u9/ 1 0.3 U tert-Butylbenzene 091 1 0.5 U Carbon Tetrachloride ug/ 1 0.2 U Chlorobenzene ug/ 1 0.2 U Dibromochloromethane ug/ 1 0.4 U Chloroethane ug/ 1 2.0 U Chloraf o m ug/ 1 0.2 U Chloromethane ug/ 1 2.0 V o-Chlorotoluene ug/ 1 0.3 U p-Chlorotoluene ug/ 1 0.2 U 1,2-Dibromo-3-Chloropropane ug/l 2.0 U Dibromomethane ug/ 1 0.4 U 1,4-Dichlorobenzene ug/ 1 0.2 U m-Dichlorobenzene ug/l 0.2 U o-Dichlorobenzene ug/l 0.2 U Oichlorodifluoromethane ug/ 1 2.0 U 1,l-Dichlorsethane ug/ 1 0.2 U 1,2-Dichloroethane ug/ 1 0.2 U 1,l-Dichloroethylene ug/ 1 1.0 U cia-1,2-Dichloroethylene ug/l 0.2 U trane-1,2-Dichloroethylene ug/l 0.2 U Hethylene Chloride ug/ 1 1.0 U
* < 1'2-Dichleropropane ug/ 1 0.2 U 1,3-Dichloropropane u9/ 1 0.2 U
Reported By: William E. Buchan Anchorage Operations Manager

NORTHERN TESTING LABORATORIES, INC. 3330 INDUSTRIAL M N U E FAIRBANKS. ALASKA 99701 (907) 4S3116 FAX 456-3125 2505 MIREANKS STREET ANCHORAGE. ALASKA 99503 (907) z n m FAX 274.9645
Div, of ~eologica\ S U @ ~ Eagle River
Laboratory Nuftlber Met hod Parameter Unit8
.. . - -P- - - - - - - -_ - - - . - - - - - - - - - - - - - - - - - - - - - - - - - - - - - - - - - - - - - - - - - - - - - -m-- - -
A112158 EPA 582.2 2,2-Dichloropropane UP/ 1 1,l-Dichloropropene u$/ 1 l,3-Dichloropropne ug/ 1 Ethylbenzene ug/l 1,2-Dibromoethane ug/ 1 Trichlorofluor~thene u$/ 1 Hexaehlorobutadiene ug/l Isopropylbenzene UP/ 1 p-Isopropyltoluene ug/l Naphthalene ug/ 1 a-Propylbenzene ug/ 1 Styrene ug/ 1 1,1,1,2-Tetrachloroethane ug/ 1 1,1,2,2-Tetrachloroethane u%/ 1 Tetrachloroethylene u%/ 1 Total Trihalomethane u%/ 1 Toluene ug/ 1 1,2,3-Trichlorabenzene ug/ 1 1,2,4-Trichlorobenzane ug/ 1 l,l,l-Trichloraethane ug/ 1 1,1,2-Trichlsroethane US!/ 1 Trickloroethylens ug/ 1 1,2,3-Trichloropropane ug/ 1 1,2,4-Trimethylbenzene ug/ 1 1,3,5-Trimethylbenzene " ug/ 1 Vinyl Chloride ug/ 1 m,p-Xylenea USI/ 1 o-Xylene U S I / ~ 1-Chloro-2-fluerobenzene (Recovery) t
Date Raault Flag Analyzed ---------------------------
1.0 W 08/04/91 0 . 5 U 0.2 u 0.2 U 1.0 w 0.5 U 0.3 U 0.3 U 0.3 U 0.3 Y 0.3 w 0.2 u 0.2 u 0.3 U 0.2 U
2 U 0.3 u 0 . 3 U 0.3 U 0.2 u 0.4 U 0.2 U 0.3 U 0.2 u 0.2 U 2.0 U 0.4 [d
0.2 U 82.0
Reported By: William E. Buchan Anchorage Operati~ns Manager

NORTHERN TESTING LABORATORIES, INC. 3330 INDUSTRIAL AVENUE FAIRBANKS. ALASKA 99701 (807) -3116 FAX 456-3125 2505 FAIRBANKS STREET ANCHORAGE. ALASKA 99S3 (907) 2778378 FAX 274-9645
Alaska Division of Water P.O. Box 772116 Eagle River AK 99597
Attn: Mary A. Maurer R E C E I V E D
Report Date: 08/13/91
Date Arrived: 09/19/91 Date Sampled: 09/12/91 Time Sampled: 1545 collected By: MAX
Flag Definition. u = Detaction e hit
DL Stated in Reault Our Lab #: A112159 B = Below Regulatory Hin. ~~.tion/project : 239055 Div. 01 Geological SUBeY
Eagle River H = Above Regulatory Max. Your Sample ID: Hunt Well E = Below Detection bit Sample Matrix: Water Eotbated Value Cocamenta : Laboratory Numb.r Method Parameter Units ...................................................................... A112159 EPA 502.2 Benzene ug/ 1
Bromobenzene ug/l Bromochloromethane ug/ 1 Bromodichlaramethane ug/ 1 B r m f o m ug/b Bromomethane ug/l n-Butylbenzene ug/l nec-Butylbenzene ug/ 1 tert-Butylbentene ug/ 1 Carbon Tetrachloride ug/ 1 Chlorobenzene ug/l Dibromochloromethane ug/ 1 Chloroethane ug/ 1 Chlorof o m ug/ 1 Chloromethane ug/ 1 o-Chlorotoluene ug/ 1 p-Chlorotoluene ug/ 1 1,2-Dibrmo-3-Chloropropane ug/l Dibrot~omethane ug/ 1 1,4-Dichlorobenzene ug/ 1 m-Diehlorobenzene ug/ 1 o-Dichlorobenzene ug/ 1 Dichlorodifluoromethane UP/ 1 1,l-Dichloroethane ug/ 1 1,2-Dichloroethane ug/ 1 f,l-Dichloroethylene ug/ 1 sf.-1,2-Dichloroethylene ug/ 1 trans-1,2-Dichloroethylene ug/ 1 Xethylene Chloride ug/l 1,2-Dichleropropane ug/ 1
/chlOroprOpane
ug/ 1
Anchorage Operations Manager
Date Result Flag Analyzed

NORTHERN TESTING LABORATORIES, INC. 3330 INDUSTRIAL AVENUE FAIRBANKS. ALASKA 99701 (907) 4553116 FAX 456-3125 2505 FAIRBANKS STREET ANCHORAGE. ALASKA 94503 (907) 2778518 m FAX 2 7 4 . ~ 5
I-
Div. of Geological S U ~ Eagle River
Laboratory Date Number Method Parameter Unito Reeult Flag Analyzed -P- - - - - - - -Y- - - - -O- - - - - - - - -~- - - - - - - - - -~- - - - - - - - - - - - - - - - - - - - - - - - - - - - - - - - - - - - - - - -m-"- - - - - - - - - - -
A112159 EPA 502.2 2,2-Diehloropropane ug/ 1 1.Q U 08/04/91 l,l-Dichlsropropene UQ/ 1 0.5 U l,%-Bichloropropene ug/ 1 0.2 U Ethylbenzene % I / 1 0.2 U 1,2-Dibromoethane ug/ 1 1.0 U Trichlo~ofluorsmekhane ug/ 1 0.5 U Hexachlorobutadiene u9/l 0.3 u Isopropylbenzsne %I/ 1 0.3 U p-Isopropylfoluene ug/ 1 0.3 U Naphthalene ug/l 0.3 U n-Propylbenzene ug/ 1 0.3 U styrene ug/ 1 0.2 u l,l,l,2-Tetrachloroethane ug/ 1 0.2 U 1,1,2,2-Tetrachloroethane rag/ 1 0.3 U Tetracklorsethylene ug/ 1 0.2 U Total Trihalomethana UO/ 1 2 U Toluene ug/ 1 0.3 U 1,2,3-Trichlorobenzene ug/ 1 0.3 U 1,2,4-Trichlorobenzene ug/ 1 0.3 U l,l,l-Trichloroethane ug/ 1 0.2 U 1,1,2-Trichlorsethane ug/ 1 0.4 CI Trichloroethylene ug/ 1 0.2 U 1,2,3-Trichloropropana ug/ 1 0.3 tJ 1,2,4-Trimethylbenzene ug/ 1 0.2 U f,3,5-Trimethylbenzene ug/ 1 0.2 U Vinyl Chloride ug/l 2.0 U m,p-Xylenes W/ 1 0.4 U e-Xy lene ug/l 0.2 u I-Chlero-2-fluorobenzene (Recovery) t 93.0
- Reported By: William E. ~uchan Anchorage Operations Manager

NORTHERN TESTING LABORATORIES, INC. 3330 INDUSTRIAL AVENUE 2505 FAIRWKS STREET
FAIRBANKS. AUSKA 59701 ANCHORAGE. ALASKA 99543
(9071 4S3116 FAX 4563125 (W7) m-838 FAX 274-9645
Alaska Divinion of Water P.O. Box 772116 Eagle River AK 99577
Attn: Mary A. Haurer
Our Lab #: All2160 ~ocation/Preject: 239055 Div, at ~eo log ica \ S U ~ W Your Sample ID: Valentine Well Eagle River Sample Matrix: Water comments : Laboratory Number net hod Puameter ......................................................... A112160 EPA 502.2 Benzene
Braaobenzene Brotaochloromethane Brdiehloromethane Bromof o m Bromomet hane n-Butylbenzene sec-Butylbenzene tart-Butylbenzene Carbon Tetrachloride Chlorobenzene Dibromochloromethane Chloroethane Chlorof o m Chloromethane o-Chlorotoluene p-Chlsrotoluene 1,2-Dibromo-3-Chloropropane Dibromomethane 1,4-Dichlorobenzene m-Dichlorobenzene o-Dichlorobenzene BichlorodFfluoromethane 1,l-Dichlsroethane 1,2-Dichloroethane 1,l-Dichloroethylene cia-1,2-Dishloroethylene trans-1,2-Dichloroethylene Methylene Chloride 1,2-Dichloropropane l,3-Dichloropropane
Reported By: ~illim>~uchan
Report Date: 08/13/91
Bate Arrived: 07/19/91 Date Sampled: 07/12/91 Time Sampled: 1200 Collected By: MAM
Flag Definition8 U = Below Detection Limit
DL Stated in Reault B = Below Regulatory Hin. H = Above Regulatory Hax. E = Below Detection Limit
Eathated Value
Date Unite Result Flag Analyzed
.---------------------------------- u9/ 1 0.2 U 08/04/91 ug/l 0.3 U ug/ 1 0.3 U ug/ 1 0.2 u ug/ 1 1.0 U ug/l 2.0 U ug/ 1 0.3 U u9/l 0.3 U ug/ 1 0.5 U UP/ 1 0.2 u u9/ 1 0.2 U u9/ 1 0.4 U ug/l 2.0 U ug/ 1 0.2 U ug/ 1 2.0 U ug/ 1 0.3 u ug/ 1 0.2 U ug/l 2.0 u ug/ 1 0.4 U ug/ 1 0.2 u ug/ 1 0.2 U U Q / ~ 0.2 U UP/ 1 2.0 U u9/ 1 0.2 U ug/ 1 0.2 u ug/l 1.0 U ug/ 1 0.2 U ug/ 1 0.2 U ug/ 1 1.0 u ug/l 0.2 U ug/b 0.2 U
Anchorage Operations Manager

NORTHERN TESTING LABORATORIES, INC. 3330 INDUSTRIAL AVENUE FAIRBANKS. ALASKA 99701 1907) 456.3116 FAX 456.3125 2505 FAIRBANKS STREET ANCHOfUGE. ALASKA 99503 (907) 277&378 FAX 274.9645
R E C E I V E D
Div. ol Geological Sllryey Eagle River
Laboratory Date Number Met hod Parameter Unite Result Flag Analyzed ----------------------l-------------------------------------------------------------------------
A112160 EPA 502.2 2,2-BFchloropropane ug/ 1 1.0 0 08/04/91 l,l-Dichlorspropene USI/ 1 0.5 PI 1,3-Dichloropropene ug/ 1 8.2 U Ethylbenzene ug/l 0.2 u 1,2-Dibrornoethane ug/l 1.0 rJ Trichlorof luoromet hane ug/ 1 0.5 U HexechLorobutadiene ug/ 1 0.3 U Isoprepylbenzene U Y / ~ 0.3 U p-Ioopropyltoluene ug/l 0.3 U Naphthalene ug/l 0.3 U n-Propylbenzene ug/ 1 0 . 3 u Styrene ug/ 1 0.2 U 1,1,1,2-Tetrachloroethane ug/ 1 0.2 U 1,1,2,2-Tetrachlsrsethane ug/ 1 0.3 U Tetrachhoraethylena ug/l 0.2 U Total Trihalomethane ug/l 2 U Toluene ug/l 0.3 U 1,2,3-Trichlorohneene ug/ 1 (3.3 U 1,2,4-Trishlorobenzene ug/ 1 0.3 U %,f,l-Triehlorsethane ug/ 1 0.2 I1 f,l,2-Trichloroethane ug/l Q.4 W Trichloroethylene ug/l 0.2 U 1,2,3-Trichloroprepane U C J / ~ Q.3 U b,2,4-Trimethylbenzene ug/ 1 0.2 U 1,3,%-Trimethylbenzene ucf/ 1 8.2 U Vinyl Chloride ucf/ 1 2.0 u m,p-Xylenes ug/ 1 0.4 U o-Xylene ug/l 0.2 U 1-Chloro-2-fluorsbenzene (Recovery) % 95.0
- % U . I J & . F ~ ~ Reported By: William Buchan Anchorage Operations Manager
NORTHERN TESTING LABORATORIES, INC. 3a30 INDUSTRIAL AVENUE 2505 FAIRBANKS STREET
FAIRBANKS. AUSKA WPJl ANCHORAGE. ALASKA 99503
(907) 456.3116 FAX 056-3125 (907) 2774378 FAX 274.9645
Alaska Division of Water P.O. Box 772116 Eagle River AK 99577
Attn: Mary A. Maurer
R E C E I V E D I - lQ!>l ;! - 1 )
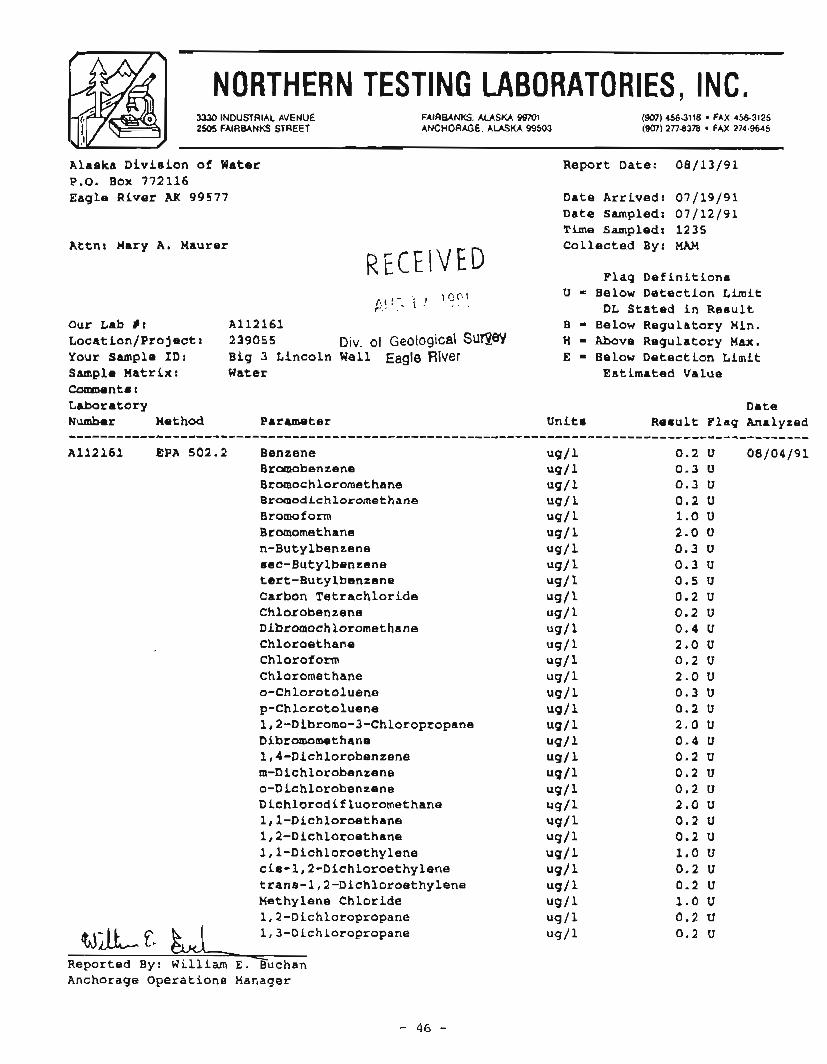
Our Lab C: A112161 Location/Project: 239055 Div. of ~eotogical SUflW Your Sample ID: Big 3 Lincoln Well Eagle Rlver Sample Matrix: Water Comments : Laboratory Number Met Rod Parameter
Report Date: 08/13/91
Date Arrived: 07/19/91 Date Sampled: 07/12/91 Time Sampled: 1235 Collected By: MAM
Flag Definitions U = Below Detection Limit
DL Stated in Result B = Below Regulatory Min. X = Above Regulatory Max. E = Below Detection Limit
Eat imated Value
Date Unite Reault Flag Analyzed
- - - - - - - - - - - - - - - - - - - - - - - -- . - - - - - - -
A112161 EPA 502.2 Benzene Bromobenzene Bromoehloromethane Bromodichloromethane Bromof o m Bromomethane n-Butylbenzene sec-Butylbenzene tert-Butylbenzene Carbon Tetrachloride Chlorobenzene Bibromochloromethane Chloroethane Chlorof o m Chloromethane 0-Chlorotoluene p-Chlorotsluene 1,2-Dibrorno-3-Chloropropane Dibromomethane 1,4-Dichlorobenzene m-Bichlorobenzene o-Dichlorobenzene Dichlorodifluoromethane f,l-Dichlormthane 1,2-Dichloroethane l,l-Dichloroethylene cis-1,2-Dichloroethylene trans-1,2-Dichloroethylene Methylene Chloride 1,2-Dichloropropane 1,3-Dichloropropane
Reported By: William E.=uchan Anchorage Operations Manager

NORTHERN TESTING LABORATORIES, INC. 3330 INDUSTRIAL AVENUE FAIRWNKS. ALASKA 99YO1 (907) 456.3116 FAX 456.3125 2505 FAIRBANKS STREET ANCHORAGE. ALASKA 99503 (907) 2TI-837B FAX 274-9645 --
R E C E I V E D
Div. of Geologica\ Survey Eagle River
Laboratory Date Number Method Parameter Units Result Flag Analyzed ............................................................................................. A112161 EPA 502.2 2,2-Dichlorspropane ug/ 1 1.0 U Q8/04/91
1, 1-Dichloropropene u9/ 1 0.5 U b,3-Dichloropropene UP/ 1 0.2 U Ethylbenzene ug/ 1 0.2 U I, 2-Dibromoethane 'Jg/ 1 1.0 U Trichlorofluoromethane ug/ 1 0.5 U Hexachlorobutadiene ug/ 1 0.3 U Ieopropylbenzene ug/ 1 0.3 U E)-Ieopropyltoluene UB/ 1 0.3 U Naphthalene ug/ 1 0.3 U n-Progylbenzene ug/ 1 0.3 U Styrene ug/ 1 0.2 U 1,1,1,2-Tetrackloroethane ug/ 1 0.2 U 1,1,2,2-Tetrachloroethane ug/ 1 0.3 U Tetrachleroethylena ug/ 1 0.2 U Total Trihalomethane ug/ 1 2 U Toluene ug/ 1 0.3 U 1,2,3-Trichlorobenzene ug/ 1 0.3 U 1,2,4-Trichlorobenzane ug/ 1 0.3 U l,l,l-Trichloroethane ug/ 1 0.2 U S,1,2-Trichloroethene ug/ 1 0.4 U Trichlorsethylene ug/ 1 0.2 U 1,2,3-Trichloropropnne UP/ 1 0.3 U 3,2,4-Trimethylbenzene ug/l 0.2 U 1,3,5-Trhethylbenzone ug/ 1 0.2 U Vinyl Chloride ug/l 2.Q U IU, p-Xylenes ug/l 0.4 U s-Xy lene ug/l 0.2 U
Reported By: William E. Buchan Anchorage 0perati.sns Manager

NORTHERN TESTING LABORATORIES, INC. 3330 INWSTRIAL AVENUE FAIRBANKS. ALASKA 99701 (907) 4S3116 FAX 4563125 2505 FAIRBANKS STREET ANCHORAGE. ALASKA 99503 (907) 277-8378 FAX 274.9645
Alaska Division of Water P.O. Box 772116 Eagle River AX 99577
Attn: Mary Maurer
Report Date: 08/13/91
Date Arrived: 07/23/91
R E C E ~ \ ~ ' E D Date Sampled: 07/19/91 Time Sampled: 1512
R I 1,- 1 , ?(;?' Collected By: MH
hl-:.Q 1 i l $ -
Flag Definitions Die gf Geological Survey U = Below Detection Limit
Eagle River DL Stated in Result Our Lab #: All2305 B = Below Regulatory Min. Location/Project: Nikiski Groundwater H = Above Regulatory Max. Your Sample ID: Hewberry Well E = Below Detection Limit Sample Matrix: Water Estimated Value comaants : Laboratory Date Number Met hsd Baremeter Unite Result Flag Analyzed _---P----------------------------------------------------------------------------------------
A112305 EPA 502.2 Benzene ug/ 1 0.2 u 08/07/91 Bromobenzene ug/ 1 0.3 U Bromochlorsmethane ug/l 0.3 U Br~dichloromethane ug/ 1 0.2 U B r a m f o m ug/ 1 1.0 U Bromoarethane ug/ 1 2.0 U n-Butylbenzene ug/ 1 0.3 U eec-Butylbenzene ug/ 1 0.3 U tert-Butylbenzene ug/ 1 0.5 U Carbon Tetrachloride ug/l 0.2 U Chlorobenzene ug/ 1 0.2 U BFbromochloromethane ug/ 1 0.4 U Chloroethane ug/ 1 2.0 U Chlorof o m ug/ 1 Q.2 U Chloromethane u9/1 2.0 U o-Chlorotoluene W / 1 0.3 U pChlorotoluene ug/l 0.2 0 1,2-Dibromo-3-Chloropropane ug/ 1 2.0 U Dibramomethane ug/l 0.4 U 1,4-DFchlorobenzene ug/ 1 0.2 U m-Dichlorobenzene ug/l 0.2 U o-Dichlorobenzene ug/l 0.2 U Dichlorodifluoromethane ug/ 1 2.0 U 1,l-Diehloroethane ug/ 1 0.2 U 1,2-Dichloroethane ug/ 1 0.2 U 1,l-Dichlsroethylene ug/l 1.0 U cis-1,2-Dichloroethylene ug/ 1 0.2 U trans-1,2-Dichloroethylene ug/ 1 0.2 U Methylene Chloride ug/ 1 1.0 U l,2-Dichloropropane ug/ 1 0.2 U
u t %LQ 1 , 3-Dichlo~opropane ug/l 0.2 U
Reported By: ~ i l l i a m l ~ u c h a n Anchorage Operations Manager

NORTHERN TESTING LABORATORIES, INC. 3330 INDUSTRIAL AVENUE FAIRBANKS. ALASKA 99701 (907) 4563116 FAX 456.3125 2505 FAIRWNKS STREET ANCHORAGE. ALASKA 99503 (907) 2774378 FAX 274-9645
R E C E I V E D
Div. of Geological SumeY Eagle River
Laboratory Date Number Method Parameter Units Reault Flag Analyzed ------------P---O--__--------------------------------------------------------------------------
A112305 EPA 502.2 %,2-Dichloropropane ug/ 1 1.0 U 08/07/91 1,l-Dichloropropene ug/ 1 0.5 U 1,3-Dichlorepropene ug/ 1 0.2 11 Ethylbenzene ug/l 0.2 U 1,2-bibrotnoethane ug/l 1.0 U Trishlorefluoromethane ug/ 1 0.5 U Hexachlorobutadiene ug/ 1 0.3 U Ieopropylbenzene ug/ 1 0.3 U p-Iaoprspyltoluene ug/ 1 0.3 U Naphthalene ug/ 1 0.3 U n-Propylbenzene ug/ 1 0.3 U Styrene ug/ 1 0.2 u 1,Y,1,2-Tetrachlsroethane W/ 1 0.2 U l,f,2,2-Tetrachloroethane u¶/ 1 0.3 U Tetrachloroethylene ug/ 1 0.2 U Total Ttihalamethane ug/ 1 2 U Toluene ug/ 1 0.3 U 1,2,3-Trichlorobenzene ug/ 1 0.3 U 1,2,4-Trichlorobenzene ug/ 1 0.3 U 1,9,1-Trichloroethane ug/ 1 0 . 2 U 1,1,2-Trichloroethane ug/ 1 0.4 U Trichloroethylene ug/l 0.2 U 1,2,3-Trichloropropane ug/ 1 0.3 U l,2,4-Trimethylbenzene ug/ 1 0.2 W 1,3,5-Trimethylbenzene ug/ 1 0.2 U Vinyl Chloride ug/ 1 2.0 W m, p-~ylenes ug/ 1 8.4 U o-Xy lene ug/ 1 0.2 U 1-Chloro-2-fluorobenzene (Recovery) %
Reported By: W i l l i a m ~ . - Anchorage Operations Manager

NORTHERN TESTING LABORATORIES, INC. 3330 INDUSTRIAL AVENUE FAIRBANKS. ALASKA 99701 (907) 456-3116 FAX 456-3125 2505 FAIRBANKS STREET ANCHORAGE. ALASKA 99503 (907) 277-0378 FAX 274.9645
Alaaka Division of Water P.O. Box 772116 Eagle River AK 99579
Attn: Mary Maurer
Our Lab #: Location/Project: Your Sample ID: Sample Matrix : comment e : Laboratory Number Method
RECEIVED
Dig. of Geological SuweY Eagle River
A112306 Nikiski Groundwater Harris Well Water
Parameter
Report Date: 08/13/91
Date Arrived: 07/23/91 Date Sampled: 07/20/91 Time Sampled: 1233 Collected By: MU
Flag Definitions U = Below Detection Limit
DL Stated in Result B = Below Regulatory Min. H = Above Regulatory Max. E = Below Detection L h i t
Estimated Value
Bate Units Result Flag Analyzed
A112306 EPA 502.2 Benzene Bromobenzene Bramochloromethane Bromodichloromethane Bromof o m Bromamethane n-Butylbenzene 6ec-Butylbenzene tert-Butylbenzena Carbon Tetrachloride Chlorobenzene Dibromochloromethane Chloroethane Chlorof o m Chloromethane a-Chlorotoluene p-Chlorotoluene 1,2-Dibromo-3-Chloropropane Dibromomethane 1,4-Dichlorobenzene m-Dichlorobenzene o-Dichlorobenzene Bichlorodifluorornethane l,l-Dichloroethane 1,2-Dichloroethane 1,l-Dichlsroethylene cis-1,2-Dichloroethylene trans-1,2-Dichloroethylene Methylene Chloride 1,2-Dichloropropane
Reported By: William C ~ u c h a n Anchorage Operations Manager

NORTHERN TESTING LABORATORIES, INC. 3330 INDUSTRIAL AVENUE FAIRBANKS. ALASKA 99701 (907) 456.3116 FAX 456.3125 2505 FAIRMNKS STREET ANCHORAGE. ALASKA 99503 (907) 277.8378 FAX 274.9645 -
R E C E I V E D
Div. of Geological Survey Eagle Giver
1,aboratory Date Number Met hod Parameter Units Result Flag Analyzed ............................................................................................. A112306 EPA 502.2 2,2-Dichlsropropane ug/ 1 1.0 U 08/07/91
1,l-Dichloropropene ug/ 1 0.5 U l,3-Dichloropropene ug/ 1 0.2 U Ethylbenzene ug/ 1 0.2 U 1,2-Dibromoethane ug/ 1 1.0 U Trichlorofluoromethane W / 1 0.5 U Hexachlorobutadiene ug/ 1 0.3 U feoprepylbenzene ug/ 1 0.3 u p-Isogropyltoluene ug/l 0.3 U Naphthalene ug/ 1 0.3 U n-Propylbenzene ug/ 1 0.3 U Styrene ug/l 0.2 U 1,1,1,2-Tetrachloroethane ug/ 1 0.2 U 1,1,2,2-Tetrachloroethane ug/ 1 0.3 U Tetrachloroethylene ug/ 1 0.2 U Total Trihalomethane ug/l 2 U Toluene ug/l 0.3 u 1,2,3-Trichlorobenzene W/ 1 0.3 U 1,2,4-Trichlorobenzene ug/l 0.3 U 1,1,1-Trichloroethane ug/l 0.2 U 1,1,2-Trichlorsethane ug/l 0.4 U Trichloroethylene ug/l 0.2 U 1,2,3-Trichloropropane ug/ 1 0.3 tl 1,2,4-Trimethylbenzene ug/l 0.2 U 1,3,5-Trimethylbenzene ug/l 0.2 U Vinyl Chloride ug/l 2.0 U m,p-Xylenee ug/l 0.4 U o-Xylene ug/ 1 0.2 U 1-Chloro-2-fluorobenzene (Recovery) % 88.0
w-, Ft &I- Reported By: William E. an Anchorage Qperations Manager

NORTHERN TESTING LABORATORIES, INC. 3330 INOUSTRIAL AVENUE FAIRBANKS. AUSKA 99281 (907) 456-3116 FAX 456-3125 2505 FAIRBANKS STREET ANCHORAGE. ALASKA 99503 (807) 2776378 FAX 274-5645
Alaeka Diviaisn sf Water P.O. Box 772116 Eagle River AK 99577 RECEIVED
Attn: Mary Maurer
Div. of Geological SUWY Eagle River
Our Lab #: A112307 Location/Project: Nikimki Groundwater Your Sample ID: Crixun Well Sample Matrix: Water comments : Laboratory Number Method Baramater ----0------------------------------------------------------
A112307 EPA 502.2 Benzene Brawbenzene Bromochloromethane BromodichLotomethane Bromof o m Braucnuethane n-Butylbenzene sec-Butylbenzene tert-Butylbenzene Carbon Tetrachloride Chlorobenzene Dibromochloromethane Chloroethane Chlorof o m Chlsromethane o-Chlorotoluene p-Chlorotoluene 1,2-Dibromo-3-Chloropropane Qibrw~tmethane 1,4-Dishlorobenzene m-Dichlorobenzene o-Dichlorobenzene Bichlorodifluoromethane 1,l-Dichloroethane 1,2-Dichloroethane 1,l-Dichloroethylene cia-1,2-Dichloroethylene trane-1,2-Dichloroethylene Methylene Chloride 1,2-Dichloropropane
b&F* & 1,3-Dichloropropane Reported By: William E. Buchan Anchorage Operations Manager
Report Date: 08/13/91
Date Arrived: 07/23/91 Date Sampled: 07/20/91 Time Sampled: 1803 Collected By: M4
Flag Definitions U = Below Detection Limit
DL Stated in Rerult B = Below Regulatory Min. H = Above Regulatory Max. E = Below Detection L i m i t
EetFmated Value
Date Units Remult Flag Analyzed

NORTHERN TESTING LABORATORIES, INC. 3330 INDUSTRIAL AVENUE FAIRBANKS. ALASKA 99701 (907) 456-3116 FAX 456-3125 2505 FAIRBANKS STREET ANCHORME. ALASKA 99503 (9071 2T7-8378 FAX 274-8695
Div. of Geological Survey Eagle River
Laboratory Number Met hod Parameter
Date Unite Reeult Flag Analyzed
ppppppp--ppp------pp-pppppppppp--
All2307 EPA502.2 2,2-Dichloropropane ug/ 1 1,l-Dichloropropene ug/ 1 1,3-Dichloropropene ug/ 1 Ethylbenzene ug/ 1 1,2-Dibromoethane ug/ 1 Triehlorofluo~omethane ug/ 1 Hexachlor~butadiene ug/ 1 Ieopropylbnzene ug/ 1 p-~sopropyltoluene ug/ 1 Naphthalene ug/ 1 n-Bropylbenzene ug/ 1 Styrene ug/ 1 l,l,l,2-Tetrachloroethane ug/l . 1,1,2,2-Tetrachloroethane ug/ 1 Tetrachleroethylene ug/ 1 Total Trihalomethane ug/ 1 T o ~ u % R ~ ug/ 1 1,2,3-Trichlorobenzene ug/ 1 1,2,4-Trichlerobenzene ug/ 1 l,l,l-Trichloroethane ug/ 1 1,1,2-Trichloroethane ug/ 1 Trichloroethylene ug/ 1 1,%,3-Trichloropropana ug/ 1 f,2,4-Trimethylbenzene ug/ 1 1,3,5-Trimethylbenzene ug/ 1 Vinyl Chloride ug/ 1 m,p-~ylenes ug/ 1 o-Xy lane ug/ 1 1-Chlere-2-fluorobenzene (Recovery) %
Anchorage Operation8 Manager

RECEIVED C'q u C ~ I , i O C 1
uw!mtwlAtbs CORE LABORATORIES
Internataonal * U r n r ( k Y C O m m Div. of Geological Survey
Eagle River
PAGE : 1
L A O O R A T O R Y T E S T S R E S U L T S 08/29/91
J M II1ICIBER: 911650 CUSTCWER: STATE OF ALASKA ATTN: MARY W E @
SAMPLE W E R : 1 DATE RECEIVED: 08/02/91 TlM RECEIVED: 10:30 SAMPLE DATE: O7/W/91 SAMPLE P I N : 13:12
PROJECT: URROC/AB WE 09/02/91 W L E : CARROC UFLL R M : YATER
SAMPLE W R : 2 DATE RECEIVED: 08/02/91 TIM RECEIVED: 10:M S M E DATE: O7/09/pr SAMPLE TIME: 20:35
PROJECT: (;ORDOII/AB DUE 09/02/91 W L E : GOROOY UFLL E M : UATER
SWLE W E R : 3 DATE RECEIVED: 08/02/91 T I # RECEIVED: 10:30 W L E BATE: 07/17/91 W L E TIM: 1235
PROJECT: BIG 3 LINCOLU/AB DUE 09/02/91 W L E : 816 3 LINCOLN WELL UEH: YATER
SWLE W E R : 4 BATE RECEIVED: 08/02/91 T I # RECEIVED: 1O:M W L E DATE: 07/17/91 S M L E 1114: 15:lO
PROJECT: UELDING SHOQ/AB DUE 09/02/91 W L E : UELDIWG S W WELL EH: UATER
SAMPLE WBER: 5 DATE RECEIVED: 08/02/91 TIME RECEIVED: 1O:M SAMPLE DATE: 07/18/91 W L E TIM: 15:fM
PROJECT: IIEUBERRY/AB WE 09/02/91 W L E : NEYBERRY UELL MI: UATER
SAMPLE W E R : 6 DATE RECEIVED: 08/02/91 T I # RECEIVED: 10:30 W L E BATE: 07/20/91 W L E 1114: 12:M
PROJECT: WARRIS/AB DUE 09/02/91 SAMPLE: HARRIS LlELL Ila: WTER
TEST D E m IPTIW
Gross Alpha, t o t a l
Gross Alpha, to ta l , er ror , +/-
Gross Alpha, to ta l , LLD
Gross Beta, t o t a l
Gross Beta, to ta l , error, +/-
Gross Beta, to ta l , LLD
420 Ucrt F i r s t S t r n t Catpcr, W 82601
APPROVED BY: (307) 235-5741
SLJOLF 5
0.0
9.2
15.8
11.3
6.8
10.4
SAMPLE 1
0.0
1.2
2.0
1.6
1.7
2.7
8#WLE
0.0
1.6
2.7
1.6
1.8
2.8
W L E 2
0.6
1.7
2.6
1.3
1.6
2.5
d l ~ l l r ~ d tEASME
@ i / l
pCi/1
@i/L
pC i / l
@ ( / I
pC{/l
W L E 3
0.0
1.2
2.2
1.5
1.6
2.5
W L E 4
0.2
1.2
2.0
1.9
1.7
2.7

4 .
.- VRIA RECEIVED q;n ,,, ~ O P : L - $ CORE LAlB8RATe)RIEES
wmxmAt;lee Intevnet;lonal
&I- D . U ~ Div. ~f Geological Survey Eagle River -
L A I T O R A T O R r T E S T S R E S U L T S 08 /29 /91 -
JOB NWBER: 9 1 1850 eUSTUER: STATE OF ALASKA ATTU: W I W E R -_I-_
SAMPLE U W E R : 7 DATE RECEIVED: 08 /02 /91 T I M RECEIVED: 10:30 S W L E DATE: 87/20/91 SAMPLE T I M : 18:03 IPIOJECT: CUIHU/AS WE 09/02/91 W L E : C R l M UEtL REM: WTER
~GPLE%ER: 8 DATE RECEI WD: 08 /02 /91 T I M RECEIVED: 10:30 W L E DATE: 07/22/91 W L E T I M : 10:55
IPPOJECT: L D M S l A 8 D(E 09 /02 /91 SAMPLE: ADAM W L L REM: WTER
--- (wPLE NWBER: T DATE RECEIVED: OB/02/91 TIME RECEIVED: 10:30 SAMPLE DAYE: 07/22/91 SAMPLE TIME: 10:SS
SAHPLE: MXTW STAB ELEWWTARY SCHOOL REW: WTER
420 Unt Fi rs t Street Carper, UT 821931
APPROVED BY :--- (307) 235-5741
PAGE : 2

RECEIVED l ! ! !M I~~ ? I , 1 9 9 CORE LABORATORIES w e m t x i n ~ ~ Int;emettmal -
~ ~ m r - cmm UIV. 01 b v Eagle River
Q U A L I T Y A S S U R A N C E R E P O R T W29/9l
JDB WEB: 911850 GWTOIER: STATE OF ALASKA ATTN: w r I(AURER
TECHNICIW:DF
QC BATCH YI1IBER:lISSU
DATE/TlIE WY2ED:W OC U T C M YWBER:115524 DETECTIW LiWIfr ' CIETHQ) REFERENCE
420 Vcr t F i r s t St r r+t Caspr, UT 82601
APPRUVEO BY: (307) 235-5741
PAQ: 1
~ o t Calculable &e t o v a l u r t lowcr t h m the detection l i m i t Not detected a t l eve l in l i m i t s c o l m
i t y Control Acceptance Cr i tc r ia : Blanks ............. : Analyzed VaLw I u s t h n or squrl t o the D e t e c t f a L l m l t Referante S t h r c t s : 100 +/- 10 Percent Recovery D l p l i c r t u . ........ : 2Q% R e l r t i v r Percent D i f f r r m c e , or +/- the Detect ion L i m i t Spikes ............ .: 100 +/- 25 Percant Recowry
EQA 60b/4-79-020, Hethodr fo r Chcaicr l Analysis o f Uater ud U w t c r , h r c h (983 €PA SU-846, Test Methods for Evaluating S o l i d Urste, Th i rd Edit ion, N o w d x r 1986 S t d r d c &thodo fo r the E x m i r u t i o n o f Water nd U a s t w r t u , Ibth, 1985 EPA/b004-80-032, Prescribed Proc&ts f o r Wcasurcvnt o f R d i o l l c t i v i t y in Dr ink ing Ur ter , Augwt 1980 Federal Register, Friday, October 26, 1984 (kO CFR Par t 136) EPA 600/8-78-017, Microbiological Methods for M m i t o r i n g the E m i r a m t , D e c h r 1978
NOTE - Data rtportd i n Oh report m y d i f f e r frm values on data pew due t o d i l u t i o n o f ssrrple i n t o ana ly t i ca l ranges.

APPENDIX D
Laboratory quality-assurance evaluation on water samples collected for the phase mA project, west Nikiski, Alaska
This quality assurance (QA) evaluation covers water samples and associated field and laboratory check samples collected from west Nikiski area ground waters during July 1991.
One-hundred eighty common dissolved ion and trace metal sample bottles were analyzed by the Alaska Division of Water Laboratory, Fairbanks, Alaska. Thirteen samples were analyzed for volatile organic compounds listed in U.S. Environmental Protection Agency (EPA) Method 502.2, by Northern Testing Laboratories, hc. , Anchorage, Alaska. Nine gross alpha and gross beta radioactivity samples were analyzed by Core Laboratories, Caspa, Wyoming. Each analytical laboratory is discussed separately. Sample handling, holding times, analytical methocls, and data q d i t y objectives are listed in the QA plan (Maurer, 1991).
Alaska Division of Water Laboratory
Samnle Handling: All samples were received intact by the laboratory according to chain-of-custody records.
Field Oualitv Control Checks: Three blind duplicate sample sets, (a sample set consists of five numbered bottles per site) were collected: sample set 599,714, 509,655,791 is a blind duplicate at site 56; sample set 610,424, 521,666, 754 is a blind duplicate at site 152; and sample set 588, 702,497, 644, 968 is a blind duplicate at site 190.
Three blind equipment-blank sample sets were collected: sample set 600,712, 510, 656,792 at site 56; sample set 611,725,522,667, 756 at site 152; and m p l e set 589,703,498,645,769 at site 190.
Laboratow Oualitv Control Checks: All method-required quality control (QC) checks including reagent blanks, laboratory duplicate samples, matrix spike samples, matrix spike duplicate samples, and standard reference samples were performed by the laboratory.
Timeliness: All samples were analyzed within holding time limits. The analysis of orthophosphate (PO,), which was not scheduled for analysis but inadvertently included on the analytical report, exceeded the holding time limit of48 hours.
Initial and ContinuLCalibration: Instrument calibrations were within acceptable limits.
Blanlcs: The blind equipment-blank samples and laboratory blank samples are free of contamination.
Detection Limits: The detection limit stated on the analytical report is the same as that stated in the QA plan (Maurer, 1991) for all constituents except nickel, 0.001 mf l in the QA plan and 0.01 mg/l on the analytical report.
Matrix Soikes (Accuracy): The accuracy data quality (DQ) objective for common anions (F, Cl, NO, +NO,, SO,) is 90 to 110 percent recovery. The accuracy actually obtained for the common ions is 90 to 99 percent recovery.
The accuracy DQ objective for common cations (Ca, Mg, Na, K, Fe, Mn) and trace metals (Al, As, Ba, Cd, Cu, Cr, Pb, Hg, Ni, Zn) is 80 to 120 percent recovery. The accuracy actually obtained for common and trace metals is 91 to 109 percent recovery.
Labratow Duplicates lEab Precision): Precision is expressed as relative percent difference (RPD). The DQ objective for common anions is 10% RPD. The actual lab precision obtained ranges from 1.1 to 7.5% RPD.
The DQ objective for common cations and trace metals is 20% RPD. The actual lab precision obtained ranges from 0.5 to 8.7% RPD.
Lab precision can not be, calculated for mercury because all reported values are less than the detection limit. Lab precision is calculated for nickel because samples from other sources, which had detectable concentrations, were analyzed during the same determination. The resultant WD values for nickel are a measure of the analytical precision of the instrument at that time.

Field Du~licates (Overall Precision): Overall precision, which is a measure of both field and lab precision, is calculable for the sample sets associated with blind duplicate samples (see 'Field Quality Control Checks' above).
The RPD is less than 10% for all common anions in all three sample/blindduplicate sample comparisons. The RPD is less than 20% for all common cations and trace metals except aluminum (22%) in the 4961497 comparison and lead (27%) in the 5201521 comparison. Overall precision can not be calculated for trace metals with reported values below the detection limit of the analytical method used.
Conclusion: All constituents meet DQ objectives for laboratory accuracy and precision. Overall precision meets or closely approaches 20 percent. The overall precision for aluminum and lead is acceptable because sample concentrations are close to the detection limit of the analytical method used. Therefore, all data are deemed acceptable for use.
Northern Testing Laboratories
Sam~le Handling: All samples were received intact by the laboratory according to the analytical reports.
Field Oualitv Control Checks: One travel blank sample was provided by the laboratory and was analyzed with the initial sample set. The travel blank sample, Lab No. A1 11981, is free of contamination.
Laboratow Oualitv Control Checks: All method-required QC checks, as specified in the QA plan, were performed by the laboratory.
Timeliness: Three separate samples sets were delivered to the laboratory. Five samples, Lab Nos. A1 11 977- A1 11981, in the initial sample set were analyzed 10 days after sampling, witkin the 14-day holding time limit. Four samples, Lab Nos. A1 121 58 - A1 12162, in the second sample set were analyzed 18 or 23 days after sampling. Three samples, Lab Nos. A1 12305 - A1 12309, in the third sample set were analyzed 18 or 19 days after sampling.
Detection Limits: Acceptable.
Matrix S~ ikes (Accuracy): No accuracy data is shown on the analytical reports.
Surrogate Spikes: Percent recovery ranges from 69 to 95 percent which is acceptable.
Laboratow Du~licates (Lab Precision): No precision data is s h o w on the analytical reports.
Conclusion: Although holding times were exceeded for the second and third sample sets, data are deemed useable because volatile organic compounds are undetected in a11 samples, except one. The compound 1,l ,I-trichloroethane was detected in Lab No. A1 12307 at 0.7 pg/L which is slightly above the LLD of 0.2 pg/L. Although this value is considered valid, it is not confirmed by a duplicate or replicate sample. In conclusion, all data are deemed acceptable for use.
Core Laboratories
Sam~ling Handling: All samples were received intact by the laboratory according to chain-of-custody records.
Field Oualitv Control Checks: Sample No. 4 is a blind duplicate of Sample No. 3.
Laboratorv Oualitv Control Checks: All method-required QC checks, as specified in EPA Method 900.0, were performed by the laboratory.
Timeliness: All samples were analyzed approximately 5 to 7 weeks after collection, well within the six month holding time limit.
Detection Limits: The actual lower limit of detection (LLD), as stated in the analytical report, ranges from 1.9 to 15.8 pCiL for gross alpha activity and 2.3 to 10.4 pCin for gross beta activity. The LLDs are acceptable except for sample No. 5, which has a LLD of 15.8 pCiL for gross alpha.

Matrix S ~ i k e s (Accuracv): The accuracy DQ objective is 100 * 10 percent recovery. The QC acceptance criteria listed on tile lab's QA report is 100 * 25 percent recovery. No accuracy calculations are shown on the QA report.
L-abratorv Du~licates (Lab Precision]: Four of the six samples that were analyzed as duplicates have a W D of less than 20%. Analysis LB. 91 1850-4, the only duplicate run on the nine Niluski samples submitted, has a W D of 86% for goss alpha and 18% for gross beta.
Field Duvlicates (Overall Precision): Overall precision is not calculable for sample No. 3 at~d its field duplicate, sample No. 4, because the actual values obtained for gross alpha and gross Beta radioactivity are below the LLD of the Analytical method used.
Conclusioq: The majol-ity of gross alpha and gross beta values are below the LLD for the analytical method w d . Values which are reported as 0.0 pCiL should be reported as less than ' 4 LLD values. For example, gross alpha for sample No. 1 is 4 . 0 pCiIL, not 0.0 pCi/L.
The gross alpha value for san~ple No. 5 is not acceptable because the detection limit is too high. The LLD of 15.8 pCi/L exceeds the drinking water maximum contaminant level of 15 pCUL (Alaska Department of Environmental Conservation [AIIEC], 1991).
The extremely low values warrant higher laboratory accuracy and precision acceptance limits. Therefore, with the exception of the gross alpha value for sample No. 5, these data are deemed acceptable for use.
Overall Comments
Completeness: The stated DQ objective for completeness, that is tile percentage of useable data, is 95 percent. The - total possible data collected as part of this investigation are 202 samples. The useable data total 201 samples. The completeness is 99 percent.
References Cited
Alaska Department of Environmental Conservation, 1991, State of Alaska Drinking Water Regulations 18 AAC 80: ADEC, Juneau, 87 p.
Maurer, M.A., 1991, Quality assurance plan for the Kenai Peninsula ground-water study phase IDA, pilot project, west Nikislu, Alaska: Alaska Division of Geological and Geophysical Surveys Public-Data File 91-27, 104 p.