DEPARTMENT OF MEDICAL RESEARCH ENCES No. … Vol 1-24 PDF...Khin Saw Aye, Khin Myat Tun, Yin Min...
56
MYANMAR H H E E A A L L T T H H S S C C I I E E N N C C E E S S RESEARCH JOURNAL Volume 18, No. 2, 2006 DEPARTMENT OF MEDICAL RESEARCH (Lower Myanmar) No. 5, Ziwaka Road Yangon 11191, Myanmar CONTENTS Will you change as you were taught? …………..... ……………………………………… Le Le Win, Than Tun Sein, Kyaw Nyunt Sein & Khin Maung Lay 55 A preliminary study on microbiological and chemical analysis in shrimp species (Penaeus monodon) (black tiger) for export ………………………………………… Myat Myat Thaw, Tint Wai, Mar Mar Nyein, Myint Myint Sein, Aung Myint & Oo Aung 60 Aldehyde test (Formol-Gel test) in the diagnosis of kala-azar (Visceral leishmaniasis)..... Khin Saw Aye, Khin Myat Tun, Yin Min Htun, Yin Thet Nu Oo, Tin Zar Maw & Lwin Lwin Moe 64 Russell’s viper (Daboia russelii siamensis) bite: venom and antivenom clearance and outcome of antivenom therapy ………………………………………………………… Tun Pe, Aye Aye Myint & Khin Aye Kyu 67 Body composition and resting energy expenditure of adolescents in Yangon, Myanmar… Ye Tint Lwin, Tin Khine Myint, Ni Thet Oo, Sandar Win, Khin San Lwin & Wah Wah Win 73 Antibacterial activity of oils of clove and garlic on bacterial isolates (special emphasis on coagulase- positive Staphylococcus aureus ) from patients with septic wound (anapauk) from Traditional Medicine Hospital………………………………………... Lwin Lwin Cho, Mar Mar Nyein, Win Myint, Sein Win & May Kyi Aung 78 Effect of chronic lead exposure on children of Yangon, Myanmar (1): blood lead and urinary coproporphyrin rofiles…………………………………………………………. 84 Phyu Phyu Aung, Thandar Shwe, Theingi Thwin, Tin Khine Myint, Moe Moe Hliang & Theingi Win Myat Genomic characterization of rotavirus isolates from Yangon Children’s Hospital by Reverse Transcription Polymerase Chain Reaction……………………………………. Kyaw Moe, Khin Mar Aye, Thandar Lwin, Win Mar Oo, Tin Tin Htwe, Thin Thin Shwe & Win Mar 89 Development of in-house Enzyme – Linked – Immunosorbent - Assay (ELISA) for determination of antibody to hepatitis B surface antigen………………………………. Myo Khin, Khin Pyone Kyi, Ohmar Lwin, Khin May Oo, Yi Yi Kyaw & Baby Hla 95
Transcript of DEPARTMENT OF MEDICAL RESEARCH ENCES No. … Vol 1-24 PDF...Khin Saw Aye, Khin Myat Tun, Yin Min...

MMYYAANNMMAARR
HHEEAALLTTHH SSCCIIEENNCCEESS RREESSEEAARRCCHH JJOOUURRNNAALL
Volume 18, No. 2, 2006
DEPARTMENT OF MEDICAL RESEARCH
(Lower Myanmar)
No. 5, Ziwaka Road
Yangon 11191, Myanmar
CONTENTS
Will you change as you were taught? …………..... ……………………………………… Le Le Win, Than Tun Sein, Kyaw Nyunt Sein & Khin Maung Lay
55
A preliminary study on microbiological and chemical analysis in shrimp species (Penaeus monodon) (black tiger) for export …………………………………………Myat Myat Thaw, Tint Wai, Mar Mar Nyein, Myint Myint Sein, Aung Myint & Oo Aung
60
Aldehyde test (Formol-Gel test) in the diagnosis of kala-azar (Visceral leishmaniasis).....Khin Saw Aye, Khin Myat Tun, Yin Min Htun, Yin Thet Nu Oo, Tin Zar Maw & Lwin Lwin Moe
64
Russell’s viper (Daboia russelii siamensis) bite: venom and antivenom clearance and outcome of antivenom therapy …………………………………………………………Tun Pe, Aye Aye Myint & Khin Aye Kyu
67
Body composition and resting energy expenditure of adolescents in Yangon, Myanmar…Ye Tint Lwin, Tin Khine Myint, Ni Thet Oo, Sandar Win, Khin San Lwin & Wah Wah Win
73
Antibacterial activity of oils of clove and garlic on bacterial isolates (special emphasis on coagulase- positive Staphylococcus aureus ) from patients with septic wound (anapauk) from Traditional Medicine Hospital………………………………………... Lwin Lwin Cho, Mar Mar Nyein, Win Myint, Sein Win & May Kyi Aung
78
Effect of chronic lead exposure on children of Yangon, Myanmar (1): blood lead and urinary coproporphyrin rofiles…………………………………………………………. 84Phyu Phyu Aung, Thandar Shwe, Theingi Thwin, Tin Khine Myint, Moe Moe Hliang & Theingi Win Myat
Genomic characterization of rotavirus isolates from Yangon Children’s Hospital by Reverse Transcription Polymerase Chain Reaction…………………………………….Kyaw Moe, Khin Mar Aye, Thandar Lwin, Win Mar Oo, Tin Tin Htwe, Thin Thin Shwe & Win Mar
89
Development of in-house Enzyme – Linked – Immunosorbent - Assay (ELISA) for determination of antibody to hepatitis B surface antigen……………………………….Myo Khin, Khin Pyone Kyi, Ohmar Lwin, Khin May Oo, Yi Yi Kyaw & Baby Hla
95

Serogroup distribution of enteropathogenic Escherichia coli isolated from infants with acute diarrhoea admitted to Yangon Children’s Hospital (2004) ……………...... Mar Mar Nyein, Yaminn, Mo Mo Win, Aye Aye Maw & Thein Aung
100
Cellular immune response following Russell’s viper (Daboia russelii siamensis) bites in Myanmar……………………………………………………………………..... Tun Pe & Aye Aye Myint
104
Editor-in-Chief
Dr. Kyaw Min
---------------------------------------------------------------------------------------------------------------- Editor
Dr. Khin Pyone Kyi
Associate Editors Daw Nyunt Nyunt Swe Dr. Ni Thet Oo
---------------------------------------------------------------------------------------------------------------- Editorial Board
Prof. Dr. Aye Maung Han Prof. Dr. U Kyaw Prof. Dr. Ne Win Prof. Dr. Myo Win
Prof. Dr. Kyi Kyi Thinn Prof. Dr. Myo Oo
Prof. Col. Thein Myint Thu Asso. Prof. Dr. Soe Aung
Dr.Tun Pe Dr. W.Tun Lin Dr. Than Tun Sein Dr. Myo Khin Dr. Khin Myat Tun Dr. Kyaw Moe Dr. Kyaw Zin Thant Dr.Thaw Zin
----------------------------------------------------------------------------------------------------------------
Business Manager
Dr. Ye Htut
Editorial Manager
U Aung Myo Min
Production Manager
U Ye Thway
------ ------------------------------------------------------------------------------------------------------- Printed at the Publications Division, Department of Medical Research (Lower Myanmar) -------------------------------------------------------------------------------------------------------------
Restricted for Internal Use Only
The Myanmar Health Sciences Research Journal, Vol. 18, No. 2, 2006
Will you change as you were taught?
*Le Le Win, **Than Tun Sein,***Kyaw Nyunt Sein & ****Khin Maung Lay
*Health Systems Research Division
**Department of Medical Research (Lower Myanmar) ***Department of Health
****Leprosy Control Programme, Department of Health
An intervention study was conducted in Padaung Township during 1999–2000 to examine whether health intervention was successful in changing the behaviour of leprosy patients. A random sample of 50 patients was interviewed and observed regarding leprosy-related practices before and after intervention, which were eight months apart. They were taught multiple self-care prevention practices after the first time interview. During the intervention period, their practices were observed and case histories were taken two-monthly for four times. The research team interviewed with pre-tested questionnaire, guidelines and observed with a checklist, and the trained midwives disseminated about self-care. While most of the non-stigmatizing practices had changed to some extent, some stigmatizing practices had not changed. Patients who adopted stigmatizing practices were more likely to relapse than patients who adopted non-stigmatizing practices. However, we found a limited success in behavioural change due to constraints in culture, beliefs, stigmatization, and impractical techniques.
INTRODUCTION
In a society, once a person has contracted leprosy disease, and especially after deformity has developed, that person is labelled as a “leper”, even if the disease is cured. Though some physical disfigurments can be corrected by reconstructive surgery,a patient’s psychological problems cannot be solved easily. Thus, supporting patients to live again normally as a full member of soiciety is important. Surgery is expensive and not accessible to everyone. The World Health Organization (WHO) thus encourages helping patients to practise prevention of disability (POD) through self-care.
In Myanmar, leprosy, ranked 8th as a public health problem, was eliminated in 2003. Although the incidence of new cases may be very low beyond that, in addition to the disabled cured cases; there will still be patients with deformities among new patients. There is, thus, a need for continued
health education (HE) and care to reduce the occurrence and severity of disability. However, providing patients with health messages alone is not enough. Patients need to change specific behaviours posing risks to disability. The patient’s decision to change or not to change behaviour is said to rely upon or at least be related to effective HE as well as motivation, coping skills, beliefs, and environmental support. As the human nature, some people are always quick to try something new, while others are very slow to change. Not every one is ready to change simultaneously [1].
The present study addressed multiple practices, which needed to be appropriate for physical disabilities and circumstances of individual leprosy patients. Hence, changing behaviour of leprosy patients requires a more complicated change process. The objective was to examine whether the health intervention was successful in changing behaviour.
55
MATERIALS AND METHODS
The study was conducted during 1999-2000 in Padaung Township, Pyay District, Bago Division, which had a high leprosy prevalence rate (4.8 per 10,000 population in 1998) [2]. The study was a “before-and after-test design”, with an introduction of an intervention – dissemination about prevention of disability by self-care to patients by health workers. Health education material about POD by self-care was developed and tested basing on the existing preventive methods used by leprosy control programme of Myanmar at the time of study and WHO [3-7]. Out of five rural health centers (RHCs), two RHCs – Kyaunt-phu and Htone-bo were considered as the study site due to their easy accessibility for frequent visits at two-month intervals.
Fifty patients were chosen at random from the selected two RHCs for cohort observation. All patients in this study were over 18 years of age. They were interviewed and observed regarding leprosy-related practices before intervention. They were taught about more than one type of self-care prevention to be adopted. Six months later they were interviewed and observed again. During the intervention period, their practices were observed and case histories were taken two-monthly, resulting in four times. The study took for one year. While the research team interviewed with a pre-tested questionnaire and guideline, and observed with a checklist, trained midwives disseminated about self-care.
This paper is based on the findings from the observation and case histories regarding the changes of multiple risk behaviors of an individual of a cohort of 50 patients.
RESULT Study patients considered ‘disability’ as the stigmatisation and considered any change in behaviour that drew attention to the disability as further stigmatisation. Addi-tionally, the patients were rooted with
their innate rural culture - very conservative. This, together with their customs or habits and their economic problems constituted barriers to frequent communication with health staff and to adoption of recommended practices. Consequently, the majority of patients did not adopt all of the recommended preventive measures. While a particular practice could be easy to adopt for some patients, the corresponding one would be difficult for other patients.
To protect their eyes, the majority of patients covered their heads and eyes with a hat or a piece of cloth when out of doors and in a sunny or windy place, which were conformed to local practice. Most had already recognised the risk of burns to the hands by using a pad to move a hot pot or to lift the lid of the hot pot or padding the handles of cooking pots, cups, and kettles. Only 2 patients were in the habit of cooking without padding and 2 patients of moving hot materials with their bare hands before the intervention. They corrected their behaviour during the period of observation so that none practised heat-related harmful behaviours at the end of the study. Obvious problems with hands were that they needed to maintain a good grip on the agricultural tools and equipment. At the beginning of the intervention, protection of feet was inadequate. Half did not wear recommended footwear and nearly all refused to wear footwear all of the time. Most walked long distances without taking rest to relieve the pressure on their feet. Only two checked their feet for injury. Wound care was poor. They did not keep first-aid kits and did not clean, dress or bandage wounds. Out of the specific risk practices, which changed during the study period, most relapsed practices were the type of stigmatising practices such as protecting hands against injury, caring of damaged hands and feet, and doing hand and foot exercise.
We will illustrate the different types of behaviour changes of 50 cohort patients with the following extracts.
56

Having immediate and frequent injury driven the patients to prevent their body parts. U A1, who had deformities in hands and feet, used to get injuries to his palms and soles while cooking, chopping and carrying water buckets. At each observation visit, I saw him having one kind or another of injury. At the first visit, he had sores on soles, but did not bandage them. During the second visit, when I saw him in the morning, his right palm ( he got burns while cooking ) was bandaged with a piece of cloth. At the evening, when he went out to carry water, he unfastened it, but bandaged it with a new cloth after finishing the task. A similar pattern was observed during the third visit. At the last visit, I saw him bandaging both his palms and right sole the whole day indicating he could maintain his changed behaviour.
Among those who changed their risk practices, one man (U L) with deformed hands said why and how he had changed his digging practice when planting banana trees in his back yard:
When I made a hole to plant a tree, I always dug the earth with my hands and got bruises. Then I thought about using a coconut shell, which would make fewer abrasions.
I asked him what made him change, and he said,
… in the booklet, I saw a picture of a man striking with a padded mattock. If I wrapped my hand [with a cloth] when digging, it wouldn’t work. So I used a coconut - shell for digging.
Some changes were not as simple as the patients mentioned above. An example is that of U B, a poor elderly patient who lived alone. He had difficulty holding nails when hammering with his claw hands. He developed his own technique of grasping the nail between the teeth of a comb and thus avoiding injury to himself. In addition, he succeeded in changing of cooking practices
but he had a couple of things to consider. He needed to compare the efficiency of draining water with wooden sticks when the rice is cooked and using an old shirt to hold a small pot for boiling water two to three times a day. If he had had a bigger pot he would not have needed to boil water so often to fill his flasks with a zinc mug but he had to consider the cost of the pot and ease of handling it. He needed to replace a zinc mug that conducted heat easily with something safer. He thought, perhaps, he should have been ordering his meals from a shop than cooking. But that too would cost him. This was much more complicated than changing a single behaviour in order to protect his hands.
Sometimes, progression of changes was less clear-cut. Patients would often move backwards and forwards throughout the changing process. For instance, U A, who had no extremities, used two different knives for daily activities. The first knife was used to split bamboo slats. He started to wrap a blade of this knife between times 2 and 3. Because of getting fewer injuries he continued to split the slates with this padded knife to the end of study. He used a second knife, or machete, to clear grass and weeds. He started to wrap the handle of this knife in cloth between times 3 and 4, at the time towards the end of study. He also started doing foot exercises between times 2 and 3 but relapsed between times 3 and 4 because of pain. He was thus involved in a quite complicated process of changes during six months of intervention period.
Some patients did not change their risk practices. When asked why they had not changed to a new behaviour, patients gave multiple reasons for not changing their behaviour. They frequently just said: ‘We are not accustomed to doing it’. This terse response seemed to cover a number of issues that were preventing them from adopting new behaviours: if a cultural practice was entrenched (for example, wearing footwear in a house or the farm), unconvinced in prevention (for example,
57
believed that the deformities could not be prevented because of atonement for past sins and misdeeds (0ï fau|;) afraid of being stigmatised by the recommended practices (for example, wearing sunglasses, soaking calluses on palms and soles, and doing hand and foot exercises), if it was against their religious beliefs (for example, walking with footwear in religious places even if the person suffered from a plantar ulcer), not recognising the risk by holding tools and equipment with bare hands (e.g., they did not see common materials such as ropes, bamboo, wood and cane could harm to them) or if it was not feasible (e.g., using mirrors to check eyes was not possible for people who left the house while it was still dark and who worked in the fields all day).
When we examined changing pattern of individuals, patients were more likely to change practices if they could see an immediate benefit and they discontinued their changed behaviour, which drew more stigmatisation to themselves and negative reactions from other people. They were less likely to change because they themselves were not conditioned to change.
It was important to note that the number of new behaviours that patients adopted tapered off over successive two-month periods. It appeared that by the end of the study, the limits of this particular inter-vention had been reached.
DISCUSSION This study finds that changes in practices were not fully determined by knowledge. Not one patient reported changing all his or her risk practices, since the patients had to adopt multiple new practices, which need to be appropriate for physical disabilities and circumstances of individual patients. Most of the non-stigmatising practices had changed to some extent (for example, heat-related practices). Some stigmatising practices also changed but the most stigmatising behaviours did not change at all
(for example, wearing footwear at all times). Negative reinforcement from the com-munity was also a factor. Patients who adopted stigmatising practices were more likely to relapse than were patients who adopted non-stigmatising practices. Since the duration of the study was relatively short, it was not able to evaluate the patients who could establish to sustain the changes for six months or longer. This study also makes us aware of many important issues that should be considered when conducting research on human behaviour. In spite of the great care we took in preparing the educational material, we were successful in changing behaviour of a limited number of patients only. It is not easy for people to change deeply rooted behaviours and beliefs, when the effects of stigma and religion are so strong. The findings highlight the needs to focus on reinforcements of targeting the individuals with minimum and essential prevention of disability, and working together among patients, community and health staff by trying to change beliefs and attitudes of all responsible persons.
ACKNOWLEDGEMENTS
The authors wish to thank Director Generals of Department of Medical Research (Lower Myanmar) and Department of Health to allow for conducting this study. Thanks are due to WHO / TDR for providing with the grant. Last, but not the least, we are grateful to the patients, because without them, this study would not be accomplished.
REFERENCES
1. World Health Organization. Education for Health: a manual on health education in primary health care. World Health Organization. Geneva, 1988.
2. Department of Health. Health Profile of Leprosy Control Project, Padaung Township. Ministry of Health, Myanmar. Padaung, 1998. 3. Watson, J.M. Essential action to minimise
58
59
disability in leprosy patients. The Leprosy Mission International. Brentford, 1986.
4. World Health Organization. A guide to leprosy control. World Health Organization. Geneva, 1988.
5. World Health Organization. Training package for a family member of a person who has no feeling in the hands or feet: information about the disability and what you can do about it. World Health Organization. Geneva, 1989.
6. World Health Organization. Training package for a family member of a person who has no feeling in the hands and feet: how to prevent injuries and deformities of the hands and feet. World Health Organization. Geneva, 1989.
7. World Health Organization. Training package for a family member of a person with a disability: household activities. World Health Organization. Geneva, 1989.
The Myanmar Health Sciences Research Journal, Vol. 18, No. 2, 2006
A preliminary study on microbiological and chemical analysis in shrimp species ( Penaeus monodon) (black tiger) for export
*Myat Myat Thaw, **Tint Wai, ***Mar Mar Nyein,
*Myint Myint Sein, *Aung Myint & *Oo Aung
*Chemistry Department, Yangon University **Department of Fisheries
***Bacteriology Research Division, Department of Medical Research (LM)
The aim of this study was to perform microbiological analysis and chemical analysis for the quality assurance of different shrimp species for export. Food safety and quality play an important role for consumers. As frozen shrimp is the most promising sea food product exported by Myanmar a preliminary study on the microbiological analysis was carried out on (Penaeus monodon) (black tiger) according to the International Commission of Microbiological Specification (ICMSF) for food. Total plate count for Vibrio cholerae, Vibrio parahaemolyticus, Salmonella, Shigella, Escherichia coli, Staphylococcus aureus was determined. Simultaneously, coliforms and faecal coliforms were also determined. Sixteen amino acids in protein, total amino acids and free amino acids in P. monodon (black tiger) were measured by reverse phase high performance liquid chromatography (HPLC), Model 10 AXL spectrofluometric detector (Shimadzu, Duisburg, Germany) using ortho-phthaldialdehype (OPA) precolumn derivatization method. Determination of some heavy metals was carried out by atomic absorption spectrophotometer (AAS). It was found that total plate counts and coliform counts were reduced from 106 CFU/g to 103 CFU/g in shrimp species and faecal coliform, E. coli, S. aureus, Salmonella, Shigella, V. cholerae and V. parahaemolyticus were not found in all tested samples. All 16 amino acids were found to be present in shrimp samples with high concentrations of glycine, arginine, alanine and lysine The heavy metals such as arsenic, mercury, copper, iron, phosphorus, and zinc were within the acceptable range.
INTRODUCTION
Food safety and quality are of crucial importance to prevent the health of consumers as well as to fulfill the health sanitary requirement. Myanmar produced and exported 19477 metric tons of shrimp in 2001, earning US dollar 104.23 million. Among many bacterial organisms, Vibrio species are commonly found in Vietnam, Indonesia, Bangladesh and Japan. Deter-mination of some heavy metals in shrimp for export is also important for human health [1]. Due to the habitat and different environmental status, the quality status of prawns need to be elucidated.
The aims of this study were to establish modern standardized methods with regard to the quality assurance of prawns and shrimps and to assist in controlling of food safety.
MATERIALS AND METHODS
Samples
Local shrimp species were collected from the Ministry of Livestock and Fisheries and from various export companies. Each of the 50 samples for export were examined according to the International Commission of Microbiological Specification for Food (ICMSF) for microbiological analysis and for determination of chemical constituents [2].
60

Total plate count and microbiological analysis
Ten grams of frozen whole shrimp samples were weighed in sterile stomacher bags and macerated with 90 ml of peptone. After serial dilutions, the total plate counts were determined. Pure colonies were identified by biochemical tests [3, 4].
Chemical analysis Determination of aminoacids
It was done using the HPLC (Model LC10, Shimadzu). Samples were separated on an OPA-3 Reverse phase column (Grom, Herrenberg, Germany) equipped with gradient controller (Model RF 10A, Shimadzu, Japan). The total hydrolysis of the products was done at 220nm wavelength and Orthophthaldialdehype (OPA) precolumn derivatization were detected by a spectrofluometer (Model RF 10AXL) [5-8].
Determination of heavy metals
Determination of some heavy metals was carried out by atomic absorption spectrophotometry (AAS) using the Perkin Elmer AA analyst 800 (USA) and GBC 932AA analyst (Australia) .
RESULTS AND DISCUSSION
In this study, it was found that the total plate count and coliform count of the export samples were reduced from 106 CFU/g to 103 CFU/g when water and ice were used for washing and preservation compared to the raw samples of shrimps (Table 1, 2).
Escherichia coli, Staphylococcus aureus, Salmonella, Shigella, Vibrio cholerae and Vibrio parahaemolyticus were not isolated in all tested samples.
Table 2. Distribution of coliforms from P. monodon (Black Tiger)
P. monodon (Black Tiger) (n=50) Coliform count
(MPN/g) Headless %
Peeled & devined %
<3 70 66
3-8 24 22
9-24 6 12
Table 3. Concentration of amino acids (μmol/g) in P. monodon (Black Tiger) from Sittway region
Sr
No.
Amino acid
Total amino acid
Free amino acid
(protein)
Bound amino acid
(literature value
Total amino acid
(Referen-ce value)
1 Aspartic acid
128.06 +10.0
74.16 +8.50
35.41 + 7.00 129-163*
2 Glutamic acid
169.50 +9.00
101.41 +7. 90
56.50 + 6.20
170-199**
3 Serine 55.39 +3.20
39.40 +2.80
14.91 + 1.00 64-79*
4 Histidine 27.23 +2.50
16.94 +2.10
9.19 + 3.00 19.3-77*
5 Glycine 571.99 +1.16
534.66 +1.21
37.94 + 2.00
139-152**
6 Theonine 75.03 +4.00
61.65 +1.50
12.37 + 1.10 56-74**
7 Arginine 195.50 +3.10
181.20 +2.10
15.20 + 1.26
64.7-95.7*
8 Alanine 179.65 +2.20
143.05 +2.30
29.95 + 1.51
107-123**
9 Tyrosine 35.46 + 2.50
25.56 +1.70
9.81 +2.05 5-32**
10 Valine 70.05 +1.12
40.38 +1.10
25.60 + 2.01 64-92*
11 Methionine 47.64+1.35
16.43 +1.40
30.89 +3.30 31-94*
12 Tryptophan 18.62 +2.80
14.71 +1.70
3.57 + 4.00 8-14**
13 Phenyl-alanine
38.60 +3.10
22.56 +2.90
15.08 + 2.20 39-45*
14 Isoleucine 40.16 +3.20
19.60 +3.00
20.91 + 3.10 52.5-80**
15 Leucine 80.79 +1.70
32.50 +3.10
48.20 + 2.10
104-115.5*
16 Lysine 145.90 +1.90
80.63 +4.10
62.29 + 3.50 86-150*
Method: OPG precolumn derivatization with HPLC
*Reference No.1
**Reference No.10
Table 1. Total bacterial count from P. monodon (Black Tiger), (headless and peeled and devined )
P. monodon (Black Tiger)
n=50
Washing & preservationn=50 Bacterial
count (per gram) Headless
%
Peeled & devined
%
Bacterial count
CFU/sq cm
Water%
Ice %
103 86 76 1-20 80 78 104 8 14 21-100 14 20 105 4 8 101-500 6 4 106 2 2
61
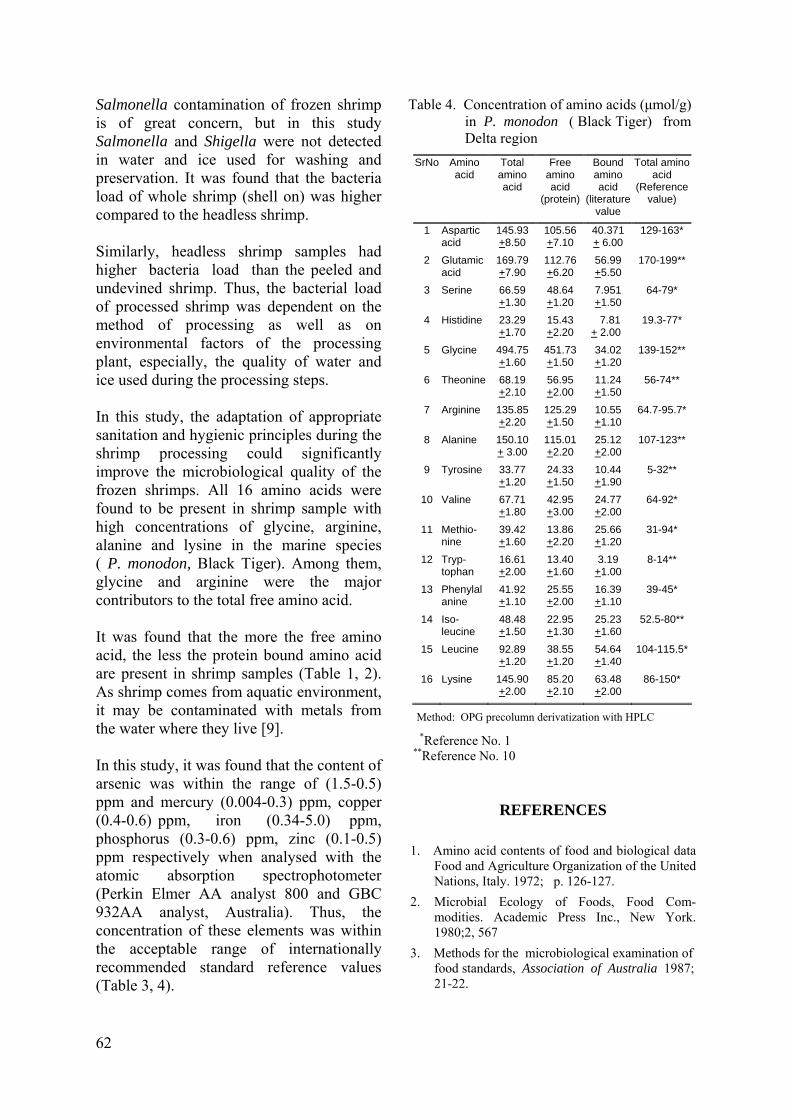
Salmonella contamination of frozen shrimp is of great concern, but in this study Salmonella and Shigella were not detected in water and ice used for washing and preservation. It was found that the bacteria load of whole shrimp (shell on) was higher compared to the headless shrimp. Similarly, headless shrimp samples had higher bacteria load than the peeled and undevined shrimp. Thus, the bacterial load of processed shrimp was dependent on the method of processing as well as on environmental factors of the processing plant, especially, the quality of water and ice used during the processing steps. In this study, the adaptation of appropriate sanitation and hygienic principles during the shrimp processing could significantly improve the microbiological quality of the frozen shrimps. All 16 amino acids were found to be present in shrimp sample with high concentrations of glycine, arginine, alanine and lysine in the marine species ( P. monodon, Black Tiger). Among them, glycine and arginine were the major contributors to the total free amino acid. It was found that the more the free amino acid, the less the protein bound amino acid are present in shrimp samples (Table 1, 2). As shrimp comes from aquatic environment, it may be contaminated with metals from the water where they live [9]. In this study, it was found that the content of arsenic was within the range of (1.5-0.5) ppm and mercury (0.004-0.3) ppm, copper (0.4-0.6) ppm, iron (0.34-5.0) ppm, phosphorus (0.3-0.6) ppm, zinc (0.1-0.5) ppm respectively when analysed with the atomic absorption spectrophotometer (Perkin Elmer AA analyst 800 and GBC 932AA analyst, Australia). Thus, the concentration of these elements was within the acceptable range of internationally recommended standard reference values (Table 3, 4).
Table 4. Concentration of amino acids (μmol/g) in P. monodon ( Black Tiger) from Delta region
SrNo Amino acid
Total amino acid
Free amino acid
(protein)
Bound amino acid
(literature value
Total amino acid
(Reference value)
1 Aspartic acid
145.93 +8.50
105.56 +7.10
40.371 + 6.00
129-163*
2 Glutamic acid
169.79 +7.90
112.76 +6.20
56.99 +5.50
170-199**
3 Serine 66.59 +1.30
48.64 +1.20
7.951 +1.50
64-79*
4 Histidine 23.29 +1.70
15.43 +2.20
7.81 + 2.00
19.3-77*
5 Glycine 494.75 +1.60
451.73 +1.50
34.02 +1.20
139-152**
6 Theonine 68.19 +2.10
56.95 +2.00
11.24 +1.50
56-74**
7 Arginine 135.85 +2.20
125.29 +1.50
10.55 +1.10
64.7-95.7*
8 Alanine 150.10+ 3.00
115.01 +2.20
25.12 +2.00
107-123**
9 Tyrosine 33.77 +1.20
24.33 +1.50
10.44 +1.90
5-32**
10 Valine 67.71 +1.80
42.95 +3.00
24.77 +2.00
64-92*
11 Methio-nine
39.42 +1.60
13.86 +2.20
25.66 +1.20
31-94*
12 Tryp-tophan
16.61 +2.00
13.40 +1.60
3.19 +1.00
8-14**
13 Phenylalanine
41.92 +1.10
25.55 +2.00
16.39 +1.10
39-45*
14 Iso-leucine
48.48 +1.50
22.95 +1.30
25.23 +1.60
52.5-80**
15 Leucine 92.89 +1.20
38.55 +1.20
54.64 +1.40
104-115.5*
16 Lysine 145.90 +2.00
85.20 +2.10
63.48 +2.00
86-150*
Method: OPG precolumn derivatization with HPLC *Reference No. 1
**Reference No. 10
REFERENCES
1. Amino acid contents of food and biological data Food and Agriculture Organization of the United Nations, Italy. 1972; p. 126-127.
2. Microbial Ecology of Foods, Food Com-modities. Academic Press Inc., New York. 1980;2, 567
3. Methods for the microbiological examination of food standards, Association of Australia 1987; 21-22.
62

picomole levels of total free amino acids in very 4. Dalla G. Salinity responses of the juvenile Panaeid shrimp, Penaeus japonicus. Aquaculture 1986; 55:307-316.
small amount of biological tissues. Amino Acids 2001; 20: 163-173.
8. Grendel H & Graser T. Measurements of free amino acids in human biological fluids by high performance liquid chromatography. Journal of Chromatography 1984; 247: 49-61.
5. Fish and fisheries products hazard and control guidance, Food and Drug Administration, 3rd edition, 2001;11.
6. Chen JC, Cheng SY & Chen CT. Changes of haemocyanin, protein and free amino acid levels in the haemolymph of Penaeus japoncus exposed to ambient ammonia. Comparative Biochemistry and Physiology 1994; 109 (A): 339-340.
9. Chen JM & Chen JC. Study on the free amino acid levels in the hemolymph, gill, hepato- pancrease and muscle of Penaeus monodon exposed to elevated ambient ammonia. Aquatic Toxicology 2000; 50: 27-37.
10. Leung WTW. Food Composition table for use in East Asia. Food and Agriculture Organi-zation of the United Nations 1972, 243-246.
7. Fischer GH, Arics I, Quesade I, Aniello GHSD, Errio F, Difiore MM & D'Aniello A. A fast and sensitive method for measuring
63
The Myanmar Health Sciences Research Journal, Vol. 18, No. 2, 2006
Aldehyde test (Formol-Gel test) in the diagnosis of kala-azar (Visceral leishmaniasis)
*Khin Saw Aye, **Khin Myat Tun, *Yin Min Htun, *Yin Thet Nu Oo,
*Tin Zar Maw & ***Lwin Lwin Moe
*Immunology Research Division **Department of Medical Research (LM) *** Clinical Research Division
Department of Medical Research (LM)
Visceral leishmaniasis is a severe disease, which is endemic in 88 countries including 17 developed nations. In endemic areas, recent migration pattern of people, vector (sandfly) and reservoir (dogs) have led to the urbanization of visceral leishimaniasis. This study aimed to find out the role of Formol Gel Test (Aldehyde test) in the diagnosis of kala-azar in rural areas, where the diagnostic facilities are scarce. Three- hundred samples of subjects from the villages of Maung-Daw Township, Yakhine State including 45 Immunochromatographic Test (ICT) strip test positive cases and as a control, 300 blood samples from National Blood Bank (NBB) were subjected to Aldehyde test (AT). Fifty-five (18.3%) cases from Yakhine State and 9 (3%) samples of NBB were found to be AT positive. Among 55 AT positive cases, 40 cases (73%) were ICT positive and 15 (27%) were negative. Among 45 ICT positive cases, 40 (89%) were also AT positive and 5 (11%) were AT negative. Sensitivity and specificity of AT were 87.5% and 93.8%, respectively. There was a significant association between the two tests of ICT and AT (p<0.001). Aldehyde test is simple, rapid and cheap for diagnosis of visceral leishmaniasis. Although negative Aldehyde test does not exclude Kala-azar infection, a positive result in clinically suspected cases in an endemic area is an applicable diagnostic tool for visceral leishmaniasis.
INTRODUCTION
Visceral leishmaniasis (VL) is a severe disease with high mortality and endemic in 88 countries including 17 developed nations [1,2]. A serious problem in much of the world including Brazil, China, East Africa, India, and areas of the Middle East, leishmaniasis is also endemic in the Mediterranean region including southern France, Italy, Greece, Spain, Portugal and Northern Africa. In areas where leish-maniasis is endemic, recent migration patterns of people, vectors (sandfly) and reservoirs (dogs) have led to the urbanization of VL [3]. In Southern Europe,
VL has become the leading opportunistic infection in AIDS patients [4,5].
The demonstration of Leishman-Donovan bodies (amastigotes) in spleen, bone marrow or lymph node aspirate provides the definite diagnosis of kala-azar. These procedures have some limitation [6,7] because these are not always practicable in rural settings. Specific serological tests are complex, require trained man-power and a well- equipped laboratory. People of low socio-economic group residing in the rural area are often the victims of kala-azar. They are usually beyond the reach of well-equipped laboratory facilities. In such circumstances,
64
the Aldehyde test (AT) (Formol-Gel test), which is nonspecific, is simple to do and less costly. This communication assesses the role of this test in the diagnosis of kala-azar in a part of the world where the diagnostic facilities are scarce.
MATERIALS AND METHODS
One thousand subjects living in the villages of Maung-Daw Township, Rakhine State were tested for the visceral leishmanias is antibody in human serum by using Kalaazar Detect rapid test (InBios International, Inc., USA) in April, 2004. The Kalaazar Detect rapid test for VL is a rapid immunochromatographic (ICT) strip assay for the qualitative detection of antibodies to members of L. donovani in human serum.
Three-hundred cases including 45 ICT positive cases were performed the aldehyde test. The aldehyde test was done by adding one drop of commercial formalin (40% formaldehyde) to 50 ul of serum (WHO manual on VL Control) [8]. Solidi- fication with complete opacity of serum within 10 minutes was taken as strongly positive, within 20 minutes was moderately positive and 30 minutes as weakly positive reaction. In a negative test, the serum remains unchanged or whitening and gelling only occurred after 30 minutes.
RESULTS AND DISCUSSION
In 1,000 subjects from Maung-Daw Township, Rakhine State, 45 cases (4.5%) were positive in VL antibody by using ICT. For comparison of the results of AT and ICT, three- hundred cases including 45 ICT positive cases from Yakhine State and 300 blood samples from National Blood Bank (NBB) as a control were subjected to Aldehyde test (AT). Among 55 AT positive cases, 40 cases (73%) were ICT positive and 15 (27%) cases were negative. Among 45 ICT positive cases, 40 (89%) were also AT positive and 5 (11%) were AT negative (Table 1). Sensitivity and specificity of
Aldehyde test are 87.5% and 93.8% respectively. There was a significant asso-ciation between the two tests (P<0.001). AT and ICT can, therefore, be regarded as equally dependable diagnostic tests for clinically suspected kala-azar patients.
Table1. Results of Aldehyde Test by Immuno- chromatographic Test (n = 300)
ICT AT
Positive Negative Total
Positive 40 (73%) 15 (27%) 55
Negative 5 (2%) 240 (98%) 245
Total 45 255 300
AT = Aldehyde Test ICT = Immunochromatographic Test
Sensi-tivity =
True - False positive negative
True positive 100= 40-5
40 100= 87. 5%
Speci-ficity =
True - False negative positive
True negative 100= 240-15 100= 93. 8%
240 Among 300 cases of the control group (non kala-azar patients), there were nega-tive to AT in 291 (97%) cases and only 9 (3%) were positive (Table 2). The findings of AT between kala-azar and non kala-azar patients were significantly different (P <0.01).
Table 2. Aldehyde Test in kala-azar and normal control
Cases Positive Negative Total
Kala-azar 55 (18.3%) 245 (81.7%) 300
Normal control 9 (3%) 291 (97%) 300
Immunochromatographic strip test (ICT) for the diagnosis of VL was evaluated in a case control study in Bangladesh, parasitological confirmation was done by demonstration of Leishmania donovani bodies in bone marrow or splenic aspiration. ICT strip test for VL was done in all cases and control, sensitivity and specificity of ICT were 96.6% and 98.3%, the predictive value for negative results was 98.3% and for positive
65
results was 96.6% [9]. The ICT findings of Mymensingh Medical College showed 100% sensitivity with 92.3% specificity and sensitivity of AT was 92.1% and 99.5% specificity [10].
2. Marsden PD. Selective primary health care: strategies for control of disease in the developing world. XIV. Leishmaniasis, Rev. Inf. Dis. 1984; 6:736-744.
3. Jeronimo SMB, Oliveira RM, Mackay S. et al. An urban outbreak of visceral leishmaniasis in Natal, Brazil. Transactions of the Royal Society of Tropical Medicine and Hygiene 1994; 88(4):386-368.
AT has been regarded as a non-specific test because false negative results can be encountered in conditions where immunoglobulins are greatly increased for some reasons such as multiple myeloma, leprosy, trypanosomiasis, chronic malaria and chronic liver diseases [11]. However, in conditions like chronic liver diseases, malaria, leprosy and trypanosomiasis, globulin levels do not usually raise high enough to produce a strongly positive AT [12]. Multiple myeloma is a disease where AT may be strongly positive but it seldom produces diagnostic difficulties. There are some other conditions which may be confused with kala-azar clinically such as haemolytic anaemia, chronic myeloid leukaemia, enteric fever, and infective endocarditis, but the AT is negative in all those conditions.
4. Berenguer JS, Moreno E, Cercenado JCL, Bernaldo de Quiros A. Garcia de La Fuenta, Bouza E. Visceral leishmaniasis in patients infected with human immunodeficiency virus (HIV). Annals of International Medicine 1989; 111:129-132.
5. Houghton RL, Petrescu M, Benson, DR., Skeiky YA, Scalone A, Badaro R, Reed SG & Gradoni L. A cloned antigen (recombinant K39) of Leishmania chagasi diagnostic for visceral leishmaniasis in human immunodeficiency virus type 1 patients and a prognostic indicator for monitoring patients undergoing drug therapy. Journal of Infectious Diseases 1998; 177:1339-1344.
6. Maru M. Clinical and laboratory features and treatment of visceral leishmaniasis in hospitalized patients in North-western Ethiopia. American Journal of Tropical Medicine and Hygiene. 1979; 28: 15-18.
7. Chulay JD & Bryceson ADM. Quantitation of amastigotes of Leishmania donovani in smears of splenic aspirates from patients with visceral leishmaniasis. American Journal of Tropical Medicine and Hygiene 1983; 32: 475-78.
Although, a negative AT does not exclude kala-azar (as it requires 3 months to become positive) a strongly positive result in clinically suspected cases in an area where kala-azar is endemic, is very helpful in giving diagnosis.The Aldehyde (Formol-Gel) test is still of value in circumstances where complex serological test can not be done, ICT is not available, and where the performence or interpretation of both bone marrow or splenic aspirate tests for amastigote detection is problematic. It is simple to perform, involves negligible cost and can be done in any rural setting by the clinicians.
8. WHO. Manual on Visceral leishmaniasis Control. Formal-gel test for leishmaniasis. WHO/LEISH/96.40.
9. Sarker CB, Moman A, Jamal MF, Siddiqui NI & Talukder SI. Immunochromatographic (rK39) strip test in the diagnosis of visceral leishmaniasis in Bangladesh. Mymensingh Medical Journal 2003; July: 12 (2); 93-7.
10. Shamsuzzaman AK, Hossain MA, Musa AK, Hasan MU & Dhar DK. A preliminary report on culture of Leishmania donovani in Mymensingh Medical Collage and evaluation of new immunochromatography test (ICT). Mymensingh Medical Journal 2003; January: 12 (1); 51-4.
11. Manson-Bahr PEC. Leishmaniasis. In: Manson-Bahr PEC, Apted FIC eds. Manson's Tropical Disease, 18th edn. London. 1982; 93-115.
REFERENCES
12. Levinson EL, Macfate JH, eds. Clinical Laboratory Diagnosis, 7th edn. London. 1969; 1044.
1. WHO. Control of the Leishmaniasis, World Health Organization, Technical Report Series 1990. No.793.
66
The Myanmar Health Sciences Research Journal, Vol. 18, No. 2, 2006
Russell’s viper (Daboia russelii siamensis) bite: venom and antivenom clearance and outcome of antivenom therapy
*Tun Pe,*Aye Aye Myint & **Khin Aye Kyu
*Venom Research Laboratory Department of Medical Research(LM)
**Ministry of Railway
Venom and antivenom clearance of 134 Russell’s viper (Daboia russelii siamensis) bite cases treated with a variable dose of enzyme refined equine Fab2 antivenom admitted to Taungdwingyi and Thayawady hospitals from 1994-96 were studied. In mild and moderate envenomed cases, neutralisation of venom by the antivenom was achieved within ½ to 2 hours following intravenous 2-4 ampoules of antivenom and in severe envenomed cases, 8 and 4 ampoules of antivenom in ½ and 4 hours and 4 ampoules of precipitated antivenom in 12 hours. Eight out of 22 severe envenoming cases were given an additional 4 ampoules of antivenom because of persistance of incoagulable state. A similar pattern of venom neutralisation by the antivenom was observed in prospective turns severe envenoming cases treated with 4 and 8 ampoules of the antivenom. Mean plasma half-life of the antivenom given to 17 systemic envenomed Russell's viper bite with a venom level more than 60 ng/ml is 15.0±3.58 hr (mean ±SD)(range 5.74 -34.78 hours). Neutralisation of the venom by the antivenom depends on antivenom dose and the initial venom level. A bolus dose of 8 ampoules of antivenom given to severe envenomed cases within 4 hours after the bites did not confer better protection against development of renal failure compared to those given the total in two divided doses indicating that qualitative improvement of antivenom is necessary. Use of precipitated antivenom should be discouraged. Intravenous route is preferred to intramuscular because of slow absorption of antivenom in the latter.
INTRODUCTION
Antivenom therapy is the mainstay in management of snakebite. Myanmar Pharmaceutical Factory manufactures monospecific antivenom for treating Russell's viper and Cobra bites. It is an enzyme refined equine F(ab2) antivenom and comes in liquid and lyophilised forms. Antivenom is used throughout the country for treating specific snake bite. Early neutralization of venom by an adequate dose of potent antivenom is the aim in management of snakebite. The guidelines for antivenom therapy in management of Russell’s viper (Daboia russelii siamensis) bite patients will help in the selection of antivenom dose based
on clinical impression. Four ampoules of antivenom are recommended for treating severe envenoming cases [1, 2]. However, antivenom is given at the discretion of the medical officers in some township hospitals. There are few reports on study of antivenom kinetics of Malayan pit viper ( MPV ) bites [3] and bites following Bothrops species [4] and on suspected Russell's viper bites [5]. However, there is insufficient information on venom and antivenom clearance studies on Russell’s viper bite patients. The purpose of the present study was to determine venom and antivenom clearance of Russell’s viper bite cases treated with a variable dose of antivenom and its outcome.
67
MATERIALS AND METHODS
Russell’s viper bite cases admitted to Taungdwingyi and Thayawady hospitals treated with 1-4 ampoules of antivenom from 1994-96 were reviewed. Routinely, clotting test was carried out on admission sample and degree of envenoming was assessed clinically. Antivenom was given at the discretion of the medical officer, in- charge of the Thayawady Hospital. Routinely, 4 ampoules of antivenom (1 ml neutralises 2 mg of venom) were given to all snakebite patients on admission to Taungdwingyi Hospital. Two milliliters of blood were needed for clotting test that is performed at 6 hours intervals after antivenom therapy until normal clot restoration occurred in severe envenoming cases and 6 hourly for 24 hours in suspected bites. Sera were saved for determination of venom antigen levels. One milliliter of blood was taken at admission, 30 min., hourly to 4 hours, 2 hourly to 12 hours, and then at 12,16,18,24,36,48,60 and 72 hours after antivenom. Serum was collected onto filter paper, air dried and transported to Venom Research Laboratory of the Department of Medical Research (LM), Yangon for determination of venom and antivenom levels by enzyme immunoassay techniques [6,7]. A total of 118 and 100 normal healthy adults from Thayawady and Taungdwingyi respectively who came from the same locality as the snakebite victims but had no history of snakebite were screened for venom antigen. The mean absorbance value ± 2 standard deviations were taken as normal cut-off value for respective snakebite cases. Plasma half-life (t½) of antivenom was calculated by using the trapezoidal method [8]. Arbitrary clinical grading was made according to degree of envenoming [8] and admission venom level into: no envenoming, mild, moderate and severe envenoming and prospective turns severe envenoming cases. Clinical details of the
cases were recorded in standard forms. Samples for determination of venom and antivenom levels following intramuscular injection of one ampoule (half ampoule to each buttock) of antivenom in suspected Russell’s viper bite cases were also available for study. Liquid antivenom was used in Taungdwingyi and lyophilized antivenom in Thayawady study. Intramuscular antivenom study was carried out in Thayawady.
RESULTS
Venom and antivenom clearance of 134 Russell’s viper bite cases (including 11 cases given intramuscular first aid antivenom) were available for the study.
Venom and antivenom neutralization following intravenous antivenom therapy
In non-envenomed cases (n=21), antivenom was cleared from the circulation in 36-60 hours after intravenous injection of one to four ampoules of antivenom. In mild envenomed cases (n=11), (mean admission venom level 21 ng/ml, range 10-30 ng/ml) given 2-3 ampoules of antivenom took half an hour to neutralize venom antigen. In moderate envenomed cases (n=38) (venom level 44 ng/ml, range 10-65 ng/ml) venom antigen was neutralized in 1 hour after injection of 4 ampoules and half an hour in 8 ampoules of antivenom that was detectable at 36 hours after injection.
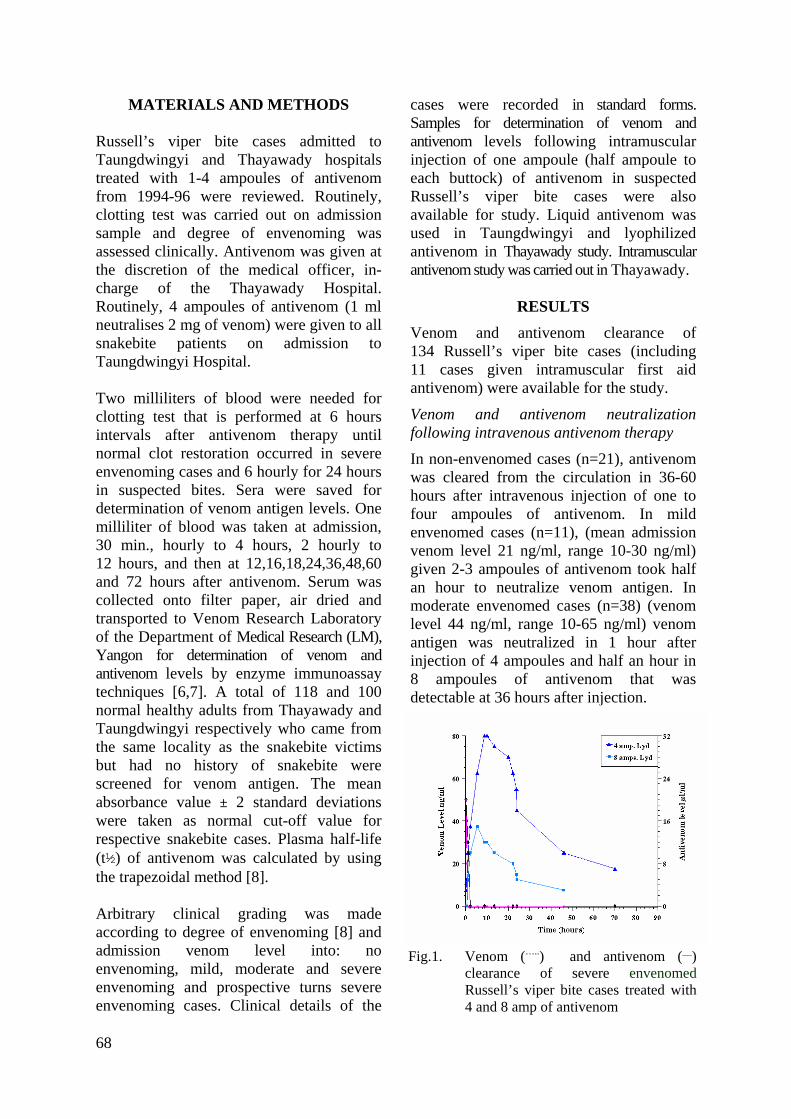
Fig.1. Venom (…..) and antivenom (__)
clearance of severe envenomed Russell’s viper bite cases treated with4 and 8 amp of antivenom
68
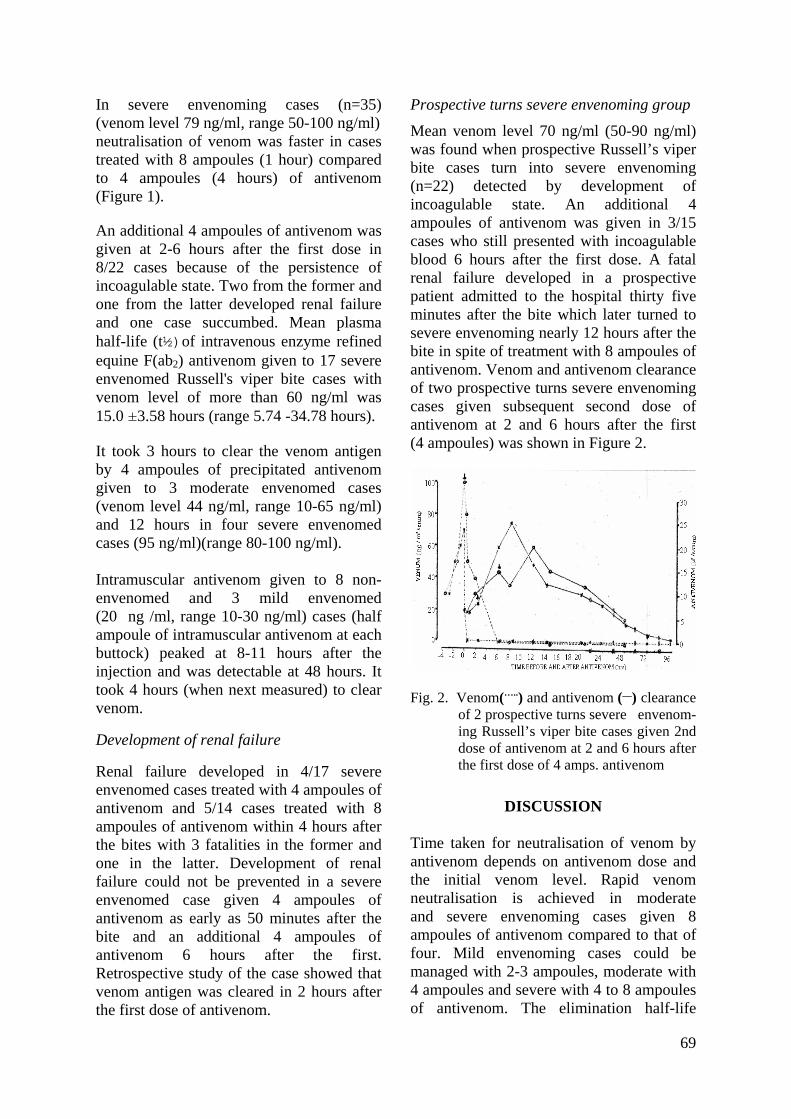
In severe envenoming cases (n=35) (venom level 79 ng/ml, range 50-100 ng/ml) neutralisation of venom was faster in cases treated with 8 ampoules (1 hour) compared to 4 ampoules (4 hours) of antivenom (Figure 1).
An additional 4 ampoules of antivenom was given at 2-6 hours after the first dose in 8/22 cases because of the persistence of incoagulable state. Two from the former and one from the latter developed renal failure and one case succumbed. Mean plasma half-life (t½)of intravenous enzyme refined equine F(ab2) antivenom given to 17 severe envenomed Russell's viper bite cases with venom level of more than 60 ng/ml was 15.0 ±3.58 hours (range 5.74 -34.78 hours).
It took 3 hours to clear the venom antigen by 4 ampoules of precipitated antivenom given to 3 moderate envenomed cases (venom level 44 ng/ml, range 10-65 ng/ml) and 12 hours in four severe envenomed cases (95 ng/ml)(range 80-100 ng/ml). Intramuscular antivenom given to 8 non-envenomed and 3 mild envenomed (20 ng /ml, range 10-30 ng/ml) cases (half ampoule of intramuscular antivenom at each buttock) peaked at 8-11 hours after the injection and was detectable at 48 hours. It took 4 hours (when next measured) to clear venom.
Development of renal failure
Renal failure developed in 4/17 severe envenomed cases treated with 4 ampoules of antivenom and 5/14 cases treated with 8 ampoules of antivenom within 4 hours after the bites with 3 fatalities in the former and one in the latter. Development of renal failure could not be prevented in a severe envenomed case given 4 ampoules of antivenom as early as 50 minutes after the bite and an additional 4 ampoules of antivenom 6 hours after the first. Retrospective study of the case showed that venom antigen was cleared in 2 hours after the first dose of antivenom.
Prospective turns severe envenoming group
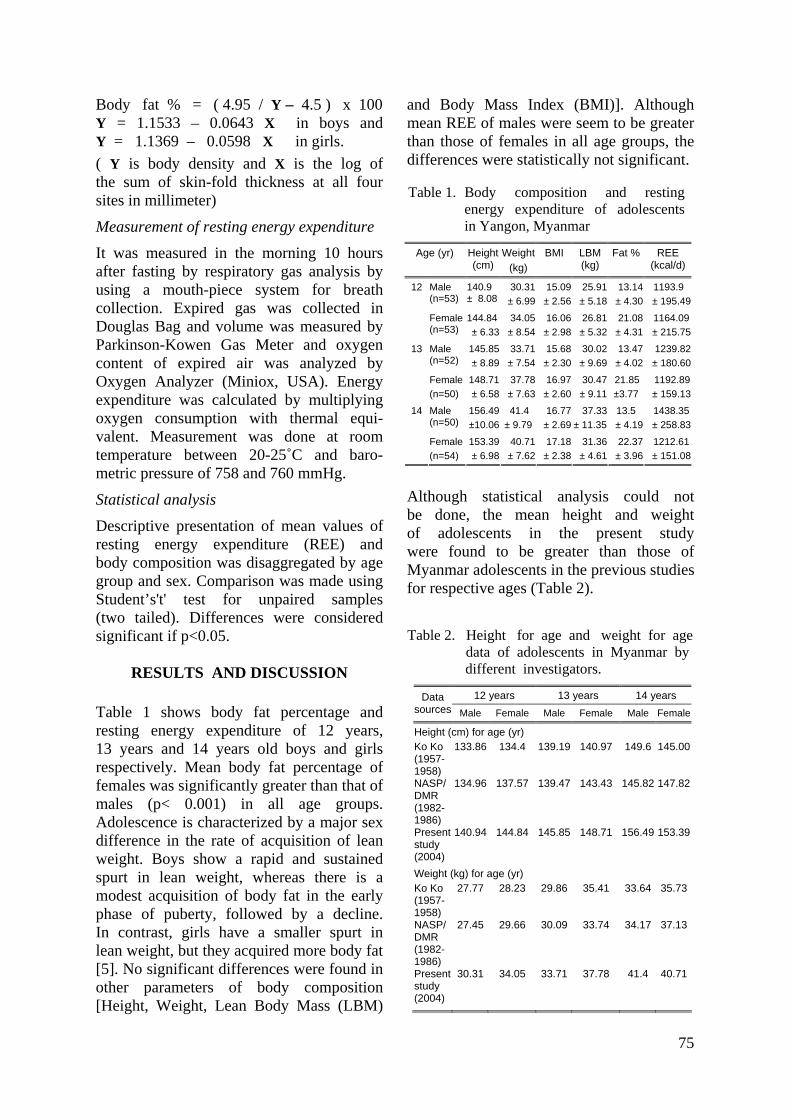
Mean venom level 70 ng/ml (50-90 ng/ml) was found when prospective Russell’s viper bite cases turn into severe envenoming (n=22) detected by development of incoagulable state. An additional 4 ampoules of antivenom was given in 3/15 cases who still presented with incoagulable blood 6 hours after the first dose. A fatal renal failure developed in a prospective patient admitted to the hospital thirty five minutes after the bite which later turned to severe envenoming nearly 12 hours after the bite in spite of treatment with 8 ampoules of antivenom. Venom and antivenom clearance of two prospective turns severe envenoming cases given subsequent second dose of antivenom at 2 and 6 hours after the first (4 ampoules) was shown in Figure 2.
Fig. 2. Venom(…..) and antivenom (__) clearance of 2 prospective turns severe envenom-ing Russell’s viper bite cases given 2nd dose of antivenom at 2 and 6 hours after the first dose of 4 amps. antivenom
DISCUSSION
Time taken for neutralisation of venom by antivenom depends on antivenom dose and the initial venom level. Rapid venom neutralisation is achieved in moderate and severe envenoming cases given 8 ampoules of antivenom compared to that of four. Mild envenoming cases could be managed with 2-3 ampoules, moderate with 4 ampoules and severe with 4 to 8 ampoules of antivenom. The elimination half-life
69

of the three commercial monospecific antivenom in 26 patients systemically envenomed by Malayan pit viper (Callo-selasma rhodostoma) in southern Thailand [3] ranged from 45.5 to 96 hours. An earlier study on antivenom clearance of 4 ampoules of lyophilized antivenom on six suspected Russell’s viper bite cases using radio-immunoassay technique was 36 hours (26-50 hours) [5]. Mean plasma half-life (t½) of 17 severe envenomed Russell's viper bite cases with venom level more than 60 ng/ml given 4 ampoules of enzyme refined equine antivenom was 15.0 ±3.58 hours (range 5.74 -34.78 hours). The difference could be attributed to the use of data based on a few sampling points in the former. Neutralisation of venom by 4 and 8 ampoules of antivenom in severe envenomed cases show that 4 ampoules of antivenom is sufficient for treating these cases, since venom is cleared in 2-4 hours after therapy with no resurgence of the venom. It is assumed to be adequate for most severe envenoming cases if given in the early hours after the bite except in some cases [11]. However, giving additional antivenom in cases who still have incoagulable blood after 4 ampoules of antivenom is justified in the sense that venom-induced effects are not completely neutralized yet. Failure in clot restoration after 2 doses of 4 ampoules of antivenom in severe envenoming cases has also been reported [12]. The observation calls for improvement in quality of antivenom. It is suggested that in order to achieve early neutralization of venom-induced effects in severe envenoming cases with systemic complications, a bolus dose of 8 ampoules should be given rather than giving the total in divided doses.
An earlier study showed that a bolus dose of 4 ampoules of antivenom given to severe envenoming Russell's viper cases in the field soon after bite has a better chance of preventing development of renal failure than
giving the total in divided doses [10]. In the present hospital-based study, no difference in preventing development of renal failure was observed in severe envenomed cases treated with a bolus dose of 8 ampoules or the total given in two divided doses within 4 hours after the bite. However, fatality rate was higher in the latter compared to the former. The difference between the two studies could be due to the fact that 57% of the earlier study cases received antivenom within 1 hour after the bites in the field. A severe envenoming case treated with 4 ampoules of antivenom as early as 50 minutes after the bite plus another 4 ampoules of antivenom after 6 hours failed to prevent onset of renal failure. It has been documented that administration of 4-10 ampoules of antivenom within 4 hours after Russell’s viper bite to the victims did not prevent development of renal failure [9]. It is speculated that antivenom raised with potent anti procoagulant and nephrotoxic factors may be more effective. A slow build-up of incoming venom released from venom depot in prospective turns severe envenoming cases should be neutralized rapidly and early with an adequate amount of antivenom in order to minimize prolonged exposure of venom- induced effects on vital organs. Development of systemic complications, renal failure and death has been reported from this group. Quantitation of venom antigen using dipstick [13] will be of value in monitoring the trend of venom level in these cases along with the clotting test [14] and antivenom could be given early or before clotting test detected incoagulable state. Since local health workers (midwives) are permitted to give antivenom intravenously, this route is preferred to intramuscular since rapid neutralisation of venom by antivenom is vital in management of snakebite. However, intramuscular anti-venom could be used as first aid in bites occurring at a distance from the health centre where giving
70

intravenous route of antivenom is not available. It should be given in antero lateral aspect of the thigh instead of buttock where absorption is delayed. Again poor or lack of venom neutralizing efficacy of precipitated antivenom was documented and its use should be discouraged since it gives a false sense of security [15]. Moreover, it is unethical to give precipitated antivenom. Proper storage of liquid antivenom in the absence of cold chain should be promoted [16].
ACKNOWLEDGEMENTS
We would like to acknowledge Dr. Win Aung, formerly of Biochemistry Research Division, Department of Medical Research (Lower Myanmar) for provision of samples from intramuscular antivenom study and Dr Thaw Zin, Pharmacotoxi-cology Research Division, Department of Medical Research (LM) for calculation of plasma clearance time of antivenom.
REFERENCES 1. Hla Myint, Hla Mon, Mg Mg Khin &Thet Win.
Snakebite and envenomation. In: Internal Medicine Section, Burma Medical Association, eds. Textbook of Internal Medicine. Rangoon, Burma Medical Association 1982; 16:10-16.26.
2. Snakebite Research Group, Department of Medical Research, Ministry of Health, Yangon. A Guide to Management of Snakebite 2004; 21.
3. Ho M, Silamut K, White NJ, Karbwang J, Looareesuwan S, Phillips RE & Warrell DA. Pharmacokinetics of three commercial antivenoms in patients envenomed by the Malayan pit viper (Calloselasma rhodostoma) in Thailand. American Journal of Tropical Medicine and Hygiene 1990; 42: 260-266.
4. Theakston RDG, Fan HW, Warrell DA, Dias Da Silva WD & et al. The Butan Institute of Antivenom Study Group. Use of enzyme immunoassays to compare the effect and assess the dosage regimens of three Brazilian Bothrops antivenoms. American Journal of Tropical Medicine and Hygiene 1992; 47:593-604.
5. Thein Than, Kyi Thein, Maung Maung Thwin. Plasma clearance time of Russell’s viper (Vipera
russelli) antivenom in human snakebite victims. Transactions of the Royal Society of Tropical Medicine & Hygiene 1985; 79:262-263.
6. Tun Pe, Ba Aye, Aye Aye Myint, Tin Nu Swe & Warrell DA. Bites by Russell’s vipers (Daboia russelii siamensis) in Myanmar: effect of the snake’s length and recent feeding on venom antigenaemia and severity of envenoming. Transactions of the Royal Society of Tropical Medicine & Hygiene 1991; 85: 804-808.
7. Voller A, Bidwell D & Bartlett A. Enzyme-linked Immunosorbent Assay (ELISA). A guide with abstracts of microplate applications. Dynatech Europe 1979.
8. Abbot P. Teach yourself calculus. ELBS edit. University Press (London) 1967; 268.
9. Myint Lwin, Warrell DA, Phillips RE, Tin Nu Swe, Tun Pe & Maung Maung Lay. Bites by Russell’s viper (V. russelli siamensis) in Burma: haemostatic, vascular and renal disturbances and response to treatment. Lancet 1985; ii: 1259-1264.
10. Tun Pe, Aye Aye Myint, Min Naing & Than Win. The efficacy of a bolus dose of Russell’s viper antivenom in treating viper bite cases. Myanmar Health Sciences Research Journal 1993; 5:135-137.
11. Tun Pe, Aye Aye Myint, Khin Aye Kyu & Sann Mya. The role of early intravenous antivenom in management and outcome of Russell's viper (Daboia russelii siamensis) bite cases. In: Management of Snakebite and Research, WHO/SEARO publication 2002; 17-22.
12. Tun Pe, Aye Aye Myint, Sann Mya, Khin Aye Kyu, Kyaw Than, Aung Myint, Tint Lwin, Myint Soe & Min Than. Clinical features of Russell's viper (Daboia russelii siamensis) bite cases admitted to six township hospitals of snakebite endemic divisions of Myanmar. In: Management of Snakebite and Research, WHO/SEARO publication 2002;34-40.
13. Aye Aye Myint, Tun Pe & Tin Zar Maw. A dipstick test for rapid diagnosis of Russell's viper (Daboia russelii siamensis) bite (A 20 minute Russell's viper dipstick). In: Management of Snakebite and Research, WHO/SEARO publication 2002; 106-109.
14. Warrell DA, Davidson N McD, Greenwood BM, Omerod LD et al. Poisoning by bites of the sawscaled or carpet viper (Echis carinatus) in Nigeria. Quarterly Journal of Medicine 1977; 46:33-62.
15. Tun Pe, Aye Aye Myint, Nu Nu Aung, Khin Aye Kyu & Tin Oo. Study of venom neutralizing efficacy of monospecific cloudy
71

liquid antivenom. Myanmar Health Sciences Research Journal 1995; 7:149-152.
16. Tun Pe, Aye Aye Myint & Kyi May Htwe. Potency assay of the liquid Russell's viper
(Daboia russelii siamensis) antivenom stored at different environment. In: Management of Snakebite and Research, WHO/SEARO publi-cation 2002;81-85. 2002.
72

The Myanmar Health Sciences Research Journal, Vol. 18, No. 2, 2006
Body composition and resting energy expenditure of adolescents in Yangon, Myanmar
*Ye Tint Lwin,*Tin Khine Myint,**Ni Thet Oo,
*Sandar Win,*Khin San Lwin & *Wah Wah Win
*Physiology Research Division **Publications Division
Department of Medical Research (Lower Myanmar)
A cross-sectional descriptive study of body composition and resting energy expenditure (REE) of 312 adolescents (155 boys and 157 girls) was conducted in five state high schools in Yangon, Myanmar. The body composition was measured by anthropometry and resting energy expenditure was determined by indirect calorimetry method. Although statistically not significant, mean body mass index (BMI) of 12, 13 and 14 year-old girls was greater than that of age-matched boys (16.06 ± 2.98 vs 15.09 ± 2.56, 16.97 ± 2.60 vs 15.68 ± 2.30 and 17.18 ± 2.38 vs 16.77 ± 2.69 respectively). Mean lean body mass (LBM) of 12- year-old girls was greater than that of the boys (26.81 ± 5.32 kg vs 25.91 ± 5.18 kg) but 14- year-old boys has greater LBM than that of the girls (37.33 ± 11.75 kg vs 31.35 ± 4.61 kg). Mean body fat percentage of the girls was significantly (p < 0.01) greater than that of the boys in all age groups (21.08 ± 4.31% vs 13.14 ± 4.30%, 21.85 ± 3.77% vs 13.47 ± 9.11% and 22.37 ± 3.96% vs 13.50 ± 4.19% respectively). Mean resting energy expenditures (REE) of 12, 13 and 14 -year-old boys were 1193.90 ± 195.49 kcal/d, 1239.82 ± 180.60 kcal/d and 1438.35 ± 258.83 kcal/d respectively and those of the girls were 1164.09 ± 215.75 kcal/d, 1192.89 ± 159.13 kcal/d and 1212.61 ± 151.08 kcal/d respectively. These data will serve as a base-line data of current nutritional and metabolic status of adolescents in Yangon, Myanmar.
INTRODUCTION
For most public health purposes as well as for many clinical applications, total body weight is divided conceptually into two compartments, fat free mass and fat mass. The fat free mass as a percent of body weight in healthy people ranges from 65 to 85 percent. Some of the variations in healthy people are due to gender, age and ethnicity. The fat free mass is made of protein, water and minerals. Undernutrition and overnutrition alter body composition. Severely malnourished under-weight chil-dren are not just scaled down version of normal children but differ markedly in body composition. In Myanmar, the prevalence of under-weight in adolescents was 41.5 %
among boys and 22.2 % among girls and the prevalence of stunting 37.6 % and 30.4 % respectively [1]. On the other hand, obesity in children, adolescents and adults has a major impact on health. It is a risk factor in the development of diabetes, renal disorders, vascular problems and early death. Obesity can limit activity, pro-ductivity and increase absenteeism from the work place. According to hospital statistics, nutrition and food related cardiovascular diseases were found to be 42 % in rural area and 57.9 % in urban area [2] and the prevalence of diabetes mellitus in Hlegu Township was 6.3 % [3]. Therefore, on top of the existing malnutrition problem, increasing incidence of cardiovascular diseases and diabetes resulting from
73

changing economy, industrialization and life style of the country worsen the scenario of the health problem related to energy imbalance. Body composition is a reliable tool for measuring the nutritional status. According to the basic principle of thermo-dynamics, all dietary energy (calories eaten) is either utilized (expended) or is stored. In persons who are gaining or losing weight, energy stores are either increased (weight) or are used as energy source (weight loss). The difference between dietary energy and energy expended is equal to the total amount of energy stored. Thus, measure-ment of energy expenditure is very useful for determining how much energy has been stored and are indispensable for strategies to reduce the morbidity and mortality associated with undesirable body compo-sition. Additionally, energy expenditure measurements are useful for measuring food intake and energy needs in condition of pregnancy, lactation, growth and aging as well as for monitoring the effectiveness of nutritional education and behavioral modification programs.
MATERIALS AND METHODS Study design
Cross-sectional descriptive study
Subjects
Multistage sampling method was employed. From the sixteen states and divisions of Myanmar, Yangon, being the capital city of Myanmar, was purposively chosen. Initially, five townships in Yangon were randomly chosen. Then one high school from each township was again randomly selected. The selected schools were No.4 State High School, Ahlone Township, No.1 State High School, Insein Township, No.3 State High School, North Okkalapa Township, No.1 State High School, Mingala Taungnyunt Township and No.3 State High School, Thanlyin Township. Registered list of students was used as sampling frame. The
eligible age range was from 12 to 14 years. The decimal year system was used. The age of the subject was obtained by subtracting the date of birth from the date of examination. The figure was corrected to two decimal places. The age group was the mid point of age range. To be able to describe a mean measure of a specific age and sex group in appropriate type 1 and type 2 errors, sample size was calculated based on hypothesized population para-meters. Mean and standard deviation of Body Mass Index (BMI) of 13 year-old males is used as a hypothesized value in the calculation. The calculated sample size was fifty male and fifty female students (a total of 100) at each age group. To obtain 100 adolescents from each age group, 10 male adolescents and 10 female adolescents were randomly selected from each school. Of them, 312 (155 males and 157 females) completed the study.
Anthropometric and body composition assessment
Body weight was measured with a bathroom scale weighing machine, calibrated with standardized weights. Subjects were weighed barefooted with a minimum of clothing. The weight was recorded to the nearest 0.1 kg.
Standing height was measured to the nearest 0.1 cm using a stadiometer. Subjects stood barefoot on a flat horizontal surface, their head held in the Frankfurt plane and with their heels, buttocks and shoulders touching the wall.
Body Mass Index (BMI) was calculated as weight / height2 (kg/m2).
Body composition was assessed by measurements of skin- fold thickness. Skin-fold thickness at sites of biceps, triceps, sub-scapular and supra iliac were measured on the left side of the body using a Harpenden caliper by a well-trained technician. Body fat percent was calculated by using the formula described by Durnin and Rahaman, 1967 [4].
74
Body fat % = ( 4.95 / Y – 4.5 ) x 100 Y = 1.1533 – 0.0643 X in boys and Y = 1.1369 – 0.0598 X in girls. ( Y is body density and X is the log of the sum of skin-fold thickness at all four sites in millimeter)
Measurement of resting energy expenditure
It was measured in the morning 10 hours after fasting by respiratory gas analysis by using a mouth-piece system for breath collection. Expired gas was collected in Douglas Bag and volume was measured by Parkinson-Kowen Gas Meter and oxygen content of expired air was analyzed by Oxygen Analyzer (Miniox, USA). Energy expenditure was calculated by multiplying oxygen consumption with thermal equi-valent. Measurement was done at room temperature between 20-25˚C and baro-metric pressure of 758 and 760 mmHg.
Statistical analysis
Descriptive presentation of mean values of resting energy expenditure (REE) and body composition was disaggregated by age group and sex. Comparison was made using Student’s't' test for unpaired samples (two tailed). Differences were considered significant if p<0.05.
RESULTS AND DISCUSSION
Table 1 shows body fat percentage and resting energy expenditure of 12 years, 13 years and 14 years old boys and girls respectively. Mean body fat percentage of females was significantly greater than that of males (p< 0.001) in all age groups. Adolescence is characterized by a major sex difference in the rate of acquisition of lean weight. Boys show a rapid and sustained spurt in lean weight, whereas there is a modest acquisition of body fat in the early phase of puberty, followed by a decline. In contrast, girls have a smaller spurt in lean weight, but they acquired more body fat [5]. No significant differences were found in other parameters of body composition [Height, Weight, Lean Body Mass (LBM)
and Body Mass Index (BMI)]. Although mean REE of males were seem to be greater than those of females in all age groups, the differences were statistically not significant.
Although statistical analysis could not be done, the mean height and weight of adolescents in the present study were found to be greater than those of Myanmar adolescents in the previous studies for respective ages (Table 2).
When com-parison was done on
Table 2. Height for age and weight for age data of adolescents in Myanmar by different investigators.
12 years 13 years 14 years Data sources Male Female Male Female Male Female
Height (cm) for age (yr) Ko Ko (1957-1958)
133.86 134.4 139.19 140.97 149.6 145.00
NASP/DMR (1982-1986)
134.96 137.57 139.47 143.43 145.82 147.82
Present study (2004)
140.94 144.84 145.85 148.71 156.49 153.39
Weight (kg) for age (yr) Ko Ko (1957-1958)
27.77 28.23 29.86 35.41 33.64 35.73
NASP/DMR (1982-1986)
27.45 29.66 30.09 33.74 34.17 37.13
Present study (2004)
30.31 34.05 33.71 37.78 41.4 40.71
Table 1. Body composition and resting energy expenditure of adolescents in Yangon, Myanmar
Age (yr) Height (cm)
Weight(kg)
BMI LBM (kg)
Fat % REE (kcal/d)
Male (n=53)
140.9± 8.08
30.31± 6.99
15.09 ± 2.56
25.91 ± 5.18
13.14 ± 4.30
1193.9 ± 195.49
12
Female (n=53)
144.84± 6.33
34.05± 8.54
16.06 ± 2.98
26.81 ± 5.32
21.08 ± 4.31
1164.09± 215.75
Male (n=52)
145.85± 8.89
33.71± 7.54
15.68 ± 2.30
30.02 ± 9.69
13.47 ± 4.02
1239.82± 180.60
13
Female(n=50)
148.71± 6.58
37.78± 7.63
16.97 ± 2.60
30.47 ± 9.11
21.85 ±3.77
1192.89± 159.13
Male (n=50)
156.49±10.06
41.4 ± 9.79
16.77 ± 2.69
37.33 ± 11.35
13.5 ± 4.19
1438.35± 258.83
14
Female(n=54)
153.39± 6.98
40.71± 7.62
17.18 ± 2.38
31.36 ± 4.61
22.37 ± 3.96
1212.61± 151.08
75
When comparison was done on percentages of stunted (<-2SD of NCHS standard of height for age) and severely stunted growth (<-3SD of NCHS standard of height for age) of adolescents between the present study and those of five countries (Indonesia, India, Vietnam, Ghana and Tanzania), the pro-portion of stunted growth adolescents in the present study was found to be low. However, when under weight (<-2SD of NCHS standard of weight for age) and severely underweight (<-3SD of NCHS standard of weight for age) adolescents were compared, the proportion of under- weight adolescents was not much different (Table 3).
When the REE of the adolescents in the study were compared with predicted basal metabolic rate (BMR) based on weight for age, the values were more or less similar but when comparison was done with BMR of adolescent of respective ages described by WHO based NCHS standard of height for the age and weight for the age, the REE of the adolescents in the study were found to be low (Table 4 ). Mean body weight of the
Table 4. Comparison of measured resting energy expenditure of adolescents to calculated basal metabolic rate based on body weight and basal metabolic rate described by WHO for respective age groups.
Present Study (2004) WHO (1985)
Age
(Year)
Sex REE(kcal/d) (measured)
BMR (kcal/d) (predicted)
BMR (kcal/d)
M 1193.9 ± 195.49
1146.37 ± 119.26 1300 12
F 1164.09 ± 215.75
1162. 75 ± 103.62 1220
M 1239.82 ± 180.60
1200.46 ± 121.19 1370 13
F 1192.89 ± 159.13
1206.67 ± 93.33 1280
M 1438.35 ± 258.83
1312.46 ± 149.82 1465 14
F 1212.61 ± 151.08
1242.62 ± 93.02 1340
M = Male , F = Female Table 3. Comparison of percentages of stunted growth and underweight adolescents in the present study with those of the adolescents from five countries' study (Indonesia, India, Vietnam, Tanzania and Ghana)
Five countries'
study Present study (2004)
12 13 14
Age (Years) 7 – 17
M F M F M F Height(cm) for age(yr) %
- 2SD of NCHS
standard
48 –56 28.3 7.55 19.23 18 12 20.37
- 3SD of NCHS
standard
15 –22 1.89 3.77 5.77 6
4 -
Weight (kg) for age(yr) % - 2SD of NCHS
standard
34 –62 35.9 20.75 36.54 14 26 16.67
- 3SD of NCHS
standard
2 – 11 - - 1.92 - 6 3.70
M = Male , F = Female
adolescents in the study was found to be between 15th and 20th percentile of NCHS standard for respective age groups. Since body weight is the most useful index of BMR for practical purposes [6], the low body weight might be the reason for low resting energy expenditure of adolescents in the present study.
ACKNOWLEDGEMENT
We would like to thank the Director General of the Department of Medical Research (Lower Myanmar) for his keen interest and kind permission to conduct this project. Our heartfelt thanks are also extended to the Director General of the Department of Basic Education No.(3) for his permission and to the Headmasters of No.4 State High School, Ahlone Township, No.1 State High School, Insein Township, No.3 State High School, North Okkalapa Township, No.1 State High School, Mingala Taungnyunt Township and No.3 State High School, Thanlyin Township for allowing us to conduct this research work. Last but not the least, we owe our gratitude to all the subjects without their full co-operation our study would not have been possible.
76
REFERENCES 1. Phyu Phyu Aung & Hla Kyi. Country paper of
Myanmar Adolescents. Submitted in Regional meeting on improvement of nutritional status of
adolescents. Chardigarh, India. 17 – 19 Sept, 2002.
2. Aung, Myo Thet Tun, Thein Ngwe, Nyan Tunand & May Mon Kyaw. Prevalence of Cardiovascular Diseases in rural area of Hmawbi and urban Yangon city. Asia Pacific Journal of Public Health 1993; 6(4): 188 – 194.
3. Tint Swe Latt et al. A study of glucose intolerance and associated risk factors in Hlegu
Township. Myanmar Health Research Congress Abstracts. 2002, p 5 – 6.
4. Durnin JVGA & Rahaman MM. The assessment of the amount of fat in the human from measurement of skin-fold thickness. British Journal of Nutrition 1967; 21: 681 – 688.
5. World Health Organization. Energy and protein requirements: report of a joint FAO/WHO/UNU Expert Consultation. WHO Technical Report Series 1985, No. 724.
6. World Health Organization. Energy and protein requirements: report of a Joint FAO/WHO Ad Hoc Expert Committee. WHO Technical Report Series 1973, No. 522.
77

The Myanmar Health Sciences Research Journal, Vol. 18, No. 2, 2006
Antibacterial activity of oils of clove and garlic on bacterial isolates (special emphasis on coagulase- positive Staphylococcus aureus )
from patients with septic wound (anapauk) from Traditional Medicine Hospital
*Lwin Lwin Cho, **Mar Mar Nyein,*Win Myint, *Sein Win & ***May Kyi Aung
*Traditional Medicine Research
**Bacteriology Research Division (DMR,LM) ***Microbiology Department, University of Medicine 2
Wound swab samples from 50 patients (age ranged from 13-69 years) attending Traditional Medicine Hospital from 25 January to 26 April 2005, were collected in Stuart's transport media. Isolation of bacterial pathogens was proceeded by standard methods, using Blood agar, Mannitol Salt agar, MacConkey agar, Nutrient agar and Ashdown agar. Further diagnosis was done by Gram staining, biochemical and serology reaction. Among them, coagulase - positive Staphylococcus aureus was isolated from 30 cases (60%). Moreover, Escherichia coli from 8 cases (16%), Klebsiella aerogenes from 3 cases (6.0%), Proteus vulgaris from 6 cases (12.0%) and Pseudomonas pyocyanea from one case (2.0%) were also identified. The antibiogram of Staphylococcus aureus revealed that 96.7% were susceptible to sulfamethoxazole-trimethoprim followed by tetracycline (53.3%), cefotaxime (13.3%) and erythromycin (3.3%). It was found that 18, 27, 15, 20, 20, 30 and 24 isolates were susceptible to tetracycline, ceftriazone, cefalothin, erythromycin, cloxacillin, clove oil and garlic oil respectively. Majority of them were intermediate susceptible to ampicillin (70.0%) and resistant to cloxacillin (23.3%). The extracts of three medicinal plants: Allium sativum (kyet-thun-phyu) bulb, Azadirachta indica (tamar) leaves and Eupatorium odorantum (bizat) leaves by 97% ethanol, 50% ethanol and watery types were tested on the isolated S. aureus but showed no anti-bacterial activity. However, the antibacterial activity was obtained when tested with fresh juice of garlic and clove oil. The Minimum Inhibitory Concentration (MIC) of fresh garlic juice was 1.3 to 2% (v/v) and 1.3 to 5% (v/v) by agar plate dilution and test tube serial dilution methods respectively.
INTRODUCTION
More than 100 years, Staphylococcus aureus remains a versatile and dangerous pathogen which plays an important role in sepsis and abscess formation. The frequencies of both community - acquired and hospital - acquired staphylococcal infections have increased readily, with little change in overall mortality. Treatment of these infections has become more difficult because of the emergence of multidrug-resistant strains [1]. Staphylococcus aureus had been recognized since 1883 as a common cause of infection and the
mortality rate was 82%. The organisms conjugate and share plasmids most frequently with organisms in the same environment, with similar cell walls [2]. A systematic review on seven randomized trials of the use of honey as a dressing for burns or wounds concluded that honey was effective [3]. Subrahmanyam (1996) reported that wound healing in honey treated patients occurred in 10 days in 275/450 patients and in 15 days in 350/450. The mean time for wound healing was 9 days. In conventional - treated patients wounds healed in 12-28 days with a mean time to wound healing of 13.5 days.
78
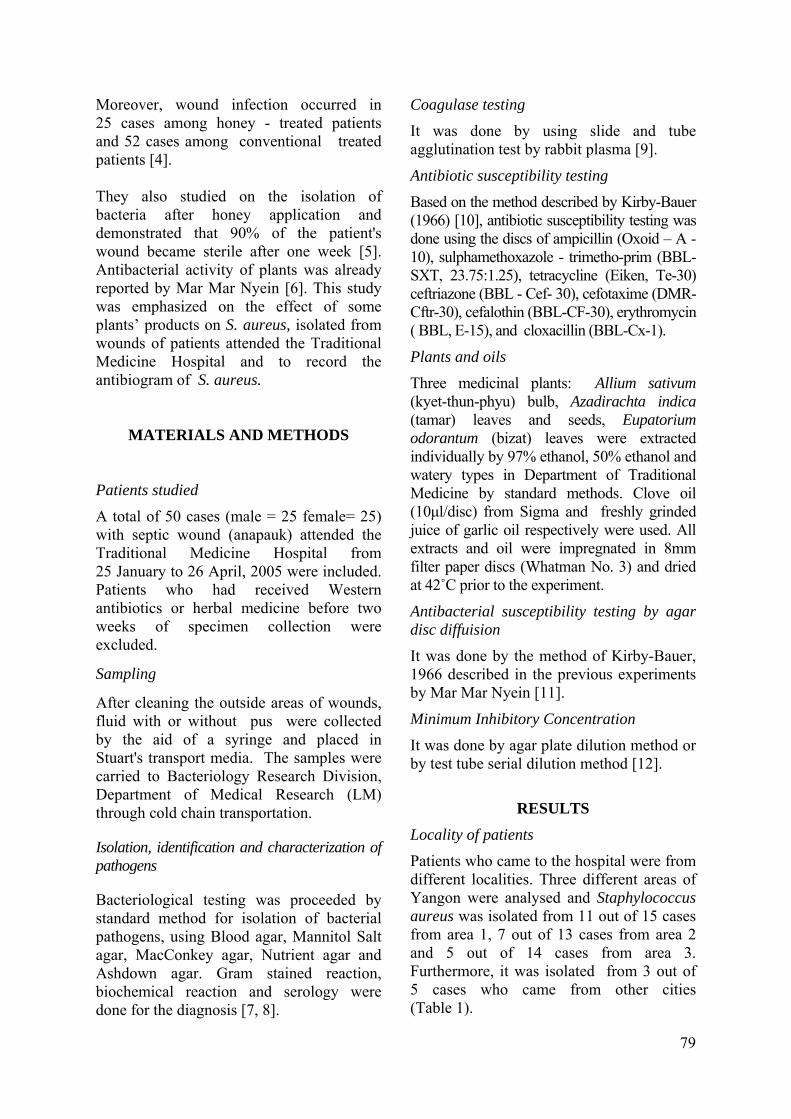
Moreover, wound infection occurred in 25 cases among honey - treated patients and 52 cases among conventional treated patients [4]. They also studied on the isolation of bacteria after honey application and demonstrated that 90% of the patient's wound became sterile after one week [5]. Antibacterial activity of plants was already reported by Mar Mar Nyein [6]. This study was emphasized on the effect of some plants’ products on S. aureus, isolated from wounds of patients attended the Traditional Medicine Hospital and to record the antibiogram of S. aureus.
MATERIALS AND METHODS
Patients studied
A total of 50 cases (male = 25 female= 25) with septic wound (anapauk) attended the Traditional Medicine Hospital from 25 January to 26 April, 2005 were included. Patients who had received Western antibiotics or herbal medicine before two weeks of specimen collection were excluded.
Sampling
After cleaning the outside areas of wounds, fluid with or without pus were collected by the aid of a syringe and placed in Stuart's transport media. The samples were carried to Bacteriology Research Division, Department of Medical Research (LM) through cold chain transportation.
Isolation, identification and characterization of pathogens
Bacteriological testing was proceeded by standard method for isolation of bacterial pathogens, using Blood agar, Mannitol Salt agar, MacConkey agar, Nutrient agar and Ashdown agar. Gram stained reaction, biochemical reaction and serology were done for the diagnosis [7, 8].
Coagulase testing
It was done by using slide and tube agglutination test by rabbit plasma [9].
Antibiotic susceptibility testing
Based on the method described by Kirby-Bauer (1966) [10], antibiotic susceptibility testing was done using the discs of ampicillin (Oxoid – A -10), sulphamethoxazole - trimetho-prim (BBL-SXT, 23.75:1.25), tetracycline (Eiken, Te-30) ceftriazone (BBL - Cef- 30), cefotaxime (DMR-Cftr-30), cefalothin (BBL-CF-30), erythromycin ( BBL, E-15), and cloxacillin (BBL-Cx-1).
Plants and oils
Three medicinal plants: Allium sativum (kyet-thun-phyu) bulb, Azadirachta indica (tamar) leaves and seeds, Eupatorium odorantum (bizat) leaves were extracted individually by 97% ethanol, 50% ethanol and watery types in Department of Traditional Medicine by standard methods. Clove oil (10μl/disc) from Sigma and freshly grinded juice of garlic oil respectively were used. All extracts and oil were impregnated in 8mm filter paper discs (Whatman No. 3) and dried at 42˚C prior to the experiment.
Antibacterial susceptibility testing by agar disc diffuision
It was done by the method of Kirby-Bauer, 1966 described in the previous experiments by Mar Mar Nyein [11].
Minimum Inhibitory Concentration
It was done by agar plate dilution method or by test tube serial dilution method [12].
RESULTS
Locality of patients
Patients who came to the hospital were from different localities. Three different areas of Yangon were analysed and Staphylococcus aureus was isolated from 11 out of 15 cases from area 1, 7 out of 13 cases from area 2 and 5 out of 14 cases from area 3. Furthermore, it was isolated from 3 out of 5 cases who came from other cities (Table 1).
79

Site of infection
Wounds occurred in different sites and isolation of pathogens regarding to bacterial species is shown in Table 2. Out of 30 cases with Staphylococcus aureus, 12 cases were also infected with other pathogens such as Proteus mirabilis, Klebsiella aerogenes or with E. coli. Escherichia coli was isolated from 3 cases, Klebsiella aerogenes, Proteus and Pseudomonas pyocyanea were isolated from one case each.
Isolation of bacterial pathogens
Isolation of coagulase positive Staphylococcus aureus is shown in Table 3. A total of 30 strains were isolated from different age groups. Moreover, E. coli, Klebsiella spp., Proteus spp and Pseudomonas pyocyanea were isolated from 8 cases, 3 cases, 6 cases and one case respectively.
Antibiogram of Staphylococcus aureus
It was found that 96.7% were susceptible to sulfamethoxazole-trimethoprim followed
Table 1. Localities of the patients
Sr.No. Localities of patients Tested cases
Cases infected with Staphylo-coccus aureus
Bahan Kyaukmyaung Tamwe Kamayut Kyimyindine
1.
Yangon city
Pabedan
15
11 (73.33)
Dagon myothit Okkalapa Shwepyithar
2.
Yangon Insein
13
7 (53.33)
Thaketa Pazundaung Thingangyun Dawpon Kyauktan
3.
Yangon
Hmawbi
14
5 (35.71)
4.
Other cities
Dedaye Yenangyaung Rhakine Kyeikhto Paungde
5
3 (60.00)
5. Unknown 3 3
Total 50 30 (60.00)
Figures in parenthesis denote percentages
Table 2. Sites of infection in patients and isolation of S. aureus from patients
Sr. No. Sites Cases
tested
No. of cases with
patho-gens
No. of cases
infected with S. aureus
No. of cases infected
with other pathogens
1 Shin 2 1 1 1=mixed with Proteus spp.
2 Foot 4 3 2 1= mixed with Proteus spp.1=mixed with Klebsiella spp1=with E. coli
3 Anus 9 6 6 (66.67) 1= mixed with Proteus spp.1= with E. coli
4 Back 4 2 2 1= mixed with Proteus spp.
5 Big toes 4 3 2 1= with Proteus spp.1= mixed with Proteus spp.1= with Klebsiella spp
6 Maxilla 1 1 1 1=mixed with E. coli
7 Thigh 3 3 3 1=mixed with E. coli
8 Breast 9 4 4 ( 44.44) 1=mixed with E. coli
9 Buttock 1 1 1 10 Sole 1 1 1 11 Palm 1 1 1 12 Knee 1 1 0 1= with
Pseudomonasspp.
13 Wrist 1 1 14 Neck 3 3 3 1=mixed with
E. coli 1=mixed with Klebsiella spp.
15 Finger 1 1 0 16 Inguinal 1 1 0 17 Forehead,
Backhead 2 1 1
18 Cheek 2 1 1=with E. coli1=mixed with E. coli
Total 50 33 30 (60.00)
12=mixed with Proteus, Klebsiella or E. coli 3=with E. coli only 1= each with Proteus Klebsiella and Pseudomonas spp. only
Figures in parenthesis denote percentages
80
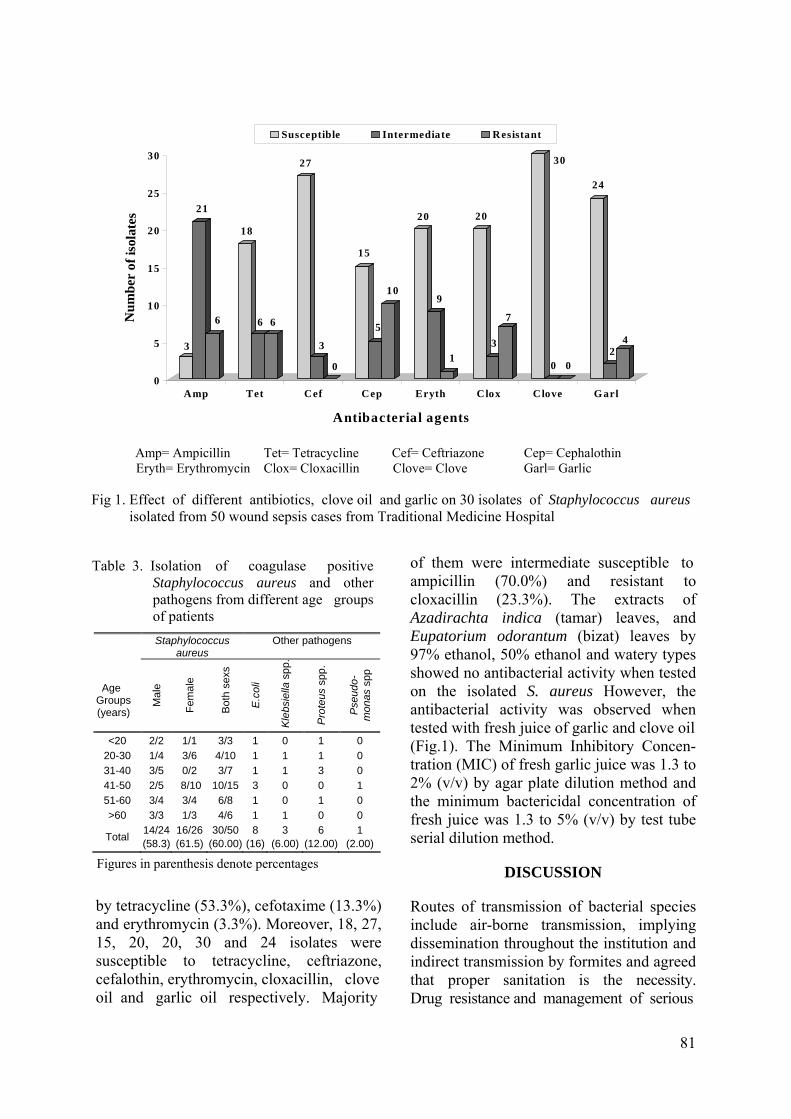
by tetracycline (53.3%), cefotaxime (13.3%) and erythromycin (3.3%). Moreover, 18, 27, 15, 20, 20, 30 and 24 isolates were susceptible to tetracycline, ceftriazone, cefalothin, erythromycin, cloxacillin, clove oil and garlic oil respectively. Majority
3
21
6
18
6 6
27
3
0
15
5
10
20
9
1
20
3
7
30
0 0
24
24
0
5
10
15
20
25
30
Num
ber
of is
ola t
es
Amp Tet Cef Cep Eryth Clox Clove Garl
Antibacterial agents
Susceptible Intermediate Resistant
Amp= Ampicillin Tet= Tetracycline Cef= Ceftriazone Cep= Cephalothin Eryth= Erythromycin Clox= Cloxacillin Clove= Clove Garl= Garlic
Fig 1. Effect of different antibiotics, clove oil and garlic on 30 isolates of Staphylococcus aureus isolated from 50 wound sepsis cases from Traditional Medicine Hospital
of them were intermediate susceptible to Table 3. Isolation of coagulase positive
Staphylococcus aureus and other pathogens from different age groups of patients Staphylococcus
aureus Other pathogens
Age Groups (years)
Mal
e
Fem
ale
Bot
h se
xs
E.c
oli
Kle
bsie
lla s
pp.
Pro
teus
spp
.
Pse
udo-
mon
as s
pp
<20 2/2 1/1 3/3 1 0 1 0 20-30 1/4 3/6 4/10 1 1 1 0 31-40 3/5 0/2 3/7 1 1 3 0 41-50 2/5 8/10 10/15 3 0 0 1 51-60 3/4 3/4 6/8 1 0 1 0 >60 3/3 1/3 4/6 1 1 0 0
Total 14/24 (58.3)
16/26 (61.5)
30/50(60.00)
8 (16)
3 (6.00)
6 (12.00)
1 (2.00)
Figures in parenthesis denote percentages
ampicillin (70.0%) and resistant to cloxacillin (23.3%). The extracts of Azadirachta indica (tamar) leaves, and Eupatorium odorantum (bizat) leaves by 97% ethanol, 50% ethanol and watery types showed no antibacterial activity when tested on the isolated S. aureus However, the antibacterial activity was observed when tested with fresh juice of garlic and clove oil (Fig.1). The Minimum Inhibitory Concen-tration (MIC) of fresh garlic juice was 1.3 to 2% (v/v) by agar plate dilution method and the minimum bactericidal concentration of fresh juice was 1.3 to 5% (v/v) by test tube serial dilution method.
DISCUSSION
Routes of transmission of bacterial species include air-borne transmission, implying dissemination throughout the institution and indirect transmission by formites and agreed that proper sanitation is the necessity. Drug resistance and management of serious
81
Staphylococcal infection in hospitals were reported [13-15]. Staphylococcus aureus acquires resistance by mutation, conjugation, transduction or transformation, although transduction and transformation are rare resistance-acquisition methods for Staphylo-cocci [16]. There were reports by using not only the antibiotics but also with natural products, such as honey and plant extracts. Comparison of wound healing after initial treatment with honey dressing and with silver sulphadiazine impregnated dressing by replacing dressings every two days revealed that honey is faster than silver sulphadiazine [5]. The present study showed that garlic extract was effective on Staphylo-coccus aureus by in vitro testing. However, the application in the topical use for treatment of wounds needs to be further elucidated. Antimicrobial activity of garlic, tea tree oil, and chlorhexidine against oral microorganisms was studied [17] and it was claimed that Allium sativum (garlic) (2.5%) and Melaleuca alternifolia (tea tree) oil (0.2%) might be an alternative to chlorhexidine. The present study revealed the importance of S. aureus in cases with wounds from TMH for the first time although its occurrence in other localities was also reported by many authors [18-21]. In this study, the finding that the fresh juice of garlic was more profoundly active than the extracted parts is also coincided with that of other workers [22, 23]. Compounds such as sulfur, alliin, allicin were known to posseses antibacterial action, indicating their potential usefulness as antiseptic agents when necessary.
ACKNOWLEDGEMENTS
We would like to thank our Director-General Dr Paing Soe and Deputy Director-General Dr Soe Thein and Director Dr U Kyaw Moe for their keen interest and support . We would like to express sincere gratitude to Director-General Dr U Thein Swe, Department of Traditional Medicine and the Medical superintendent Dr U Sein Win from Traditional Medicine Hospital
and last, but not the least to patients who participated in this research.
REFERENCES
1. Lowy FD. Staphylococcus aureus infections. New England Journal of Medicine 1998; 520-532.
2. Smith TL & Jarvis WR. Antimicrobial resistance in Staphylococcus aureus. Microbes and Infection 1999; 795-805.
3. Bandolier. More on honey and wounds "Evidence based thinking about health care". http://www.jr2.ox.ac.uk/bandolier/booth/alternat/honey2.html.
4. Subrahmanyam M. Honey dressing for burns-an appraisal. Annals of Burns and Fire Disasters 1996; IX: 33-35.
5. Subrahmanyam, M, et al. Effect of topical application of honey on burn wound healing. Annals of Burns and Fire Disasters 2001; XIV: 143-145.
6. Mar Mar Nyein, Nwe Yee Win, Win Myint, Aye Aye Thein, Mi Mi Htwe, Win Win Maw & Aye Than, Plants possessing antibacterial activity. Myanmar Health Sciences Research Journal 1999; 1(1-3): 26-32.
7. WHO. Manuals of diagnostic laboratory procedure for acute enteric infection. Simplified methods World Heath Organization, Geneva, 1990.
8. Ewing WH. Edwards and Ewing's identification of Enterobacteriaceae. 4th edition, Elsevier Science Publishing Co. Inc. New York, 1986.
9. Cowan ST. Cowan and Steel's Manual for the identification of medical bacteria. Second edition. Cambridge University Press, 1974.
10. Bauer AWW, Kirby WMM, Sherris JC & Turck M. Antibiotic susceptibility testing by standardized disc method. American Journal of Clinical Pathology 1966; 45: 493-496.
11. Mar Mar Nyein, Chit Maung, Mya Bwin & SJ Tha. In vitro testing of various indigenous plant extracts on human pathogenic bacteria. Myanmar Health Sciences Research Journal 1991; 3: 89-99.
12. Cruickshank, R. Medical Microbiology. 11th edition, UK. The English Language Book Society and Churchill Livingstone Ltd, 1968.
13. Schwarz K. Burn wound infections 2005; 13 pages. http://www.emedicine.com/med/topic 258.htm.
82

orthopaedic post-operative wound sepsis in Yangon General Hospital. M. Med. Sc (Microbiology), Institute of Medicine 1, 2004.
14. Brumfitt W & Hamilton MJ. Methicillin resistant Staphylococcus aureus. New England Journal of Medicine 1989; 320: 1188-1196.
15. Sheagren JN. Staphylococcus aureus the persistant pathogen. New England Journal of Medicine 1984; 310: 1368-1373, 1437-1442.
20. Mya Mya Lwin . Bacteriological study of community acquired infection. M. Med. Sc (Microbiology), Institute of Medicine 1, 2001.
16. Al-Masaudi SB, Day MJ & Russell AD. Antimicrobial resistance and gene transfer in Staphylococcus aureus. Journal of Applied Bacteriology 1991; 70: 279-290.
21. Nang Nyo Nyo Win. A bacteriological study of common bacterial infections in cancer patients of Yangon General Hospital. M. Med. Sc (Microbiology), Institute of Medicine 2003.
17. Groppo FC, Ramacciato JC, Simoes P, Florio FM & Sartoratto A. Antimicrobial activity of garlic, tea tree oil, and chlorhexidine against oral microorganisms. International Dental Journal 2002, 52(6): 433-437.
22. Lee YL, Wang Y, Shanbrom E & Thrupp L. Antibacterial activity of vegetables and juices. Review article. Nutrition 2003, 19 (11/12): 994-996.
23. Onyeagba RA, Ugbogu OC, Okeke CU & Iroakasi O. Studies on the antimicrobial effects of garlic (Allium sativum Linn.) ginger (Zingiber officinale Roscoe) and lime (Citrus aurantifolia Linn.). African Journal of Biotechnology 2004; 3(10): 552-554.
18. Khin San Myint Kyi. Bacteriological study of post-operative wound sepsis in surgical wards of Yangon General Hospital. M. Med.Sc (Microbiology), Institute of Medicine 1, 1998.
19. Meiji Soe Aung. A bacteriological profile of
83
The Myanmar Health Sciences Research Journal, Vol. 18, No. 2, 2006
Effect of chronic lead exposure on children of Yangon, Myanmar (1): blood lead and urinary coproporphyrin profiles
Phyu Phyu Aung, Thandar Shwe, Theingi Thwin, Tin Khine Myint,
Moe Moe Hliang, & Theingi Win Myat
Nutrition Research Division Department of Medical Research (Lower Myanmar)
To study blood lead and urinary protoporphyrin levels of the children in Yangon, Myanmar, who were chronically exposed to lead, a total of 82 children whose parents worked in the small-scaled accumulator battery repairing and reconditioning-recharging shops in New Dagon (South), Thingangyun, and Hlaingtharyar townships were studied. Eighty- two non-exposed children who were sex and age matched and comparable in socioeconomic characteristics as exposed children served as controls. Blood lead and urinary coproporphyrin levels were determined as indicators for lead exposure. Mean blood lead levels in exposed children were 34.85+9.99, 32.5+18.23 and 36.44+22.37 ug/dl for below 3 years, 3-6 years, and above 6 years age groups respectively while the corresponding values in the non-exposed children were 11.33+8.55, 13.17+8.9, and 15.03+8.7 ug/dl. The differences were statistically significant (p<0.001 for all age groups). Coproporphyrin levels were found to be 243.7+20.8, 172.1+13.8, and 326.4+32.4 ug/L in the exposed children for less than 3 years, 3-6 years, and above 6 years age groups respectively. The corresponding values in the non-exposed children were 85.4+28.0, 114.2+22.0, and 115.1+14.5 ug/L. The differences were also statistically significant in less than 3 year age and more than 6 year age groups (p<0.001 for both groups).
INTRODUCTION
The relationship between environmental hazards and the health of human communities is of growing concern and increasing interest to governmental and public health administrators, politicians and public [1]. There is no doubt at all that human industrial activities release chemicals into the general environment and not infrequently, episodes of chemical poisoning occurred [2,3]. In developing countries like Myanmar, the major problem of occupational chemical poisoning arises in small-scaled private owned industries where there is some extent of local pollution by hazardous substances. Lead is widely accepted as a major environmental threat. Improved medical surveillance has decreased the number of overt cases of lead poisoning but the consequences of long term
increased lead absorption and its sub-clinical health impact, especially on the nervous system, remains a major concern [4]. The growth-retarding effects of blood lead concentration have not been well defined. Some studies report no residual effects associated with lead poisoning [5, 6] whereas others indicate growth retardation associated with moderate and high blood lead concentration [7, 8]. The difficulty of ascertaining a clear relationship between blood lead concentration and growth is that high concentration of lead is usually found under poor socioeconomic conditions. The purpose of the present study was to assess the blood lead levels of children of Myanmar who were chronically exposed to lead related to physical growth, development and the parameters of increased lead absorption. The present paper
84

is concentrating only on the blood lead and urinary coproporphyrin levels of the study population.
MATERIALS AND METHODS
It was a cross-sectional, community-based study on the children of Myanmar (1 to 12 years old) whose parents were occu-pationally exposed to lead in the selected townships of Yangon, conducted from December 2001 to July 2002. The study areas were New Dagon (South), Hlaing-tharyar, and Thingangyun Townships. As a preliminary study, the capitol of Myanmar, Yangon, was purposely chosen. The three townships were selected as the former two townships have Industrial Zones where the battery factories and small-scaled battery shops were located. In Thingangyun Township, there is one ward called "Kyiphwarye" where almost the whole community was engaged in lead smelting business. From each township, the list of desired occupations were obtained from the Office of Industrial Zones (New Dagon and Hlaingtharyar) and Township Development Committee. According to the list, battery factories, battery shops and lead smelting sites were visited together with the township medical officer and staff from the Industrial Zones/Township Development Committee. During the visits, the lists of workers' children between 1 to 12 years of age were obtained. Children of the workers of Industrial Zones lived in separate areas while children of the workers from Thingan-gyun lived adjacent to the work site. All children between 1 to 12 years of age listed were recruited for the study. After arrangements had been made, children, together with either of their parents were requested to come to the res-pective urban health centres. Parents were given a complete information regarding the nature of the study and only the children of those parents who gave voluntary consent were participated in the study. The parents were interviewed for basic demographic
information, past and present occupational history, past medical history, and personal hygiene. All children were also medically examined, including medical history, anthropometric measurements (height and weight), laboratory tests (blood lead, urinary coproporphyrin) and developmental screening with Denver’s Test [9] was done on under-six-years children. Comparable non-exposed subjects from the same selected townships were also assessed similarly to serve as controls. Determination of blood lead
Blood lead determination was done by dithizone extraction method as described by NIOSH (1987) [10]. Determination of urinary coproporphyrin
Urinary coproporphyrin level was measured by the method as described by Askevold in 1956.
Statistical analysis
Comparison of the blood lead levels and urinary coproporphyrin levels between the exposed and non-exposed children was made by employing Student’s "t" test for parametric data and X2 test for nonpara-metric data. For comparison of the above parameters among the different nature of parents’ occupation among the exposed group, analysis of variance test was used.
RESULTS
Table 1 presents the general characteristics of the study population. Exposed and non-exposed children were comparable in age, family income and educational attainment of parents. Table 2 presents the mean blood lead and urinary coproporphyrin levels of exposed and non-exposed children. For all age groups, exposed children had signi- ficantly higher blood lead levels than the non-exposed. Differences were statistically
85
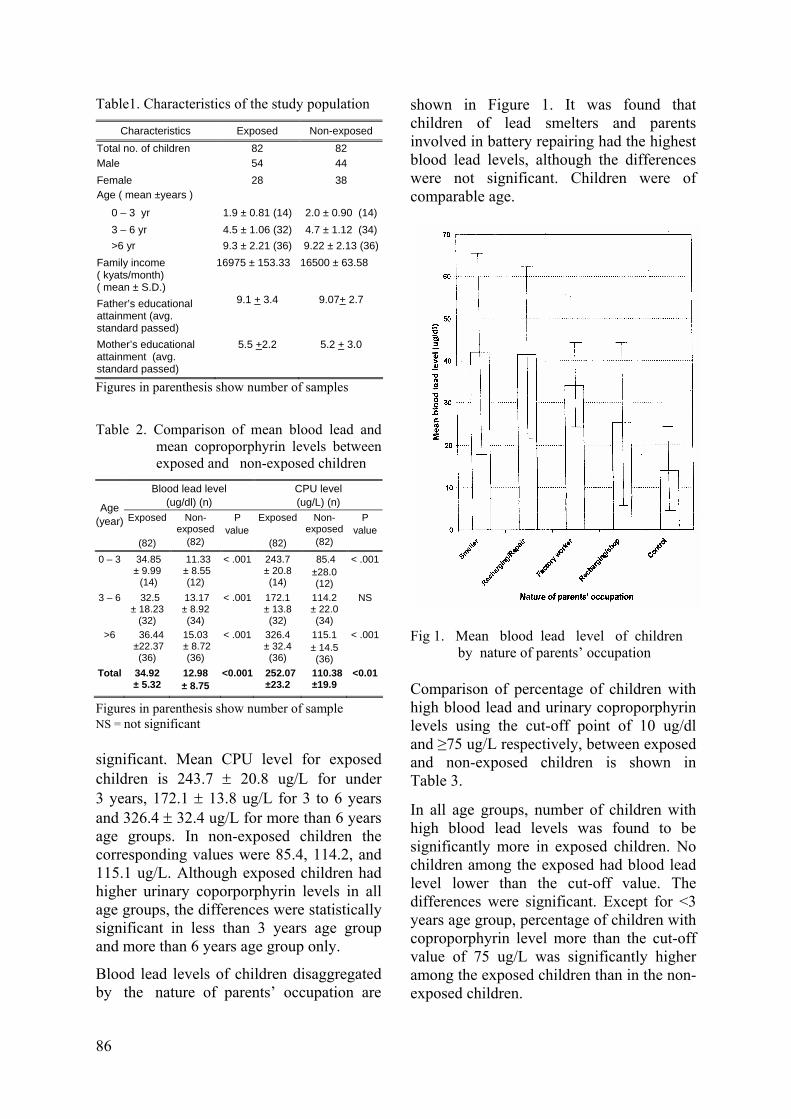
Table1. Characteristics of the study population
Characteristics Exposed Non-exposed Total no. of children 82 82 Male 54 44 Female 28 38 Age ( mean ±years )
0 – 3 yr 1.9 ± 0.81 (14) 2.0 ± 0.90 (14) 3 – 6 yr 4.5 ± 1.06 (32) 4.7 ± 1.12 (34) >6 yr 9.3 ± 2.21 (36) 9.22 ± 2.13 (36)Family income ( kyats/month) ( mean ± S.D.)
16975 ± 153.33 16500 ± 63.58
Father’s educational attainment (avg. standard passed)
9.1 + 3.4 9.07+ 2.7
Mother’s educational attainment (avg. standard passed)
5.5 +2.2 5.2 + 3.0
Figures in parenthesis show number of samples Table 2. Comparison of mean blood lead and
mean coproporphyrin levels between exposed and non-exposed children
Blood lead level (ug/dl) (n)
CPU level (ug/L) (n) Age
(year) Exposed
(82)
Non-exposed
(82)
P value
Exposed
(82)
Non-exposed
(82)
P value
0 – 3 34.85 ± 9.99 (14)
11.33 ± 8.55
(12)
< .001 243.7 ± 20.8 (14)
85.4 ±28.0 (12)
< .001
3 – 6 32.5 ± 18.23
(32)
13.17 ± 8.92 (34)
< .001 172.1 ± 13.8 (32)
114.2 ± 22.0 (34)
NS
>6 36.44 ±22.37
(36)
15.03 ± 8.72
(36)
< .001 326.4 ± 32.4 (36)
115.1 ± 14.5 (36)
< .001
Total 34.92 ± 5.32
12.98 ± 8.75
<0.001 252.07 ±23.2
110.38±19.9
<0.01
Figures in parenthesis show number of sample NS = not significant significant. Mean CPU level for exposed children is 243.7 ± 20.8 ug/L for under 3 years, 172.1 ± 13.8 ug/L for 3 to 6 years and 326.4 ± 32.4 ug/L for more than 6 years age groups. In non-exposed children the corresponding values were 85.4, 114.2, and 115.1 ug/L. Although exposed children had higher urinary coporporphyrin levels in all age groups, the differences were statistically significant in less than 3 years age group and more than 6 years age group only.
Blood lead levels of children disaggregated by the nature of parents’ occupation are
shown in Figure 1. It was found that children of lead smelters and parents involved in battery repairing had the highest blood lead levels, although the differences were not significant. Children were of comparable age.
Fig 1. Mean blood lead level of children by nature of parents’ occupation
Comparison of percentage of children with high blood lead and urinary coproporphyrin levels using the cut-off point of 10 ug/dl and ≥75 ug/L respectively, between exposed and non-exposed children is shown in Table 3.
In all age groups, number of children with high blood lead levels was found to be significantly more in exposed children. No children among the exposed had blood lead level lower than the cut-off value. The differences were significant. Except for <3 years age group, percentage of children with coproporphyrin level more than the cut-off value of 75 ug/L was significantly higher among the exposed children than in the non-exposed children.
86
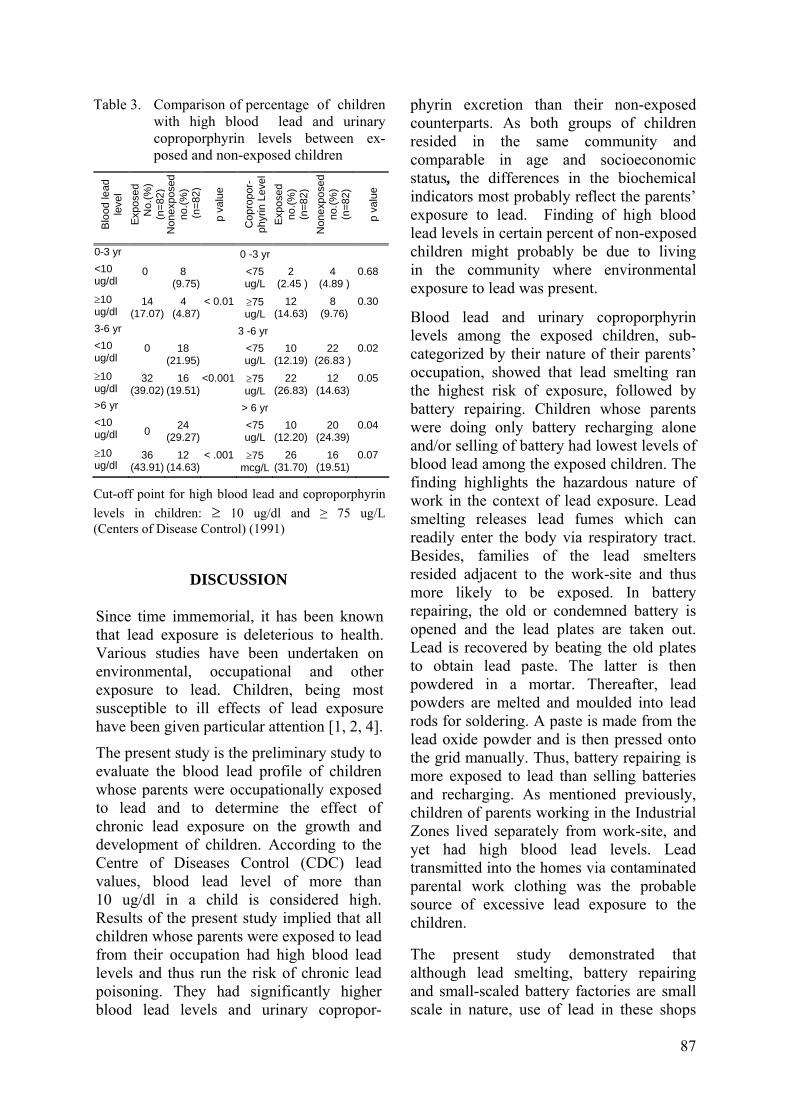
DISCUSSION
Since time immemorial, it has been known that lead exposure is deleterious to health. Various studies have been undertaken on environmental, occupational and other exposure to lead. Children, being most susceptible to ill effects of lead exposure have been given particular attention [1, 2, 4].
The present study is the preliminary study to evaluate the blood lead profile of children whose parents were occupationally exposed to lead and to determine the effect of chronic lead exposure on the growth and development of children. According to the Centre of Diseases Control (CDC) lead values, blood lead level of more than 10 ug/dl in a child is considered high. Results of the present study implied that all children whose parents were exposed to lead from their occupation had high blood lead levels and thus run the risk of chronic lead poisoning. They had significantly higher blood lead levels and urinary copropor-
phyrin excretion than their non-exposed counterparts. As both groups of children resided in the same community and comparable in age and socioeconomic status, the differences in the biochemical indicators most probably reflect the parents’ exposure to lead. Finding of high blood lead levels in certain percent of non-exposed children might probably be due to living in the community where environmental exposure to lead was present.
Table 3. Comparison of percentage of children with high blood lead and urinary coproporphyrin levels b een ex-posed and non-exposed children
etw
Blo
od le
ad
leve
l E
xpos
ed
N
o.(%
) (n
=82)
N
onex
pose
d no
.(%)
(n=8
2)
p va
lue
Cop
ropo
r- ph
yrin
Lev
el
Exp
osed
no
.(%)
(n=8
2)
Non
expo
sed
no.(%
) (n
=82)
p va
lue
0-3 yr 0 -3 yr <10 ug/dl
0 8 (9.75) <75
ug/L 2
(2.45 ) 4
(4.89 ) 0.68
≥10 ug/dl
14 (17.07)
4 (4.87)
< 0.01 ≥75 ug/L
12 (14.63)
8 (9.76)
0.30
3-6 yr 3 -6 yr <10 ug/dl
0 18 (21.95) <75
ug/L 10
(12.19) 22
(26.83 )0.02
≥10 ug/dl
32 (39.02)
16 (19.51)
<0.001 ≥75 ug/L
22 (26.83)
12 (14.63)
0.05
>6 yr > 6 yr <10 ug/dl 0 24
(29.27) <75 ug/L
10 (12.20)
20 (24.39)
0.04
≥10 ug/dl
36 (43.91)
12 (14.63)
< .001 ≥75 mcg/L
26 (31.70)
16 (19.51)
0.07
Cut-off point for high blood lead and coproporphyrin levels in children: ≥ 10 ug/dl and ≥ 75 ug/L (Centers of Disease Control) (1991)
Blood lead and urinary coproporphyrin levels among the exposed children, sub-categorized by their nature of their parents’ occupation, showed that lead smelting ran the highest risk of exposure, followed by battery repairing. Children whose parents were doing only battery recharging alone and/or selling of battery had lowest levels of blood lead among the exposed children. The finding highlights the hazardous nature of work in the context of lead exposure. Lead smelting releases lead fumes which can readily enter the body via respiratory tract. Besides, families of the lead smelters resided adjacent to the work-site and thus more likely to be exposed. In battery repairing, the old or condemned battery is opened and the lead plates are taken out. Lead is recovered by beating the old plates to obtain lead paste. The latter is then powdered in a mortar. Thereafter, lead powders are melted and moulded into lead rods for soldering. A paste is made from the lead oxide powder and is then pressed onto the grid manually. Thus, battery repairing is more exposed to lead than selling batteries and recharging. As mentioned previously, children of parents working in the Industrial Zones lived separately from work-site, and yet had high blood lead levels. Lead transmitted into the homes via contaminated parental work clothing was the probable source of excessive lead exposure to the children.
The present study demonstrated that although lead smelting, battery repairing and small-scaled battery factories are small scale in nature, use of lead in these shops
87

psychological and biological evidence. Neuro- were causing chronic lead exposure to the workers’ children as evidenced by the blood lead and urinary coproporphyrin levels.
toxicology 1977; 18:237
5. Sachs HK & Moei DI. Height and weight following lead poisoning in childhood. A.J.D.C. 1989; 143: 820-822.
REFERENCES 6. Fernandez GO, Martinez RR, Fortoul TI & Palazuelo E. Height and blood lead levels in ceramic folk art worker in Michoacan, Mexico. Archives of Environmental Health 1997; 52(1): 51-55.
1. Baker EL, Folland DS, Taylor TA, Frank M &
Peterson W, Lovejoy G et al. Lead poisoning in children of lead workers. New England Journal of Medicine 1977; 296: 260-261. 7. Frisancho R & Ryan M. Decreased stature
associated with moderate blood lead concentration in Mexican-American children. American Journal of Clinical Nutrition 1991; 54: 516-519.
2. Bonilla CM. & Mau EA. A community initiated study of blood lead levels of Nicaraguan children living near a battery factory. American Journal of Public Health 1998; 88: 1843-1845.
8. Schwartz J, Angle C & Pitcher H. Relationship between childhood blood lead levels and stature. Pediatrics 1986; 77: 281-288.
3. Phone Saing & Myo Tint. Evaluation of the health workers and family members in small accumulator battery shop. Occupational Health Unit, Department of Health 1980, Yangon (Personal Communication).
9. Frankenburg WK, Dodds J et al. Denver II Training Manual 1992.
10. Amadeo JP & Lawrence AK. Method in clinical chemistry 1987. The C.V. Mosby Company, St. Louis, Washington, DC.
4. Banks EC, Ferreti LE & Shucard DW. Effect of low level lead exposure on cognitive function in
children. In: A review of behavioural neuro -
88
The Myanmar Health Sciences Research Journal, Vol. 18, No. 2, 2006
Genomic characterization of rotavirus isolates from Yangon Children’s Hospital by Reverse Transcription Polymerase Chain Reaction
*Kyaw Moe,**Khin Mar Aye,**Thandar Lwin, **Win Mar Oo,
***Tin Tin Htwe,**Thin Thin Shwe & **Win Mar
*Department of Medical Research (Lower Myanmar)
**Virology Research Division ***Biological Toxicology Research Division
Department of Medical Research (Lower Myanmar)
The intentions of the study were to establish a reverse transcription polymerase chain reaction (RT-PCR) for G and P genotyping of rotavirus isolates and to determine the distribution of human rotavirus genotypes in Yangon. This study was done on stool samples collected from under five- year-old children admitted to the Yangon Children’s Hospital for diarrhoea in 2004. After screening for rotavirus by enzyme immunoassay (EIA), 181 stool samples (32%) were randomly chosen from 564 rotavirus positive samples, for genotyping by using RT-PCR. The rotavirus positive samples were genotyped employing multiplex RT-PCR using G and P specific primers. Genotype G3 was the most common type identified (44% of samples) followed by G1 (33.3%). The genotype G1 was the predominant type in the early part of the year, but was replaced by genotype G3 from July to December 2004. The VP7 genotypes G2, G4 and G9 each represented as minor types (total < 13% of samples). Rotavirus P genotyping was attempted in 91 samples and P genotype can be ascertained in only 31 samples of which 74.2% were identified as P(8). There was no apparent pattern of P genotype distribution throughout the year. The common P and G type combinations were G1/P(8) and G3/P (8). Several unusual G and P type combinations were also identified, two of which were G1/P (4), and one sample was G3/P (4) and another belonging to G2/P (8). The distribution of G and P genotype provides important and valuable information for the development and introduction of rotavirus vaccines, the most effective strategy for the prevention of severe rotavirus diarrhoea.
INTRODUCTION
Rotavirus infection is the most common cause of acute gastroenteritis in young children, characterized by acute onset of watery diarrhoea, fever and vomiting [1]. Recent studies have estimated that 500,000 to 600,000 children die each year because of rotavirus gastroenteritis [2]. In response to this disease burden, several vaccines against rotavirus have been or are being developed. Before a rotavirus vaccine is introduced, common strains circulating in the community need to be explored. In many countries, however, strain characteristics of
rotavirus are unknown because of a lack of adequate data or because no studies have been conducted recently. The lack of data is particularly notable in developing countries. The anticipated availability of an effective vaccine highlights the need for new data on the rotavirus disease in developing countries, where rotavirus-associated morbidity and mortality are high. Vaccination is the current strategy for control and prevention of severe rotavirus infections [2]. Rotavirus is a 100-nm virus with a characteristic wheel-shaped structure (rota)
89

and belongs to the family Reoviridae. The virus has three shells, an outer capsid, an inner capsid and a core. They surround 11 segments of double-stranded RNA, which encode for six structural proteins (VP1-VP4, VP6, VP7) and five non-structural proteins (NSP1 − NSP5). Two structural proteins, VP7 (the glycoprotein or G protein) and VP4 (the protease-cleaved protein or P protein), make up the outer shell and are considered important for vaccine development since they define the serotype of the virus and are the major antigens involved in virus neutralization [3]. Because the genes encoding these proteins segregate independently of each other during reassortment, a dual-serotyping system to account for the specificities of both VP7 and VP4 has been adopted [4]. Thus, the classification of rotaviruses is based on differences in the VP7 (G) and VP4 (P) capsid proteins. G serotypes 1-4, and P genotypes P(8) and P(4) predominate worldwide. The development of vaccines against severe rotavirus diarrhoea is based upon homotypic or heterotypic protection provided against either a single common G serotype (monovalent vaccines) or against multiple serotypes (multivalent vaccines) [5]. Candidate rotavirus vaccines have been prepared with reassortant strains specifically to protect against the 4 major rotavirus G serotypes (G1-4). The main reason for this study was to collect data that will facilitate and support the introduction of rotavirus vaccination, once a vaccine becomes available. The objectives of the study were to establish a Reverse Transcription Polymerase Chain Reaction (RT-PCR) for G and P genotyping rotavirus isolates and to determine the relative frequency of individual human rotavirus serotypes and genotypes prevailing in Yangon.
MATERIALS AND METHODS
This was a hospital-based, prospective study done from January through December 2004 in Yangon Children's Hospital, Yangon.
Stool samples were collected from children under five years of age, admitted to the three medical wards of Yangon Children's Hospital for diarrhoea. A child admitted with a diagnosis of acute diarrhoea and who was less than 5 years of age were included in the study. Approximately 10 ml of stool sample was collected from diarrhoeic children after admission using wide-mouth screw capped bottles and transported in cold boxes daily as soon as possible to the laboratory in the Virology Research Division of the Department of Medical Research (Lower Myanmar) and stored at -20º C until testing was done. The presence of rotavirus antigen was determined by Enzyme Immunoassay (EIA). Briefly, diluted stool samples, positive and negative controls were added to the wells of 96-well EIA plates precoated with anti-rotavirus antibody. The plates were incubated and then washed. Then anti-rotavirus antibody conjugated to horseradish-peroxidase was added and incubated. After washing, the enzyme substrate was added to develop colour in the wells. The absorbance (optical density) of the wells was read in an EIA reader at 450 nm wavelenghth. The cut-off value was calculated by adding 0.100 absorbance unit to the absorbance reading of the negative control. The positive control must have a value of greater than 0.500 absorbance units. A subsample (~ one third) of the monthly rotavirus EIA positive stool samples was randomly chosen and G and P genotyped by Reverse Transcription Polymerase Chain Reaction (RT-PCR) [6,7]. Briefly, RNA was extracted from 10% stool suspensions in phosphate buffered saline (PBS) employing a phenol-chloroform-isoamyl alcohol mixture. After thorough vortexing and centrifugation, the aqueous suspension containing viral RNA was collected. Then, hydroxyappatite was added to allow RNA to bind to hydroxyappatite and then centrifuged. The pellet was washed and
90

double stranded (ds) RNA was eluted by 200mM potassium phosphate solution. The extracted dsRNA was amplified by Reverse Transcription Polymerase Chain Reaction (RT-PCR) using specific oliginu-cleotide primers. The extracted RNA was used as a template to produce and amplify full-length complementary DNA (cDNA) of the VP7 and VP4 region by RT-PCR. The cDNA was used as a template for a second and subsequent rounds of PCR using genotype-specific primers to amplify cDNA. G types were identified by multiplex RT-PCR assay using consensus primers 9con1 and 9con2, and typing primers specific for the VP7 genes of G types 1- 4 and 9 (Table 1). P types were identified by multiplex RT-PCR assay using consensus primers con3 and con2, and primers specific for the VP4 genes of P types 4, 6, 8, 9, 10 and 11 (Table 2). The amplified products together with a molecular weight marker were subjected to electrophoresis in a 2% agarose gel containing 0.5 μg of ethidium bromide per ml. The cDNA bands and the molecular weight marker were observed under the
ultra violet light and photographed. Data were analyzed using Microsoft Excel program.
RESULT
During the year 2004, stool specimens were collected from 995 under five years old children who were admitted for diarrhoea. Among them, 564 (56.6%) samples were EIA positive for rotavirus, from which, 181 samples (32%) were randomly chosen for G and P genotyping by RT-PCR (Figures 1a and 1b).
Of the 181 rotavirus stool samples genotyped, genotype G3 was the most common genotype identified representing 44.8% of the samples and G1 strains were the second most common genotype accounting for 33.3% of isolates. The VP7 serotypes G2, G4 and G9 each represented minor types during the study period, being identified in less than 13% of samples. Seventeen stool samples (9.3%), although positive for rotavirus by EIA, either exhibited mixed G types or were non-typable.
Table 1. Consensus and type-specific primers for G typing
Primer name Sequence (5' to 3') Strain/G type
PCR product
(bp) 1st amp consensus primers
9con1 TAG CTC CTT TTA ATG TAT GG
Wa/G1
9con2 GTA TAA AAT ACT TGC CAC CA
Wa/G1
2nd amp typing primers (9con1 was also included)
9T-1 TCT TGT CAA AGC AAA TAA TG
Wa/G1 158
9T-2 GTT AGA AAT GAT TCT CCA CT
S2/G2 244
9T-3P GTC CAG TTG CAG TGT AGC
107e1B/G3 464
9T-4 GGG TCG ATG GAA AAT TCT
ST3/G4 403
9T-9B TAT AAA GTC CAT TGC AC
116E/G9 110
Table 2. Consensus and type-specific primers for P typing
Primer name Sequence (5' to 3') Strain/ [P] type
PCR product
(bp) 1st amp consensus primers
con3 TGG CTT CGC TCA TTT ATA GAC A
KU/P[8]
con2 ATT TCG GAC CAT TTA TAA CC
KU/P[8]
2nd amp primers (con3 was also included)
1T-1 TCT ACT TGG ATA ACG TGC
KU/P[8] 345
2T-1 CTA TTG TTA GAG GTT AGA GTC
RV-5/P[4] 483
3T-1 TGT TGA TTA GTT GGA TTC AA
1076/P[6] 267
4T-1 TGA GAC ATG CAA TTG GAC
K8/P[9] 391
5T-1 ATC ATA GTT AGT AGT CGG
69M/P[10] 583
91
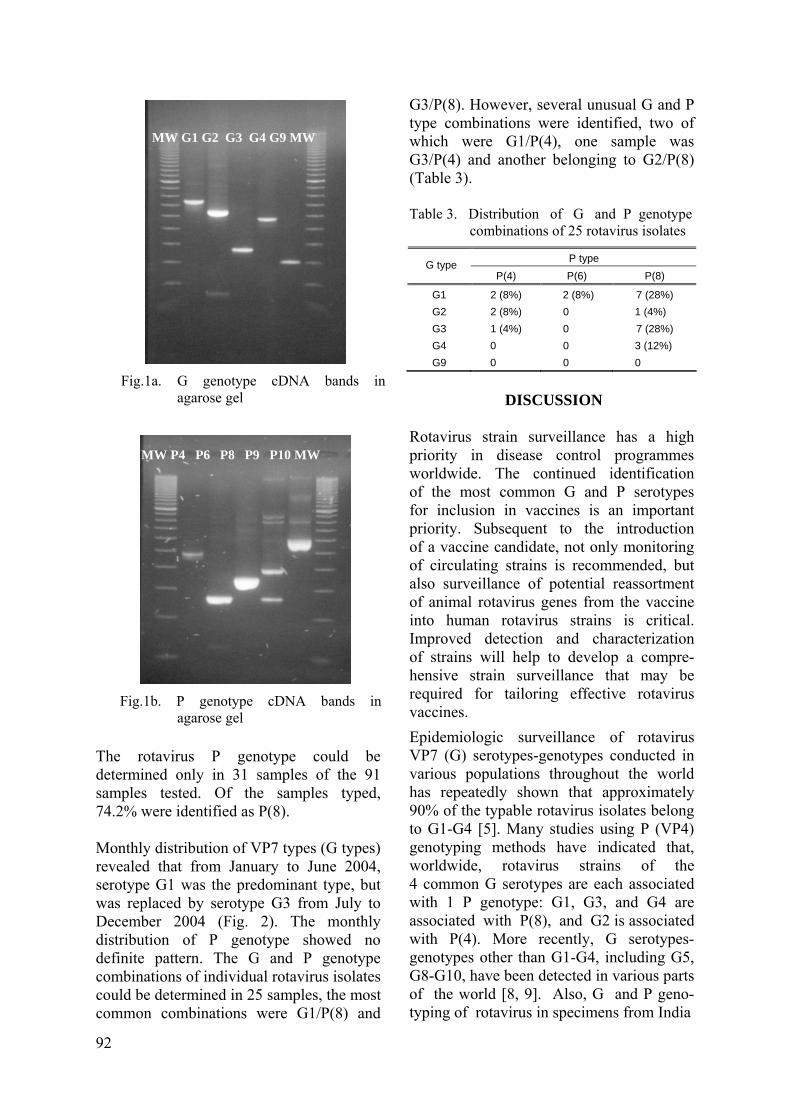
The rotavirus P genotype could be determined only in 31 samples of the 91 samples tested. Of the samples typed, 74.2% were identified as P(8). Monthly distribution of VP7 types (G types) revealed that from January to June 2004, serotype G1 was the predominant type, but was replaced by serotype G3 from July to December 2004 (Fig. 2). The monthly distribution of P genotype showed no definite pattern. The G and P genotype combinations of individual rotavirus isolates could be determined in 25 samples, the most common combinations were G1/P(8) and
G3/P(8). However, several unusual G and P type combinations were identified, two of which were G1/P(4), one sample was G3/P(4) and another belonging to G2/P(8) (Table 3).
Fig.1a. G genotype cDNA bands in
agarose gel
MW G1 G2 G3 G4 G9 MW
Table 3. Distribution of G and P genotype
combinations of 25 rotavirus isolates
P type G type P(4) P(6) P(8)
G1 2 (8%) 2 (8%) 7 (28%) G2 2 (8%) 0 1 (4%) G3 1 (4%) 0 7 (28%) G4 0 0 3 (12%) G9 0 0 0
DISCUSSION
Rotavirus strain surveillance has a high priority in disease control programmes worldwide. The continued identification of the most common G and P serotypes for inclusion in vaccines is an important priority. Subsequent to the introduction of a vaccine candidate, not only monitoring of circulating strains is recommended, but also surveillance of potential reassortment of animal rotavirus genes from the vaccine into human rotavirus strains is critical. Improved detection and characterization of strains will help to develop a compre-hensive strain surveillance that may be required for tailoring effective rotavirus vaccines.
Fig.1b. P genotype cDNA bands in
agarose gel
MW P4 P6 P8 P9 P10 MW
Epidemiologic surveillance of rotavirus VP7 (G) serotypes-genotypes conducted in various populations throughout the world has repeatedly shown that approximately 90% of the typable rotavirus isolates belong to G1-G4 [5]. Many studies using P (VP4) genotyping methods have indicated that, worldwide, rotavirus strains of the 4 common G serotypes are each associated with 1 P genotype: G1, G3, and G4 are associated with P(8), and G2 is associated with P(4). More recently, G serotypes-genotypes other than G1-G4, including G5, G8-G10, have been detected in various parts of the world [8, 9]. Also, G and P geno-typing of rotavirus in specimens from India
92
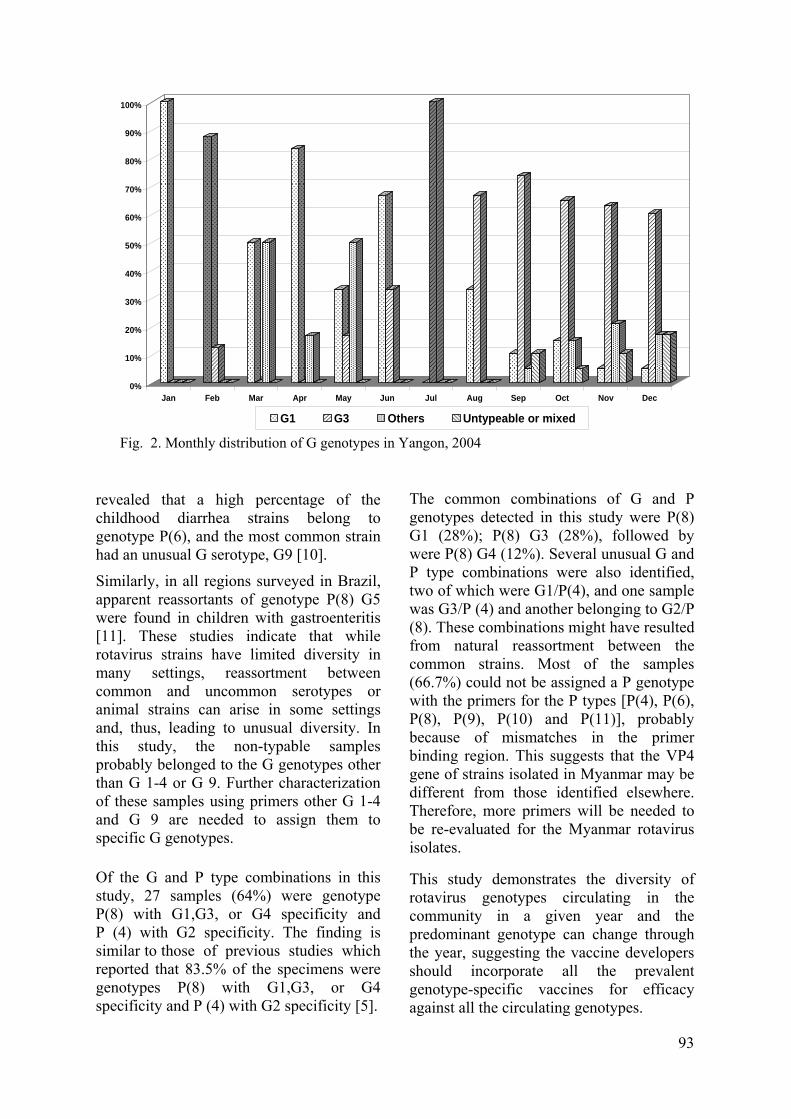
revealed that a high percentage of the childhood diarrhea strains belong to genotype P(6), and the most common strain had an unusual G serotype, G9 [10].
Similarly, in all regions surveyed in Brazil, apparent reassortants of genotype P(8) G5 were found in children with gastroenteritis [11]. These studies indicate that while rotavirus strains have limited diversity in many settings, reassortment between common and uncommon serotypes or animal strains can arise in some settings and, thus, leading to unusual diversity. In this study, the non-typable samples probably belonged to the G genotypes other than G 1-4 or G 9. Further characterization of these samples using primers other G 1-4 and G 9 are needed to assign them to specific G genotypes. Of the G and P type combinations in this study, 27 samples (64%) were genotype P(8) with G1,G3, or G4 specificity and P (4) with G2 specificity. The finding is similar to those of previous studies which reported that 83.5% of the specimens were genotypes P(8) with G1,G3, or G4 specificity and P (4) with G2 specificity [5].
0%
10%
20%
30%
40%
50%
60%
70%
80%
90%
100%
Jan Feb Mar Apr May Jun Jul Aug Sep Oct Nov Dec
G1 G3 Others Untypeable or mixed
Fig. 2. Monthly distribution of G genotypes in Yangon, 2004
The common combinations of G and P genotypes detected in this study were P(8) G1 (28%); P(8) G3 (28%), followed by were P(8) G4 (12%). Several unusual G and P type combinations were also identified, two of which were G1/P(4), and one sample was G3/P (4) and another belonging to G2/P (8). These combinations might have resulted from natural reassortment between the common strains. Most of the samples (66.7%) could not be assigned a P genotype with the primers for the P types [P(4), P(6), P(8), P(9), P(10) and P(11)], probably because of mismatches in the primer binding region. This suggests that the VP4 gene of strains isolated in Myanmar may be different from those identified elsewhere. Therefore, more primers will be needed to be re-evaluated for the Myanmar rotavirus isolates.
This study demonstrates the diversity of rotavirus genotypes circulating in the community in a given year and the predominant genotype can change through the year, suggesting the vaccine developers should incorporate all the prevalent genotype-specific vaccines for efficacy against all the circulating genotypes.
93
ACKNOWLEDGEMENTS 5. Gentsch JR, Woods PA, Ramachandran B, et al. Review of G and P typing results from a global collection of strains: implications for vaccine development. Journal of Infectious Diseases 1996; 174(Suppl. 1):S30-36.
We wish to thank the Medical Super-intendent and staff of the Yangon Children's Hospital for their assistance in the conduct of this study. 6. Das BK, Gentsch JR, Cicirello HG, et al.
Characterization of rotavirus strains from newborns in New Delhi, India. Journal of Clinical Microbiology 1994; 32: 1820-2.
REFERENCES 7. Gentsch J, Glass RI, Woods P et al.
Identification of group A rotavirus gene 4 types by polymerase chain reaction. Journal of Clinical Microbiology 1992; 30:1365-73.
1. Linhares AC, Monaco HC, Gabbay YB, de Araujo VL, Serruya AC, Luoreiro ECB. Acute diarrhoea associated with rotavirus among children in Belize, Brazil. Transaction of the Royal Society of Tropical Medicine and Hygiene 1989; 77: 384-90.
8. Ramachandran M, Gentsch JR, Parashar UD et al. Detection and characterization of novel rotavirus strains in the United States. Journal of Clinical Microbiology 1998; 36: 3223-9.
2. Breese J, Glass RI, Ivanoff B, Gentsch JR. Current status and future priorities for rotavirus vaccine development, evaluation and implementation in developing countries. Vaccine 1999; 17: 2207-22.
9. Cunliffe, NA, Gondwe JS, Graham SM et al. Rotavirus strain diversity in Balantyre, Malawi from 1977 to 1999. Journal of Clinical Micro-biology 2001; 39: 836-43.
10. Ramachandran M, Das BK, Vij A et al. Unusual diversity of human rotavirus G and P genotypes in India. Journal of Clinical Microbiology 1996; 34: 436-9.
3. Prasad BV, Burns JW, Marietta E, Estes MK, Chiu W. Localization of VP4 neutralization sites in rotavirus by 3-dimensional cryo-electron microscopy. Nature 1990; 343: 476-9. 11. Souza MBL, Ráez ML, Leite JPG et al.
Molecular and serological characterization of group A rotavirus isolates from hospitalised children in Goiânia, Brazil, 1998-2000. European Journal of Clinical Micobiology Infectious Diseases 2003; 22: 441-3.
4. Hoshino Y, Saif LJ, Sereno MM et al. Independent segregation of two antigenic specificities (VP3 and VP7) involved in neutralization of rotavirus infectivity. Proc Natl Acad Sci 1985; 82: 8701-4.
94
The Myanmar Health Sciences Research Journal, Vol. 18, No. 2 , 2006
Development of in-house Enzyme-Linked-Immunosorbent-Assay (ELISA) for determination of antibody to hepatitis B surface antigen
*Myo Khin,**Khin Pyone Kyi,***Ohmar Lwin, **Khin May Oo,***Yi Yi Kyaw & ***Baby Hla
*Department of Medical Research (L M)
**Vaccine Plant ***Experimental Medicine Research Division Department of Medical Research (L M)
Vaccination programmes are considered as the most important public health measure in the prevention and control of hepatitis B infection. Testing for the antibody status of the individual to hepatitis B is needed to further determine the response of hepatitis B vaccine. An in-house two-stage Enzyme Linked Immunosorbent Assay (ELISA) system was developed using locally purified hepatitis B surface antigen (HBsAg) as the solid phase and commercially available anti-human IgG horse radish peroxidase as the conjugate. Checkerboard titration was carried out and the dilutions determined. Using MONOLISA ELISA system as the standard, the sensitivity and the specificity of the in-house ELISA system was found to be 73% and 98%, respectively. The positive and negative predictive values were 85% and 96%, respectively.
INTRODUCTION
Hepatitis B virus (HBV) infection is an important health problem worldwide, as the infection can cause significant liver diseases that range from fulminating hepatitis to hepatocellular carcinoma. HBV infection in the Asia-Pacific region is among the highest in the world, and chronic HBV infection in most of the countries of the Asia- Pacific region including Myanmar is high (>10% prevalence) [1]. WHO has estimated that 12% of the Myanmar population could carry HBV and 28/100,000 population could develop hepatocellular carcinoma [2]. Accordingly, HBV infection has been considered as a priority health problem in Myanmar and health authorities have taken various steps to control and manage HBV infection. It has been shown that vertical transmission at the perinatal period plays a major role in the acquisition of HBV infection in Myanmar. Twenty five percent of children born to hepatitis B surface
antigen positive mothers and up to 60% of children born to HBsAg and HBeAg positive mothers became HBsAg positive within the first year of life [3]. Thus, immunization of newborns with hepatitis B vaccine is an important strategy for control of hepatitis B in Myanmar. Incorporation of hepatitis B vaccine into the Expanded Programme of Immunization (EPI) pro-gramme has been initiated and is achieving good results.
Serology is the main diagnostic and prognostic tool for HBV infection. The presence of antibody to hepatitis B surface antigen (anti-HBs) signifies the person's previous exposure to hepatitis B virus or hepatitis B vaccine and denotes immunity to the hepatitis B virus and protection against re-infection. The absence of anti-HBs reveals the person's susceptibility to HBV infection. With the introduction of HBV vaccine in Myanmar, the need of testing for the antibody status of the individual to hepatitis B is increasing as the detection of
95

anti-HBs will be of great help in deter-mination of the response to HBV vaccine. It will also assist the health care providers to assess the successes and failures of the immunization programmes. However, commercial test kits for determination of anti-HBs are relatively expensive in Myanmar. Thus there is a need to develop a locally available anti-HBs ELISA system to reduce the cost of the antibody testing.
The objective of the present study is to develop a test system to determine the antibody to hepatitis B surface antigen and to evaluate the test system against the commercially available ELISA.
MATERIAL AND METHODS
Test principle of the developed HBsAg ELISA kit
Detection of the hepatitis B surface antibody by enzyme linked immunosorbent assay (ELISA) was carried out using the solid phase immunoassay principle. Hepatitis B surface antibody present in the serum sample was bound to purified HBsAg immobilized on the surface of the poly-styrene wells. After washing, the conjugate (anti-human IgG-horseradish peroxidase) was added and this conjugate was attached to the hepatitis B surface antibody in the serum sample which is captured by the purified HBsAg immobilized on the poly-styrene wells. The excess conjugate was removed by washing and the enzyme activity was determined by action on the substrate, orthophenylene diamine dihydro-chloride (OPD). The reaction was stopped by adding 4 N surphuric acid. The intensity of the yellow-orange color developed by the reaction was proportional to the concen-tration of hepatitis B surface antibody in the sample.
Purification of HBsAg
Purification of HBsAg from plasma of apparently healthy chronic HBsAg carriers by the New York Blood Centre method
includes the following steps; collection of high titre HBsAg positive, HIV and Hepatitis C negative plasma, acidification, precipitation, absorption, concentration, iso-pyknic centrifugation, and dialysis. The purified HBsAg sample was further analysed by SDS-PAGE for purity.
Checker board titration
Checker board titration was done by using different dilutions of purified HBsAg from the human blood as coating antigen and different dilutions of anti-human IgG HRP conjugate (Sigma Co.) as the conjugate in the ELISA system. Positive and negative samples were used in duplicate for each dilution of coating antigen and conjugated antibody.
Evaluation of the in-house anti-HBs ELISA test
The in-house anti-HBs ELISA system was evaluated against a commercially available ELISA test kit , (MONOLISA ELISA, USA). The samples were coded, randomly rearranged and blinded to the person who carried out the ELISA tests.
Samples
Serum samples were collected from persons attending the Vaccine and Diagnostic Clinic of the Department of Medical Research (Lower Myanmar). One hundred serum samples, each of 2 ml in volume, from subjects consecutively recruited were included. They were tested for the presence of HBsAg by in-house hepatitis B surface antigen ELISA [4]. Nine samples were positive and the remaining 91 samples were further tested for anti-HBs seropositivity by the MONOLISA ELISA and in-house anti-HBs ELISA tests.
Statistical Methods
Data analysis was performed with SPSS (Statistical Package for Social Scientists Ver 10.1; SPSS Corporation, Chicago, IL, U.S.A.) on a IBM computer. Sensitivity and specificity and their confidence intervals were calculated [5].
96
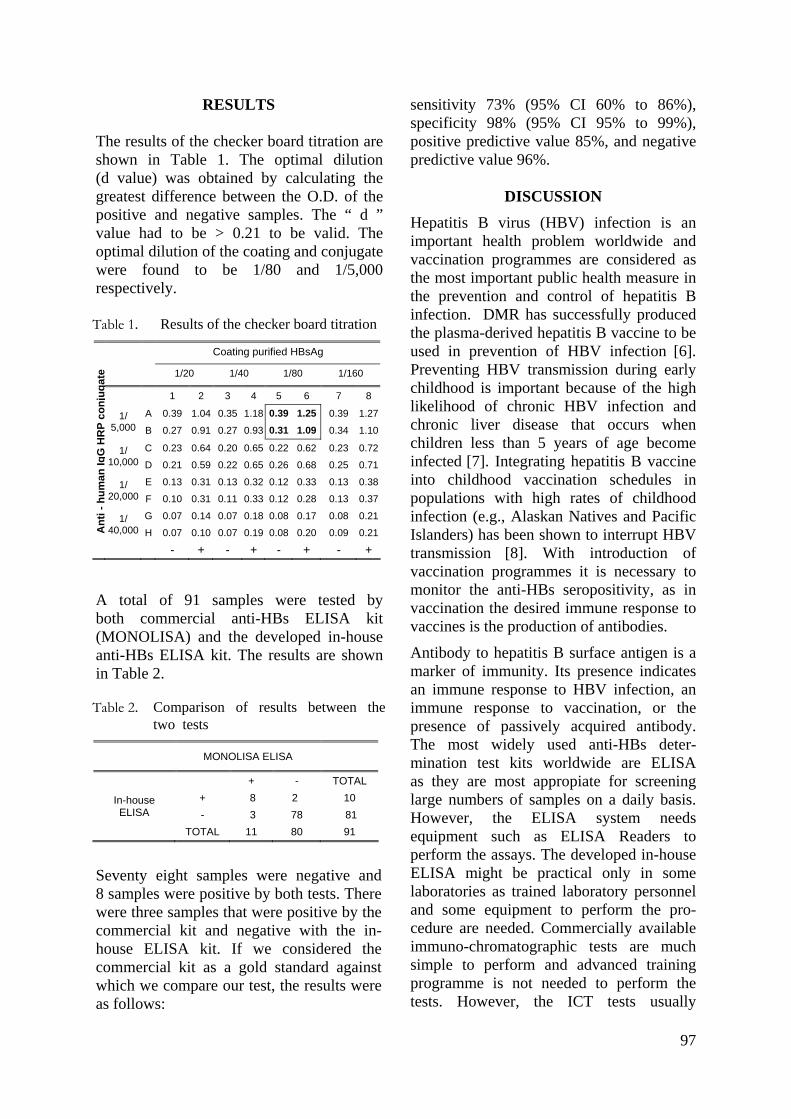
RESULTS
The results of the checker board titration are shown in Table 1. The optimal dilution (d value) was obtained by calculating the greatest difference between the O.D. of the positive and negative samples. The “ d ” value had to be > 0.21 to be valid. The optimal dilution of the coating and conjugate were found to be 1/80 and 1/5,000 respectively. A total of 91 samples were tested by both commercial anti-HBs ELISA kit (MONOLISA) and the developed in-house anti-HBs ELISA kit. The results are shown in Table 2. Seventy eight samples were negative and 8 samples were positive by both tests. There were three samples that were positive by the commercial kit and negative with the in-house ELISA kit. If we considered the commercial kit as a gold standard against which we compare our test, the results were as follows:
sensitivity 73% (95% CI 60% to 86%), specificity 98% (95% CI 95% to 99%), positive predictive value 85%, and negative predictive value 96%.
DISCUSSION Hepatitis B virus (HBV) infection is an important health problem worldwide and vaccination programmes are considered as the most important public health measure in the prevention and control of hepatitis B infection. DMR has successfully produced the plasma-derived hepatitis B vaccine to be used in prevention of HBV infection [6]. Preventing HBV transmission during early childhood is important because of the high likelihood of chronic HBV infection and chronic liver disease that occurs when children less than 5 years of age become infected [7]. Integrating hepatitis B vaccine into childhood vaccination schedules in populations with high rates of childhood infection (e.g., Alaskan Natives and Pacific Islanders) has been shown to interrupt HBV transmission [8]. With introduction of vaccination programmes it is necessary to monitor the anti-HBs seropositivity, as in vaccination the desired immune response to vaccines is the production of antibodies.
Table 1. Results of the checker board titration Coating purified HBsAg 1/20 1/40 1/80 1/160 1 2 3 4 5 6 7 8
A 0.39 1.04 0.35 1.18 0.39 1.25 0.39 1.271/ 5,000 B 0.27 0.91 0.27 0.93 0.31 1.09 0.34 1.10
C 0.23 0.64 0.20 0.65 0.22 0.62 0.23 0.721/ 10,000 D 0.21 0.59 0.22 0.65 0.26 0.68 0.25 0.71
E 0.13 0.31 0.13 0.32 0.12 0.33 0.13 0.381/ 20,000 F 0.10 0.31 0.11 0.33 0.12 0.28 0.13 0.37
G 0.07 0.14 0.07 0.18 0.08 0.17 0.08 0.21
Ant
i - h
uman
IgG
HR
P co
njug
ate
1/ 40,000 H 0.07 0.10 0.07 0.19 0.08 0.20 0.09 0.21
- + - + - + - +
Antibody to hepatitis B surface antigen is a marker of immunity. Its presence indicates an immune response to HBV infection, an immune response to vaccination, or the presence of passively acquired antibody. The most widely used anti-HBs deter-mination test kits worldwide are ELISA as they are most appropiate for screening large numbers of samples on a daily basis. However, the ELISA system needs equipment such as ELISA Readers to perform the assays. The developed in-house ELISA might be practical only in some laboratories as trained laboratory personnel and some equipment to perform the pro-cedure are needed. Commercially available immuno-chromatographic tests are much simple to perform and advanced training programme is not needed to perform the tests. However, the ICT tests usually
Table 2. Comparison of results between the two tests
MONOLISA ELISA
+ - TOTAL + 8 2 10 In-house
ELISA - 3 78 81 TOTAL 11 80 91
97

indicate qualitative presence of the antibody to hepatitis B surface antigen and quantitative levels can be determined mostly by use of ELISA test systems together with standard anti-HBs. Previously, researchers from the Department of Medical Research (Lower Myanmar) had developed an in-house radioimmunoassay system to detect anti-HBs. The procedure involved the use of polyvinylchloride microtitre plates as solid phase and purified human hepatitis B surface antigen was used for coating microtitre plates and for radioiodination [9]. Although the assay is semiquantitative, the difficulty in obtaining iodine-125 radio-isotope has limited its use in Myanmar.
An adequate (protective) antibody response has been defined as greater than or equal to 10 sample ratio units (SRU {sample signal divided by the test kit negative control mean}) by radioimmunoassay (RIA) [10]. Subsequently, the determination of anti-HBs levels was standardized by expressing anti-HBs concentrations in milli-international units per milliliter (mIU/mL) using the WHO Anti-HBs Reference Preparation [11]. Because the value of 10 SRU by RIA and the manufacturers' recommended positive threshold for enzyme immunoassays (EIA) were similar to 10 mIU/mL, Immunization Practices Advisory Committee (ACIP) recommendations issued in 1987 defined the protective level of anti-HBs as greater than or equal to 10 mIU/mL, approximately equivalent to 10 SRU by RIA or positive by EIA [12]. The positive results which were inparallel with positivity of MONO-LISA ELISA were regarded as equal to or more than 10 mIU/mL. It was found that of 11 samples positive by MONOLISA ELISA, 8 were positive by the in-house ELISA (74%).
Radioimmunoassay test system is the gold standard against which the test kit should be evaluated. However, since it was not available, for this present study a commercially available ELISA test system was used to evaluate the developed in-house test. It was found that the ELISA could be
used for determination of circulating antibodies to hepatitis B surface antigen. However, the sensitivity of the in-house system is much lower (73%) than the commercially available test kits. The poor sensitivity limits the use of this in-house ELISA in sero-epidemiological studies.
The developed in-house anti-HBs ELISA is economical as it is based on locally produced HbsAg as the coating antigen. It. has high specificity but the sensitivity needs to be improved. It could be useful in testing the immune response in persons who have received hepatitis B vaccine but further optimization is needed for use in screening of persons in seroepidemiological studies.
REFERENCES
1. Chen CJ, Wang LY, Yu MW. Epidemiology of hepatitis B virus infection in the Asia-Pacific region. Journal of Gastroenterology and Hepatology 2000; 15(S): E3-E6.
2. WHO document SEA/Hepatitis/3 1998. Hepatitis B in South-East Asia Region. World Health Organization, Regional Office for South-East Asia, New Delhi.
3. Khin Maung Tin. Hepatitis B vaccine trial in Burma. Interim Report submitted at the International Consultative Meeting on Viral Hepatitis, Rangoon, Burma 1984.
4. Instruction Manual, DMR HBsAg ELISA Test Kit. Department of Medical Research, Yangon, Myanmar.
5. Altman DG. Practical Statistics for Medical Research. 1st ed ; London, Chapman and Hall 1991.
6. Khin Pyone Kyi & Khin Maung Win. Viral Hepatitis in Myanmar. DMR Bulletin, 1995; 9(2): 1-31.
7. Margolis HS, Alter MJ, Hadler SC. Hepatitis B: evolving epidemiology and implications for control. Semin Liver Disease 1991; 11:84-92.
8. McMahon BJ, Rhoades ER, Heyward WL et al. A comprehensive programme to reduce the incidence of hepatitis B virus infection and its sequelae in Alaskan Natives. Lancet 1987; 2: 1134-36.
9. Khin Aye Tha & Myo Khin. Development of an in-house radioimmunoassay for qualitative measurement of antibody to hepatitis B surface
98

antigen. Myanmar Health Research Congress, Programme and Abstracts 1995; p. 109.
population. In: Szmuness W, Alter HJ, Maynard JE, eds. Viral hepatitis 1981 international symposium. Philadelphia: Franklin Institute Press, 1982:451-66.
10. CDC. Inactivated hepatitis B virus vaccine. MMWR 1982;31:317- 22,327-8.
12. CDC. Update on hepatitis B prevention. MMWR 1987; 36:354-60,366.
11. Hollinger FB, Adam E, Heiberg D, Melnick JL. Response to hepatitis B vaccine in a young adult
99
The Myanmar Health Sciences Research Journal, Vol. 18, No. 2, 2006
Serogroup distribution of enteropathogenic Escherichia coli isolated from infants with acute diarrhoea admitted to
Yangon Children’s Hospital (2004)
*Mar Mar Nyein, **Yaminn, *Mo Mo Win, *Aye Aye Maw & ***Thein Aung
*Bacteriology Research Division, Department of Medical Research (LM) ** Department of Child Health, Yangon Children’s Hospital ***Department of Child Health, University of Medicine (1)
Bacteriological characteristics of enteropathogenic Escherichia coli in 200 infants (<12 months) with diarrhoea diseases admitted to Yangon Children’s Hospital from July to December, 2004 were studied. Isolation of bacterial pathogens was done from rectal swabs in Cary-Blair transport media which were plated onto selective media for specific bacterial pathogens. The most frequently isolated bacterial pathogen was Enteropathogenic Escherichia coli (EPEC) accounting for 21% (42 cases) of the tested cases. The EPEC was isolated from 17.39%, 23.21% and 20.66% from <2, 2-6 and 6-12 months of age groups respectively. Isolated E. coli serogroups were O26K60, O25K+, O55K59, O119K69 (4 cases each), O6K51 (3 cases each), O1K51, O27K+, O78K80 O114K90, O125K70, O127K63 and O148K+ (2 cases each), and one case each of O8K40, O44K74, O28K73, O86K62, O112K66, O136K78 and O144Kx2. Antibiotic susceptibility revealed that EPEC was sensitive to amikacin (79.5%), cefotaxime (69.2%), netilmicin (66.6%), gentamicin (51.3%), norfloxacin (33.3%), chloramphenicol (20.5%) and to co-trimoxazole (5%). All EPEC tested were resistant to ampicillin.
INTRODUCTION
In Myanmar, diarrhoea has been recognized as a major public health problem and according to the results from the survey conducted in 1995, diarrhoea accounts for 16% of total mortality in children under five years of age [1]. According to Health Management Information System (HMIS) report for diseases under National sur-veillance (1996-2003), diarrhoea and dysen-tery diseases ranked third and fourth positions in 17 diseases and total number of deaths in the total population was 4th highest number in 2003 [2]. The morbidity and mortality of diarrhoea diseases in children admitted to YCH from 1999-2003 showed that the number of admitted cases was increasing yearly but the case fatality rate had reduced [3]. Most diarrhoea episodes occur during the first two years of life. Incidence is highest in the age group
6-11 months, when weaning often occurs [4]. Since the mid 1940s, Escherichia coli had been recognized as a cause of diarrhoea [5]. The role of enteropathogenic E. coli in Myanmar was recorded [6]. Admission of children with acute diarrhea during 1999-2003 was highest in December and January and lowest in August and September. ranging from 230759 to 306895 cases (YCH record). Thus, changing pattern of aetiological agents responsible for acute diarrhoea need to be investigated in relation with drug susceptibility.
MATERIALS AND METHODS
Place of study
Medical Units 1, 2, 3 and neonatal unit of YCH
Case selection: 200 cases of children (<1 yr) with acute diarrhoea disease
100
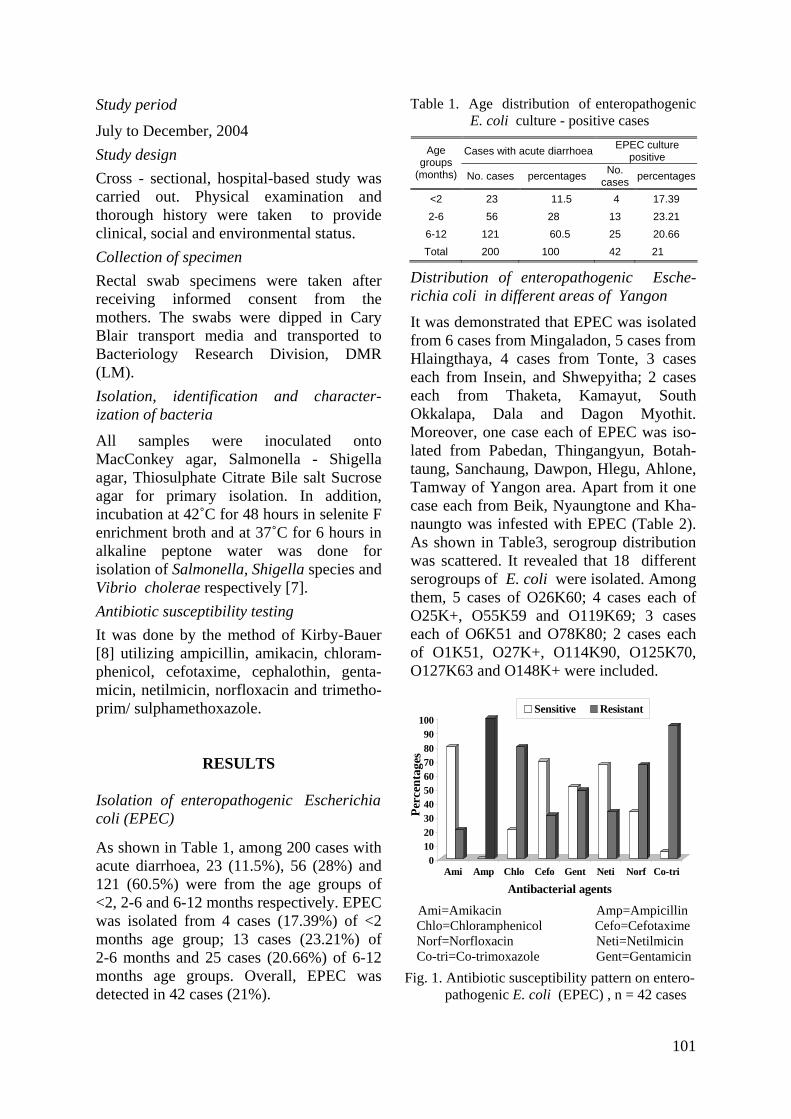
Study period
July to December, 2004 Study design Cross - sectional, hospital-based study was carried out. Physical examination and thorough history were taken to provide clinical, social and environmental status. Collection of specimen Rectal swab specimens were taken after receiving informed consent from the mothers. The swabs were dipped in Cary Blair transport media and transported to Bacteriology Research Division, DMR (LM). Isolation, identification and character-ization of bacteria
All samples were inoculated onto MacConkey agar, Salmonella - Shigella agar, Thiosulphate Citrate Bile salt Sucrose agar for primary isolation. In addition, incubation at 42˚C for 48 hours in selenite F enrichment broth and at 37˚C for 6 hours in alkaline peptone water was done for isolation of Salmonella, Shigella species and Vibrio cholerae respectively [7]. Antibiotic susceptibility testing It was done by the method of Kirby-Bauer [8] utilizing ampicillin, amikacin, chloram-phenicol, cefotaxime, cephalothin, genta-micin, netilmicin, norfloxacin and trimetho-prim/ sulphamethoxazole.
RESULTS
Isolation of enteropathogenic Escherichia coli (EPEC)
As shown in Table 1, among 200 cases with acute diarrhoea, 23 (11.5%), 56 (28%) and 121 (60.5%) were from the age groups of <2, 2-6 and 6-12 months respectively. EPEC was isolated from 4 cases (17.39%) of <2 months age group; 13 cases (23.21%) of 2-6 months and 25 cases (20.66%) of 6-12 months age groups. Overall, EPEC was detected in 42 cases (21%).
Table 1. Age distribution of enteropathogenic E. coli culture - positive cases
Cases with acute diarrhoea EPEC culture positive Age
groups (months) No. cases percentages No.
cases percentages
<2 23 11.5 4 17.39 2-6 56 28 13 23.21 6-12 121 60.5 25 20.66 Total 200 100 42 21
Distribution of enteropathogenic Esche-richia coli in different areas of Yangon
It was demonstrated that EPEC was isolated from 6 cases from Mingaladon, 5 cases from Hlaingthaya, 4 cases from Tonte, 3 cases each from Insein, and Shwepyitha; 2 cases each from Thaketa, Kamayut, South Okkalapa, Dala and Dagon Myothit. Moreover, one case each of EPEC was iso-lated from Pabedan, Thingangyun, Botah-taung, Sanchaung, Dawpon, Hlegu, Ahlone, Tamway of Yangon area. Apart from it one case each from Beik, Nyaungtone and Kha-naungto was infested with EPEC (Table 2). As shown in Table3, serogroup distribution was scattered. It revealed that 18 different serogroups of E. coli were isolated. Among them, 5 cases of O26K60; 4 cases each of O25K+, O55K59 and O119K69; 3 cases each of O6K51 and O78K80; 2 cases each of O1K51, O27K+, O114K90, O125K70, O127K63 and O148K+ were included.
Sensitive Resistant
0102030405060708090
100
Perc
enta
ges
Ami Amp Chlo Cefo Gent Neti Norf Co-tri
Antibacterial agents
Ami=Amikacin Amp=Ampicillin Chlo=Chloramphenicol Cefo=Cefotaxime Norf=Norfloxacin Neti=Netilmicin Co-tri=Co-trimoxazole Gent=Gentamicin
Fig. 1. Antibiotic susceptibility pattern on entero- pathogenic E. coli (EPEC) , n = 42 cases
101

Table 2. Distribution of enteropathogenic Escherichia coli in different areas of Yangon
Place Serogroup Age(mo) sex Lab. No.
Mingaladon O1K51 10 F 531 O8K40 8 M 582 Retro O25K+ 5 M 465 O55K59 0.75 M 466 O78K80 7 F 405 Exp; Retro O127K63 7 M 418 Tonte O27K+ 9 M 435 O144Kx2 5 M 430 O78K80 2 M 451 O112K66 4 M 499 Hlaingthaya O6K51 8 M 412 O25K+ 8 M 424 O114K90 6 M 494 O26K60 7 M 588 O78K80 3 F 593 Insein O28K73 9 M 520 O119K69 9 M 504 O148K+ 9 M 507 Shwepyitha O26K60 10 F 505 O27K+ 10 F 492 O119K69 9 M 532 Thaketa O1K51 2 F 401 O26K60 9 F 536 Kamayut O25K+ 5 M 483 O114K90 0.4 F 441 South Okkalapa O6K15 3 M 416 O25K+ 5 M 515 Dala O119K69 19 M 480 O125K70 7 M 471 Dagonmyothit O86K62 8 F 408 O148K+ 11 F 578 Pabedan O26K60 8 F 553 Thingangyun O55K59 9 M 404 Botahtaung O55K55 10 M 522 Sanchaung O136K78 5 M 557 Dawpon; Retro O55K59 8 M 469 Hlegu O26K60 8 F 431 Ah-lone O125K70 5 M 571 Tamway O6K51 7.5 M 443 Beik O127K63 5 M 554 Nyaungtone O44K74 11 M 556 Khanaungto O119K69 6 F 552
Antibiotic susceptibility pattern of entero-pathogenic Escherichia coli
As shown in Fig. 1, 79.5% of EPEC isolates were sensitive to amikacin, 69.2% to
cefotaxime; 20.5% to chloramphenicol, and 5% to cotrimoxazole. All isolates were resistant to ampicillin.
Table 3. Serogroups of Escherichia coli
isolated from infants
Sr. No.
Sero-groups
No. of cases
Male Female Locality
1 O1K51 2 0 2 Thaketa, Mingaladon
2 O6K51 3 3 0 Hlaingthaya, S. Okkalapa, Tamway
3 O8K40 1 1 0 Mingaladon 4 O25K+ 4 4 0 Hlaingthaya,
Mingaladon, Kamayut, S. Okkalapa
5 O26K60 5 1 4 Hlegu, Shwepyitha, Thakata, Pabedan, Hlaingthaya
6 O27K+ 2 1 1 Shwepyitha, Tonte
7 O28K73 1 1 0 Insein 8 O44K74 1 1 0 Nyaungdon 9 O55K59 4 4 0 Thingangyun,
Yuzana, Dawpon, Botahtaung
10 O78K80 3 1 2 Mingaladon, Tonte, Hlaingthaya
11 O86K62 1 0 1 Dagon Myothit 12 O112K66 1 1 0 Tonte 13 O114K90 2 1 1 Kamayut,
Hlaingthaya 14 O119K69 4 3 1 Insein, Ahlone,
Dala, Seikgyi 15 O125K70 2 2 0 Dala 16 O127K63 2 2 0 Mingaladon, Beik16 O136K78 1 1 0 Sanchaung 17 O144Kx2 1 1 0 Nyaungdone 18 O148K+ 2 1 1 Insein, S. Dagon
Total 42 29 (69.04%)
13 (30.95%)
DISCUSSION
In this study, EPEC isolation rate was highest in the age group of 2-6 months (23.21%). Regarding to the isolation rate in gender, 29 cases (69.04%) of males and 13 cases (30.95%) of females were infected with EPEC and it reflects that males are more prone to get EPEC infection in this study. As in previous studies, conventional
102
EPEC serogroups such as O26K60, O55K59, O25K+, O119K69, O78K80 were the most frequent serogroups isolated. It was also reported by a paediatrician that a child infected with E.coli serogoup O127K63 which showed resistant to all tested antibiotics passed away. In this study all EPEC were resistant to ampicillin, 97% to cotrimoxazole and 71% to chloram-phenicol. It was also noted that antibiotic resistance pattern was changing and majority of the isolated EPEC were multidrug resistant. The sensitivity rates had decreased more significantly for cotrimo-xazole. The susceptibility rates of EPEC serogroups were significantly reduced to even third generation cephalosporin and newer aminoglycosides. Thus safe and active antibiotics need to be searched for the treatment of EPEC infection. In addition to not only relying on the antibiotics but also keeping clean and healthy environment for infants and mothers, more research and education should be emphasized on environ-mental research.
ACKNOWLEDGEMENTS
We would like to thank our Director General Dr Paing Soe, Deputy Director General Dr Soe Thein and Director Dr Kyaw Moe for their keen interest and support. Our sincere gratitude to Professor
Dr Thein Aung, Professor and Head of the Department of Child Health, Chairman, Board of Postgraduate studies and to infants and mothers who participated in this study.
REFERENCES
1. Ye Myint. Epidemiology of diarrhoea. In: Impact of diarrhea on health of children and current management; 42nd Myanmar Medical Association Symposium. Myanmar Medical Association. 1996; p. 2-8.
2.. NHP 1996-2003. National Health Plan. Ministry of Health.
3. Yaminn. Enteropathogenic Escherichia coli in infants with acute diarrhoeal disease admitted to Yangon Children Hospital. M. Med.Sc (Paediatrics). IM (1), 2006.
4. World Health Organization. Reading on diarrhoea, student manual. Geneva. WHO 1994; 3-24.
5. Gordon JE. Neonatal enteric infections caused by Escherichia coli. by Tennant, B (ed.). Annals of the New York Academy of Sciences 1971, 176: 104-105.
6. Mar Mar Nyein. Escherichia coli diarrhea in Myanmar. DMR Bulletin 2000, 14(1):1-19.
7. WHO. Manuals of diagnostic laboratory procedure for acute enteric infection. Simplified methods. World Heath Organization, Geneva, 1990.
8. Bauer AWW, Kirby WMM, Sherris JC & Turck M. Antibiotic susceptibility testing by standardized disc method. American Journal of Clinical Pathology 1966; 45: 493-496.
103
The Myanmar Health Sciences Research Journal, Vol. 18, No. 2, 2006
Cellular immune response following Russell’s viper (Daboia russelii siamensis) bites in Myanmar
Tun Pe & Aye Aye Myint
Venom Research Laboratory
Department of Medical Research (LM)
Cellular immune response of 14 proven Russell’s viper (Daboia russelii siamensis) bite cases from Thayawady Hospital was monitored from 12 to 117 weeks following the bites in 1992 by performing mitogen induced lymphocyte proliferation to phytohaemagglutinin (PHA), pokeweed mitogen (PWM) and Russell’s viper (D.r.siamensis) venom and tolerance of PHA and PWM induced lymphocytes to venom challenge. Immune status of a Russell’s viper bite reptile keeper at 36 and 40 weeks after the bite and a venom handler of Myanmar Pharmaceutical Factory were also available for study. In general, response to PHA, PWM and venom induced lymphocyte proliferation of the victims and the venom handler was within normal range, however these parameters waned with time in the former. PHA induced lymphocytes could tolerate venom challenge more than PWM induced lymphocytes throughout the study (75-88% vs 63-74%).
INTRODUCTION
Russell’s viper bite is a common problem of our farmers. It carries a high morbidity and mortality rate of 7710 (6529-8994) and 7.13% (4.9-8.5%) (mean and range) respectively based on poisonous snake bites collected by the Department of Health Planning from the whole country (1998-2003) [1]. Prophylactic immunization with venoid [2] may be another alternative to reduce morbidity and mortality of snake bite. Understanding of immune response of Russell’s viper bite may help in planning for active immunization programme. Study on humoral response following snakebite including Russell’s viper has been reported [3-7]. However, information on study of cellular immune status following snakebite was scanty [8] and such study will further improve our understanding on cellular immune response following snakebite. This study concerns with monitoring of cellular immune response of Russell’s viper bite cases from 12 to 117 weeks after the bite.
MATERIALS AND METHODS Monitoring of immune status of 14 proven Russell’s viper (Daboia russelii siamensis) bite cases of Thayawady Hospital was carried out from 12 to 117 weeks in 1992. Follow- ups were carried out at 12, 24, 48, 78 and 96 week after the bite and samples collected were transported to the Venom Research Laboratory, Department of Medical Research, Yangon in cold chain and were processed on the same day. The following tests were performed in order to monitor the cellular immune response of the subjects; mitogen induced lympho-cyte proliferation to phytohaemagglutinin (PHA), pokeweed mitogen (PWM) and venom, tolerance to venom challenge by PHA and PWM induced lymphocytes. Relatives of the snakebite victims who have the same social economic status as the patients served as controls. While carrying out the study, we came across a case of Russell’s viper bite in a reptile keeper (AM) 36 weeks ago from the snake farm of
104

Myanmar Pharmaceutical factory and a venom handler (BN) (over 30 years service) from the same factory and it was of our interest to study immune status of them in order to see responses elicited in different situations.
Preparation of lymphocytes
Twenty milliliters of heparinised blood were layered onto 10 ml of Ficoll-paque reagent (Pharmacia) and centrifuged at 1700 rpm for 20 min. at 20-25ºC. Cells from buffy coat layer were collected and washed with RPMI 1640 medium twice at 1500 rpm for 15 min. and 1000 rpm for 5 min. Diluted cell stocks (1-2 x 10⁶/ml in RPMI medium with 10% foetal calf serum) were kept cold on ice.
Response to mitogens
1. Phytohaemagglutinin (PHA) induced lymphocyte proliferation
One-hundred microliter of 1x10⁶ cell/ml, 90 µl of RPMI and 10 µl of 10 µg/ml PHA solution were added to 96-well flat bottom culture plate, mixed and incubated at 37 ºC in 5% CO2 for 72 hours. Then 10 microlitre of 1 uci/ml 3H-thymidine were added to the culture 18 hours before harvesting onto a glass fibre and were counted in gamma counter. Stimulation indexes were calculated from the results. Triplicate samples were put up for the test and control. Another set of PHA induced lymphocytes were harvested, pooled and washed at the end of 72- hour culture and were used for venom challenge experiment.
2. Pokeweed mitogen (PWM) induced lymphocyte proliferation
A similar experiment was set up as in PHA stimulation test but 10 µl of 1:20 dilution of PWM was used in place of PHA and were cultured at 37ºC in 5% CO2 for 7 days. Ten microliters of 1uci /ml 3H-thymidine were added to the culture 18 hours before harvesting and then counted in gamma counter as in PHA response. Stimulation indexes were calculated from the results as before. Another set of PWM induced lymphocytes were harvested on day 7,
pooled, washed and used for venom challenge experiment.
Venom induced lymphocyte proliferation
To 100 ul of 1x10⁶/ml of cell suspension in 96-well flat bottom culture plate, 90 ul of RPMI medium and 10 ul of varying concentrations of Russell’s viper venom (300 ng/ml, 30 ng/ml, 3 ng/ml and 300 pg/ml) were added and incubated at 37ºC with 5% CO2 for 72 hours. Ten microliters of 1 uci/ml 3H-thymidine were added to the culture 18 hours before harvesting and then counted in gamma counter as in the other mitogen response tests. Stimulation indexes were calculated from the results. For control, 100 ul of cell suspension and 100 ul of RPMI medium were used. Venom challenge experiments
Venom challenge experiment of PHA and PWM induced lymphocytes was carried out as below.
Fifty microliters of either cell suspension (1 x 10⁶ cell/ml) was incubated with 20 µl of varying concentrations of Russell’s viper venom (doubling dilution of 500 µg/ml of venom to 7.8 µg/ml) at 37ºC for 1 hour and centrifuged at 1500 rpm at 4ºC for 10 minutes. Cell viability was assessed using trypan blue indicator. At least 200 cells were counted in a haemocytometer under light microscopy for percentage of viable cells. For control, cell suspension was incubated with the medium instead of venom solution.
RESULTS
PHA induced lymphocyte proliferation
PHA induced lymphocyte proliferation of the snakebite victims is shown in Figure 1. Maximum stimulation index was observed at 24-30 weeks following the bites and the response of the PHA induced lymphocyte proliferation was not suppressed throughout the study period. The stimulation index of PHA induced lymphocyte proliferation of
105
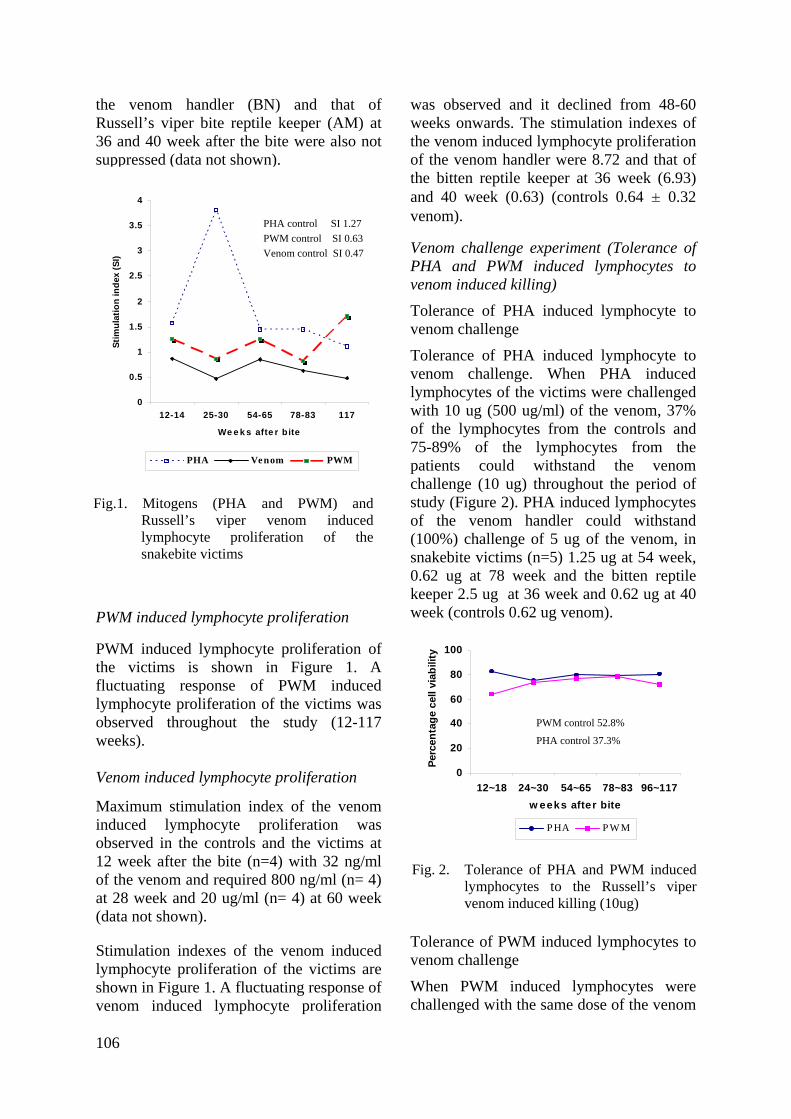
the venom handler (BN) and that of Russell’s viper bite reptile keeper (AM) at 36 and 40 week after the bite were also not suppressed (data not shown).
PWM induced lymphocyte proliferation
PWM induced lymphocyte proliferation of the victims is shown in Figure 1. A fluctuating response of PWM induced lymphocyte proliferation of the victims was observed throughout the study (12-117 weeks). Venom induced lymphocyte proliferation
Maximum stimulation index of the venom induced lymphocyte proliferation was observed in the controls and the victims at 12 week after the bite (n=4) with 32 ng/ml of the venom and required 800 ng/ml (n= 4) at 28 week and 20 ug/ml (n= 4) at 60 week (data not shown).
Stimulation indexes of the venom induced lymphocyte proliferation of the victims are shown in Figure 1. A fluctuating response of venom induced lymphocyte proliferation
was observed and it declined from 48-60 weeks onwards. The stimulation indexes of the venom induced lymphocyte proliferation of the venom handler were 8.72 and that of the bitten reptile keeper at 36 week (6.93) and 40 week (0.63) (controls 0.64 ± 0.32 venom).
0
0.5
1
1.5
2
2.5
3
3.5
4
12-14 25-30 54-65 78-83 117
We e k s afte r bite
Stim
ulat
ion
inde
x (S
I)
PHA Venom PWM
Fig.1. Mitogens (PHA and PWM) and
Russell’s viper venom induced lymphocyte proliferation of the snakebite victims
PHA control SI 1.27 PWM control SI 0.63 Venom control SI 0.47
Venom challenge experiment (Tolerance of PHA and PWM induced lymphocytes to venom induced killing)
Tolerance of PHA induced lymphocyte to venom challenge
Tolerance of PHA induced lymphocyte to venom challenge. When PHA induced lymphocytes of the victims were challenged with 10 ug (500 ug/ml) of the venom, 37% of the lymphocytes from the controls and 75-89% of the lymphocytes from the patients could withstand the venom challenge (10 ug) throughout the period of study (Figure 2). PHA induced lymphocytes of the venom handler could withstand (100%) challenge of 5 ug of the venom, in snakebite victims (n=5) 1.25 ug at 54 week, 0.62 ug at 78 week and the bitten reptile keeper 2.5 ug at 36 week and 0.62 ug at 40 week (controls 0.62 ug venom).
0
20
40
60
80
100
12~18 24~30 54~65 78~83 96~117w eeks after bite
Perc
enta
ge c
ell v
iabi
lity
PHA PWM
Fig. 2. Tolerance of PHA and PWM induced
lymphocytes to the Russell’s viper venom induced killing (10ug)
PWM control 52.8%
PHA control 37.3%
Tolerance of PWM induced lymphocytes to venom challenge
When PWM induced lymphocytes were challenged with the same dose of the venom
106
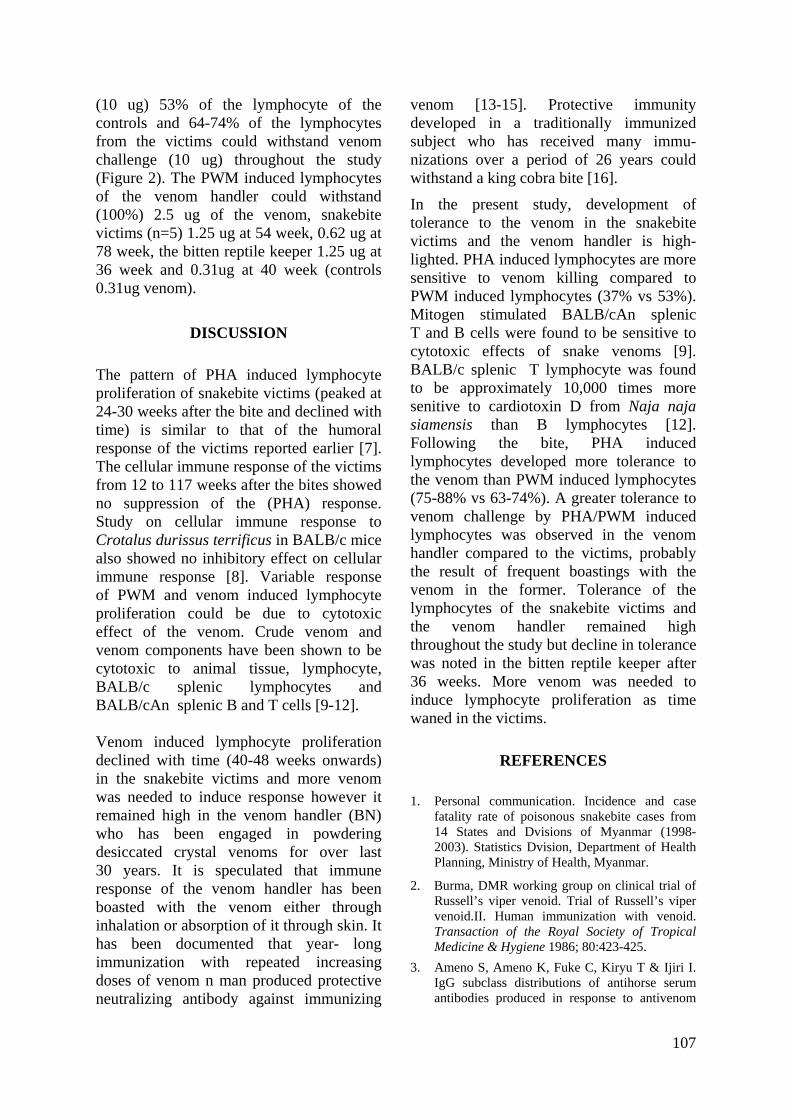
(10 ug) 53% of the lymphocyte of the controls and 64-74% of the lymphocytes from the victims could withstand venom challenge (10 ug) throughout the study (Figure 2). The PWM induced lymphocytes of the venom handler could withstand (100%) 2.5 ug of the venom, snakebite victims (n=5) 1.25 ug at 54 week, 0.62 ug at 78 week, the bitten reptile keeper 1.25 ug at 36 week and 0.31ug at 40 week (controls 0.31ug venom).
DISCUSSION
The pattern of PHA induced lymphocyte proliferation of snakebite victims (peaked at 24-30 weeks after the bite and declined with time) is similar to that of the humoral response of the victims reported earlier [7]. The cellular immune response of the victims from 12 to 117 weeks after the bites showed no suppression of the (PHA) response. Study on cellular immune response to Crotalus durissus terrificus in BALB/c mice also showed no inhibitory effect on cellular immune response [8]. Variable response of PWM and venom induced lymphocyte proliferation could be due to cytotoxic effect of the venom. Crude venom and venom components have been shown to be cytotoxic to animal tissue, lymphocyte, BALB/c splenic lymphocytes and BALB/cAn splenic B and T cells [9-12]. Venom induced lymphocyte proliferation declined with time (40-48 weeks onwards) in the snakebite victims and more venom was needed to induce response however it remained high in the venom handler (BN) who has been engaged in powdering desiccated crystal venoms for over last 30 years. It is speculated that immune response of the venom handler has been boasted with the venom either through inhalation or absorption of it through skin. It has been documented that year- long immunization with repeated increasing doses of venom n man produced protective neutralizing antibody against immunizing
venom [13-15]. Protective immunity developed in a traditionally immunized subject who has received many immu-nizations over a period of 26 years could withstand a king cobra bite [16].
In the present study, development of tolerance to the venom in the snakebite victims and the venom handler is high-lighted. PHA induced lymphocytes are more sensitive to venom killing compared to PWM induced lymphocytes (37% vs 53%). Mitogen stimulated BALB/cAn splenic T and B cells were found to be sensitive to cytotoxic effects of snake venoms [9]. BALB/c splenic T lymphocyte was found to be approximately 10,000 times more senitive to cardiotoxin D from Naja naja siamensis than B lymphocytes [12]. Following the bite, PHA induced lymphocytes developed more tolerance to the venom than PWM induced lymphocytes (75-88% vs 63-74%). A greater tolerance to venom challenge by PHA/PWM induced lymphocytes was observed in the venom handler compared to the victims, probably the result of frequent boastings with the venom in the former. Tolerance of the lymphocytes of the snakebite victims and the venom handler remained high throughout the study but decline in tolerance was noted in the bitten reptile keeper after 36 weeks. More venom was needed to induce lymphocyte proliferation as time waned in the victims.
REFERENCES
1. Personal communication. Incidence and case fatality rate of poisonous snakebite cases from 14 States and Dvisions of Myanmar (1998-2003). Statistics Dvision, Department of Health Planning, Ministry of Health, Myanmar.
2. Burma, DMR working group on clinical trial of Russell’s viper venoid. Trial of Russell’s viper venoid.II. Human immunization with venoid. Transaction of the Royal Society of Tropical Medicine & Hygiene 1986; 80:423-425.
3. Ameno S, Ameno K, Fuke C, Kiryu T & Ijiri I. IgG subclass distributions of antihorse serum antibodies produced in response to antivenom
107
injection or snakebite in humans. Toxicon 1990; 28:347-350.
and their chromatographic fractions on animal cells in culture. Journal of Immunology 1962,
88:526-534. 4. Viravan C, Veeravat U, Warrell MJ, Theakston RDG & Warrell DA. ELISA confirmation of acute and post envenoming by the monocellate Thai cobra (Naja kaouthia) American Journal of Tropical Medicine and Hygiene 1986; 35:173-181.
11. Braganca BM, Patel TN, & Badrinath PG. Isolation and properties of a cobra venom factor selectively cytotoxic to Yoshida sarcoma cells. Biochem. Biophys. Acta. 1967; 136: 508-520.
12. Hinman CL, Lepisto E, Stevens R , Montgomery IN, Rauch, HC & Hudson RA. Effects of cardiotoxin D from Naja naja siamensis snake venom upon murine splenic lymphocytes. Toxicon 1987; 25: 1011-1014.
5. Theakston RDG, & Wyatt GB. Venom antibody levels in a patient bitten by a young puff adder (Bitis arietans) during a world record attempt. Annals of Tropical Medicine and Parasitology 1985;79: 305-309.
13. Haast WE & Wiener ML. Complete and spontaneous recovery from bite of Blue Krait snake (Bungarus caeruleus). American Journal of Tropical Medicine 1955; 4: 1135-1137.
6. Domingos MO, Cardoso JL, da Silva AM & Mota I. The humoral immune responses of patients bitten by the snake Bothrops jararaca (Jararaca). Toxicon 1990; 28: 723-726.
14. Flowers, HH. Active immunization of human being against cobra (N. naja) venom. Nature 1963; 200:1017-1018.
7. Tun Pe, Aye Aye Myint & May Mya Win. Humoral response following Russell’s viper (Daboia russelii siamensis) bites in Myanmar. Toxicon 1995; 33:373-377. 15. Weiner, S. Active immunization of man against
venom of Australian Tiger snake (Notechis scutatus). American Journal of Tropical Medicine 1960; 9: 284-292.
8. Cardoso DF & Mota I. Effect of Crotalus venom on the humoral and cellular immune response. Toxicon 1997; 35: 607-612.
9. Lewis GM, Minton SA & Slack JH. BALB/cAn B cells and T cells have distinct susceptibilities to cytotoxic effects of snake venom. Toxicon 1990; 28:351-358.
16. Tin Myint, Rai Mra, Maung Chit, Tun Pe & Warrell DA. Bites by the King cobra (Ophiophagus hannah) in Myanmar: successful treatment of severe neurotoxic envenoming. Quartly Journal of Medicine, New series 1991; 80:751-762.
10. Gaertner C, Goldblum N, Gitter S & Vries Andre De. The action of various snake venoms
108