DEPARTMENT OF MATERIALS SCIENCE AND ENGINEERING CARNEGIE MELLON UNIVERSITY...
31
27-301 Lab. 2 October 11, 2015 1 DEPARTMENT OF MATERIALS SCIENCE AND ENGINEERING CARNEGIE MELLON UNIVERSITY 27-301 Microstructure & Properties LABORATORY MANUAL Experiment No. 2B: Optimizing Microstructure-Sensitive Mechanical Properties in Wood revised: ADR: Aug. ’07; MDG: Aug. ’09; ADR: Sep. ’10; MDG: Sep. ’11; ADR: Sep. ‘12; ADR: Sep. '13; ADR: Sep. ‘15
Transcript of DEPARTMENT OF MATERIALS SCIENCE AND ENGINEERING CARNEGIE MELLON UNIVERSITY...

27-301 Lab. 2 October 11, 2015
1
DEPARTMENT OF MATERIALS SCIENCE
AND ENGINEERING
CARNEGIE MELLON UNIVERSITY
27-301
Microstructure & Properties
LABORATORY MANUAL
Experiment No. 2B:
Optimizing Microstructure-Sensitive
Mechanical Properties in Wood
revised: ADR: Aug. ’07; MDG: Aug. ’09; ADR: Sep. ’10; MDG: Sep. ’11; ADR: Sep. ‘12; ADR: Sep. '13; ADR: Sep. ‘15

27-301 Lab. 2 October 11, 2015
2
Abstract The main objective of this Lab is to stimulate students to learn how to optimize materials properties in situations where multiple properties must be considered. The particular choice of material in this case is, generically, wood. By choosing a pair of mechanical properties, toughness (Charpy) and strength (microhardness, verified by compression testing), the students will also learn practical skills in testing of materials properties. The specific objective is to maximize the product of (compression) strength (measured in MPa) and toughness (measured in Joules in a Charpy test). The various groups of students will work on different types of materials and share their results. The objective of property optimization is both a useful exercise in the integration of theoretical with practical knowledge and a useful preparation for the Capstone Course with its Design component. Mechanical properties were chosen for this exercise because they are the basis for many practical engineering applications. As an example to be described for Charpy Impact testing, the lifetime of nuclear reactors is dependent in a critical and very direct fashion on the toughness measured on pressure vessel steels as it changes with time (and irradiation). At a more detailed level, the microstructure of many materials can be drastically changed through simple heat treatment and so steels (Fe-C alloys) have been chosen to illustrate these variations in experiment 2A. Experiment 2B, described here, addresses composite (and bio-)materials, and a much ignored material is wood. Its properties are strongly anisotropic (sensitive to direction): it is almost intuitive that wood is stronger along the grain than perpendicular to it. Therefore reporting on the anisotropy is part of this Lab. Moreover, its strength is extremely sensitive to the environment, especially the humidity level, which is again almost intuitive but interesting to quantify. In this respect, wood is representative of many biomaterials in its dependence on water content. See Lab 2A for a description of an experiment with steel.
1. Introductory Comments 1.1 Reading There is an enormous literature on the subject of mechanical properties of materials. The text by Porter & Easterling gives a large amount of useful information. Also the text by Tom Courtney, Mechanical Behavior of Materials, is very helpful. The Forest Service Handbook provides some general information about the variety of types of wood and their properties. If you find what appears to be useful information on the web, check it against at least one other source. Some handouts on moisture in wood are also provided for this experiment.

27-301 Lab. 2 October 11, 2015
3
1.2 Objective of the Experiment The objective of the experiment is to show you, the student, how to manipulate microstructures in a given material, and how strong an effect on the properties this can have. This demonstration relies on a traditional structural material – wood. You as a materials engineer will be expected to understand and control the properties of materials such as wood. Your ability to do this depends on your grasp of the microstructure-properties relationships in this and any other system that you deal with. This experiment will illustrate some of the key aspects of mechanical behavior of composite materials and biomaterials. As part of the general instruction in this course, you are also required to conduct a tensile test on a metal sample and to analyze it to obtain a true stress-true strain curve and apply a compliance correction. This latter experiment is described in a separate document. 1.3 Desired Educational Outcomes This set of experiments addresses several of the MSE Outcomes for the Undergraduate Program. Outcome D, “An ability to design and conduct experiments with an emphasis on relating properties and processing to structure” is most directly addressed by requiring students to perform experiments and analyze their own data. Outcome F, “An ability to function responsibly and ethically in a professional, multidisciplinary environment and as an individual or as a member of a team” is addressed by requiring students to perform the experiments in teams (5-6 per group) and share the workload of analysis and reporting. Outcome G, “An ability to employ the techniques, skills and tools of modern materials engineering practice” is addressed through hands-on training on instrumentation. Outcome C, “An ability to communicate effectively” is addressed by requiring the students to communicate their results with their own analysis through either presentations (for this second Lab) or written reports. Finally Outcome B, “An ability to apply core concepts in materials science (structure, properties, processing and performance) to contemporary materials engineering problems” is addressed through requiring students to relate their findings back to the basic principles discussed in the lecture part of the course (27-301). 1.4 Planning the Experimental Work Before performing experiments, you will be required to learn how to use the equipment safely and accurately. You will also be required to do some background reading, mainly focused on the properties of wood, its anisotropy and its sensitivity to moisture content. Then you must devise a plan for how you are proposing to proceed (see Outcome D above!) and what your expected results may be. Only after your plan has been

27-301 Lab. 2 October 11, 2015
4
approved by one of the Course Assistants and the Instructor will you be permitted to perform experiments. Check the Schedule for the due date for your Plan. 1.5 Preparation Before the Laboratory Sessions The wood experiments and the compression testing experiments do not require any pre-Lab work. Note however, that it is important to perform the wood testing on two days that are reasonably close together in order to be able to dry some specimens (for low moisture content) and soak others (for high moisture content). 1.6 Distribution of Experiments, Samples Optimization of mechanical properties. In Fall 2011 there are 9 groups. Of these, 5 will perform the property optimization exercise with steel samples and 4 will perform them with wood samples. The wood properties will be strength and modulus with moisture content as the major variable. Since moisture content is not exactly a microstructural parameter, evaluation of the anisotropy of the properties with compression tests will be required in addition, in order to quantify the effect of microstructure. For the experiments with wood, the objective is to maximize the product of (compression) strength (measured in MPa) and toughness (measured in Joules in a Charpy test). Lastly, you are encouraged to perform the supplemental experiments on cork to find out why its Poisson’s ratio is so interesting (e.g. for bottle stoppers).

27-301 Lab. 2 October 11, 2015
5
Sections 2, 3, and 4 have been moved to separate files, since they are common to the steel and wood experiments. Section 2 can be found in the file LabPlanning.pdf Section 3 is reproduced in the file LabSafety.pdf and Section 4 is reproduced in the file MechanicalProperties.pdf.

27-301 Lab. 2 October 11, 2015
6
5. Mechanical Properties as a Function of Microstructure In this experiment you will perform tests on wood. The focus will be on (a) the variation in mechanical properties between different types of wood; (b) the anisotropy of wood properties; (c) the effect of thermal treatment (drying) and soaking (to vary the moisture content of the wood) on mechanical properties; and (d) the composite nature of wood. Note that only the first of these requires testing all the available species of wood. The other series of experiments may be performed on only one type. 5.2 Design of Experiment You will design a set of experiments, write a plan and submit it by the date specified in the Course Schedule. The instructor will provide feedback on your plan. You will measure the mechanical properties by performing compression tests in the Instron testing frame. You will also compare the strength in compression with the strength in tension by performing tensile tests. Since performing tensile test on a wood specimen is difficult because of the care needed to grip the specimen without crushing the material, you will perform compression tests (which will provide your primary measurement of strength). You will analyze the data from the tensile tests to produce a true stress-true strain curve. You will use the Charpy tester to measure toughness. You will use optical microscopy on the various samples in order to document the variations in microstructure. You should perform scanning electron microscopy in addition since we have SEMs available in the undergraduate lab (e.g. for characterization of fracture surfaces) but this must be arranged well in advance with the staff members in charge of electron microscopy, Tom Nuhfer or Adam Wise (Roberts Hall). A critical issue is the amount of time available for your tests, so you must manage your time with care, sharing out tasks etc. The mechanical properties of wood are dependent on the microstructure just as they are for any other class of material. The main objective of the lab therefore is to illustrate this point for a material class that is in widespread use but receives little attention in conventional materials science. It also illustrates the complexity of the structure of wood, which you will explore to a limited extent. You can vary the properties by varying the moisture content of the wood. You may also consider treating the wood with chemicals; if you choose to pursue this possibility you must consider any potential chemical hazards as part of your planning. The mode of testing will be compression instead of tension (or Charpy impact) in order to demonstrate an alternative method and because gripping wood specimens in a tensile test is not as straightforward as for metal or polymer specimens. Nevertheless, you are required to perform your own tension samples and

27-301 Lab. 2 October 11, 2015
7
analyze the results. Lastly, although wood is itself a natural composite, it is highly anisotropic as you will observe in your tests. Therefore it is often used in a man-made, macroscopic composite form i.e. plywood. You will test a common form of plywood to compare its properties with those of regular wood. You will be working in a group of three to five students for each experiment and you will report on the experiment with a presentation to the rest of the class. Each student must contribute to the presentation on an individual basis, i.e. each student must take a turn. Part of the grade for the experiment will be based on the individual presentation and will include a component of communication. The computer file containing the slides must be submitted after the presentation to the instructor and will contribute to the grade for the experiment. Keep in mind that it is often not possible to include all of the relevant information in the slides that you show because of limitations on time. Therefore, you are recommended to make the slides as complete as possible but divide them into two parts. The first part contains the slides that you use in the presentation and the second part contains the slides that have additional and/or back-up information. Because the presentation is common to the group, that part of the grade will be also in common. Each group must submit a written report on the day of the presentation. A printed copy of all the slides from your presentation will constitute the written report. 5.3 Types of Wood to be tested: 1) White Pine: a standard softwood much used for building frames and simple cabinetry 2) Oak: a tough hardwood with a relatively open grain, much used for sailing ships in former times and still used extensively in furniture and cabinetry. Some specimens may also be available for these wood types (in limited numbers): 3) Plywood: you will test interior grade plywood laminated from softwoods. 4) Cork: technically this is the bark of a type of oak. This is provided in case you have time to measure its Poisson’s ratio. 5.4 Experimental Procedure Compression Testing: this will be the main type of test to be carried out. One of the frames will have a subpress which is a cage constructed to hold the specimen and, in effect, reverse the action of the testing apparatus. You will need to arrive at a collective plan for performing the tests in order to ensure that all the test parameters have been covered. When you consider the anisotropy of wood, recall its microstructure and be aware that all three directions have different properties (which point group describes the symmetry of the properties?!). As a natural material, wood is very sensitive to its
27-301 Lab. 2 October 11, 2015
8
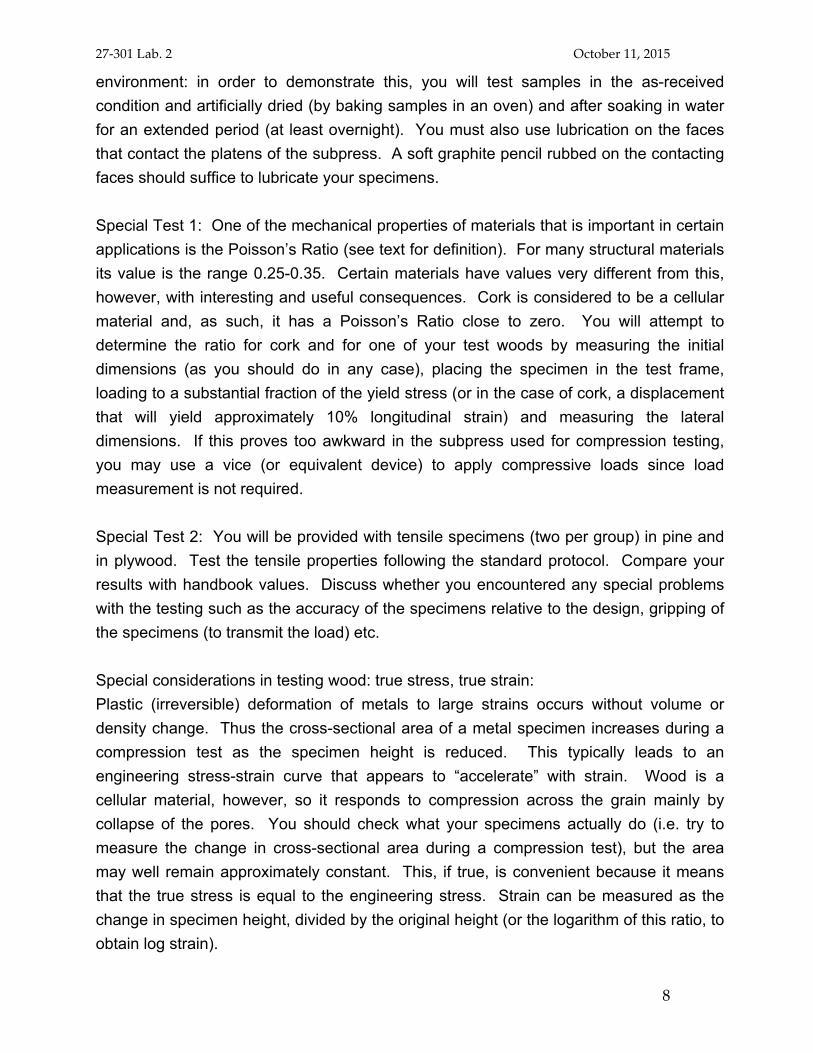
environment: in order to demonstrate this, you will test samples in the as-received condition and artificially dried (by baking samples in an oven) and after soaking in water for an extended period (at least overnight). You must also use lubrication on the faces that contact the platens of the subpress. A soft graphite pencil rubbed on the contacting faces should suffice to lubricate your specimens. Special Test 1: One of the mechanical properties of materials that is important in certain applications is the Poisson’s Ratio (see text for definition). For many structural materials its value is the range 0.25-0.35. Certain materials have values very different from this, however, with interesting and useful consequences. Cork is considered to be a cellular material and, as such, it has a Poisson’s Ratio close to zero. You will attempt to determine the ratio for cork and for one of your test woods by measuring the initial dimensions (as you should do in any case), placing the specimen in the test frame, loading to a substantial fraction of the yield stress (or in the case of cork, a displacement that will yield approximately 10% longitudinal strain) and measuring the lateral dimensions. If this proves too awkward in the subpress used for compression testing, you may use a vice (or equivalent device) to apply compressive loads since load measurement is not required. Special Test 2: You will be provided with tensile specimens (two per group) in pine and in plywood. Test the tensile properties following the standard protocol. Compare your results with handbook values. Discuss whether you encountered any special problems with the testing such as the accuracy of the specimens relative to the design, gripping of the specimens (to transmit the load) etc. Special considerations in testing wood: true stress, true strain: Plastic (irreversible) deformation of metals to large strains occurs without volume or density change. Thus the cross-sectional area of a metal specimen increases during a compression test as the specimen height is reduced. This typically leads to an engineering stress-strain curve that appears to “accelerate” with strain. Wood is a cellular material, however, so it responds to compression across the grain mainly by collapse of the pores. You should check what your specimens actually do (i.e. try to measure the change in cross-sectional area during a compression test), but the area may well remain approximately constant. This, if true, is convenient because it means that the true stress is equal to the engineering stress. Strain can be measured as the change in specimen height, divided by the original height (or the logarithm of this ratio, to obtain log strain).

27-301 Lab. 2 October 11, 2015
9
5.5 Report Parameters: A) Type of wood B) Direction of testing (parallel to grain/parallel to radial direction/ parallel to the circumferential direction) C) Condition of the wood (As received/ Oven dried/ Water saturated) D) Testing Direction relative to the grain 5.5.1 Observations: i) Elastic modulus ii) Yield Stress (you may have to use back extrapolation to determine a yield) iii) Maximum Stress (this may depend on the failure mode) iv) Failure mode (buckling? fracture? along the grain? plywood: do the laminations remain intact?) v) Dimensions and weight of each sample (including before and after treatment to vary moisture content) 5.5.2 Analysis: a) Mechanical Property values (compare to handbook values): elastic modulus, yield stress, maximum stress b) Stress-Strain Curves (mark essential features such as yield, failure etc.) c) Anisotropy of Modulus, Strength. Report the elastic anisotropy tensor for stiffness in the matrix notation (Cij). Note which values you were able to measure, and which ones your experiments could not address. Explain what symmetry point group you assumed for your materials and why. d) Document the appearance of the specimen after testing: how did it fail? e) Optical (OM) and/or scanning electron microscopy (SEM) of the fracture surfaces f) Density – attempt to calculate the moisture content. 5.5.3 Questions for discussion about the results: 1) How important is the anisotropy of wood (be quantitative)? 2) Do you expect wood to be tough or brittle? Could its toughness vary with circumstances? 3) How useful is wood as an engineering material? Why? 4) How significant is its sensitivity to environmental conditions? How does wood compare with other materials?

27-301 Lab. 2 October 11, 2015
10
5) How do the specific properties of wood (modulus/density, strength/density) compare with other materials? Useful information can be found on the web site of the U.S. Department of Agriculture, Forest Products Laboratory; use the search engine http://www.fpl.fs.fed.us/search/ to find information on various types of wood. 5.5.4 Typical Values: Compression tests on 1cm cubes: Area = .01*.01 m2 = 1.10-4 m2. Oak/Northern Red/ green: compression along grain = 23,700 kPa = 23.7 MPa Load at "strength" = 23.7.106*1.10-4 = 23.7e2N = 2,370 N Oak/Northern Red/ green: compression across grain = 4,200 kPa = 4.2 MPa Load at "strength" = 4.2.106*1.10-4 = 4.2e2N = 420 N Oak/Northern Red/ 12%: compression along grain = 23,700 kPa = 23.7 MPa Load at "strength" = 46.6.106*1.10-4 = 46.0e2N = 4,600 N Oak/Northern Red/ 12%: compression across grain = 7,000 kPa = 7.0 MPa Load at "strength" = 7.0.106*1.10-4 = 7.0e2N = 700 N White Pine/ green: compression along grain = 16,800 kPa Load at "strength" = 1,680 N White Pine/ green: compression across grain = 1,300 kPa Load at "strength" = 130 N White Pine/ 12%: compression along grain = 34,700 kPa Load at "strength" = 3,470 N White Pine/ 12%: compression across grain = 3,200 kPa Load at "strength" = 320 N Poplar/ green: compression along grain = 18,300 kPa Load at "strength" = 1,830 N Poplar/ green: compression across grain = 1,900 kPa Load at "strength" = 190 N Poplar/ 12%: compression along grain = 38,200 kPa Load at "strength" = 3,820 N Poplar/ 12%: compression across grain = 3,400 kPa Load at "strength" = 340 N

27-301 Lab. 2 October 11, 2015
11
5.6 Compression Tests Objective: To become familiar with mechanical testing equipment and procedures and to develop an understanding of the range in mechanical properties of various structural materials. In particular, since tensile testing has been performed in other Labs, to become familiar with analysis of stress-strain data on a computer. The following points must be addressed: 1. Produce both engineering stress-engineering strain plots, and, 2. Produce true stress-true strain plots. 3. Analyze the true-stress true-strain curves (necking analysis does not apply to woods). N.B. Mechanical testing is a time-consuming operation, so only one group will be able to use the instrument on any given day. Schedule time on the Instrons in advance with the TAs and the Lab Manager, Bill Pingitore. 5.6.1 Reporting Compression Test Results C1. Include raw data and sample calculations in an appendix. C2. Include a computer plot of at least one stress-strain curve obtained through the computer interface for the Instron. Explain what you did to convert a load-displacement curve to a stress-strain curve. From the same data set, calculate both an engineering stress-strain curve, and a true stress-strain curve. Find the point on the true stress-strain curve at which the hardening rate has decreased to the point of being equal to the true stress; compare the strain at this point with the strain on the engineering stress-strain curve that corresponds to the maximum (ultimate) tensile stress. The suggested steps for analyzing the load-displacement curves are found in the document on “Mechanical Testing”. 6. Report Requirements Experiment 2 will be reported through a presentation. The presentations will take place in the regular classroom for 27-301 during the lecture times noted in the Course Schedule posted on Blackboard. Each presentation will last a maximum of 20 minutes, not including questions. See the posted schedule for when each individual Group will present. Your presentation must be made with PowerPoint. You are free to select the format of your slides, but make sure that you select a font size that will be readable from the back of the room. Also, use color sparingly, to highlight things of importance, but don’t turn your slides into multi-color “artworks”. Think of color in a text as having the same impact as using italic or bold fonts.

27-301 Lab. 2 October 11, 2015
12
Each group should bring a portable computer from which the Powerpoint file will be projected. Make sure that the file actually works on that computer! If you want to do a dry-run, to make sure that the projection works correctly, contact me via email and we’ll set up a time during the week before the presentations to try things out. 6.1 General Requirements for the Presentation (Please review before preparing your slides)
1. Title Page -- The title page, should include a title identifying the report, its author, and the names of the group members. The title itself should be concise, yet descriptive and include key words that identify the experiments and convey the message of the report.
2. Introduction -- The introduction should be a maximum of three slides. Explain the motivation for the experiment and any required background that will help the audience understand the experiment.
3. Experimental Procedure -- The test procedure should be described concisely and should include any operational features that were discovered during the course of the experiment. For instance, time to reach steady state, length of an individual experiment and techniques used in sampling are important. The testing equipment and materials used in the project should be described in this section in sufficient detail so that they could be duplicated by the reader. Common items (balances, graduated cylinders, etc.) need not be named. You must address how your experimental plan guided your work in terms of the design of the experiment (and how you might improve the planning process).
4. Results -- This is the most important part of the report, for it represents your interpretation of the results of the experiment. Even though the results may be most effectively presented in tabular or graphical form, they must be preceded by text describing them. If appropriate, an estimate of precision of the data in terms of a relative uncertainty or confidence limit should be included. References should be made in the text to figures, graphs, tables, and equations, which are inserted in the report immediately following reference to them or as the next page. An analysis of the data should be included. Sample calculations should be included and are best presented as an Appendix.
6. Discussion --In this section, compare your results with theory or previous work. Discuss points of similarity or divergence and, if possible, give sources of these discrepancies. It

27-301 Lab. 2 October 11, 2015
13
is quite proper to include another author's curves on your plots, but not his individual data points. Evaluate trends in the results and any conclusions that can be drawn. Development of conclusions must begin in this section where they can be supported by logical argument, even though they will be dealt with exclusively in the next section. In the event of poor results, explain how the experiment should be modified to obtain satisfactory ones. This important section demonstrates your thinking and understanding of what was intended. In this section, you must discuss how you optimized the combination of toughness and strength as measured by the product of the two quantities (units to be discussed).
7A. Conclusions -- This section should be a numbered listing of the more important test results and major conclusions reached in the discussion. Conclusions are single sentences and typically 5 to 8 of them should be sufficient.
7B. Summary -- This section is a recapitulation of major points made in the Discussion in bulletized form and is intended to leave your audience with a clear idea of what you accomplished.
8. References -- This is a list of references in alphabetical order by author.
1. Use journal abbreviations as follows (article titles need not be included): Example: Author, Journal, Year, Vol. No., pp. R. M. Horn and R.O. Ritchie, Met.Trans., 1978, vol. 9A, pp. 1039-1053.
2. References to books should include the title and pages within the book. Example: Author, Book, edition, vol., pages, publisher, place, date.
George E. Dieter, Mechanical Metallurgy, 2nd ed., pp. 160-165, McGraw-Hill Book Co., New York, 1976.
9. Appendices (Supplemental Slides) -- Detailed technical information for which there is not space in the actual presentation should be included in these sections. An appendix contains information that would enable a reader to go into depth and completely check and reproduce the results. Included should be at least one complete set of sample calculations from original data to final results, copies of original data sheets, computer programs, etc. Appendices should not contain information vital to the report such as graphs or tables of data that properly belong in the Test Results section.

27-301 Lab. 2 October 11, 2015
14
6.2 Report Grading
Make sure that each team member gets to talk for about the same amount of time. Your presentation grade will depend on the following items: • 25 points for Content: was the content correct? Was it complete? Were figures and tables properly cited? • 25 points on Slides: were the slides readable and informative? Were they prepared with care or just slapped together at the last minute? • 25 points on the Oral presentation: did you have a fluent speaking style? Was the presentation rehearsed or was this the first time you talked out loud about this topic? (Note that this component of the grade will be different for each student; the other items are common to all the students of a particular group). • 25 points on the Question and Answer session: how well (and professionally) were questions answered after the presentations? Questions will be asked by the faculty present, the TAs, and also by students from the 4 groups that do not have their presentation that day. Final copies of your slides (which constitute the written lab report) must be submitted by 5pm on the submission date noted in the Course Schedule. Grading for reports submitted late will be reduced 20% for the first week and an additional 20% for each succeeding week.
Note the following chart of guidelines for the criteria used to differentiate between high quality and low quality presentations.

27-301 Lab. 2 October 11, 2015
15
Students are referred to the University Policy About Cheating and Plagiarism (Organization Announcement No. 297, 6116/80). It shall be the policy in this course to discourage cheating to the extent possible, rather than to try to trap and to punish. On the other hand, in fairness to all concerned, cheating and plagiarism will be treated severely.
"Cheating includes but is not necessarily limited to: 1.Plagiarism, explained below.
2.Submission of work that is not the student's own for reports or quizzes.
3.Submission or use of falsified data.
Plagiarism includes (but is not limited to) failure to indicate the source with quotation marks or footnotes, where appropriate, if any of the following are reproduced in the work submitted by a student: 1. A graph or table of data.
2. Specific language.
3. Exact wording taken from the work, published or unpublished, of another person.

27-301 Lab. 2 October 11, 2015
16
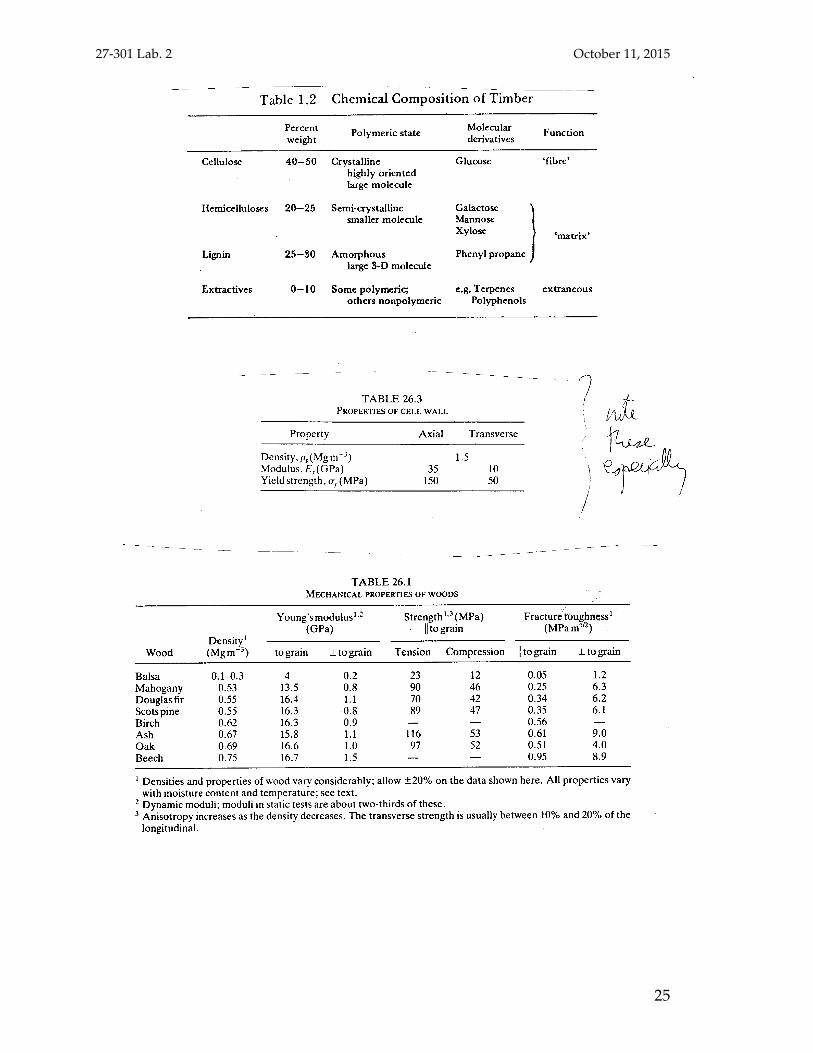
Appendix I - The Properties of Wood I.1 Abstract Wood is a natural material that has been used as a structural material since ancient times. Its properties may be defined in a similar manner to other materials in order to perform quantitative design of structures. The properties of wood - and the degradation processes that limit its useful life - can be very well described in terms of its structure. Such descriptions must include, however, not only the basic structural unit, i.e. the cellulose molecule, but also some description of the spatial arrangements within the material. All this is perfectly satisfactory from an engineering point of view but tends to leave the materials scientist with the dissatisfying conclusion that the very fact of wood's natural origin precludes manipulation of the material in order to optimize its properties - the essence of materials science and engineering. This is from being the case, however, as many man-designed forms of wood product are now available from plywood to "glu-lam" beams. These products depend critically on composite design and on the adhesives used to assemble the materials. I.2 Memory Card • Wood is a cellular composite, whose mechanical properties are largely dependent on density. The cell walls of different species have similar mechanical properties, although their chemistry varies significantly. Eaxial ∝ Ecell (ρ /ρcell) Etransverse ∝ Ecell (ρ / ρcell)2 • The properties of wood are highly dependent on the humidity of its local environment which is a result of the chemical nature of its constituents and its porosity. • Wood is a natural material but is used both in its natural state, and in man-made (macro-)composite forms (e.g. plywood). • The lifetime of wood components is limited by both mechanical properties (creep) and by biological decay processes.

27-301 Lab. 2 October 11, 2015
17
I.3 Useful Books, Handbooks • The Wood Handbook at
http://www.fpl.fs.fed.us/documnts/FPLGTR/fplgtr113/fplgtr113.htm. • Cellular Solids: Structure & Properties, Gibson, Lorna J. , Cambridge Univ. Press,
1988. • Materials for Engineering, L. H. Van Vlack, Addison Wesley. the basic book; largely qualitative description. • Engineering Materials (2), M. F. Ashby and D. R. H. Jones, Pergamon. more explanation of mechanical properties. • Timber - its Nature and Behavior, J. M. Dinwoodie, Van Nostrand Reinhold. useful descriptions of properties in terms of microstructure. • Mechanics of Wood and Wood Composites, J. Bodig and B. A. Jayne, Van Nostrand
Reinhold. detailed textbook, emphasis on mechanics. • The New Science of Strong Materials, J. E. Gordon, Princeton. pleasant, qualitative account of the development of a wide range of materials, with
reference to aeroplanes, ships .... I.4 Structure It is important to understand wood as a cellular, composite structure. It is one, however, that has several different length scales from that of the cellulose molecule to the macrostructure of lumber as we accustomed to looking at it at the visual scale. The summary viewgraph illustrates the hierarchy of length scales that are pertinent to wood from the atomic structure of cellulose to the structure of a tree trunk. The basic building block of wood is the polymer of glucose known as cellulose, which occurs as a (mostly) crystalline fiber. The other critical component of wood is lignin, which is a complex, amorphous material containing phenyl groups. Lignin sets wood apart from other plants; its occurrence as outer and inner linings of the cell walls is critical for both structural properties and for wood’s (relative) insensitivity to environment. I.5 Mechanical Properties The most useful way to develop an understanding of the mechanical properties of wood is to relate the variation in modulus, strength etc. to the density. For this we follow the analysis of cellular structures in order to relate the macroscopic modulus to the modulus of the cell wall material.
27-301 Lab. 2 October 11, 2015
18
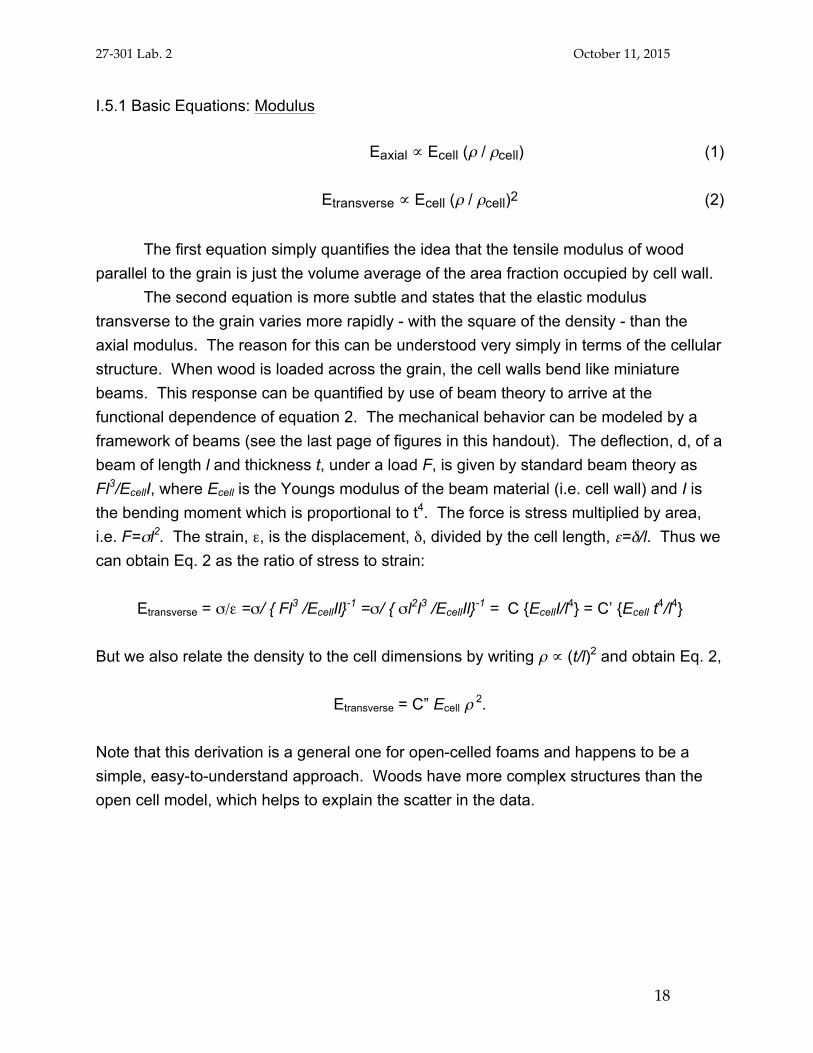
I.5.1 Basic Equations: Modulus
Eaxial ∝ Ecell (ρ / ρcell) (1)
Etransverse ∝ Ecell (ρ / ρcell)2 (2) The first equation simply quantifies the idea that the tensile modulus of wood parallel to the grain is just the volume average of the area fraction occupied by cell wall. The second equation is more subtle and states that the elastic modulus transverse to the grain varies more rapidly - with the square of the density - than the axial modulus. The reason for this can be understood very simply in terms of the cellular structure. When wood is loaded across the grain, the cell walls bend like miniature beams. This response can be quantified by use of beam theory to arrive at the functional dependence of equation 2. The mechanical behavior can be modeled by a framework of beams (see the last page of figures in this handout). The deflection, d, of a beam of length l and thickness t, under a load F, is given by standard beam theory as Fl3/EcellI, where Ecell is the Youngs modulus of the beam material (i.e. cell wall) and I is the bending moment which is proportional to t4. The force is stress multiplied by area, i.e. F=σl2. The strain, ε, is the displacement, δ, divided by the cell length, ε=δ/l. Thus we can obtain Eq. 2 as the ratio of stress to strain:
Etransverse = σ/ε =σ/ { Fl3 /EcellIl}-1 =σ/ { σl2l3 /EcellIl}-1 = C {EcellI/l4} = C’ {Ecell t4/l4} But we also relate the density to the cell dimensions by writing ρ ∝ (t/l)2 and obtain Eq. 2,
Etransverse = C” Ecell ρ 2. Note that this derivation is a general one for open-celled foams and happens to be a simple, easy-to-understand approach. Woods have more complex structures than the open cell model, which helps to explain the scatter in the data.

27-301 Lab. 2 October 11, 2015
19
I.5.2 Basic Equations: Strength σaxial ∝ σcell (ρ /ρcell) σtransverse ∝ σcell (ρ / ρcell)2 Here, the story is very similar to that of modulus. The axial modulus is determined by the area fraction of cell wall material, hence the linear dependence on density. The transverse strength, however, is limited by bending and plastic hinge behavior of the cellular structure, hence the quadratic dependence on density. The difference between axial and transverse properties is so great for both modulus and most other mechanical properties that it is always necessary to be aware of the anisotropy of wood, i.e. that the properties vary markedly with direction. Another topic, which we will not treat quantitatively here, is that of variability in properties. Wood of a particular species exhibits a wide range of strength, modulus and toughness because of the variation in the growth conditions such as rainfall, humidity, temperature etc. The measured variability must be accounted for in design in a manner that guarantees a minimum level of confidence in any structure. I.5.3 Basic Equations: Toughness KIC:axial ∝ KICcell (ρ /ρcell)3/2 KICtransverse ∝ KICcell (ρ / ρcell)3/2

27-301 Lab. 2 October 11, 2015
20
KICtransverse » KIC:axial For fracture toughness, the result is given without proof that the cellular structure leads to a 3/2 exponent in the density dependence. The crucial point is that propagating a crack parallel to the grain is much easier than transverse. More than one microstructural feature contributes to the high transverse toughness, including fiber pull-out, propagation of secondary cracks perpendicular to the primary crack, and elongation of the polymer chains in the cell walls. Again, there are many different directions and planes for crack propagation in this anisotropic material which further increases the variability of the toughness. I.6 Time Dependent Properties Although it is straightforward to perform mechanical tests on wood, many of the basic mechanical properties are time dependent. For modulus, this simply means that there is a frequency dependence with significantly higher effective moduli at high frequencies. For strength, the phenomenon of creep means that the allowable values of strength for design must be derated (decreased) when sustained stress is encountered. For current values of accepted design allowables, the appropriate handbook should be consulted: the data suggest that a derating of 50% is sufficient to account for time-dependent deformation. Again, the effect of moisture is so large that realistic lifetimes for wood must account for expected moisture-temperature cycles in the particular service location. I.7 Effect of Moisture The primary modifier of mechanical properties of wood is the moisture content. The higher the moisture content, the lower the strength until one reaches the fiber saturation point; this is, ideally, the moisture content above which the cell walls can not absorb any more water, and the further uptake of water is as free water in the interior of the cells. As before, it is useful to think of this discontinuity in the response of the material as being a characteristic of its cellular microstructure. Simply knowing the chemistry of the material (i.e. that the majority component is cellulose) is insufficient to explain the properties of the material. It is important to realize that, as is so often the case with materials, there is no free lunch. In more precise terms, as the strength goes up (with decreasing moisture content) the toughness goes down. This reciprocal relationship between strength and toughness is well known in metal alloys.
27-301 Lab. 2 October 11, 2015
21
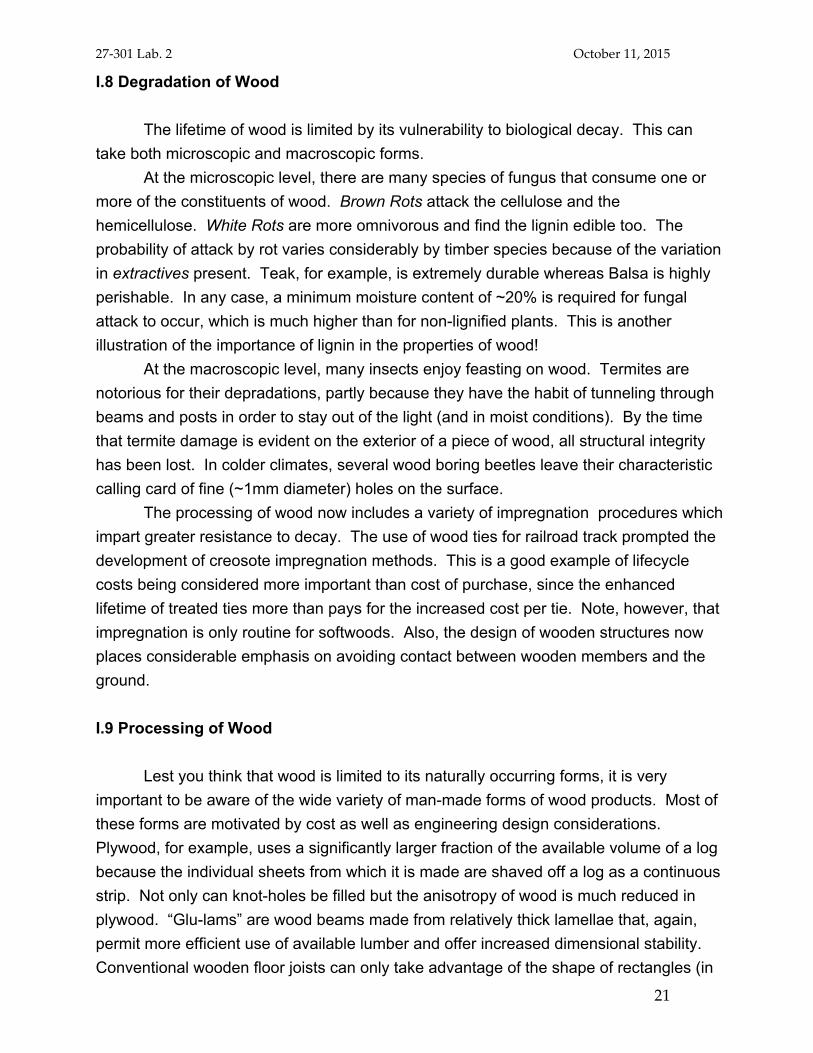
I.8 Degradation of Wood The lifetime of wood is limited by its vulnerability to biological decay. This can take both microscopic and macroscopic forms. At the microscopic level, there are many species of fungus that consume one or more of the constituents of wood. Brown Rots attack the cellulose and the hemicellulose. White Rots are more omnivorous and find the lignin edible too. The probability of attack by rot varies considerably by timber species because of the variation in extractives present. Teak, for example, is extremely durable whereas Balsa is highly perishable. In any case, a minimum moisture content of ~20% is required for fungal attack to occur, which is much higher than for non-lignified plants. This is another illustration of the importance of lignin in the properties of wood! At the macroscopic level, many insects enjoy feasting on wood. Termites are notorious for their depradations, partly because they have the habit of tunneling through beams and posts in order to stay out of the light (and in moist conditions). By the time that termite damage is evident on the exterior of a piece of wood, all structural integrity has been lost. In colder climates, several wood boring beetles leave their characteristic calling card of fine (~1mm diameter) holes on the surface. The processing of wood now includes a variety of impregnation procedures which impart greater resistance to decay. The use of wood ties for railroad track prompted the development of creosote impregnation methods. This is a good example of lifecycle costs being considered more important than cost of purchase, since the enhanced lifetime of treated ties more than pays for the increased cost per tie. Note, however, that impregnation is only routine for softwoods. Also, the design of wooden structures now places considerable emphasis on avoiding contact between wooden members and the ground. I.9 Processing of Wood Lest you think that wood is limited to its naturally occurring forms, it is very important to be aware of the wide variety of man-made forms of wood products. Most of these forms are motivated by cost as well as engineering design considerations. Plywood, for example, uses a significantly larger fraction of the available volume of a log because the individual sheets from which it is made are shaved off a log as a continuous strip. Not only can knot-holes be filled but the anisotropy of wood is much reduced in plywood. “Glu-lams” are wood beams made from relatively thick lamellae that, again, permit more efficient use of available lumber and offer increased dimensional stability. Conventional wooden floor joists can only take advantage of the shape of rectangles (in

27-301 Lab. 2 October 11, 2015
22
cross section), as compared, for example, to the more efficient shape of steel I-beams. Recently, more elaborate composites are being manufactured for joists that approximate I-beams in shape and offer very good resistance to sound transmission. I.10 Joining of Wood As with many composites, a major difficulty with the application of wood is joining. In ancient times, great care was used to avoid tension joints; where these were unavoidable, mechanical pinning was used with subtlety that the pins (“pegs”) needed to be drier than the beams so that, in time, the structural members would shrink onto the pins and hold them. Ship construction resulted in the need to seal the joints between the planks used to sheath the hull which was done with, amongst other materials, tar or pitch. The phrase “devil to pay” is actually a contraction of the frustrated shipbuilder’s remark that there was “the devil to pay and only half a bucket of pitch left”; in this context, the “devil” was a particular seam that was prone to leak. Modern glues based on caesin (milk products) and on epoxies have greatly improved the prospects of wood, especially the man-made composites based on wood. I.11 Cork Cellular Solids, Lorna Gibson & Michael Ashby, Pergamon detailed description of the properties and structure of cellular solids. Cork in its natural form is simply the bark of the cork oak, Quercus Suber, which happens to grow as an unusually thick layer of the cork cambium layer in the bark. Unlike regular wood, where there is considerable heterogeneity in the structure, cork is nearly a homogeneous structure of (approximately) hexagonal cells, whose prism axis is parallel to the radial direction in the tree trunk. The exception to this concerns the lenticels, which are planar channels in the cork whose plane normal is in the tangential direction. The cell walls themselves have corrugations, which are very important in controlling the mechanical properties of the honeycomb. They also are covered in suberin (an unsaturated fatty acid) and waxes, with the result that cork is highly resistant to chemical and biological attack. The mechanical properties of cork can be predicted based on its microstructure. The key feature of the prediction is the incorporation of the corrugated nature of the cell walls, because it allows one to predict the zero value of the Poisson ratio(s) for compression on the prism axis (radial direction), for example. The values shown for the predictions are based on measured values of cell wall density of 1150 kg/M3, and

27-301 Lab. 2 October 11, 2015
23
modulus of 9 GPa. Note that the agreement is surprisingly good except for the in-plane Poisson ratio, for which the variation is probably due to the heterogeneities in the structure.
Table of Mechanical Properties of Cork
Calculated Measured Moduli
Etransverse (MPa) 15 13 ±5 Eprism (MPa) 20 20 ±7
Gin-plane (MPa) 4 4.3 ±1.5 Gout-of-plane (MPa) - 2.5 ±1 Poisson ratioin-plane 1.0 0.5 ±0.05
Poisson ratioout-of-plane 0 0 ±0.05
Collapse Stresscompr. in-plane (MPa) 1.5 0.7 ±0.2
out-of-plane (MPa) 1.5 0.8 ±0.2 Perhaps the best known application of cork is for wine bottle corks (also for gaskets in general, e.g. in internal combustion engines). The chemical resistance of cork is ideal for long-term use, but the elastic properties are also crucial to this application. Although the low Young's modulus is useful, note that the bulk modulus is also low, unlike other solid polymers above their glass transition temperature. Better yet, when cork is compressed along its prism axis, there is no change in lateral dimension. One might imagine that cutting corks along the radial direction would be ideal. The lenticels mentioned above, however, render this impracticable because they offer a leak path across the cork. The solution is materials engineering, such that a practical cork has two layers cut with the prism axis along the bung axis, topped with a cork composite made from bonding cork particles. This then is another example of manipulation of natural materials for particular applications.

27-301 Lab. 2 October 11, 2015
24
27-301 Lab. 2 October 11, 2015
25

27-301 Lab. 2 October 11, 2015
26

27-301 Lab. 2 October 11, 2015
27

27-301 Lab. 2 October 11, 2015
28

27-301 Lab. 2 October 11, 2015
29

27-301 Lab. 2 October 11, 2015
30

27-301 Lab. 2 October 11, 2015
31