Heavy vs Light Oil: Technical Issues & Economic Considerations (1983)

Department of International Economic and Social Affairs
SUPPLEMENT TO
WorldEconomicSurvey1983
• Recent experience in economic co-operation among developing:countries and possibilities for progress in the 1980s
• Some effects of rising public expenditure in developed marketeconomies
• The impact of workers' remittances on the balance of payments
United Nationst-lNew York, 1983\~I
~~
STlESA/136
NOTE
Symbols ofUnited Nations documents are composed of capital letters combined withfigures. Mention of such a symbol indicates a reference to a United Nations document.
ST/ESA/136
UNITED NATIONS PUBLICATION
Sales No. E.83.II.C.3
00800

PREFACE
The present Supplement to the World Economic Survey 1983 contains threearticles: ·Recent experience' in economic co-operation amoll9 developing countriesand possibilities for progress in the 1980s·, ·A note on some effects of risingpublic expenditure in developed market economies·, and ·The impact of workers'remitt'ances on the balance of payments·. Each study was initially prp.pared as aworking paper for use in the preparation of the World Economic Survey 1983. Muchof the information and analysis is of a more specific character than normallyappears in the Survey l. tself. Since the studies are on topics of wide interest,however, it was decided to make them generally available.
-iii-:-

CONTENTS
Preface ..............•..•.••.•....•.••••............••...•....•.....•.•..• .. iii
RECENT EXPERIENCE IN ECONOMIC CO-OPERATION AMONG DEVELOPING COUNTRIES ANDPOSSIBILITIES FOR PROGRESS IN THE 1980s ••••••••••••••••••••••••••••••••••••• 1
Introduction ••••••••••••••••••••••••••••••••••••••••••••••••••••••••••• 1
Recent trends in trade ·flows among developing countries •••••••••••••••• 1
Effects of the recession on trade flows among developing countries ••••• 5
Measures to be taken to enhance economic co-operation among developingcoontr ies •...•...............••....•0................................... 8
Economic co-operation among developing countries and commercialpolicies of developing countries •••••••••••••••••••••••••••••••••• 8
Measures in the field of g.roup-wide trade ••••••••••••••••••••••••• 9
Institutional developments and regional integration ••••••••••••••• 10
Financial and monetary co-operation ••••••••••••••••,.. • • • •• • • • • • • • • • 11
Sectoral co-operation among developing countries ••••••••••••••••••••••• 13
I.a.bour migration •.••••••••••••••••••••••• :......................... 14
water resources and river-basin development....................... 14
Food and agr iculture ..•.•.•••••••.•••••••••.••.••.•••.•.•.. '. . . • • • • 15
Energy co-operation •....•..e ••••••••••••••••••••••••••••••••••• eo... 16
Co-operation in minerals -•••.•...• -•••.-.•..• ,.. ' ,e.... ...... .... .. 17
Technological co-operation among developing countries ••••••••••••• 18
Ibtes ..•••.•...••.•...••..•.•••.•..•••••••• ,••••.. -•. •••••••...• ,. -. . • . . • . • • 19
A NOTE ON SOME EFFECTS OF RISING PUBLIC EXPENDITURE IN DEVELOPED MARKETEaJNOlfiES •• • '•••••••••••••,•••••••••••••• ••••••••••• ,. '••••••••••••• '. • • • • • • •• •• • 21
Size and structure of public expenditure .......................... ...... 21
Budget deficits and private savings .... ............................ '.... 25
Effect of transfer payments on private savings ••••••••••••••••••••••••• 25
Effect of transfer payments and taxes on the incentive to work ••••••••• 27
-iv-
CONTENTS (continued)
Effect of taxation on private savings and investment 28
Concluding remarks ••••••••••••••••••••••••••••••••••••••••••••••••••••• 29
tIcltes •••••••••••••••••••••••••••••••••••••••••••••••••••••••••••••••••• 29
THE IMPACT OF WORKERS' REMITTANCES ON THE BALAt«;E OF PAYMENTS ............... 31
Introduction ••.•.••..•..•.•.•••••••••.e •••••••••••••.••••••••• • '. •••• ••••• 31
The rise in remittances during the 1970s .....•..•.••••...... - . 35
The decline in remittances •.••.••••.•••••••••• • '••• e .• '............... •••• 37
Remittances and the reverse flow of migrants ••••••••••••••••••••••••••• 39
Some observations on the data base ••••••••••••••••••••••••••••••••••••• 40
Notes •••••••••••••••••••••••••••••••••••••••••••••••••••••••••••••••••• 40
-v- .

List of tables
Table
1-1. Percentage share of mutual trade in total exports and total importsof developing' countries .' •••••••" "•.• •'• •..• '.. '. • .. • 3
1-2. Percentage share of non-fuel trade among developing countries intotal non-fuel exports of developing countries...................... 4
1-3. Frequency distribution of GOP and population of selected developingcountries, 1980 •• '••••••••••••• •• ',• •.•••••••• •.• '.•.••• -•••• •••• • "•• "••• e:. _... 6
11-1. Public expenditure and its components ••••••••••••••••••••••••••••••• 22
11-2. Gross private savings and bUdget deficits ••••••••••••••••••••••••••• 26
11-3. Share of private savings in private disposable income ••••••••••••••• 28
111-1. Migrant workers' remittancesI reported inflows. ••••••••••• •••••• ••• 32
1II-2. Remittance inflows as percentage of merchandise exports, selectedcountries •••••••••••••••••••• '•••••••••• ..... -••••.•••••••• •••••.• ••••• -. ". 34
-vi-
ExplanatoEY notes
The following symbols have been used in the tables throughout the report:
Three dots (••• ) indicate that data are not available or are not separatelyreported.
A dash (-) indicates that the amount is nil or negligible.
A blank in a ta,ble indicates that the item is not applicable.
A minus sign (-) indicates a deficit or decrease, except as indicated.
A full stop (.) is used to indicate decimals.
A slash (I) indicates a financial year, e.g. 1970/1971.
Use of a hyphen (-) between dates representing years, for example, 1971-1973,signifies the full period involved, including the beginning and end years.
Reference to ~tons~ indicates metric tons and to ~dollars~ ($) United statesdollars, unless otherwise stated.
Annual rates of growth or change, unless otherwise stated, refer to annualcompound rates.
Details and percentages in tables do not necessarily add to totals, because ofrounding.
Forecast magnitudes are rounded to the nearest half percentage point or halfbillion dollars.
The following abbreviations have been used:
ECOC Economic co-operation among developing countries
GATT General Agreement on Tariffs and Trade
GDP gross domestic product
GNP gross national product
OECD Organisation for Economic Co-operation.and Development
OPEC Organization of Petroleum Exporting Countries
The designations employed and the presentation of the material in thispublication do not imply the expression of any opinion whatsoever on the part ofthe Secretariat of the United Nations concerning the legal status of any country,territory, city or area or of its authorities, or concerning the delimitation ofits frontiers or boundaries.
The term ~country~ as used in the text of this report also refers, asappropriate, to territories or areas.
-vii-·

For analytical purposes, the following country classification has been used:
Centrally planned economies:
Developed market economies:
Developing countries:
China, Eastern Europe and Union of SovietSocialist Republics
North America, southern and western Europe(excluding Cyprus, Malta and Yugoslavia) ,Australia, Japan, New Zealand and South Africa
Latin America and the caribbean area, Africa(other than South Africa), Asia (excluding Chinaand Japan) and Cyprus, Malta and Yugoslavia
For particular analyses, developing countries have been subdivided into thefollowing groups:
Capital surplus countries: Brunei, Iran, Iraq, Kuwait, Libyan ArabJamahiriya, Qatar, Saudi Arabia and united ArabEmirates
Deficit countries, subdivided into the following two subgroups:
Other net energy exporters: Algeria, Angola, Bahrain, Bolivia, Congo,Ecuador, Egypt, Gabon, Indonesia, Malaysia,Mexico, Nigeria, oman, P~ru, Syrian ArabRepublic, Trinidad and Tobago, Tunisia,United Republic of Cameroon and Venezuela(in the text these countries are identifiedas the deficit energy exporters)
Net energy il!POrters: All other developing countries
The designations of country groups in the text and the tables are intendedsolely for statistical or analytical convenience and do not necessarily express ajudgement about the stage reached by a particular country or area in thedevelopment process.
-vi ii-
RECENT EXPERIENCE IN ECONOMIC CO-OPERATION AMONG DEVELOPINGCOUNTRIES AND POSSIBILITIES FOR PROGRESS IN THE 1980s
Introduction
There have been significant changes in international economic relations overthe past decade or so. A variety of efforts directed at advancing economicco-operation among developing countries (ECDC) have given rise to institutionbuilding, trade expansion, greater financial co-operation and more homogeneousinternational negotiating positions.
The present paper has two interrelated objectives. on the one hand, itassesses the impact of the global recession on the growing trade and financial tiesamong developing countries, as well as on other forms of ECDC. On the other hand,it comments on the role which policies to strengthen such relationships may have onlessening the vulnerability of the development process to the vagaries of theeconomic situation of the main industrial centres. The discussion is focused onprogrammes in the fields of trade, resource flows, technological co-operation andin a few sectoral dimensions of ECDC. The aim is to identify priorities forimmediate implementation, recognizing the particularly difficult circumstances andthe shortage of resources being experienced by developing countries at the presenttime. While institution building and enhanced c~operation to improve thebargaining power of developing countries vis-a-vis the industrial countries andtransnational corporations are very important channels for co-operation, they arenot dealt with here. 11
Recent trends in trade flows among developing countries
ECDC in its many forms has been recognized by developing countries as a majorpolicy tool to achieve self-sustained development. 2/ In pursuance of thisobjective, during the 1970s the economic ties among-developing countries werestrengthened in a number of important areas: trade and financial flows, theestablishment of infrastructure, the exchangeo£ information relevant to thefostering of stronger trade ties, and the pooling of resources in the fields oftransportation and other commercial services. However, the scope for furtheringgreater co-operation among developing economies remains vast, and the potentialeconomic benefits are still largely untapped.
Since 1970, trade among developing countries has expanded SUbstantially fasterthan total world trade, going from 3.5 per cent of world trade to about7.5 per cent. To a certain extent, this phenomenon can be explained by the morebuoyant pace of economic growth in developing countries than in other regionalgroupings of the world economy: on the one hand, demand for imports has risen morestrongly than elsewhere) on the other hand, exports of raw materials, increasinglydiverted to developing country markets, have been supplemented by a rapidly growingcapacity to produce and export manufactures competitively.
While trade among developing countries is still a relatively small proportionof their total trade flows, this proportion has been growing. As a share of thetotal exports of developing countries, intra~group trade exhibited a veryremarkable increase between 1970 and 1981, even after fuels are excluded (seetable I-I). This implies that trade among developing countries has expanded at
-1-

considerably faster rates than the exports of developing countries to other areas mainly the developed market economies.
However, when fuels are excluded, the rise in intra-group trade as aproportion of total imports has been considerably more modest. To some extent,this surprising result may reflect the fact that the value of imports from thedeveloped countries has risen faster than" the value of exports to them. ~ Whilethe share of intra-group trade in the imports of developing countries has risen,almost 85 per cent of their non-fuel imports comes from other regions.
An examination of the evolution of the share of intra-group trade in theexports of developing countries by major COmmodity group reveals some significantcharacteristics of recent developments in trade among developing countries.Table 1-2 shows these shares for trade among all developing countries and for thetrade of developing countries with non-OPEC countries for total non-fuel exports,food, raw materials and manufactures.. 'Ibese figures reveal that between 1970 and1981 the increase in the importance of intra-group trade in the exports ofdeveloping countries was stronger in food and raw materials than in manufactures,although the share of manufactured exports going to developing country markets alsorose significantly.
When trade with OPEC countries is excluded, the rise in the proportion ofintra-group trade appears to have been less impressive. While the share ofintra-group trade in food and raw materials still rose, only in the lattercommodity group was the increase significant. In manufactures, the share ofintra-group trade remained roughly constant. Up to 1978, there was an actualdecline in the share of manufactured exports going to non-OPEC countries. From1978 to 1981, both trade with OPEC countries and among non-OPEC countries rose as ashare of total exports of manufactures, but the former grew considerably morerapidly.
The evidence available is consistent with the hypothesis that most of theincrease in intra-group trade among developing countries that did take place in the1970s came about asa more or less spontaneous result of underlying trends in worldeconomic activity. 'Ibe emergence of strong growth poles in some parts of thedeveloping wo~ldhas been a powerful stimulus to trade among developing countries.Perhaps the most significant impetus to intra-group trade has come from the energyexporters. The relaxation of the foreign exchange constraint that resulted fromthe oil price increases allowed those countries to achieve rapid rates of growth intheir non-fuel sectors. Most of these countries are resource-poor. Therefore,their imports of raw materials grew rapidly. In addition, a number of moreindustrialized developing countries were in a position to supply at competitiveprices a growing number of manufactures required by the industrialization processof the energy exporters. This complex of factors led to an acceleration in thenon-fuel mutual trade of developing countries.
Another growth pole among developing countries has been the newlyindustrializing countries (e.g., the Republic of ROrea, Singapore, Hong ~ng,
Brazil, Yugoslavia). By and large, an important component of growth in thesecountries has been the rapid expansion in the exports of manufactures and highlyskilled services <construction rind engineering), mainly to the developed marketeconomies but also to developing countries. OI7er the years, these countries I
manufactures have become competitive with those of the main industrial countriesover a growing range of products (textiles, electronics,$hips, steel, some capital
-2-

Table 1-1. Percentage share of mutual trade in total exportsand total imports of developing countries
Exports ImportsIncluding Excluding Including Excluding
Year fuels fuels fuels fuels
1970 19.8 16.4 19.0 13.5
1973 21.0 21.5 21.9 15.0
1974 21.3 23.9 27.7 14.7
1978 23.6 26.5 23.6 14.4
1979 24.3 28.1 27.8 16.5
1980 24.8 30.0 29.9 16.8
1981 26.4 31.9 28.7 16.7
SOurce: Department of International Economic and Social Affairs of the unitedNations secretariat, based on united Nations Conference on Trade and Development,Handbook of International Trade and Development Statistics, and United Nations,Monthly Bulletin of Statistics.
-3-

Table 1-2. Percentage share of non-fuel trade among develping countriesin total non-fuel exports of developing countries
1970 1973 1974 1978 1979 1980 1981
Total non-fuel(excluding SITe 3)
All countries 16.4 21.5 23.9 26.5 28.1 30.0 31.9
Non-OPEC countries 17.6 18.9 19.4 20.3 22.7 23.4 23.7
Food (SI'l'C 0+1)
All countries 12.9 16.6 20.7 18.9 20.5 22.9 25.4
Non-OPEC countr ies 13.8 14.6 15.9 13.3 15.4 15.8 16.5
Raw materials (SI'l'C 2+4)
All countries 14.9 16.8 17.2 23.7 24.4 24.2 25.8
Non-OPEC countries 18.0 18.9 17.1 23.2 24.8 24.4 24.5
Manufactures(SITe 5+6+7+8-67-68)
All countries 27.0 32.2 33.1 33.9 34.7 36.9 37.3
Non-OPEC countr ie s 27.9 23.8 24.2 24.0 25.7 27.0 26.6
Source: Department of International Economic and Spcial Affairs of the unitedNations secretariat, based on United Nations, Yearbook of International TradeStatistics and Monthly Bulletin of Statistics.
-4-

goods). They have thus been able to penetrate successfully the markets of theindustrial countries and, to a growing extent, compete with exports from thedeveloped countries in developing country markets. with a few exceptions, thesecountries also tend to be resource-poor or to import key raw materials. Therefore,high rates of economic growth have been accompanied by rapidly growing imports ofprimary commodities from other developing countries.
Undoubtedly, efforts to promote intra-group trade, particularly withinregional groupings, have also played a role in the intensification of traderelations among ,developing countries. Since the late 1950s, developing countrieshave gathered considerable eXPerience with integration schemes at the regional andsubregional levels. !I If progress appears to have been slow, it has been due tothe difficulties inherent in attempting to balance the distribution of costs andbenefits of such schemes with equity in the context of wide disparities in levelsof economic development among participating countries. §I Perhaps a majorcontribution of deliberate policies to foster trade flows has been to increase theflow of information available to countries as to the possibilities for mutual gainsfrom intra-group trade.
While the difficulties of expanding mutual trade should not b~ underestimated,the potential gains from such trade are likely to be large. As shown in table 1-3,most developing countries are small in size and have low levels o~aggregate
income. Therefore, their possibilities for undertaking efficient industrializationprogrammes based on their domestic markets alone are limited. on the other hand,as a group developing countries command large potential markets. Progressiveremoval of non-policy barriers to trade (e.g., poor transportation andcommercialization networks) could yield a rapid expansion in mutual trade. FUrtherprogress could also be made by carefully evaluating the potential offered bypreferential reductions in trade barriers, in particular the non-tariff importrestrictions erected in recent years for coping with balance-of-payments problems.
Effects of the recession on trade flows among developing countries
The current recession has had a particularly adverse impact on developingcountries. Whereas during the recession of the mid-1970s developing coiJntries werebetter able to withstand the recessionary impulses emanating from the foreign tradesector, during .the current downturn their economies have been affected to a greaterdegree than those of other countries. While exports to the developed marketeconomies declined during the recession of 1974-1975, a constellation of exogenousforces stimulated an increase in mutual trade. The main factor was the sharpincrease in oil prices and the attendant surpiuses accumulated by theenergy-exporting developing countries. In spite of a small decline in the volumeof their exports, the increase in oil prices allowed these latter countries toescape the effects of the recession. Being unconstrained by balance-of-paymentsconsiderations, the energy exporters were able to raise their imports veryconsiderably. And imports from other developing countries grew apace.
-5-

Table 1-3. Frequency distribution of GOP and population ofselected developing countries, !I 1980
GOP range(billions ofS dollars)
under 1.11.1 5.0
5.1-10
10.1-20
20.1-30
30.1-50
50.1-75
75.1-125
OVer125 Total
Under 1.1 25 6 1 1 33
1.1 - 5.0 14 12 2 2 1 .1 32
5.1 - 10 1 12 6 2 1 22
10.1 - 20 7 2 1 2 2 1 15
20.1 - 30 1 1 2 2 6
30.1 - 50 1 1 1 2 2 7
50.1 - 75 1 1
75.1 - 125 1 1 1 1 4
Over 125 1 1 2
Total 40 38 13 7 6 7 7 1 3 122
Source: Department of International Economic and Social Affairs of the UnitedNations Secretariat, based on international and national sources.
!I The data refer to all developing countries that are members of the unitedNations.
-6-

A second factor was the ability of the energy-importing developing countriesgenerally, and of the rapidly growing exporters of manufactures particularly, toprotect their economies through substantial inflows of foreign capital. Flows fromthe surplus energy exporters were a major contributor. So were mediu~term creditsat modest or even negative real interest rates from the international banks. As aresult, these countries were in a position to continue to expand their imports inreal terms.
The situation has evolved in very different ways in recent years. Thefavourable initial effect on the imports of the energy-exporting countries ofhigher oil prices was gradually dissipated by sharp declines in the volume of oilexports and, beginning in 1982, by a downturn in prices. To complicate matters,most of the deficit energy exporters had borrowed heavily in international capitalmarkets in the expectation that export earnings would continue to rise steeply.When these expectations proved to be overoptimistic, international banks began tocurtail new loans to those countries and to shorten the maturity structure of debtcoming due. With the exception of the surplus countries, which are still in afairly comfortable external position, real import levels have had to be reducedsharply in most energy-exporting countries. It is estimated that the volume ofimports of the deficit energy exporters declined by about 8 per cent in 1982, and afurther drop appears to be inevitable in 1983.
In 1982 real imports also fell in the energy-importing countries, perhaps byover 5 per cent. In contrast to their experience during the mid-1970s, the energyimporters not only were unable to obtain counter-cyclical balance-of-paymentsfinancing from the international banks but they were faced with severe retrenchmentin medium-term lending and a drastic shortening of maturities. In addition, highinterest rates on floating-rate borrowing further curtailed their ability tomaintain real import levels. Thus, the adverse impact of the recession on theirexport earnings was compounded rather than alleviated by the behaviour of what hadbecome in recent years the most dynamic component of capital inflows.
The rapidly growing, more industrialized developing countries which are majorpoles of intra-group trade growth were particularly affected. These countries wereheavy borrowers in capital markets before the eruption of the crisis, and in someof them debt-servicing. ratios have reached unsustainable levels. They have hadlittle option but to curtail their import levels very significantly.
Recent information on trade flows among developing countries is still verysketchy, but it does indicate that they probably were affected to a greater extentthan were exports to the developed market economies. While the overall economicperformance of developed and developing countries did not differ markedly, withboth groups of countries experiencing slight declines in aggregate output in 1982,the decline in non-fuel import levels was sUbstanti~lly steeper in developingcountries (excluding the surplus energy exporters). The slow-down in import growthin the developed countries was mainly the result of slack demand. By contrast, indeveloping countries serious liquidity problems forced countries to adopt policiesaimed directly at curtailing imports to levels below those that would haveprevailed under already very sluggish overall demand conditions. Moreover, twogroups of countries which, together with the surplus energy exporters, hitherto hadbeen the main poles of intra-group trade growth - namely, the deficit energyexporters and the newly industrializing countries - had to reduce their importlevels to a greater extent than did other developing countries. Finally, the
-7-

environment of uncertainty caused by the import policies which most developingcountries were forced to adopt were not conducive to normal trading relationships.
Another factor which appears to have had an adverse impact on trade flowsamong developing countries is the drying up of financial flows, which indirectlyaffected the ability of developing countries to grant trade credits to each other.There is scattered evidence that the drying up of export credits had a furtherdampening effect on trade flows among developing countries.
Measures to be taken to enhance economic co-operationamong developing countries
In this section, some measures to promOte economic co-operation amongdeveloping countries will be outlined. Because of the gravity of the presenteconomic situation, attention has been focused on those measures that are likely toinvolve little financial expense but should lead to positive results in the shortto medium term.
Economic co-operation among developing countries and commercial policies ofdeveloping countries
Actions to promote an expansion of the mutual trade of the developingcountries could concentrate on two goals: the gradual reduction of trade barrierson a preferential basis, and the realization of within-group t~ade possibilitiesthat are currently not being exploited for lack of information, traditionalcommercial ties or other reasons.
The level of import levies and non-tariff trade restrictions that thedeveloping countries maintain is one area that needs to be evaluated properly witha view to enhancing the potential for intra-group trade expansion. In spite ofmany different attempts to integrate selected developing country markets, theoverall level of import restrictions in the group as a whole has not fallen duringthe past two decades or so - more probably the reverse. Moreover, overalleffective rates of protection tend to be higher in developing than in developedcountries, which discourages intra-group trade and tends to accentuate thedependence of developing country exports on the markets of the developedcountries. Items that an individual country is in a posttion to produce, which mayoften be the products that other developing countries find most suitable as foreignexchange ea~ners, are typically protected most.
During the current global economic. slow-down, the developing countries havelevied incremental trade restrictions closely paralleling the timing and pattern oftheir payments crises. The newly imposed import restraints encompass a widevariety of forms. They range from tariffs, import surcharges, prior importdeposits and quantitative restrictions to outright import prohibitions. In somecases, these measures have been accompanied by sharp devaluations. While in someinstances the recent measures to restrain imports have excluded preferential tradearrangements enacted in the context of formal integration schemes, they havegenerally had an adverse impact on mutual trade. In particular, devaluations ofvarying magnitudes in real terms have disrupted established patterns of comparativeadvantage.
-8-
The existence of significant barriers to trade among developing countriesindicates that joint policies to reduce tariffs and non-tariff measures couldprovide a very important stimulus to mutual trade. In the context of the currentsituation, the gains made in intensifying trading relations among developingcountries in the past decade or so could be protected if countries exempted theirtrade with other developing countries from the import restrictions that they areforced to impOse to protect their external payments positions. Since for mostcountries imports from developing countries are still a small proportion of totalimports, the overall balance-of-payments effects of such measures would probably besmall. And if a sUfficiently large number of developing countries adopted the samepolicies, expor~ levels would be larger all around.
Measures in the field of group-wide trade
Three important measures that have recently been in the centre of policyattention and that would promote the reduction of trade barriers and the expansionand diversification of trade are the establishment of a global system of tradepreferences among developing countries (GSTP), co-operation among state tradingorganizations, and the development of a trade information system. These alsofigure prominently on the agenda ·for negotiations about trade measures to be heldin the near future.
The first major attempt to promote trade among all developing countries on theprinciple of mutuality of advantages was the General Agreement on Tariffs and Trade(GATT) protocol of 1973, which provides for an exchange of tariff concessions amongsignatories (in the end 14 developing countries signed). The global system oftrade preferences will then be the second major attempt and will include provisionsfor special treatment in favour of exports from the least developed countries. Itis to be accomplished by a parallel strengthening of the integration efforts of thedeveloping countries and will take into account the different levels of economicand industrial development, trade patterns and trade regimes of individualdeveloping countries. unlike most prior attempts at global preferential tradearrangements, the global system of trade preferences is slated to apply not only tomanufactures but also to primary commodities and agricultural products in their rawand processed forms. Furthermore, commercial policy initiatives will not beconfined to tariff concessions but will also cover non-tariff barriers and willprogressively incorporate other measures in the fields of production, marketing,payments, finance and transport. The negotiations are to proceed step by step,with the first phase due to commence in May 1983. The global system of tradepreferences is planned to be in place by the end of 1985.
The positive trade effects from the scheme could be substantial since tariffsand non-tariff restraints to trade are generally higher in developing than indeveloped countries and, as previously mentioned, they also tend to discriminate,at least implicitly, against each other's exports. Trade expansion in turn couldbuttress the further diversification of production structures and advance thegrowing complementarities among developing countries. Special provisions forcountries at different levels of development could provide the differentiatedsafeguards whose absence in earlier attempts to institute group-wide tariffconcessions may have deterred a number of countries from participating voluntar,ily.
Since the various components 'of the global system of trade preferences are asyet to bQ negotiated, it is too early to evaluate the potential of individualmeasures. However, it is clear that trade liberalization in the developing
-9-
countries should not be limited to tariff cuts. As earlier attempts havedemonstrated, tariff concessions can have a very considerable impact on the fiscalsolidity of developing countries, many of which rely on trade taxes for the bulk ofgovernment revenues. Given their already strained fiscal positions, further tariffreductions can only be undertaken, at least in the short run, if combined with ameasurable shift in government revenues.&; In addition, the benefits ofcommercial policy concessions have in the past been perceived to be distributeddisproportionately among participants. The negotiations might ther~fore includethe formulation of a mechanism that would yield a more equitable distribution ofthe costs and benefits of commercial policy arrangements.
Even if substantial tariff reductions were to be put in place, there are otherimportant non-tariff obstacles to within-group trade. The latter are common indeveloping countries and in recent years have been resorted to more often.Therefore, the most important target for trade liberalization would appear to bethe gradual elimination of non-tariff barriers. Other barriers to within-grouptrade include the absence of established trade tiesJ lack of infrastructure,transportation facilities and marketing skillsJ sketchy information about exportcapacities and import needsJ lack of standardizationJ and the small scale ofindividual markets.
It is clearly important that the framework of the global syste~of tradepreferences be conceived on the basis of outward-looking commercial policies thatpermit the exploitation of intra-industry specialization. Co-operation among statetrading organizations and the creation of an effective trade information systemcould contribute significantly to these goals. One way in which the interrelationsbetween state trading organizations and a trade information system could beusefully enhanced in the near future would be through the creation of acomprehensive information system dealing with government procurements, thestandardization of both procurement invitation and actual tender documents, thefast transmission of the information to all centres potentially interested inbidding, 1/ agreement on the legal adjudication of apparent breach of contracts, !Iand similar measures. More comprehensive and timely information might provide onerelatively uncomplicated means towards promoting collaboration not only throughtrade creation but also through trade diversion from the developed to thedeveloping countries for products in which some developing countries have alreadyacquired a pronounced comparative advantage.
Institutional developments and regional integration
The need to establish institutions that can assist developing countriescollectively to expand the information flows, communications and infrastructureessential for their economic and social development has been recognized for manyyears. Indeed, many institutions have already been created at the regional andsubregional level by developing countries in connection with integration schemes,preferential trade arrangements, joint ventures, information and communicationlinks, collaboratibn in infrastructural networks, multilateral marketing andproduction enterprises, and the like. However, the current global economic crisishas slowed down the progress of integration schemes already in place and may havecomplicated the negotiation of new integration arrangements. Most importantly, theexport-promotion and import-restraining measures introduced in the past few yearsby developing countries have included steps that violate the spirit, if notnecessarily the letter, of existing integration treaties. In particular, theexternal payments problems that most countries have had to face in recent years
-10-
may have persuaded them to avoid any commitments that might restrict their freedomof action and even to opt out of existing commitments. Therefore, flexibility inexisting and prospective integration mechanisms is a very important objective - incontrast with the rather rigid time limits and pre-set goals contained in themajority of the integration treaties negotiated in the 1960s.
One way of coping with the prevailing difficulties would appear to be to focuson achieving a proper balance in the role of the State and the market inintegration measures. !I Market-based decision-making criteria appear to be lesswell designed to suit the needs of the majority of developing countries, whosenational markets are generally neither well integrated nor predominantly regulatedby market-based policy instruments.
One avenue would be to create room for adjusting traditional integrationconcepts to the specific economic conditions and requirements of the participants.Such modifications in integration schemes have gained in popularity since thesecond half of the 1970s. Instead of adhering to rigid timetables for linearcustoms preferences, the focus of policy attention has been increasingly directedat finding flexible and manageable preferential trade objectives and targets oftengoing well beyond the purely commercial approach originally adopted. Significantactions have been taken outside the conventional domain of commercial policies insuch sectors as transportation, communication, information, energy, money, financeand others. In the process, a number of these schemes have incorporated newmeasures aimed at improving the overall effectiveness of the integration processesand bringing about a more balanced distribution of their benefits and costs.
Institutional co-operation should not be restricted to comprehensive,all-round integration schemes. Some developing countries could benefi t from theestablishment and operation of much more target-orientated institutions at a lowerhierarchical level. Fbr example, joint ventures could provide a more direct andefficient way of achieving the expansion of production and integration in selectedsectors. In the past some problems have emerged in the establishment and operationof joint ventures in integration groupings, as well as in the identification ofopportunities for joint investments. careful study of these problems, greaterflexibility in devising and applying joint ventures, more intensive work on projectidentification activities, and clear-cut financial support for joint undertakingsagreed upon may in the end prove to be effective means of enhancing the performanceof integration groupings.
Financial and monetary co-operation
The pace of economic activity and the implementation of effective economicpolicies to assure steady economic progress have recently been severely buffeted byprevailing international financial problems. These have led to a virtual halt innet medium- and long-term commercial capital flows to many developing countries.Others never enjoyed significant access to these resources in the first place.Many relied heavily on the highly concessional multilateral resources for which theoutlook has become so uncertain of late. Especially in the context of these recentdevelopments, the inadequacy of global efforts to transfer resources fordevelopment is quite clear.
-11-

Financial transfers among developing countries cannot overcome the deficiencyin resource transfers on a global scale. Most developing countries are and willcontinue to be net importers of capital. This notwithstanding, a substantialdegree of financial co-operation among developing countries arose in the 1970s.Indeed, subregional and regional monetary and financial co-operation has progressedto the point where most developing countries belong to one or several of thefollowing types of institutional arrangements: subregional clearing arrangements,credit support schemes, monetary unions, development banks and loan guaranteefundsl they may also participate in joint investment companies. Moreover, somegroupings have recently adopted measures to facilitate financial participation injoint programmes and enterprises, while others have sought to strengthen theinstruments at their disposal in support of balance-of-payments financing. '!besepast efforts can provide a base on which financial co-operation can be deepened incoming years.
Most prominently, OPEC member countries became a major source of concessionalresource flows to other developing countries. ~ From net disbursements in 1970of about $400 million, OPEC aid flows rose to well over $9 billion ten yearslater. In terms of one common measure of aid effort, the share of the donor'sgross national product (GNP) devoted to concessional assistance, OPEC aid has beenconsistently high. It has exceeded 1 per cent of GNP throughout the 1970s and intothe 1980s. For the period 1976 to 1980, the OPEC aid effort. by this measure,averaging over 2 per cent of their GNP, was far greater than the comparable .ratiofor the developed market and centrally planned economies. .. .
}i)wever, the trend in OPEC aid has recently been declining. '!be exportearnings on which OPEC countries counted to finance their aid programme have beensharply constrained as a consequence of the weakening world petroleum market andOPEC's decision to curtail sharply its own oil production. !!I Furthermore, thecontinuing and costly war between two OPEC members has brought about, as one sideeffect, a further reduction in available OPEC economic assistance to otherdeveloping countries.
The evolution of international financial co-operation among the developingcountries has also had a significant institutional dimension. Initially, mostfinancial recycling among developing countries was mediated by privateinstitutions - primarily commercial banks based in a small number of developedmarket economies - or by long-established official institutions of theinternational community. In recent years, however, new financial institutions havebeen created by the developing countries themselves.
Prominent among these are the OPEC Fund for International Development, whichwas founded as the OPEC Special Fund in 1976 and which approved loans of nearly$900 million in 1982, a number of multilateral Arab official development financeinstitutions, and some individual country funds which disburse both concessionaland non-eoncessional resources. Of a related nature has been the transfer ofresources under the 198Q San Jos~ Agreement, according to which Venezuela andMexico extended concessional loans in their region. As vehicles for someredistribution of high oil-export earnings to non-oil developing countries, some ofthese resource transfer mechanisms have proved vulnerable to the fall in oil-exportearnings.
, Other developing country financial institutions which have been created overthe past two decades are joint financial intermediaries. Some emphasize long-term
-12-

investment pcojects, while others are more oriented towards facilitating tradeflows among participating countries. Some are bilateral and others multilateral.In many of them private capital is predominant, while others are of a semi-publicor public character". Some focus on direct lending for projects, while othersspecialize "in assembling and participating in financial packages for borrowers.Some of the latter were formed as ·consortium banks·, having equity participationof both developed and developing country banks. Others were always or have becomesolely joint ventures of developing country institutions. TWo of the latter, eachowned by groups of Arab country institutions, ranked among the 40 most activeint~rnational lending banks in 1982. ~
As financial intermediaries, the joint developing country commercial, merchantand development banks are not necessarily dependent on high oil earnings as asource of funds. None the less, the global recession, the fall in internationalliquidity, and partiCUlarly, the precarious international reserve position of manyhost developing countries have seriously affected many of these banks. In somecases, their operations have been curtailed substantially. In spite of thesedevelopments, the crucial importance of the institution-building that has takenplace in recent years should not be underestimated. There is a significantpotential for rapid growth, partiCUlarly when the acute balance-of-paymentsdifficulties in many of these countries is solved. Besides, to differin~ d~grees,
these banks can mobilize funds from different parts of the globe for on-lending tofinalusers. Indeed, more and more of these developing country institutions may beexpected to tap the global capital pool, especially through regional financialcentres in the caribbean, the Persian Gulf and the Far East. with appropriateencouragement, some may reach the stage of further increasing the flow of financialresources to developing countries by arranging co-financing on the strength oftheir own reputations as development finance institutions.
The more experience developing country joint financial institutions gatherfrom operating in the international capital markets, the more they can be looked tofor timely innovations which would broaden the kinds of projects and the number ofcountries with access to the market. Innovations originating with developingcountry participants in the market are more likely to meet the needs of developingcountries than are innovations originating elsewhere.
The operations of existing financial institutions in developing countriesshould be re-assessed to see whether a move towards more medium-term programmelending and greater emphasis on pcomoting development plans in setting loanconditions would help make them more responsive to member country needs. Somesuggestions have also been made that developing countries set up their own officialmultilateral financial institutions to provide" both development assistance andbalance~f-paymentsfinancing. W
Sectoral co-operation among developing countries
FOstering trade and financial links among developing countries has clearly thehighest priority. However, there are many other ways in which the links among thedeveloping countries are being strengthened, and some of these will be discussed inthe concluding section of the paper. Some of the sectoral projects that will bediscussed - such as joint exploration of natural resources or co-operation inagricultural research - are justified in their own right. They do, though, havegreat potential for advancing the development objectives of the developing
-13-

countries as a group and so can properly be considered to fall within the purviewof Eeoc. It should be pointed out that the scope for sectoral co-operation isgreat and will expand as more experience is gained. The present paper can onlycover a small number of possible avenues for co-operation.
Labour migration
An important aspect of intensified economic links among developing countriesduring the 1970s was the large movement of labour within the group, butparticularly into the rapidly expanding economies of the energy-exportingdeveloping countries. Labour movements contributed importantly to economicprosperity in the host countries. In many cases~ the home country also gained fromexpatriate remittances, which provided crucial balance-of-payrnents support. Therecent sharp scaling down of industrialization efforts in these growth poles doesnot augur well for the immediate future of labour mobility among developingcountriesJ it may also further aggravate the external payments problems of a numberof deficit developing countries. Indeed, the return of a large number of migrantworkers to their homes in Western Africa in early 1983 provides a vividillustration of the adverse economic as well as human repercussions of the recentdifficulties caused indirectly by the global economic recession.
Aside from the immediate needs that stem from the adverse eff~cts of reversemigrant flows on home countries, an important aspect of migration in th~ medium- tolong-term could be its streamlining. This could be undertaken not only in order tominimize the other adverse aspects of relative job uncertainty in host countries.Given the pronounced differences in the relative scarcity of skilled as well asunskilled labour in the various developing countries, a concerted effort tosynchronize migration policies with the willingness and ability of host countriesto provide jobs with some modicum of social security could become an important formof co-operation.
Water resources and river-basin development
The management of water resources necessarily has an internationalperspective, if only because no fewer than 57 river basins or lakes in Africa,40 in Asia and 36 in South America are shared by two or more countries.
There are already some important instances of co-operation in developing waterresources that have yielded sizeable mutual benefits. The recently inauguratedItaipu project between Brazil and Paraguay and the older Indus River co-operationbetween India and Pakistan are prominent examples. The continent of Africapresents the greatest opportunity for further co-operation because of the magnitudeof its water resources, the urgent needs of African countries to improve theirirrigation facilities and the rising demand for energy that accompanies the processof industrialization. The development of these water resources will also permitthe exploitation of the region's mineral resources and will improve rivernavigation. An important joint project has been launched by Mali, Mauritania andsenegal with financial assistance from KUwait and saudi Arabia. There are clearlya number of such opportunities whose exploration depends on co-operation with otherdeveloping countries, as well as on appropriate financial and technical supportfrom developed countries and international organizations.
-14-
In view of the magnitude of many water resources and their potential forlinkages with river-basin or industrial development programmes, the capitalresources needed for building the required dams, power stations and ancillaryinfrastructure and for start-up of selected production projects are large. Theseprojects are therefore particularly suited to the pooling of resources of severalcountries.
This is especially the case as the viability of many large power projectsoften 'depends upon the assurance of demand from user industries, particularly fromindustrial and mineral treatment plants. At present, the market for raw materialsis weak and developed ,economies have shown considerable reluctance to help financeplants, such as smelters, in developing countries that would compete with their ownindustries. Closer economic co-operation among developing countries regardingpower supplies could then be usefully extended to include the financing of suchplants by other developing countries that need the raw materials. This would helpassure the viability of a number of hydro-projects.
FOod and agriculture
Largely because of the rapid growth in population and urbanization over thepast two decades or so, the situation of the food-deficit developing countries isprecarious. In some cases, sub-Saharan Africa in particular, food production andsupportable food import levels have fallen below nutritional requirements.
While food aid on the part of developed countries has helped to avertdisasters, it has become clear that th~s cannot make up for the overall poorperformance of agriculture in some developing regions~ Production shortages willhave to be increasingly made up by food imports on commercial terms. These haverecently posed a significant drain on the already scarce foreign exchange reservesof the majority of food-deficit developing countries.
There is, then, every reason for the developing countries to step up theirmutual trade in foodstuffs and to accelerate their co-operation in agriculture,fishery and forestry. Unfortunately, in the past these have usually been treatedas comparatively low-priority areas for co-operation. At the very least, a furtherexpansion of within-group trade in food products is needed to provide alternativesources of supply and thus enhance the collective food security of the developingcountries. The provision of greater market access for the least developedcountries witPin the group is of particular importance in this respect.
What is also urgently required is a clearer commitment to raising productivitylevels and securing the proper exploitation of available arable land. This shouldcome through a combination of domestic resources and foreign assistance, the lattercoming from developing as well as from developed countries. primary responsibilityfor achieving this objective rests with individual countries. However, it isalarming that funding for international research programmes dealing withagriculture has grown very slowly in the past two to three years, in sharp contrastto the six-fold increase experienced between 1972 and 1980. In real terms, thereprobably has been a decline in funding. Local efforts are unlikely to offset thisreduction. This may have severe consequences for the least developed countries,which do not possess effective national research institutes.
-15-

Most of the world's agricultural research is conducted in the developedeconomies. Funds spent in Africa, Asia and Latin America account for only a fourthof global spending. Developing countries that share the same environmentalcharacteristics can therefore usefully co-operate in sharing the results of theirresearch or their agricultural experience. The projects might be modest inthemselves but could have very important long-term results. Aside from a number ofsmall-scale practical projects, agricultural research has been co-ordinated by theConsultati\1eGroup on International Agricultural Research. It supportsl3 researchinstitutions, of which 10 are in developing countries, using funds provided by35 contributing members. They have specialized in research ofpracticalneedtdtheir areas but which can be applied in other countries. 'ale results in terms ofyields and total output levels of staples, including food crops such as sorghum,millet, cassava and legumes, have been impressive in a number of countries.
An issue of importance to food-deficit countries is the security of their foodsupplies. 'alishas provided the basis for co-operation between the oil-exportingcountries of the Middle East and other developing countries. In many cases thefunds are not specifically designated for agricultural development but rather forinfrastructure, yet the latter can be decisive in making possible agriculturaldevelopment in countries that have the potential to produce food but not the meansto bring it to national or world markets. The Arab Fund for Economic and SocialDevelopment has assisted the development of agriculture and infrastructure in Arabcountrie.s. Arab resources have also gone to develop agriculture inPaJdstan.
Co-operation measures need not just facilitate national etforts) global,regional and subregional efforts among developing countries could be channeled intoaddressing conunon problems, such as averting food losses through the building ofproper storage and processing facilities or creating greater food security throughthe joint funding of buffer stocks. Perhaps the most vital initiative that couldhave a sizeablepa~off in the medium run would be in the form of increased sharingof skills and experience in modern and appropriate agricultural, forestry, andfishery technologies. TWo l.inked problems that are particularly serious indeveloping countries are those of deforestation and desertification. Developingcountries could usefully learn from each other how to avoid and, if possible, howto reverse. these trends. In this regard, several United Nations organizations arein:l!l position to intendfy their support. ofECDCactivities.
Energy co-operation
The scope for energy co-operation among developing countries merits closeattention. On the one hand, energy proPucts constitute the bulk of trade amongvarious regional groups andenerg~related issues still need to be addressed on apriority basis in order to relieve the present adverse economic and financialsituation in the energy-importing developing countries. On the other hand,co-operation both in conventional energy sources and in new and renewable energysources (especially the generation of hydro-electric power) is also importantbecause it stands out as ·one form of co-operation in which significant progress hasalready been achieved and for which the potential for intensifying fruitfulcollaboration in the future appears to be still considerable. 'ale acceleration ofindustrialization and the steady improvement of levels of living In the developingcountdes.willrequire ·arelativelyfast expansion of' commercial; efiergycdnsumptfonfrom its currently rather small base. These countries clearly have the capacity todo so. While the developing countries as a group have roughly 78 per cent of theworld's proven reserves of oil, 42 per cent of those of gas and 10 per cent of
-16-
those of coal, these shares contrast with the much smaller shares in global outputlevels I about 50 per cent for oil, 13 per cent for gas and 5 per cent for coal.
The possibilities of increasing co-operation in the field of energy arepromising .. , 'lbey range over the broad spectrum of financing, sharing of explorationand production risks, integration of markets, transfer of technicai know-how andstrengthening of trading arrangements, including the creation of upstream anddownstream linkages. However, the activation of this potential for collaborationis a complex task involving a judicious mixture of policy measures at variouslevels. Furthermore, the measures pertaining to non-renewable energy resourcesneed to be based on sound economic considerations that take into account theinterests of the producer countries, whose economic fortunes are heavily dependenton their exhaustible energy resources. Especially important is the formulation ofpoliqy measures to support a smooth transition towards a more balanced world energysupply mix that would utilize the relatively scarce energy resources, such as oiland natural gas, chiefly for purposes for which the other energy sourcesintrinsically are not suited.
Co-operation in minerals
Developing countries are both large producers and consumers of non-fuelminerals. Many rely upon a very small number of minerals for the bulk of theirexport earnings and have recently experienced severe hardship because of weakdemand and historically very low prices for their commodity exports. Theytherefore have a clear interest in co-operating with other developing countryproducers, if only to maintain satisfactory prices. However, as distinct from thesituation in fuels, in no market, with the possible exception of tin, do thedeveloping countries as a group have a sizeable degree of control over productionor exports. Input substitution in production processes and sizeable productionlevels in developed economy producer s make it unlikely tha t the developingcountries will be able to affect world markets significantly to their own benefitby altering their supply levels within feasible ranges.
In more modest ways, though, the developing countries can co-operate in thefield of minerals. Information-sharing is one very important aSPeCt. producingcountries, especially producers of such raw materials as bauxite, as distinct fromaluminium or copper, whose prices are not determined in international commodityexchanges, can reveal to other producers the prices and conditions of sale they areobtaining from developed country importers so that the producers can strengthentheir bargaining position. Producers and consumers can exchange information on newuses for their products, especially those that are most suitable for adoption byother developing countries. The demand of developing countries for non-fuel rawmaterials has expanded much more rapidly than that of the developed economies, andany steps taken to promote consumption in these countries and hence to firm futuredemand for their minerals could help re-assure producers of minerals in developingcountries of the viability of present and future projects.
'lbe technology involved in the production of most minerals is well-known, andthere is little question of developing countries being able to share with otherpotential producers otherwise unknown technologies. However, several verypromising mineral deposits lie in developing countries that have had no experiencewith the minerals in question. There is therefore scope for providing advice andtechnical support.
-17-
Obtaining the capital to open up a new mine is often very difficult. This isespecially the case at the present time of oversupply in almost all mineralmarkets, which has led to a widespread re-assessment of the viability ofprospective mines. It was previously thought that the major oil companies in thedeveloped market economies and the energy-exporting developing countries mightaugment more traditional sources of capital and provide much of the new capitalrequired. This no longer seems the case since both of these groups have abandonedseveral large ventures.
Where the developing countries can help is in providing an assured market forthe minerals of other developing countries, perhaps in the form of medium- tolong-term contractual delivery agreements at more predictable prices than thoseobserved in commodity exchanges. This would help to attract the capital required,even if the consuming country did not provide it directly. Already some of thecapital-surplus energy exporters have set up treatment plants in" their owncountries to process the ores from projects they are cQ-financing in otherdeveloping countries, and these are providing assured future markets. It should beadded that these consuming countries have also contracted to take supplies fromdeveloped market economy exporters, such as Australia, and that developing countryproducers will have to be able to offer competitive terms.
Much of the final cost of some minerals is the shipping cost. There is scopefor further co-operation among developing countries, especially those that aregeographically close, to join together in bargaining with shippers so as to obtainthe most favourable rates.
Finally, the viability of mining ventures often depends upon the provision ofcompetitively priced electric power and adequate transportation facilities. Wheredeveloping countries co-operate to provide this infrastructure, this enhances theattractiveness of their deposits.
Technological co-operation among developing countries
Most of the new technology used by developing countries originates in thedeveloped countries. Co-operation among the developing countries in theassimilation stage of the transmission of information is essential, owing to thefact that there are economies of scale to be reaped from sharing efforts. Goingfurther, there is also considerable scope for developing countries to pool theirefforts in undertaking new technological and scientific research.
One important activity in this area of technological co-operation is the setof programmes dealing in technical co-operation among developing countries. Afterthe United Nations Conference on Technical Co-operation among Developing Countries(Buenos Aires, 30 August-l2 september 1978), a new thrust was given to this form ofco-operation among developing countries. with financial resources from the UnitedNations Development Programme (UNDP), technical co-operation increasedSUbstantially in scope and depth. However, as has been the case with other UNDPprogrammes, it has been significantly affected by budget restrictions, andprogrammes have recently had to be revised downwards. The weakness of thefinancial linkage p£oved again to be decisive in the potential for growth in thisarea• .!y
-18-

Because of the limited resources available for technological co-operation,resources should be diverted to areas likely to generate tangible results in acomparatively brief period of time. For many countries, one priority area WQJ ld beagricultural and food production and agro-industry in general. Raisingproductivity and reducing the sector's vulnerability to climatic conditions andother natural Plenomena would be the object of much of the work. Another priorityare~ would be increasing the shares of domestic val ue added in. the exports of thedeveloping countries. At the national as well as the subregional, regional andglobal level, the processing of the primary products of the agriculture, fishery,forestry and mining, industries could often be taken further.
Notes
Y This topic was discussed at the eighteenth session of the Conmd ttee forDevelopment Planning. The Committee's conclusions and recommendations appear inWorld Economic Recovery - The Priority of International Monetary and FinancialCo-operation (Uhited Nations publications, Sales No. E.82.II.C.3).
y SOme key documents embodying this recognition are the AruSha Programmefor Collective Self-Reliance (see Proceedings of the united Nations Conference onTrade and Development, Fifth Session, vol. I, Report and Annexes (tbited Nationspublication, sales No. E.79 .II.D.14), annex VI), the caracas Programme of J\ction(A/36/333 and Corr.l, annex), the Ec~nomic Declaration adopted by the SeventhConference of Beads of State or Government of Non-Aligned Countries(A/38/l32~/1567Sand Corr.l*, chap.III), and the recommendations emanating fromthe Fifth Ministerial Meeting of the Group of 77 (see wThe Buenos Aires Platformw(TD/285) , p. 69).
y Letting T represent intra-group trade, Xd exports to developedeconomies, and ~ imports from developed economies, the shares of intra-grouptrade in developing country exports (Tx) and imports (Tm) are
Tx = _.....;;;.T _
T + Xd
The necessary condition for Tx to rise faster than Tm is for Md to grow fasterthan Xci. This clearly has been the case since 1970. Although complete factualevidence is not available, there are reasons to believe that both volume and priceeffects were at work. tIllle developing country eltports to the developed economiesare still dominated by primary commodities, their imports from the industrialcentres are mostly manufactures, which have a substantially higher incomeelasticity of demand. The combination of faster rates of economic growth andhigher income elasticities in developing than in developed countries has given riseto substantially faster increases in the import volumes of the former. Moreover,when fuels are excluded, the terms of trade of developing countries vis-A-vis thedeveloped market economies have deteriorated sharply since 1970.
-19-

!I FOr a review and analysis of such schemes, see "salient features ofeconomic co-operation among developing countries", Journal of Development Planning,No. 13 (united Nations publication, sales No. E.78.II.A.9), pp. 1-72.
EI see report of the Conunittee for Development Planning on its fourteenthsession (Official Records of the Economic and Social Oouncil,SUpplement No.6)(E/1978/46 and Corr.l), pp. 16-21, and G. salgado, "Viable integration and theeconomic co-operation problems of the developing world", Journal of DevelopmentPlanning, No. 13 ••• , pp. 73-122.
!I The trade-creating effect of tariff cuts could conceivably outweigh theimpact of fiscal revenue loss per unit of trade value. However, the trade stimuluswould emerge only over time, and there would therefore be at least temporarilyadverse effects on government revenues.
11 The experiences gathered with preferential government tenders in thecontext of the Association of South-East Asian Nations (ASEAN) may be of widerinterest to developing countries. see "Measures for strengthening economicintegration and co-operation among developing countries at the subregional,regional and interregional level" (UNCTAO/ST/ECDC/17), p. 7.
8/ The desirability of creating international courts of developing countriesextends far beyond the spheres indicated here. They could playa most constructiverole in interpreting co-operation treaties, in settling disputes among participantsin integration schemes and in enforcing the passing through of internationalagreements in national legislation.
21 For a more comprehensive analysis of the importance of actions at thestate and inter-state level, see R. Ffrench-Davis, "COmparative advantage,efficiency and equity in collective self-reliant industrialization", in FOr Good orEVil -:Ek:onomic Theory and North-South Negotiations, G. K. Helleiner, ed. (Oslo,universitetsforlaget, and ~ronto, Oniversityof TOronto Press, 1982), pp. 101-118.
1Q/ Data on OPEC aid are drawn from the statistics compiled by the OECDsecretariat from official sources submitted to OECD and estimates, as published inOECD, Development CO-operation, 1982 Review (Paris, 1982) and Aid from OPECCountries (Paris, 1983).
1JI see World Economic Survey 1983 (E/1983/42, to be'issued as a unitedNations sales pUblication) , pp. 99-102.
~ Euromoney, April 1983•
.!y Some of these proposals were first made in the Ar,usha Programme forCollective self-Reliance, they were discussed in particular at the Group of 77expert group meeting on ECDC finance in Kingston, 26-31 March 1982. FOr thereport, see Gover~ent of India, Ministry of External Affairs, Eeoc Handbook Documents of the Movement of Non-Aligned Countries and the Group of 77 (New Delhi,1983) , pp. 329-339.
1!1 It is important to note, however, that some developing country funds arebecoming increasingly active in financing technical co-operation among developingcountries. The Kuwait Fund for Arab Economic Development is a case in point.
-20-

A NOI'E ON SOME EFFECTS OF RISING PUBLIC EXPENDITUREIN DEVELOPED MARKET EWNOMIES
Among the reaSons sometimes advanced as contributing to the deterioration ineconomic performance of the developed market economies since the mid-1970s is therising shar~ of public expenditure in the total national expenditure. Adverseeffects on the .incentive to work, on private saving and on investment have beenidentified by various commentators as following, directly or indirectly, from thisincrease~ These effects are seen to ensue from the rising transfer payments, thegrowing tax burdens and, more recently the increasing budget deficits which haveall been associ~ted with the increase in pUblic expenditure. Various attempts havebeen made to assess the validity of these contentions, and the present notesummarizes the results of those studies.
Size and structure of public expenditure
The facts about the rising share of public expenditure may first be brieflyrecalled. Table II-I presents data on the size and composition of publicexpenditure in eight developed market economies between 1967 and 1982. 11 The moststrikinganllconsistent feature is the significant increase in public expenditureas a 'percentage of gross domestic product (GDP) in every country under study. "Theincrease was led· by SWeden, where the percentage increased by more than 20 pointsbetween 1967 and 1982, at which time it was approximately 62 per cent. During thesame period the United States of America registered the smallest increase approximately 6 percentage points - and in 1982 the ratio of pUblic expenditure toGDP was approximately 38 per cent. Ql1y Japan, with 34 per cent, had a smallerratio than the United States.
-21-
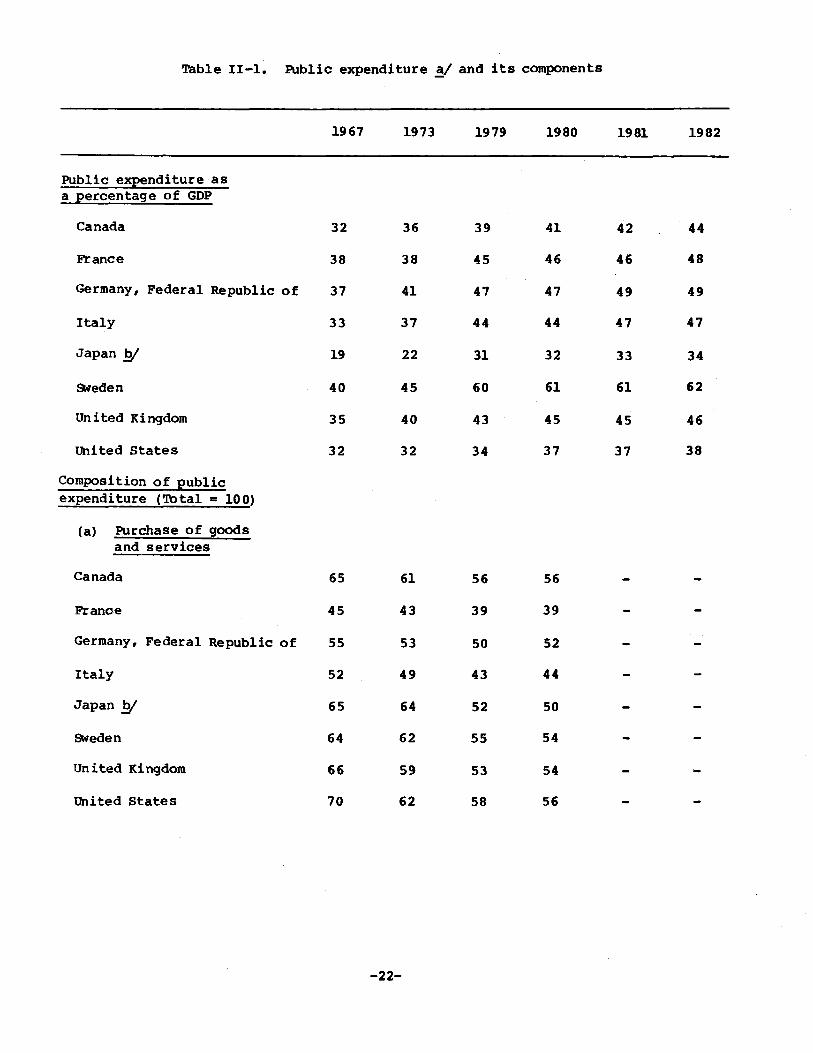
Table II-I. Public expenditure ~/ and its components
1967 1973 1979 1980 1981 1982
Public expenditure asa percentage of GDP
Canada 32 36 39 41 42 44
France 38 38 45 46 46 48
Germany, Federal Republic of 37 41 47 47 49 49
Italy 33 37 44 44 47 47
Japan .!?I 19 22 31 32 33 34
Sweden 40 45 60 61 61 62
Un i ted Ki ngdom 35 40 43 45 45 46
United States 32 32 34 37 37 38
Composition of publicexpenditure (Tbta1 = 100)
(a) Purchase of goodsand services
Canada 65 61 56 56
Franoe 45 43 39 39
Germany, Federal Republic of 55 53 50 52
Italy 52 49 43 44
Japan .!?I 65 64 52 50
Sweden 64 62 55 54
United Kingdom 66 S9 S3 S4
United States 70 62 58 S6
-22-
1967 1973 1979 1980 1981 1982
(b) Social security andassistance grants
Canada 21 25 27 27
France 39 41 46 48
Germany, Federal Republic of 31 27 29 30
Italy 37 37 36 36
Japan .!Y 24 24 32 32
Sweden 23 25 29 28
United Kingdom 21 21 24 24
Uni ted states 20 28 31 31
(c) Subsidies
Canada 3 2 4 4
France 6 4 4 4
Germany, Federal Republic of 3 4 4 4
Italy 4 4 6 5
.Tapan .!Y 4 5 4 4
Sweden 4 4 7 7
United Kingdom 6 5 5 5
United states 2 1 1 1
-23-

1967
(d) Interest payments and othercurrent disbursements,capital transfers and netpurchases of land andintangible assets
1973 1979 1980 1981 1982
Canada 11
France 10
Germany, Federal Republic of 11
Italy 7
Japan EI 7
SWeden 9
United Kingdom 7
United States 8
12 13 13
12 11 9
16 17 14
10 15 15
7 12 14
9 9 11
15 18 17
9 11 '12
SOurces: Statistical Office of the United Nations, National AccountsStatistics, and Organisation for Economic Co-operation and Development, NationalAccounts, 1982, vol. II, for most years prior to 1980, and for recent-yearestimates, Organisation for Economic Co-operation and Development, EconomicOUtlook, December 1982, and United States Department of Commerce, Survey of CurrentBusiness.
!I Public expenditure is used here to denote general government expenditurerather than that of the public sector I which includes both generalg()'Vernment andpublic enterprises.
EI Data prior to 1970 are estimates, owing to definitional changes.
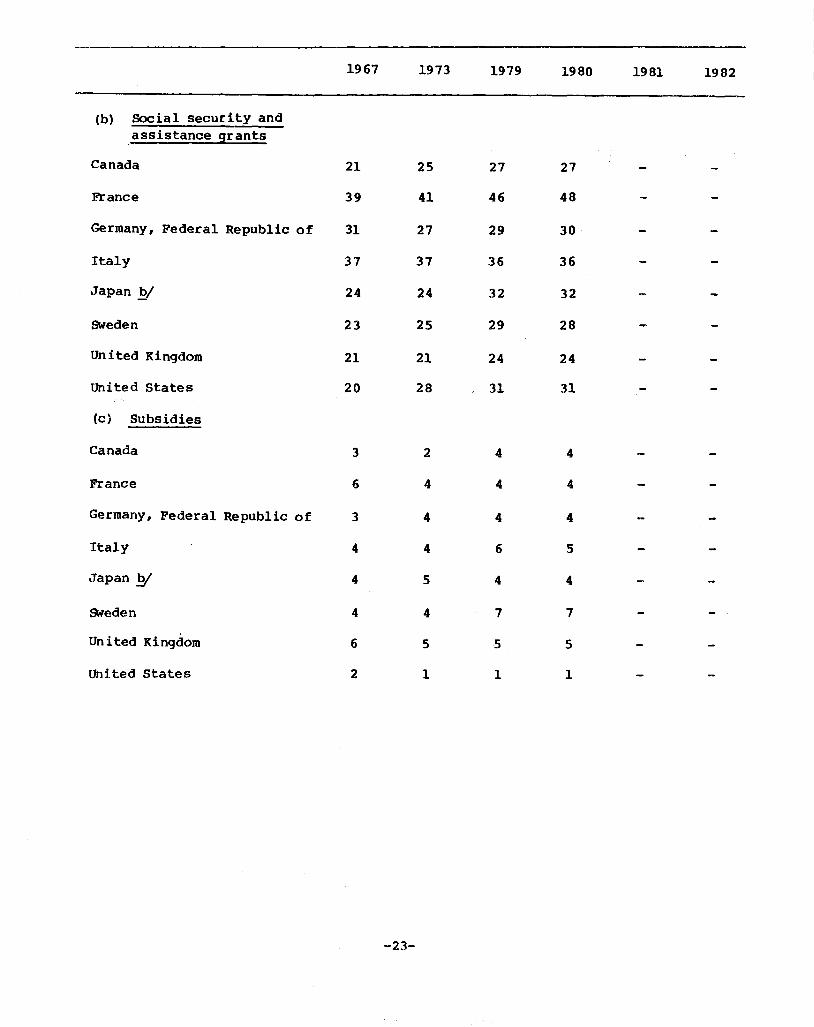
Generally, the main factor accounting for the upward thrust of publicexpenditure was the sharp rise in transfer payments. This more than offset thedeclining share of purchases of goods and services. The sharpest increase inpersonal trans~ers as a share of pUblic expenditure was registered by the UnitedStates of America, the "Federal Republic of Germany, France and Japan, where theshare increased by 8-11 percentage points. The share of subsidies has generallybeen relatively small and stable. The category of expenditure - comprisinginterest payments and other current disbursements, capital transfers and netpurchases of land and intangible assets - generally experienced a significantincrease. Factors accounting for the growth 6'f this expenditure component are therise in capital costs and funding needs for larger deficits. The high interestrates prevalent in 1980-1982 most probably caused an acceleration of theseincreases during the period.
-24-
Estimates of the components of public expenditure for 1982 for each countryhave not been attempted. However, all the available indications - mostimportantly, increasing unemployment ~ and several changes made in social securitybenefit schemes 11 between 1979 and 1982 - suggest further significant increases inpersonal .transfer payments for all countries combined. This component and alevelling off of the increase in revenue are the most important factors explainingthe unprecedented increase in public deficits in 1982 in most countries. .
Budget deficits and private savings
In some countries, the current controversy over levels of public expenditureand taxation is focused mainly on the emergence of large, and persistent, budgetdeficits. The concern is not with the fact that budgets have generally moved intodeficits because of the declines in revenues and increases in unemplOYmentinsurance payments that are associated with recession. It is rather with theevidence that, in some countries, an important part of recent and current deficitsis structural in character and is likely, in the absence of significant changes intax or spending policies, to persist even when the economy is operating at, ornear, full capacity. The strong upward trend in mandated transfer payments,particularly through social security systems, is a principal reason for viewing thedeficits of some countries as structural. Even after substantial economic recoveryhas taken place, deficits in some countries are expected to be sufficiently largeto constitute a major drain on private savings and accordingly to reduce theresources available for investment. As discussed more fully in chapter I of theWorld Economic Survey, 1983, !f the persistence of large deficits is likely tomaintain an upward ~essure on long-term real interest rates and to impede therecovery of productive investment.
Most of the countries under study have had appreciable budget deficits in mostyears since the mid-1970s (see table 11-2). Except for Italy, this has marked areversal from earlier years, in fact, surpluses of some magnitude used to be quitecommon in a number of the countries. Recent deficits have been large in relationto the gross private saving of these countries. While this has helped to maintaineconomic activity in a period of recession and declining investment activity,deficits will need to decline in relation to gross private saving as the recoverygathers strength. Fbr some countries, the recent trend in budget deficits and theclaim they have made on private saving have been at significantly higher levelsthan in earlier post-war years.
Effect of transfer payments on private savings
Another of the fears ex~essed about the consequences of rising publicexpenditure is that, since it largely takes the form of increasing transferpayments, rising public eXPenditure may adversely affect private saving. Personaland business transfers - or more specifically, social security benefits, assistancegrants and subsidies -are generally intended to assist those experiencingdifficulty in meeting their current costs. It thus appears plausible that theshare of private savings in private disposable income at the macrolevel may bereduced if there is a significant increase in such transfers. HOwever, in manycountries, transfer programmes have not been formulated primarily to address the~oblem of income redistribution among households. ~ To put it differently, awide range of socio-economic and demographic factors appear to have been more
-25-
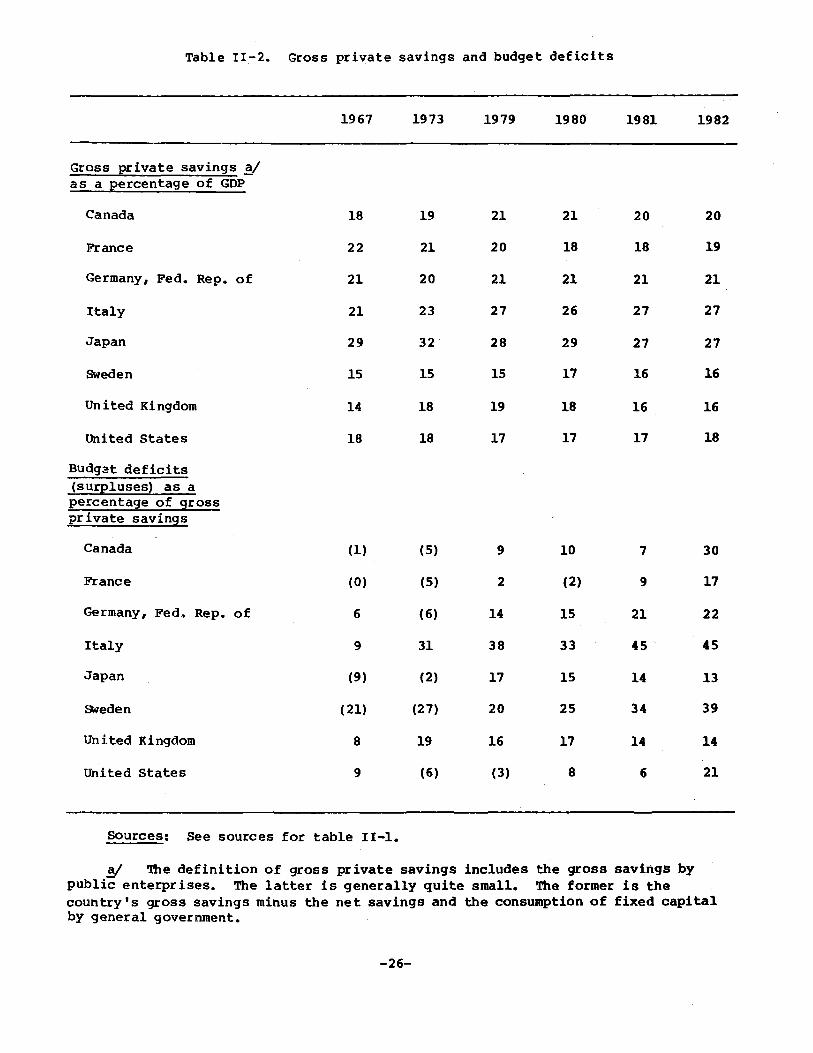
Table II-2. Gross private savings and budget deficits
1967 1973 1979 1980 1981 1982
Gross private savings ~as a percentage of GOP
Canada 18 19 21 21 20 20
France 22 21 20 18 18 19
Germany, Fed. Rep. of 21 20 21 21 21 21
Italy 21 23 27 26 27 27
Japan 29 32 28 29 27 27
Sweden 15 15 15 17 16 16
United Kingdom 14 18 19 18 16 16
United states 18 18 17 17 17 18
BUdg~t deficits(surpluses) as apercentage of grosspr ivate savings
Canada (1) (5) 9 10 7 30
France (0) (5) 2 (2) 9 17
Germany, Fed. Rep. of 6 (6) 14 15 21 22
Italy 9 31 38 33 45 45
Japan (9) (2) 17 15 14 13
Sweden (21) (27) 20 25 34 39
Un i ted Kingdom 8 19 16 17 14 14
Uni ted states 9 (6) (3) 8 6 21
Sources: See sources for table II-I.
a/ The definition of gross private savings includes the gross savings bypublic enterprises. The latter is generally quite small. The former is thecountry's gross savings minus the net savings and the consumption of fixed capitalby general government.
-26-

critical than income status per se in designing these programmes.consequently not a priori grounds for assuming that the effect ofon pr ivate savings will be adverse, the actual effect can only bebasis of empirical evidence.
These aretransfer paymentsassessed. on the
Data on private savings are presented in table 11-3. Between 1967 and 1980,the private savings rate varied over time and between countries. On the one hand,it remained relatively stable in the United States of America and the FederalRepublic of Germany. On the other hand, it significantly increased in canada,Italy, Sweden and the united Kingdom of Great Britain and Northern Ireland. Asidefrom Sweden, the countries with the largest increases in personal transfersrelative to GDP were F;ance and Japan, with increases in excess of 6 percentagepoints. These countries experienced significant decreases in the private savingsrate of appcoximately 4 percentage points. However, the effect of increasingtransfers on the pcivate savings rate, based on this evidence, is not definitive.
A series of comprehensive studies on this problem, however, exists for a fewcountries, they examine the pcoblem primarily at the household level. Theseempirical results reflect a variety of effects of social security on personalsavings. 6/ On the one hand, there have been two critical views supporting thenegative effect of social security on personal savings. It is contended that(a) increased coverage of old-age benefits in terms of both the number ofrecipients and the level of benefits may substitute the portion of personal wealthsaved for the purpose of consumption after retirement, and (b) the social securitysystem in general may reduce the portion of personal savings intended forunexpected income losses in the future by socializing or pooling risks. On theother hand, there are views supporting the positive effect of social security onpersonal savigs. Ckle important view is that, contrary to the negative viewmentioned above, the old-age pension scheme, by forcing more people to join thescheme, may increase the recognition of the importance of savings for futureretirement.
It seems that these opposing effects may cancel each other out, at any rate,the empirical evidence of the impact of social security on personal savings appearsinconclusive. Further empirical studies are needed before a definitive view may beexpcessed on the impact of increased payments on private savings.
Eftectof transfer payments and taxes on the incentive to work
The effect of increased transfer payments as well as the "bracket-creep"effect of personal income tax rules under inflation are alleged to providedisincentives to work. Studies on the effect of tax rules on high-incomeindividuals lend little support to this hypothesis. It may be argued, however,that those who were examined were primarily in the top bracket of tax schedules, 11which means that such an examination covered less than 1 per cent of taxpayers. Inthis case, they are not representative of the labour force relevant to thishypothesis. As for low-income individuals, it appears that high tax rates mayinduce less work effort. This conclusion is supported by the results of controlledexperiments on an income maintenance pcogramme known as the negative income taxprogramme, 8/ in which a minimum level of income was guaranteed to low-incomefamilies through the pcovision of grants. This grant was reduced at a specifiedtax rate for each dollar of income earned by the family. This experiment showedthat rates above 50 per cent adversely affected work effort. Here again, however,
-27-
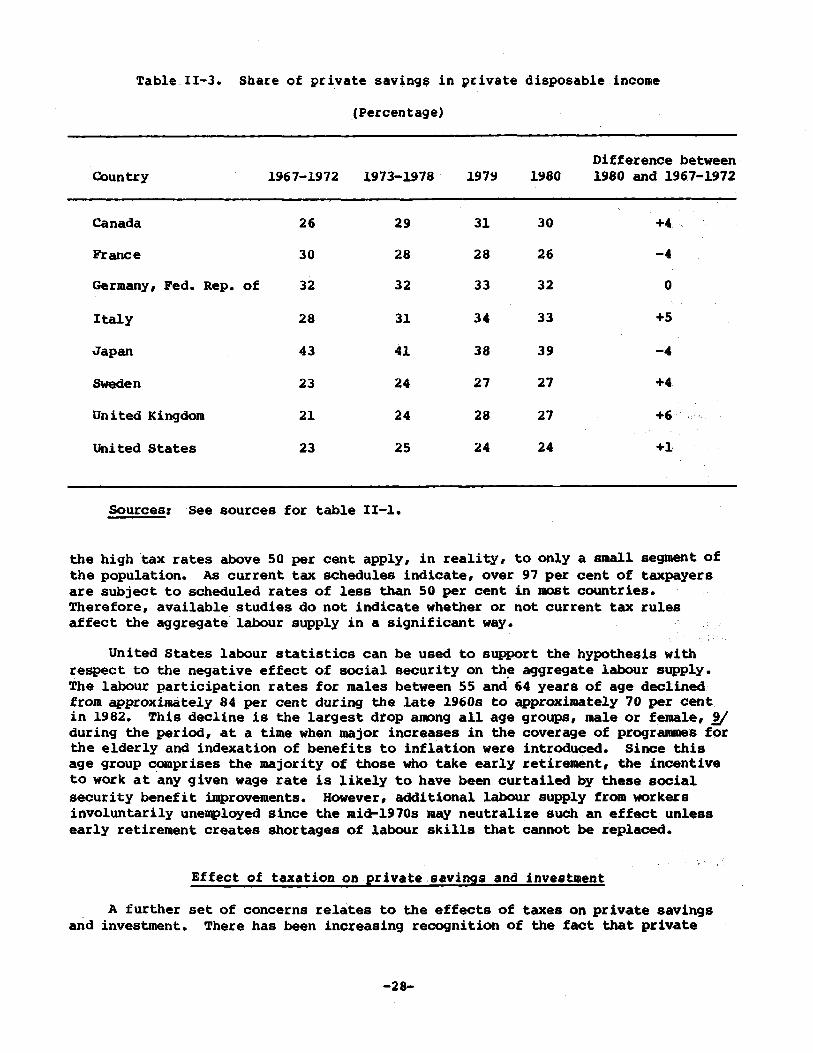
Table. 11-3. Sbare of private saving~ in private disposable income
(Percentage)
Difference betweenCountry 1967-1972 1973-1978 1979 1980 1980 and 1967-1972
Canada 26 29 31 30 +4
France 30 28 28 26 -4
Germany, Fed. Rep. of 32 32 33 32 0
Italy 28 31 34 33 +5
Japan 43 41 38 39 -4
Sweden 23 24 27 27 +4
United Kingdom 21 24 28 27 +6
United States 23 25 24 24 +1
Sources: See sources for table II-I.
the high tax rates above 50 per cent apply, in reality, to only a small segment ofthe population. As current tax schedules indicate, over 97 per cent of taxpayersare subject to scheduled rates of less than 50 per cent in most countries.Therefore, available studies do not indicate whether or not current tax rulesaffect the aggregate labour supply in a significant way.
United States labour statistics can be used to support the hyPOthesis withrespect to the negative effect of social security on th~ aggregate labour supply.The labour participation rates for males between 55 and 64 years of age declinedfrom approximately 84 per cent during the late 1960s to approximately 70 per centin 1982. This decline is the largest drop among all age groups, male or female, !Iduring the period, at a time when major increases in the coverage of programmes forthe elderly and indexation of benefits to inflation were introduced. Since thisage group comprises the majority of those who take early retirement, the incentiveto work at any given wage rate is likely to have been curtailed by these socialsecurity benefit improvements. However, additional labour supply from workersinvoluntarily unemployed since the mid-1970s may neutralize such an effect unlessearly retirement creates shortages of labour skills that cannot be replaced.
Effect of taxation on private "savings and investment
A further set of concerns relates to the effects of taxes on private savingsand investment. There has been increasing recognition of the fact that private
-28-

savings and investment in developed market economies respond sensitively to changesin the real after-tax rate of return • .!Q/ Since the mid-1970s this recognitionwith respect to savings has been enhanced by the tendency of high inflation toreduce the real rate of return on financial investment and has prompted some majorchanges in tax rules applying to certain categories of savings in certaincountries. 'nlat tax rules affect private savings has long been recognized bypolicy-makers in many countries. 1!/ such rules have been applied in the form oftax geductions or lower special tax rates for certain income categories fromcapital in order to encourage savings. This incentive, however, does not implythat savings: are necessarily channeled into capital formation investments that canrealize high pre-tax rates of return. A critical factor is again the tax treatmentof such items as investment credits, tax deductions and accelerated depreciation,which differ between various sectors, industries and corpor~tion~. If the taxrules are unfavourable enough to lower after-tax rates of return below those ofalternative forms of investment, even the best investment in terms of marketcriteria may be shunned. Such capital misallocation could affect adversely thelong-term growth performance of a country.
Empirical evidence indicates that this welfare loss associated with resourcemisallocation has, until recently, been significant in the United States of~erica, while it has been quite small in such countries as the Federal RepUblic ofGermany and Japan. It is estimated, for example, that owing to the double taxationof income generated by cOrPOrate enterprises and the favourable taxation ofowner-occupied housing, the productivity loss of the United States economy during1976-1977 was over 1 per cent of GNP, while the Federal Republic of Germany andJapan experienced negligible losses. 12/
Cbncluding remarks
Leaving aside the issue of budget deficits, the above survey points to thelikelihood that it is the nature of country-specific programmes of publicexpenditure and tax rules, rather than the level of growth of aggregateexpenditures or taxes, which may be the main source of potential problems for theaggregate supply of capital and la~~ur. ~vertheless, these country-specificpotential problems cannot sufficiently explain the widespread and prolongedslowdown of economic growth since the mid-1970s in all the countries concerned.This judgement is particularly applicable to the effects of tax rules, be theypcogressive tax schedules on personal income or income-tax deductions of certaindebt payments, since these have essentially remained unaltered for some decades.
libtes
1/ FOr 1981 and 1982, only a few selected series are presented on the basisof Organisation for Economic Co-operation and Development, Economic Outlook,December 1982.
1I The average unemployment rate in the DECO countries increased roughlyfrom 6 to 9 per cent from 1980 to 1982.
11 In 1982, no change occurred in the United States, and from 1983 on, mostbenefits would remain intact with some tax increasesJ in the United Kingdom,unemployment benefits were reduced slightly in real termsJ in France, social
-29-
security taxes (contributions) were raised for early retirees while cost-of-livingadjustment formulas were changedJ in the Federal Republic of Germany, studentassistance grants were scaled backJ in Japan, automatic cost-of-living adjustmentformulas for social security are under discussion.
if E/1983/42J to be issued as a United Nations sales publication.
2/ See, for example" Report on the World Social situation (United Nationspublication, Sales No. E.82.IV.2), p. 13, and "Socio-economic policies related toissues concerning the equitable distribution of national income and the process ofinstitutional developmentJ Preliminary conclusions of a project on incomedistribution" (E/CN.5/1983/5).
~ See R. J. Barro and others, "Social security and private savings Anotherlook", Social Security Bulletin, May 1979. For a recent technical review of pasteconometric studies on the case of the United States and of Japan, seeK. Yoshikawa, -Do the social security benefits reduce personal savings?-, ~(Japanese), April 1982, pp. 70-76. A recent research memorandum presents sameevidence for the negative effects of the social security system in the UnitedStates. This is due to the effect of income redistribution towards groups withlower marginal propensities to save (see OWen Evans, "Social security and householdsaving in the United States: A re-examination- (International Monetary Fund,19 November 1982) (DMV82/75».
Y See Organisation for Economic Co-operation and Development, Studies inTaxation, Income Tax Schedules (Paris, 1981), p. 8.
!I See, for example, an article on the Seattle and Denver income maintenanceexperiments: P. K. Robins and R. W. west, "Program participation and labor-supplyresponse", The Journal of Human Resources, Fall 1980, pp. 499-523.
21 The female participation rate of this age group was virtually unchangedat about 42 per cent during both periods (see United states Bureau of LaborStatistics, EmplOyment and Earnings, various issues) •
.!V The real after-tax interest elasticity of household saving is estiJnatedto be around one fourth for the United States economy. It implies that if (a) thehousehold saving rate is around 4 per cent, and if (b) the real after-tax rate ofreturn rises by one percentage point, the household saving rate will be 5 per cent(see M. J. Boskin, "Taxation, saving and the rate of interest-, Journal ofPolitical Economy, April 1978, pp. S3-S27).
111 Until recently, the United States has paid less attention to the taxtreatment of savings •
.!y See T. Nakamura, "Productivity losses through capital misallocation inthe U.S.A., Japan and West Germany-, Quarterly Review of Economics and Business,Autumn 1981, pp. 65-76, and M. Feldstein, liThe welfare cost of capital incometaxationll
, Journal of Political Economoc, April 1978, 829-S51. Feldstein states,"Even if both saving and labor supply do not respond to the interest rate and wagerate, the welfare eost of the currelltexcess taxation of capital income h.isapproximately the same large magnitude as the welfare cost due to the misallocationof capital between the corporate and non-corporate sectors."
-30-

THE IMPACT OF WORKERS' REMITTANCES ON THE BALANCE OF PAYMENTS
Introduction
Workers' remittances acquired special importance in the 1970s as a majorsource of foreign exchange earnings for an increasing number of developingcount~ies. This has often been cited as the main benefit to countries with largepools of workers abroad. In this note the impact of workers· remittances on thebalance of payments of these labour-exporting countries, particularly those with asizeable recorded inf~ow of remittances, will be examined.
The vast migration of foreign workers to the oil-exporting countries in theMiddle East and to other OPEC countries in the wake of the first oil price increasein 1~73 is one of the special features of the 1970s. It gave rise to theexpectation of an even stronger cross-border movement of workers in the future,from developing countries with a labour surplus to other developing countries whosedevelopment programmes depended on the import of workers. Such being the case, itwas argued that an acceleration in international labour migration was to become oneof the main features of the 1980s. The optimism embodied in these views wasreinforced by the significant increases in workers' remittances in the second halfof the 1970s, which in turn, justified the notion that these new financial flowswould represent a significant contribution to the adjustment process in thelabour-exporting developing countries, at least at the balance-of-payments level.Such an increase in workers' remittances would, in addition, help in paying theenlarged import bill of their countri~s of origin. Meanwhile, in a different groupof developing countries, those exporting oil, the new waves of migrant labourers,with their impressive range of skills, were making possible profound changes in theproductive structures of those countries which otherwise would not havematerialized or at best have been delayed.
The largest increments in remittances have accrued to those developingcountries which were able to send their surplus labour to the oil-exportingcountries, mainly in the Middle East, which in relation to their rapidly increasingincomes have short supplies of indigenous human resources. In fact, the incrementsin remittances to those countries explain more than half of the increase in globalworkers' remittances between 1974 and 1980 (see table 111-1). 11 However, thefactors that led to this increase have recently been subjected to several changes.Indeed, the available data on remittances for 1981 show signs of a change intrends. A provisional assessment, while still confirming the high proportion thatworkers' remittances have come to represent in the foreign exchange earnings of anumber of countries (see table 111-2), does not warrant very high eXPeCtations fora further strengthening of past trends during the present decade. An analysis ofthe reasons for this change is presented below. For this purpose, two main groupsof labour-exporting countries are distinguished, "hew" emigration countries, orcountries which have emerged as major labour exporters since the 1973 oil-priceincreaseJ and "old" emigration countries, or countries whose labour exports wererelated to the expansionary phase in the developed market economies. In additionto these two major categories, reference is also made to a third group of countriescomprising those emigration countries that cannot be readi~y c~assified undereither of the two major groups.
-31-
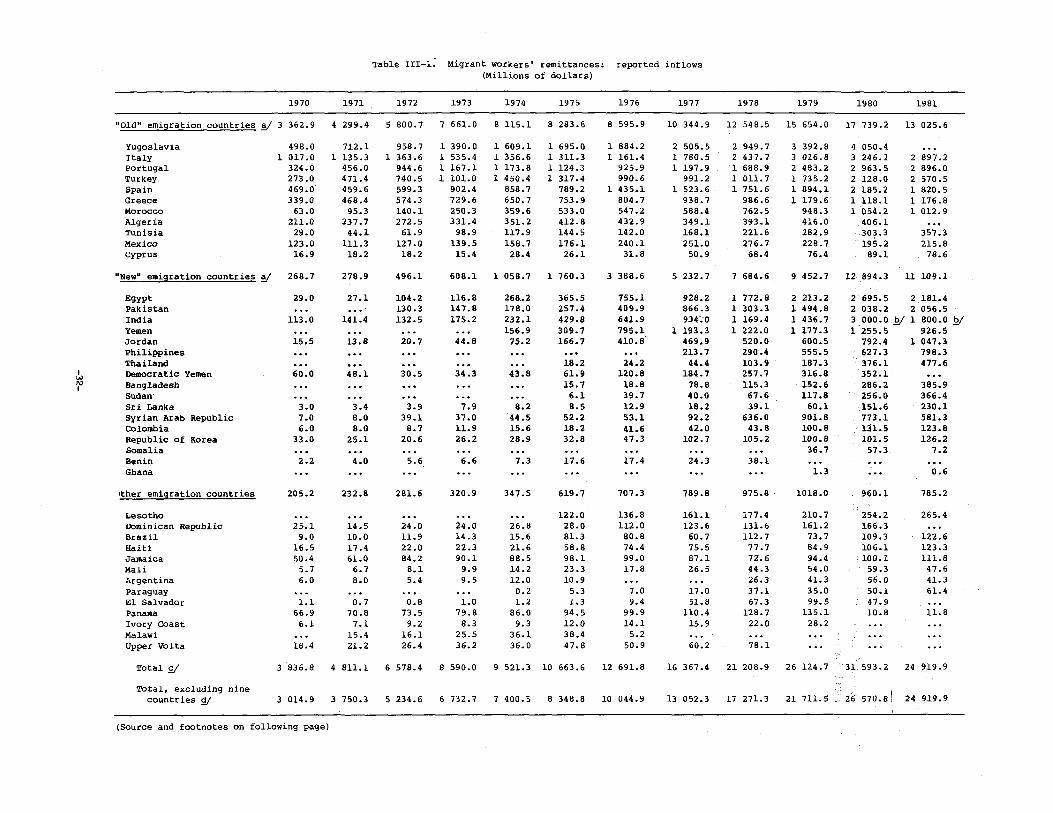
Table III-lo Migrant workers' remittances: reported inflows(Millions of dollars)
1970 1971 1972 1973 1974 1975 1976 1977 1978 1979 1980 1981
l'Old ti emigration countr ies y 3 362.9 4 299.4 5 800.7 7 661.0 8 115.1 8 283.6 8 595.9 10 344.9 12 548.5 15 654.0 17 739.2 13 025.6
Yugoslavia 498.0 712.1 958.7 1 390.0 1 609.1 1 695.0 1 884.2 2 505.5 2 949.7 3 392.8 4 050.4Italy 1 017.0 1 135.3 1 363.6 1 535.4 1 356.6 1 311.3 1 161.4 1 780.5 2 437.7 3 016.8 3 246.1 2 897.2Portugal 324.0 456.0 944.6 1 167.1 1 173.8 1 124.3 925.9 1 197.9 1 688.9 2 483.2 2 963'.5 2 896.0Turkey 273.0 471.4 740.5 1 101.0 1 450.4 1 317.4 990.6 991.2 1 011.7 1 735.2 2 128.0 2 570.5Spain 469.0 459.6 599.3 902.4 858.7 789.2 1 435.1 1 523.6 1 751.6 1 894.1 2 185.2 1 820.5Greece 339.0 468.4 574.3 729.6 650.7 753.9 804. 7 938.7 986.6 1 179.6 1 118.1 1 176.8Morocco 63.0 95.3 140.1 250.3 359.6 533.0 547.2 588.4 762.5 948.3 1 054.2 1 012.9Algeria 211.0 237.7 272.5 331.4 351.2 412.8 432.9 349.1 393.1 416.0 406.1Tunisia 29.0 44.1 61.9 98.9 117.9 144.5 142.0 168.1 221.6 282.9 303.3 357.3Mexico 123.0 111.3 127.0 139.5 158.7 176.1 240.1 251.0 276.7 228.7 195.2 215.8Cyprus 16.9 18.2 18.2 15.4 28.4 26.1 31.8 50.9 68.4 76.4 89.1 78.6
IINewu emigration countries !I 268.7 278.9 496.1 608.1 1 058.7 1 760.3 3 388.6 5 232.7 7 684.6 9 452.7 12 894.3 11 109.1
Egypt 29.0 27.1 104.2 116.8 268.• 2 365.5 755.1 928.2 1 772.8 2 213.2 2 695.5 2 181.4Pakistan .,. 130.3 147.8 178.0 257.4 409.9 866.3 1 303.3 1 494.8 2 038.2 2 056.5India 113.0 141.4 132.5 175.2 232.1 429.8 641.9 934-.. 0 1 169.4 1 436.7 3 000.0 !!I 1 800.0 !!IYemen 156.9 309.7 795.1 1 193.3 1 222.0 1 177.3 1 255.5 926.5Jordan 15.5 13.8 20.7 44.8 75.2 166.7 410.8 469.9 520.0 600.5 792.4 1 047.3Philippines 213.7 290.4 555.5 627.3 798.3Thailand 18.2 24.2 44.4 103.9 187.3 376.1 477.6
I Democratic Yemen 60.0 48.1 30.5 34.3 43.8 61.9 120.8 184.7 257.7 316.8 352.1wI\) Bangladesh 15.7 18.8 78.8 115.3 152.6 286.2 385.9I
Sudan· 6.1 39.7 40.0 67.6 117.8 256.0 366.4Sri Lanka 3.0 3.4 3.9 7.9 8.2 8.5 12.9 18.2 39.1 60.1 151.6 230.1Syrian Arab Republic 7.0 8.0 39.1 37.0 44.5 52.2 53.1 92.2 636.0 901.8 773.1 581.3Colombia 6.0 8.0 8.7 11.9 15.6 18.2 41.6 42.0 43.8 100.8 131.5 123.8Republic of Korea 33.0 25.1 20.6 26.2 28.9 32.8 47.3 102.7 105.2 100.8 101.5 126.2Somalia 36.7 57.3 7.2Benin 2.2 4.0 5.6 6.6 7.3 17.6 17.4 24.3 38.1Ghana 1.3 0.6
Ither emigration countries 205.2 232.8 281.6 320.9 347.5 619.7 707.3 789.8 975.8 1018.0 960.1 785.2
Lesotho 122.0 136.8 161.1 177.4 210.7 254.2 265.4Dominican Republic 25.1 14.5 24.0 24.0 26.8 28.0 112.0 123.6 131.6 161.2 166.3Brazil 9.0 10.0 11.9 14.3 15.6 81.3 80.8 60.7 112.7 73.7 109.3 122.6Haiti 16.5 17.4 22.0 22.3 21.6 58.8 74.4 75.5 77.7 84.9 106.1 123.3Jamaica 50.4 61.0 84.2 90.1 88.5 98.1 99.0 87.1 72.6 94.4 100.1 111.8Mali 5.7 6.7 8.1 9.9 14.2 23.3 17.8 26.5 44.3 54.0 59.3 47.6Argentina 6.0 8.0 5.4 9.5 12.0 10.9 26.3 41.3 56.0 41.3Paraguay 0.2 5.3 7.0 17.0 37.1 35.0 50.1 61.4El Salvador 1.1 0.7 0.8 1.0 1.2 1.3 9.4 51.8 67.3 99.5 47.9Panama 66.9 70.8 73.5 79.8 86.0 94.5 99.9 110.4 128.7 135.1 10.8 11.8Ivory Coast 6.1 7.1 9.2 8.3 9.3 12.0 14.1 15.9 22.0 28.2Malawi 15.4 16.1 25.5 36.1 38.4 5.2Upper Volta 18.4 21.2 26.4 36.2 36.0 47.8 50.9 60.2 78.1
Total £I 3 836.8 4 81l.1 6 578.4 8 590.0 9 521.3 10 663.6 12 691.8 16 367.4 21 208.9 26 124.7 31 593.2 24 919.9
Total, excluding nine570.81countries ~ 3 014.9 3 750.3 5 234.6 6 732.7 7 400.5 8 348.8 10 044.9 13 052.3 17 271.3 21 711.5 26 24 919.9
(Source and footnotes on following page)

(Source and footnotes to table III-I)
Source: Department of International Economic and Social Affairs of the unitedNations Secretar~at, based on International Monetary Fund balance-of-paymentstapes, March 1983. The figures here are the sum of Mlabour incomeM, Mmigrants'transfersMand "workers' remittances·, items 27, 33 and 35, respectively, in thedetailed presentation of the accounts in.the International Monetary Fundbalance-of-payments statistics. FUrther explanation of these items is provided inthe text below.
!I Pbr definition of Mold· and MnewM emigration countries, see text.
!?I Estimates by the Department of International Fk::onomic and SOCial Affairsof the United Nations Secretariat.
£I These totals are not fully comparable as a time series, because somecountries have incomplete data or began recording remittances only recently.
~ ~talexcludes nine countries for which 1981 data are not yet available.
-33-

Table III-2. Remittance inflows as percentage of merchandiseexports, selected countries ~/
1975 1976 1977 1978 1979 1980 1981
"New" emigration countries
Yemen !V 2 180 5 850 8 060 21 820 24 030 9 960 9 000Democratic Y~men ~/ 320 270 390 650 810 590 •••Jordan 110 200 190 180 150 140 140Egypt 23 47 48 89 88 70 54Pakistan 25 35 77 93 77 80 73Bangladesh 05 05 17 21 23 36 49Benin 15 18 17 20India 09 12 15 18 19 36 ~ 21stPhilippines ... 7 8 12 11 14
"Old" emigration countries
Turkey 94 51 57 44 77 73 43Portugal 58 52 47 62 70 65 71Morocco 35 44 46 51 49 44 44Yugoslavia 42 39 48 51 50 45Greece 38 36 37 33 30 27 25Tunisia 18 18 22 24 18 17 17Cyprus 22 15 17 21 18 15 15Spain 12 18 17 16 13 12 9
Source: Department of International Economic and Social Affairs of the unitedNations Secretariat calculations based on International Monetary Fund, Balance ofPayments Statistics, vol. 33 (1982).
~ Listed countries are those for which workers remittances represent atleast 10 per cent of the value of merchandise exports in 1980.
BI The percentages for these countries are extremely high because the valueof merchandise exports is very small.
EI Estimates by the Department of International Economic and Social Affairsof the united Nations Secretariat.
-34-

The rise in remittances during the 1970s
The flows of workers' remittances showed steady and substantial increases inthe 1970s. Labour-exporting countries in Europe, Africa, Asia and Latin Americaregistered over $31 billion in remittances in 1980, up from about $3.8 billionin 1970 or more than an eight-fold increase in 10 years (see table III-I). Thisrepresents an impressive annual rate of growth of about 23 per cent. Such adevelopment resulted in workers' remittances gradually becoming an ~mportant partof the international flow of foreign exchange. ~
The amounts of remittances being referred to here are the sum of flowsregistered in the International Monetary Fund balance-of-payments statistics underthree headings associated with migrants: 11 labour income (item 21 in the detailedpresentation of the accounts) is the factor income accruing to temporary labourersdefined as those staying less than 12 months working abroad; workers' remittances(item 35) is the value of private transfers from workers'residing abroad for morethan a year, and migrants' transfers (item 33) is a set of entries referring to theflows of goods and changes in financial assets that arise from migration.
Most countries do not distinguish between these types of flows. Indeed theirtotal appears under item 35, workers' remittances. In addition, there arepractically no data registered under '"migrants transfers· except for :half a dozendeveloping countries. Furthermore, as is the case with the statistics on migrants,it is hard to distinguish between remittances from temporary workers and those frompermanent migrants. In view of this, use is made here of the World Bank'sdefinition, which considers ·workers' remittances· as the sum of the three itemsmentioned above.
For a certain number of developing countries, such as Egypt and Pakistan, andmore recently Bangladesh, workers' remittances came to represent half or more thanhalf the total value of merchandise exports. In Egypt and Pakistan, in fact, theyrepresented in some recent years more than two thirds of the value of merchandiseexports. Also, in India and the Philippines workers' remittances showed a markedupward trend, mainly in the second half of the 1970s. In India such remittancesrepresented about 20 per cent of the value of merchandise exports at the end of thedecade. In addition, mention should be made of the special cases of Yemen, whereworkers' remittances are practically the only source of foreign exchange, as wellas Democratic Yemen and Jordan, where these remittances far outweigh merchandiseexports (see table 111-2) •
According to the classification discussed earlier, these countries may becalled the ·new· emigration countries, in the sense that the rapid increases in theemigration of workers and in the inflow of remittances are clearly a phenomenonthat followed the oil-price increase of 1973 (see tables 111-1 and 111-2). Inseveral of these countries emigration had indeed occurred before the 1910s. Forexample, labour migration from Jordan, Egypt and Democratic Yemen was alreadytaking place in the 1950s, Bangladeshis have been migrating to Saudi Arabia sincethe early 1960s, 4/ significant migration from India was taking place in thebeginning of the century, 5/ and the movement of Colombians into Venezuela has beena known fact for some past-decades. What is new, in fact, is the substantialincrease in the stocks of migrant workers in most of the oil-exporting countriesduring the second half of the 1910s, as well as the high proportion they came torepresent in the labour force of these countries.
-35-
The increase in oil revenues meant that most of the oil-exporting countries,and not only those in the Middle Fast, have accelerated the implementation of theirdevelopment plans and have increased their demand for foreign labour. Remittancesrose as a consequence of larger numbers of workers leaving their countries insearch of work and higher wages. In 1980, the stock of migrant workers in the Araboil-exporting countries had reached some 2.8 million: approximately627,000 Egyptians, 368,000 Pakistanis, 420,000 Yemenis (mainly from the Yemen ArabRepub1~c), 280,000 Indians, 250,000 Jordanians and Palestinians, 89,000 Sudanese,179,000 Bangladeshis, !I 83,000 Syrians, 20,000 Somalis, 220,000 Filipinos and morethan 120,000 migrants from the Republic of Korea. 1/ In Latin America, Venezuela,the main OPEC country tn the region, is also by far the most important immigrationcountry in the area, with a presence of 1.1 million foreign workers in 1981, amongwhom Colombians represent a high proportion. In Africa, another major OPEC memberState, Nigeria, attracted increasing numbers of workers from neighbouring countriesbelonging to the Economic Community of West African States (ECO~S), notably Ghana,Benin and Togo.
The presence of these large numbers of migrant workers and their increase ascompared to corresponding estimates made five years earlier ~ is reflected in theVolume of remittances to their countries of origin (see table III-I). Apart fromthe number of migrants, the rise in remittances also reflects the upward movementof wages in the oil-exporting countries, which was brought about by the higher oilrevenues. At the same time, the widening of the wage differentials between thesecountries and those exporting labour stimulated the flow of migrants.
TUrning to the "old" emigration countries, it may be recalled that they arebasically those where the substantial outflows of workers were related to thestrongly expansionary phase of the Western European economies in the 1960s.Nationals of Italy, Spain, Portugal, Turkey, Yugoslavia, the Maghreb countries andGreece, accounted for two thirds of the recorded number of approximately6.5 million migrant workers in Western Europe in 1980. With the exception of theUnited Kingdom of Great Britain and Northern Ireland, which received migrantsmainly from other Commonwealth countries, 73 per cent of the 5.6 million migrantworkers in the Western European countries came from the following countries:16 per cent from Italy, 14 per cent from Turkey, 11 per cent from Yugoslavia, morethan 15 per cent from Spain and Portugal, 13 per cent from the Maghreb countries,and 3 per cent from Greece.
As may baobserved from table III-I, Mexico is included among the ·old"emigration countries, since neither a labour surplus nor the traditional flow ofmigrants to the United States ceased to exist even after that country became amajor oil exporter. Its oil boom, however, at the same time attracted migrantlabour from other Latin American countries. Nevertheless, the overriding nature ofthe former characterics has put Mexico in sharp contrast wi th the oil exporters ofthe Middle East in that it still remained a major labour-exporting country.
The "old" emigration countries were major receivers of remittances sincebefore the 1973 oil price increase. The weight of such remittances in theircurrent accounts in general did not increase and in some cases even declined in thesecond half of the 1970s. This is due to the fact that the recruitment of foreignlabourer s in the major developed market economies of Wester n Europe came to a haltin the mid-1970s. Nevertheless, in some of the "old" emigration countries theratio of remittance inflows to merchandise exports can indeed be quite high, as inPortugal, where it reached more than 60 per cent in recent yearsJ in Turkey, where
-36-
the ratio oscillated in a range from 94 per cent in 1975 to 43 per cent in 1981) inMorocco and Yugoslavia, where it has been close to 50 per cent) and in Greece,where it was near 30 per cent until recently. However, contrary to the trend inthe Anew· emigration countries, the proportion of workers' remittances in foreignexchange earnings of the ·old" emigration countries has not been increasing(see table 111-2), except in the case of Portugal. In several of them the absoluteamount of remittances has been either declining or has remained stagnant (seetable III-I) •
While the categorization of the labour-exporting countries into "new· and·old· emigration countries may be convenient and convincingly substantiated, thedividing line between these two categories is not a clear-cut one. This is due tothe fact that some of the ·old" emigration.countries, like the Maghreb countriesand more recently Turkey, are also recipients of remittances from their workers inthe Middle East. These were generated, in the case of such countries as Turkey,Yugoslavia and the Republic of Korea, from new exports of labour to the Middle Eastwhich have been mainly in the form of ·contract migration· developed byconstruction firms offering package deals covering services, equipment and labour.
Furthermore, not all the emigration countries for which data on remittancesare reported can be readily classified in these two categories, since not allcross-border labour migration can be related to either the expansion in theindustrialized countries or to the increase in oil revenues. In table III-I, athird group of countries is listed under the heading ·other emigration countries".It includes developing countries which export labour to both developing anddeveloped countries. For this group of countries, remittances increased in the1970s. However, no exact information on the source of the increase in suchremittances is available.
In view of their substantial size and contribution to the foreign exchangeearnings of a number of developing countries, it has sometimes been suggested thatworkers' remittances went a long way to compensate these countries for the costsincurred in higher oil bills. This argument might be valid if the relevant figureswere compared at the level of all developing countries. It is a known fact thatwhile imports of crude petroleum and petroleum products into the developing marketeconomies rose from $4 billion in 1970 to $45 billion in 1980, 21 workers'remittances expanded from about $4 billion to more than $31 billion during the sameperiod. However, those countries which are large oil importers are not identicalwith the countries which are large exporters of labour. Some 82 per cent of thetotal oil imports of developing countries are accounted for by eightsemi-industrialized economies. 1Q/ In several of these countries there have indeedbeen significant exports of labour. However, only in a few have remittancessignificantly offset the increased oil bill. At the same time, when the comparisonis restricted to the labour-exporting countries, it is evident that remittanceshave indeed helped to cushion the effects of the 1973 oil-price increase on theireconomies, even though the extent of that relief has varied widely among them.
The decline in remittances
As noted above, the inflow of remittances to a number of ·new· emigrationcountries has been clearly related to the export of labour to OPEC countries(JIlOStly in the Middle East, but also in Africa and Latin America) in the wake ofthe oil-price increases of the 1970s and the ensuing ambitious investment
-37-
programmes in several of these countries. With the recent decline in oil pricesand the prevalence of a world-wide recession, cutbacks in investment programmes andgovernment expenditures were effected in many of the oil-exporting countries.Hence, a decline' in the demand for foreign labour and a possible decline in thelevel of remittances may be fo~thcoming. Indeed, the figures for the period1975-1981 are quite revealing in this respect. While remittances almost trebledbetween 1975 and 1980, in 1981 they appear to have declined.
A precise comparison of total remittances in 1980 and 1981 cannot be mademainly because of the lack of data for India in both of these years. Furthermore,the 1981 figures for Yugoslavia are not yet available. In the case of India,however, it is possible to make some estimates of current transfers for the fiscalyears 1980/81 and 1981/82 (April to March), these added up respectively to$3.8 billion and $1.9 billion. In recent years, the figures for current transfershave matched rather closely those for workers' remittances. It can therefore be
. estimated that these remittances were about $3 billion in 1980 and around$1.8 billion in 1981. The exceptional rise in remittances in 1980 has beenattributed primarily to the rise in political tension in the Persian Gulf.
The figures for global remittances in table III-l show a sharp decline in1981. However, this is partly due to the absence of data for Yugoslavia, a majorreceiver of remittances, and also for a few other countries. Assuming that thelevel of remittances for Yugoslavia in 1981 was the same as in 1980, and assumingalso that the levels of remittances for the other eight countries for which dataare lacking for some years have remained constant during those year.s, there wouldstill be an appreciable decline in global remittances - from approximately$31.1 billion in 1980 to about $30 billion in 1981• .w Even if allowance is madefor the unusual increase in remittances to India during 1980, the figures stillshow a decline in 1981. Furthermore, the exclusion of the nine countries for whichdata for 1981 are not yet available (as shown in the last row of table III-I), doesnot also alter this general conclusion. When the rapid increases observed in thepast are recalled, particularly that recorded in 1980, the change in trend becomesmore evident. This change, however, i.s not uniform in the three countrygroupings. It is more evident in the case of the "new" emigration countries, wherethe decline is more striking because of the faster growth of remittances recordedin these countries in recent years. With regard to the "old" emigration countries,the figures show only a small decline or a stagnation in the level of remittanceswhen allowances are made for the lack of the data for Yugoslavia and Algeria in1981. For this group of countries the change has been less abrupt, owing to thefact that the rates of growth of remittances in recent years have also been lesssteep and had already decelerated considerably between 1913 and 1918. As to the·other emigration countries·, remittances in 1981 generally did not decline.
The decline in total remittances identified in 1981, which was probably evenmore acute in 1982, is the result of two different but concurrent series ofevents. On the one hand, it is a consequence of the halt in recruitment of foreignlabourers, and even the efforts of Governments to reverse their flow, in mostEuropean countries. This accounts for the decline or stagnation in workers'remittances to the "old" emigration countries such as Italy, Portugal, Spain,Greece, Cyprus and Morocco (see table III-I). On the other hand, it is related tothe decline in oil revenues in some countries in 1981 and, as some largeinfrastructure projects neared completion, to a cautious approach by governmenttowards increased expenditures and hence a slowdown in investment programmes in theoil-exporting countries. This explains the slowdown in remittances to the "new"
-38-

emigration countries, the ones whose remittance inflows were related to theinvestment boom in the oil-exporting countries in the Middle East an elsewhere inthe developing regions.
Data for 1982 are not yet available, but the scattered evidence leads to theconclusion that the trend identified in 1981 continued during that year. Mostprobably it even worsened, not only because substantial curtailments in investmentsand public expenditures, but also owing to restrictions in foreign exchange marketsand expectations regarding the rates of exchange, as well as interes~ ratesdifferentials, all of which might have induced workers to keep part of theirsavings in the country of employment. Considering the various current trends, itseems unlikely that the steep increases in remittances witnessed in the past decadewill reoccur in the 1980s.
Remittances and the reverse flow of migrants
While the results reviewed above are a reflection of the present worldrecession, other influences are also at work. The proportion of foreign labourersin the work force of most of the Middle East receiving countries is already fairlyhigh, ranging from around 40 per cent in Bahrain, the Libyan Arab Jamahiriya andSaudi Arabia, to 70 per cent in Kuwait,! and as high as 81 per cent and 90 per centrespectively in Qatar 12/ and the united Arab Emirates. l~ Apparent~y socialfactors are at work against an increased absorption of foreign labour. The morerapid formation of local skills seems to have become an important objective. 14/Government officials in the Gulf countries, in fact, have been expressing con;;rnover the size of the expatriate work force, a~d in several instances there has beena tightening of controls on entry in the receiving countries, particularly since1980.
A 1979 Kuwaiti decree requires employers to apply to the Ministry of SocialAffairs and Labour for permits to recruit foreign workers and to be responsible fortheir repatriation. In the United Arab Emirates a 1980 law 1Units the stay of newimmigrants to five years and requires migrant workers to leave the country at theend of their contracts. In Bahrain, although a requirement for work permits hasbeen in existence for some time, only recently has this policy been observed, andthe official policy is to replace expatriates gradually by nationals. Also, insaudi Arabia and in the smaller Gulf countries, Governments are seeking means ofpreventing an increase in the number of foreign workers.!2/ The growingpreference in these countries for building contracts with provisions for importedmanpower to include an explicit clause for their repatriation is in line with theobjective of halting immigration.
All indications, therefore, seem to point to a future slowdown in theabsorption of foreign labour in the "new" immigration countries. However, for mostof the oil-exporting countries, particularly in the Middle East, a reversal of theflow of migrants in the short run is less likely. What is clear, however, is thatthe previous path of expansion in the absorption of foreign labour may have littlechance of being resumed at the same rhythm as in the past decade, even when theglobal recession lessens.
-39-

Some observations on the data base
The amounts of remittances considered here should be taken as the lowestestimates for several reasons. To begin with, the global totals areunderestimated, owing to the fact that the list of emigration countries is notcomplete, it excludes some countries with modest remittances or intermittentrecords. The recorded data not only fail to include transfers from illegal orundocumented migrant workers (part of which might appear under other forms oftransfers) , but also in the case of legal migrant workers, no system of controlcould possibly catch all the funds which migrants can personally take acrossborders. In this respect it is interesting to note that some of the countrieswhich are known to hqve significant stocks of their labour force aboard either donot report or sporadically report workers' remittances in their balance ofpayments. Others register relatively small inflows as compared to the number oftheir nationals working abroad.
Differences between official and black market exchange rates constitute astrong incentive not to use the channel offered by the banking system. Meanwhile,merchants with offices in sending and receiving countries have often acted asfinancial intermediaries and have been able to transfer money to the families ofmigrant workers more rapidly than the banking system. Hence, any attempt toestimate remittances outside the banking system would have to be based on a set ofassumptions differing from one country to another. Only very recently have therebeen some attempts to incorporate in the official estimates of remittances someestimates of such transactions on the black market. These estimates generallysuffer from additional uncertainty since workers' remittances are quite sensitiveto changes in the political climate. .Thus, for example, the exceptionalfiuctuations in remittance in some countries in recent years may be traced back tosuch a factor.
In recent years, the trend towards pre-arranged work contracts, in which theimport of labour comes as part of a package including equipmertt and services, mightequally lead to an underestimation of recorded workers' remittances, if part of thewages and salaries are paid by the foreign contractor in the country of origininstead of the country of employment.
Notes
1/ By concentrating on the growth of workers' remittances related to therecent expansion of oil revenues, the migratory movements in southern Africa,North America, central America, western Africa and other areas have been left outof the discussion. In West Africa part of the very recent migratory flows haveindeed been related to the expansion of oil revenues, but no data are available.
~ In 1980 they were substantially more than, for instance, the total sum ofOfficial development assistance to all developing countries, which added up to$24.5 billion (current prices). This is certainly a change compared to a decadeearlier, when recorded remittances were somewhat less than the total of officialdevelopment assistance.
21 see International Monetary Fund, Balance of Payments Manual Oiashington,D.C., 1977), and Gurushri Swarny, "International migrant workers' remittances:Issues and prospects·, World Bank Staff Working paper No. 481 (August 1981).
-40-
~ Syed Ashraf Ali and others, HLabor migration from Bangladesh to theMiddle EastH, World Bank Staff Working Paper No. 454 (April 1981), p. 5.
2/ Ibid., p. 3.
§/ Ibid., p. 49.
11 Except for Bangladeshis (for which the estimates are in Syed Ashraf Aliand others, ~. cit.) and for Filippinos (cf. report from Manila in The New YorkTimes, 31 January 1982, p. 6), these are estimates contained in studies carried outby the International Labour Organisation regarding only migrants who moved for thepurpose of employment and which might be different from other national estimatesJin certain instances they might be underestimates.
!I Estimates of the stock of migrant workers in the Arab countries in 1975are found in World Population Trends and Policies, 1981 Monitoring Report, vol. I(United Nations pUblication, Sales No. E.82.XIII.2), p. 138.
!I 1970/71 Yearbook of International Trade Statistic£ (United Nationspublication, Sales No. E.73.XVII.12), SITC Rev.l, groups 331 and 332, and1980 Yearbook ••• , vol. II (United Nations publication, Sales No. E/F.81.XVII.13),SITC Rev.2, groups 333, 334 and 335.
lQ/ Brazil, Singapore, Republic of Korea, Turkey, Thailand, the Philippines,India and Hong Kong.
W This total is arrived at by assuming that the eight countries, along withYugoslavia, for which data for 1981 are lacking had the same levels of remittancesas those registered in the last year for which data are available.
wp. 140.
World Population Trends and Policies, 1981 Monitoring Report, vol. 1 ••• ,
ldI International Migration Policies and Programmes: A World Survey (UnitedNations publication, Sales No. E.82.XIII.4), p. 55.
~ At the end of 1982 the six countries belonging, to the Gulf Co-operationCouncil decided to set up an institute to increase the supply of skilled Arabmanpower and agreed to work towards unifying their labour laws and exchanginginformation on the labour market.
l2/ A review of immigration policies clearly shows the gradual imposition ofstricter controls on expatriate labour in the Arab count~ies. See InternationalMigration Policies and Programmes ••• pp. 53-57.
83-21890 1151a (E) -41~
-..u..:Jl r-"~1 .;"lJ~ .)s- J.,.....Jl "4~ .1""'" ,rJ1 ~I v- 4-'" ~I • rlWI .1..; 1c:-" .j e-.;.,:JI jJ>~ .;.~I v- •.....,.)1 1""\'1 ';':j~ ~ J.-JI J-...
. ~.j ~I ~lJ.)!..".. .j ~I r" ;.....,.)\ 1""\'1 , JI .,.51 ~,
tpfiiJlIi~~~lIIllili4tJ
.~~~~-~~.~~~~~~~.~~.~•. ~~~~~~~~m~m~~8~~.~~m.m.
HOW TO OBTAIN UNITED NATIONS PUBLICATIONS
United Nations publications may be obtained from bookstores and distributorsthroughout the world. Consult your bookstore or write to: United Nations, SalesSection, New York or Geneva.
COMMENT SE PROCURER LES PUBLICATIONS DES NATIONS UNIES
Les publications des Nations Unies sont en vente dans les librairies et les agencesdepositairee du monde entier. Informez-vous aupras de votre libraire ou adressez-vousa : Nations Unies, Section des ventes, New York ou Genave.
RAR ll9JIY'IHTb H3L{AHHH oprAHH3A:U;HH OB'bEL{HHEHHbIX HA:U;HH
H3ASHHR OprSHH381lHH 06'"beAHHeHHblx HSIlHA MOlKHO KynHTb B KHHlKHbIX Msrs3HHSX H sreHTCTBSX BO Bcex pSAOHSX MHpS. HSBoAHTe cnpSBKH oil H3ASHHRX BBaweK KHHlKHOM MsrS3HHe HnH nHWHTe no sApecy: OprSHH3sIlHR OIl'"beAHileHBblxHSIlHA, CeKIlHR no npoAslKe H3ASHHA, HblO-RoPK HnH meHeBs.
COMO CONSEGUIR PUBLICACIONES DE LAS NACIONES UNIDAS
Las publicaciones de las Naciones Unidas estan en venta en librerias y casas distribuidoras en todas partes del mundo. Consulte a su librero 0 dirijase a: NacionesUnidas, Secci6n de Ventaa, Nueva York 0 Ginebra.
Litho in United Nations, New York.21890-September 1983-4,875
00800 United Nations publicationSalesNo. E.83.II.C.3
ST/ESA/136