dEPARTMENT OF FORESTRY ENGINEERING
35
By Jack Palmer BACHELOR OF ENGINEERING WITH HONOURS In Forestry Engineering Supervisor: Assoc. Prof. Rien Visser UNIVERSITY OF CANTERBURY November 2016 RUNNING HEAD: Coefficient of Friction Investigation DEPARTMENT OF FORESTRY ENGINEERING INVESTIGATION INTO THE COEFFICIENT OF FRICTION BETWEEN LOGGING WIRE ROPES AND TREES
Transcript of dEPARTMENT OF FORESTRY ENGINEERING
By
Jack Palmer
BACHELOR OF ENGINEERING WITH HONOURS
In Forestry Engineering
Supervisor: Assoc. Prof. Rien Visser
UNIVERSITY OF CANTERBURY
November 2016
RUNNING HEAD: Coefficient of Friction Investigation
DEPARTMENT OF FORESTRY ENGINEERING
INVESTIGATION INTO THE COEFFICIENT OF FRICTION
BETWEEN LOGGING WIRE ROPES AND TREES
Coefficient of Friction Investigation Jack Palmer 1
ABSTRACT
Cable-assist harvesting systems frequently use trees to change the angle of the wire rope to
optimise harvest operations. The act of running the wire around the tree instigates a friction
between the two materials which changes the tension in the rope. This project investigates this
important friction interaction by pulling three logging ropes around a section of wood. The three
ropes included a 13mm swaged wire rope, 13mm conventional non-swaged rope and a 9mm
conventional non-swaged rope and these were all wrapped around two logs. This project explores
the relationship between the tension in a rope and coefficient of friction between the two materials.
The main theory behind this relationship is the Capstan Equation. This equation relates the
coefficient of friction, wrap angle and rope tension between the wire rope and a log substituted as a
tree. Testing was completed in the University of Canterbury Forestry workshop and looked at
parameters such as rope type, wrap angle, log condition and notching, and finally log diameter. It
was found that the different rope sizes have a different coefficient of friction, and the swaged and
non-swaged ropes also had different results. The coefficient of friction for each rope is calculated
and the two larger ropes are run through a manually cut U-notch to investigate the effect of the
increased contact area on the coefficient of friction. The two log diameters are compared and the
increase in diameter between the two logs has very minimal effect on the results. The validity of the
results is discussed due to the down scaled nature of the experiments compared to the forces
generated by real systems. Alongside this discussion is a review of the experimental procedure and
possible further research opportunities relating to this project.
Coefficient of Friction Investigation Jack Palmer 2
Table of Contents
ABSTRACT ................................................................................................................................................ 1
1. INTRODUCTION ............................................................................................................................... 3
2. OBJECTIVES ..................................................................................................................................... 3
3. METHODOLOGY .............................................................................................................................. 3
3.1 Literature Review .................................................................................................................... 3
3.2 Testing Preparation ................................................................................................................. 9
3.3 Testing Apparatus and Materials .......................................................................................... 10
3.4 Testing Procedure ................................................................................................................. 11
3.4.1 Wrap Angle.................................................................................................................... 13
3.4.2 Rope Loading ................................................................................................................. 15
3.4.3 Log Condition ................................................................................................................ 15
3.4.4 Log Diameter ................................................................................................................. 17
4. RESULTS......................................................................................................................................... 18
4.1 Rope Type ......................................................................................................................... 20
4.2 Wrap Angle........................................................................................................................ 21
4.3 Rope Loading ..................................................................................................................... 22
4.4 Log Condition .................................................................................................................... 24
4.5 Log Diameter ..................................................................................................................... 24
5. DISCUSSION ................................................................................................................................... 25
5.1 Theory and Experimentation ............................................................................................ 25
5.2 Result Analysis................................................................................................................... 26
5.3 Further Research ............................................................................................................... 27
6. CONCLUSION ................................................................................................................................. 28
7. REFERENCES .................................................................................................................................. 30
8. ACKNOWLEDGEMENTS ................................................................................................................. 30
9. APPENDICES .................................................................................................................................. 31
Coefficient of Friction Investigation Jack Palmer 3
1. INTRODUCTION
Wire ropes have been used in the logging industry for decades. The most common use for these
ropes is within cable logging systems. In general, these ropes are used to pull logs from where they
are felled to a landing. Cable logging systems generally involve a skyline with some butt rigging and
chokers or a mechanical grapple, therefore cables are rarely run along the ground or around
obstacles. A relatively recent invention in the logging industry is the winch-assisted felling machine.
This system typically includes three machines. The first is a winch machine such as a dozer or a
digger, the second is a felling machine and third a wire rope. This wire rope connects the two
machines and is now used in an environment which is a lot harsher than standard cable logging. This
is due to the fact that these cables get pulled along the ground and around trees. When wrapping a
cable around a tree, there is a difference in the tension between the two ends of the cable in contact
with the tree. The tree applies a resultant normal force and therefore a frictional force into the
cable. The tree is acting in a similar way to a capstan or bollard and therefore Eytelwein's (or
Capstan) equation can be used to estimate the coefficient of friction if the tension on both sides of
the tree are known alongside the wrap angle of the rope. We can use this equation to look into
improving our knowledge of the relationship between a wire rope and the exterior of a tree. It is
possible to estimate a static coefficient of friction for a wire rope on the exterior of a log by doing
some laboratory tests using a relatively simple rigging set up. Scaling this model down to a workshop
sized experiment will limit the application of these tests to the real world cable-assist situations
however it should build on a very limited area of knowledge involving wrapping wire ropes around
trees.
2. OBJECTIVES
The goal of this research project was to improve our knowledge of the behaviour between wire
ropes and trees by:
Investigating the coefficient of friction of a wire rope wrapped around the exterior of a
radiata pine log.
Explore the effect that angle, rope type, rope size, log diameter, and log condition has on the
coefficient of friction.
3. METHODOLOGY
3.1 Literature Review
A very important concept within the physical fields of static and kinetic motion is friction. Friction is
defined as “The resistance that one surface or object encounters when moving over another” by the
Coefficient of Friction Investigation Jack Palmer 4
Oxford Dictionary (Oxford Dictionary, 2016). The coefficient of friction is an important aspect when
looking at the science surrounding friction. This report will not go into specific details behind the
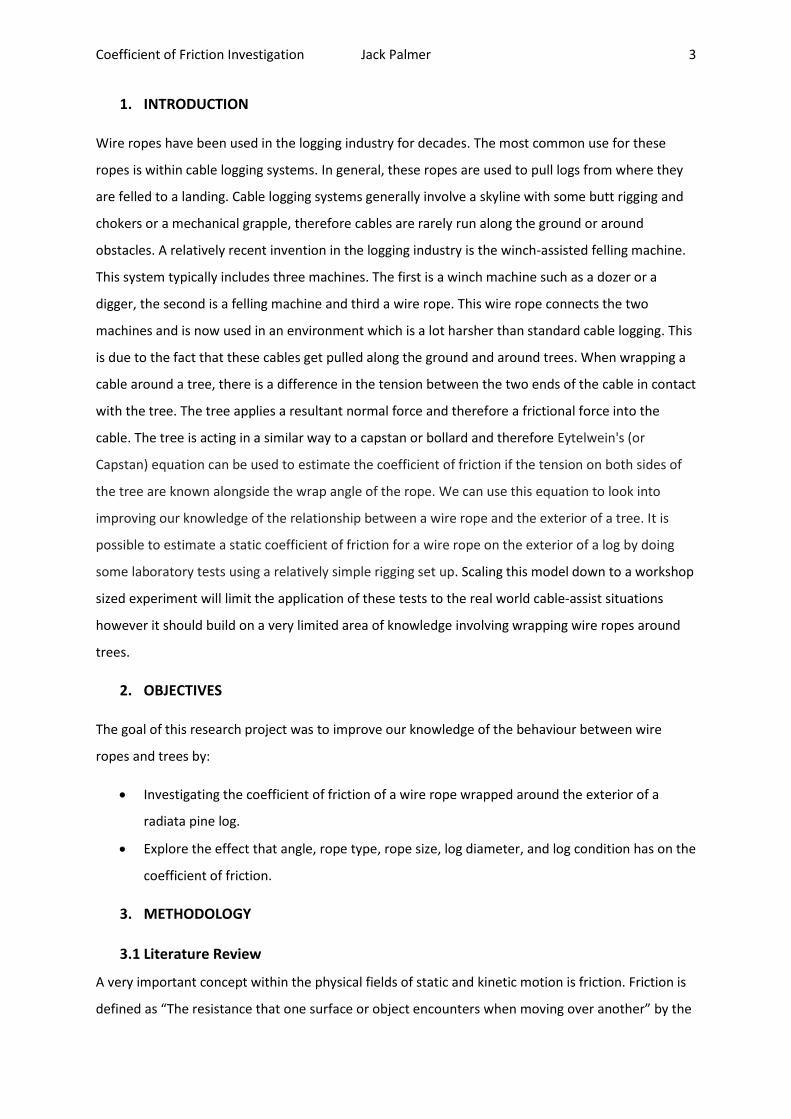
science of friction however the following diagram outlines the basic principles. These include a
contact area along which the friction force acts and the normal force acting perpendicular to the
direction of movement which acts at a certain angle (ϴ) to the force of gravity.
Figure 1: Standard friction example
A coefficient of friction is defined as “the force required to move two sliding surfaces over each
other, divided by the force holding them together.” (Dictionary.com, 2016). The frictional force
opposes the force which is moving the object and therefore acts in the opposite direction.
Wrapping a rope around a circular object is not a new practice as it has been done for many years in
industries such as mining, marine or sailing and lifting. Most industries look at wrapping ropes
around pulleys or blocks as they provide frictionless properties. A less common practice is to run a
cable around a motionless sheave however this is still generally done with a wire rope on a steel
sheave. However, industries such as marine (sailing), arboriculture and now logging must wrap
different materials around each other which leads to much higher frictional forces and a different
coefficient of friction. It is much harder to determine a coefficient of friction around a circular object
than the basic case seen in Figure 1 above. The marine industry has looked at the tension difference
when wrapping a rope around a capstan and this lead to the equation published by Eytelwein to
become more commonly known as the Capstan Equation.
Coefficient of Friction Investigation Jack Palmer 5
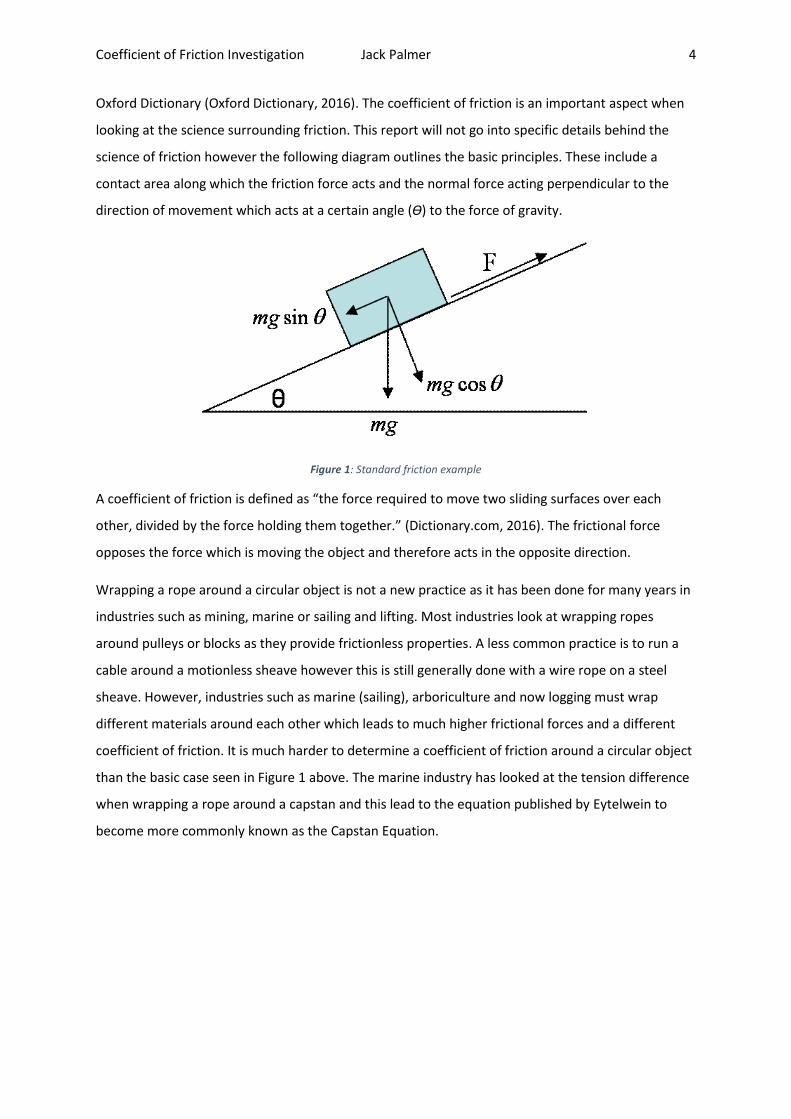
Figure 2: Free body diagram of a winch system with a cable wrapping around the exterior of a circular object. This relates the fundamental ideas of friction to a circular surface. Retrieved (Fulton, 2005).
The capstan equation is derived from Figure 2 above and relates the basic principles seen in Figure 1
to a circular surface with a wire wrapped around it. The relationship is used in multiple marine
applications such as mooring or rope rescue. The equation is as follows (Chaplin, 1995):
𝑇2 = 𝑇1𝑒𝜇𝜃
Where:
𝑇2 is equal to the tension applied in the direction the rope is moving.
𝑇1 is equal to the resulting tension.
𝜇 is equal to the friction coefficient of the sliding surface.
𝜃 is equal to the angle that the rope is wrapped around the tree in radians.
The equation outlines that there is a direct relationship between the tensions in the rope, the
coefficient of friction and the total angle of contact. These parameters are what appear to effect the
friction force. This means that the solution is independent of the radius of bend and the size of the

Coefficient of Friction Investigation Jack Palmer 6
rope. However, the friction of a rope between a rope and sheave can differ by a lot depending on
the rope conditions (Attaway, 1999).
The same equation has been used for wire ropes in mine shafts to calculate the holding force of a
winch as the rope winds further onto the drum. The variation in tensions are locked in as the rope
takes its position wrapped around the drum and the change is balanced by the frictional force
determined by the same capstan equation (Chaplin, 1995).
Research suggests that friction coefficients vary with loads, sliding speeds and contact pressure
however these need to vary substantially to influence friction coefficients. Material properties of the
surfaces in contact are a large influence on the friction coefficients (Kane, 2007). A study done on
the ropes used in arboriculture being wrapped around cambium rings used the same method
proposed in this project to define the frictional coefficient- both static and kinetic- of synthetic
arborist ropes on metal cambium rings. The test was done by applying increasingly known weights to
the rope until it moved with the resulting tension monitored by a load cell. The point of movement
occurred just after the maximum static coefficient of friction which coincides with the maximum
load applied (Kane, 2007). This study did not collect any data about the coefficient of friction of the
ropes on the tree branches themselves and noted that it would require further testing to do so.
The capstan equation has only been applied once before in quotable literature within the logging
industry. The paper written by Kimbell (1981) involved wrapping a wire rope skyline 360 degrees
around a stump and then back to a tie-back stump and then measuring the tension difference on
either side of the stump. Kimbell (1981) looked at the coefficient of static friction for 3/4 and 7/16
inch diameter rope when wrapped around a stump inside a notch. This is a very useful piece of
literature as it concludes that in certain testing situations, the cable diameter does influence the
coefficient of static friction as a 0.25 inch increase in cable diameter will increase the coefficient of
static friction by approximately 0.0144 (Kimbell, 1981). This was determined by applying the results
found and then inputting them into a modelling software and looking at the regression found.
One large difference between Kimbell’s (1981) study and my research proposal is the inclusion of a
notch, which potentially means the cable diameter has a larger effect than if it was just running
alongside the exterior of a tree due to the increased contact area against the tree. This could be an
anomaly which contradicts the Attaway study claiming the friction coefficient is independent of the
cable size (Attaway, 1999). The study used an adaptation of the equation to incorporate the fact that
their test was using a notch in the stump:
𝑇2 = 𝑇1𝑒𝜇𝜃
sin(𝛽)
Coefficient of Friction Investigation Jack Palmer 7
The sin(β) term incorporates the interior angle of the stump and applies this to the wrap angle and
coefficient of friction factor due to the large influence in the determining the results.
Another paper looked into the synthetic ropes used in the marine industry and used the capstan
equation for a pair of capstans on a wharf. Brown (1977) determined the required amount of wraps
needed to hold specified tensions with a known coefficient of friction, proving that the equation can
be used in a multitude of applications. This means that if the coefficient of friction is known it can be
used to calculate both the tensions and the required amount of wrap to achieve the desired results.
Using synthetic ropes is a much more common practice as they are a widely used in sailing. Flexible
synthetic ropes are wrapped arounds winches and capstans for rigging. Winch design and efficiency
has long been an aspect of competitive sailing, therefore understanding the relationship between
the capstan and rope has been researched multiple times.
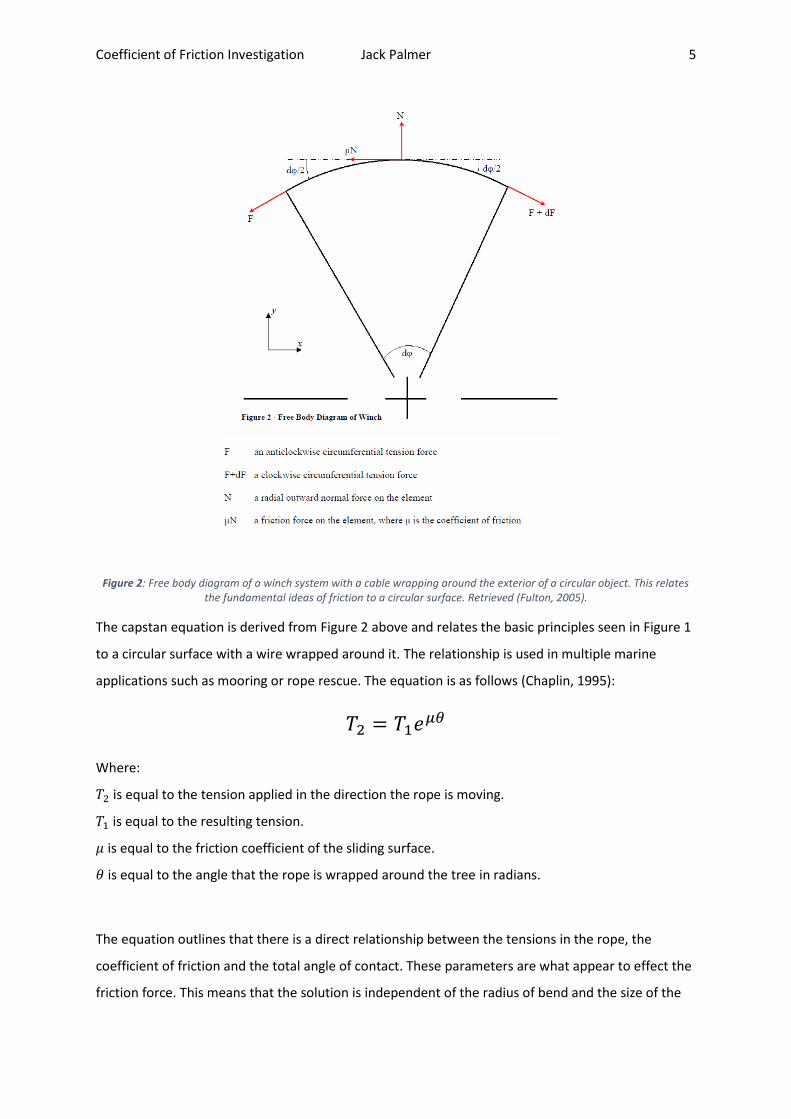
There are many different types of winches used in sailing and Murray Walker looks at the capstan
equation as a method of investigating their performance (Walker, 2006). Parameters such as rope
cross section and winch type were investigated using the set up seen in Figure 3.
Figure 3: Test rig set up used to investigate ropes on winches using the capstan equation (Walker, 2006).
This study used the above set up to estimate the coefficient of friction of the rope on the winch by
incorporating the known tensions and wrap angle into the capstan equation. It was used to compare
three rope types each with three rope sizes. Another study uses this same set up to investigate the
relationship between capstan surface and coefficient of friction by using wrap angle and two known
tensions.
Coefficient of Friction Investigation Jack Palmer 8
The study found that knurled and horizontally grooved surfaces have a higher coefficient of friction
than the equivalent smooth surfaces with coefficients of frictions ranging between 0.1 and 0.2
(Cameron-White, 2007). The author also found that after a wrap angle of 420 degrees
(approximately 1.2 full wraps) the coefficient of friction started to decrease in value. This result was
put down to experimental or human error.
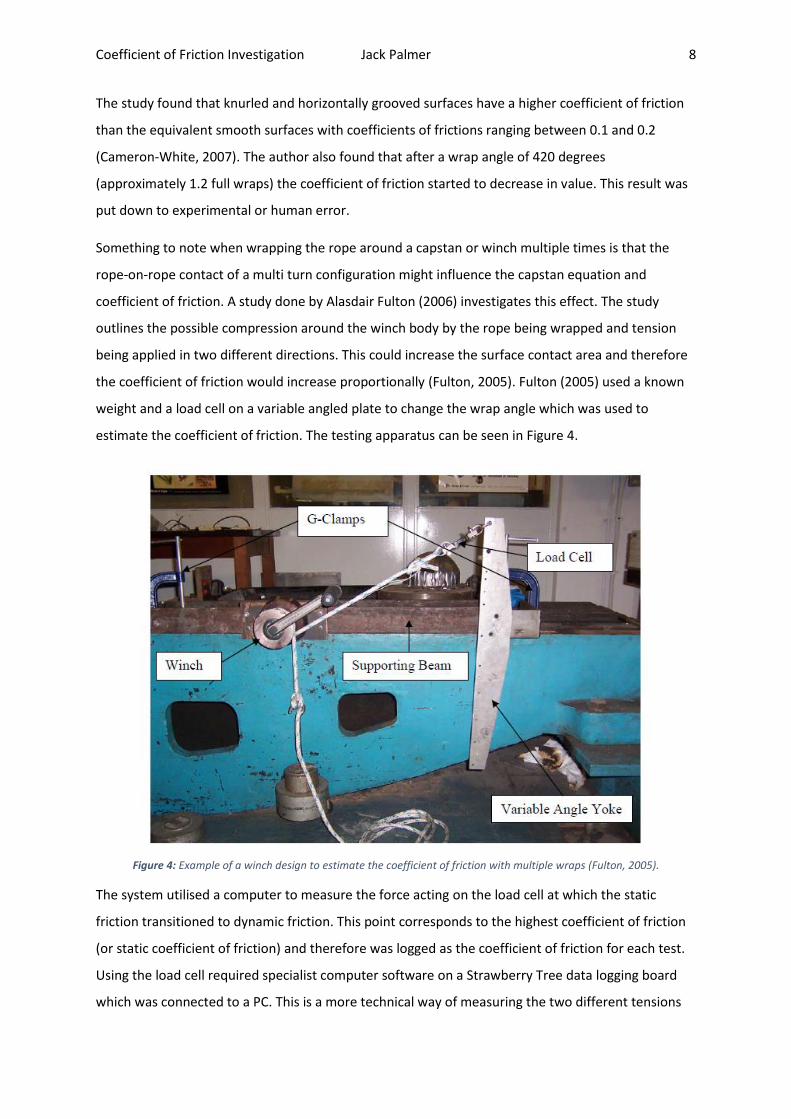
Something to note when wrapping the rope around a capstan or winch multiple times is that the
rope-on-rope contact of a multi turn configuration might influence the capstan equation and
coefficient of friction. A study done by Alasdair Fulton (2006) investigates this effect. The study
outlines the possible compression around the winch body by the rope being wrapped and tension
being applied in two different directions. This could increase the surface contact area and therefore
the coefficient of friction would increase proportionally (Fulton, 2005). Fulton (2005) used a known
weight and a load cell on a variable angled plate to change the wrap angle which was used to
estimate the coefficient of friction. The testing apparatus can be seen in Figure 4.
Figure 4: Example of a winch design to estimate the coefficient of friction with multiple wraps (Fulton, 2005).
The system utilised a computer to measure the force acting on the load cell at which the static
friction transitioned to dynamic friction. This point corresponds to the highest coefficient of friction
(or static coefficient of friction) and therefore was logged as the coefficient of friction for each test.
Using the load cell required specialist computer software on a Strawberry Tree data logging board
which was connected to a PC. This is a more technical way of measuring the two different tensions
Coefficient of Friction Investigation Jack Palmer 9
on either rope as the winch had to be cranked in this particular test. For the testing done in my
honours project, adding weight to one end to the point of slippage will achieve the same results.
All the studies above follow a similar outline and use the capstan equation which is encouraging for
the validity of my testing procedure. All the studies look at calculating the coefficient of friction using
this same equation, whether with a notch or not.
3.2 Testing Preparation
The initial part of this project involved investigating previous literature which looked into wrapping
cables around motionless sheaves such as capstans and bollards or even trees to define projects or
research that had been done to date. None of these papers investigating wrapped a wire rope
around the exterior of a tree. However, the previous study on anchor tie backs for hauler rigging
provided a starting point to build upon. In this case, the cable was inserted into a notch and the
tension was monitored on either side of the stump. All the studies incorporated the capstan
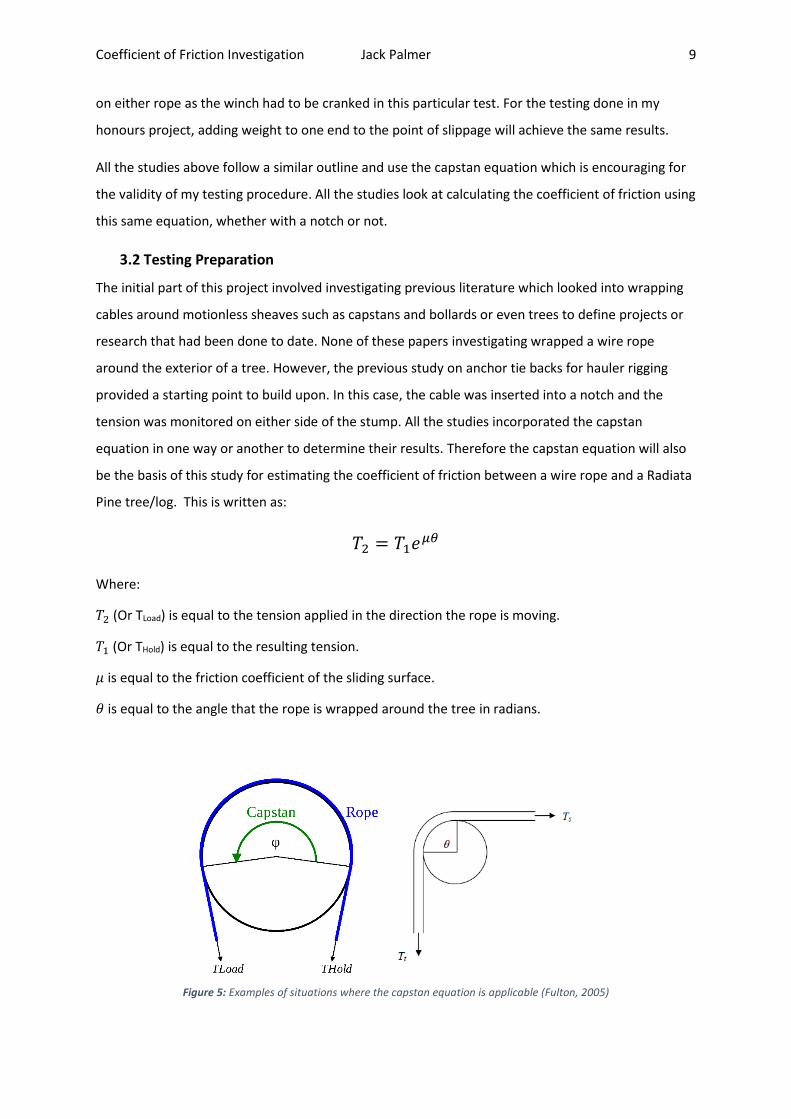
equation in one way or another to determine their results. Therefore the capstan equation will also
be the basis of this study for estimating the coefficient of friction between a wire rope and a Radiata
Pine tree/log. This is written as:
𝑇2 = 𝑇1𝑒𝜇𝜃
Where:
𝑇2 (Or TLoad) is equal to the tension applied in the direction the rope is moving.
𝑇1 (Or THold) is equal to the resulting tension.
𝜇 is equal to the friction coefficient of the sliding surface.
𝜃 is equal to the angle that the rope is wrapped around the tree in radians.
Figure 5: Examples of situations where the capstan equation is applicable (Fulton, 2005)

Coefficient of Friction Investigation Jack Palmer 10
3.3 Testing Apparatus and Materials
Testing was done in the Forestry workshop in a similar set up to those outlined in the found
literature. Using the workshop meant that the roof mounted crane could be used in place of the
engine crane that was initially going to be used. This meant a testing procedure and health and
safety outline had to be written up and submitted to the workshop supervisors Nigel Pink and
Lachlan Kirk. A sketch of the system was submitted with this plan so that the workshop supervisors
could set up a testing station that was strong and stable enough to ensure safe operation of the
equipment.
Instead of monitoring tension with a tension monitor, an easier and faster method involved
weighing the extra weight that was added to move the system at one end. The log was screwed into
a piece of ply attached to a table which was bolted into the ground to avoid table movement when
the cable was put under tension. To stop the crane from moving, it was stropped back to anchor
points which left the system in equilibrium. The set up can be seen In Figure 7 below.
By using a pulley that was well lubricated, the tension on either side of the ‘frictionless’ pulley could
be assumed to be equal, therefore the tension known below the pulley would be the same as the
horizontal rope touching the log.
Sandbags were used as the weights in these tests. Bags were measured out at 25kg and tied up and
regularly checked to ensure they hadn’t changed weight with a change in moisture content. Using
two bags on either side loaded the wire rope up to 100kg of overall tension (50kg either side), while
four bags on either side was used for the 200 kg loading scenarios (100kg either side).
Figure 6: Testing Apparatus Set Up
With this set up it was possible to test more than one rope type, so therefore 3 ropes were
purchased from Bridon. Three ropes were bought to be tested- one 13mm (1/2”) Blue Strand
Coefficient of Friction Investigation Jack Palmer 11
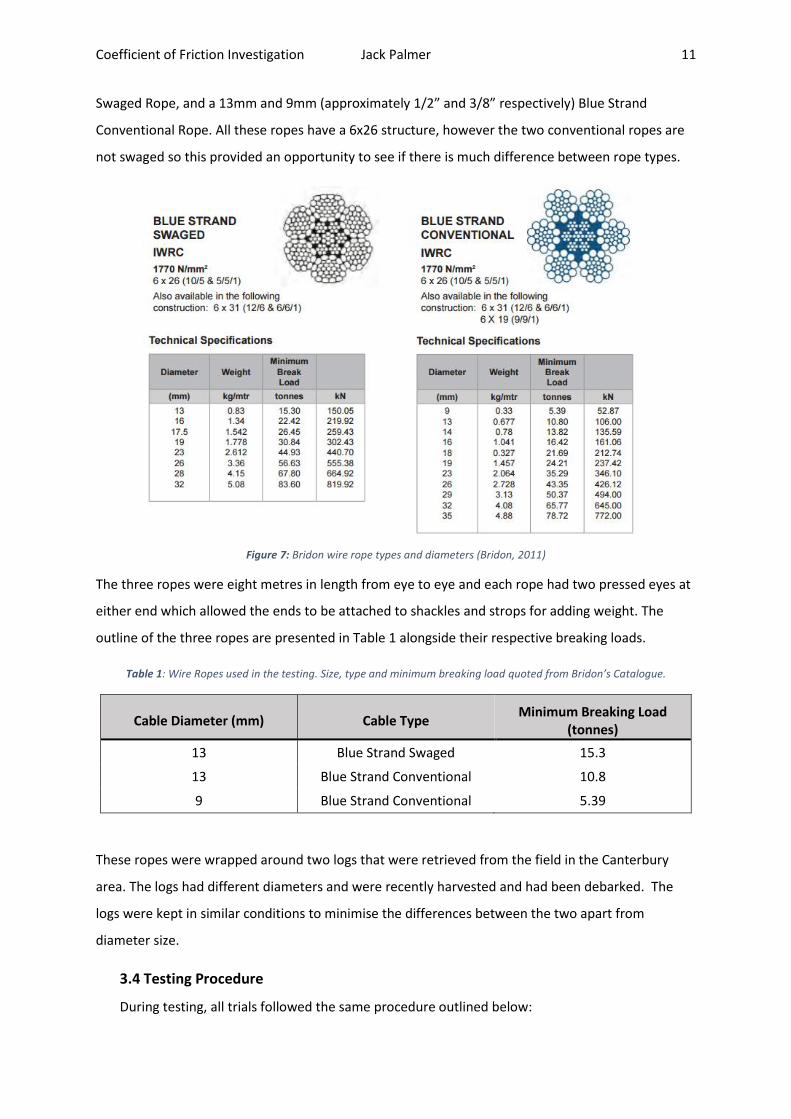
Swaged Rope, and a 13mm and 9mm (approximately 1/2” and 3/8” respectively) Blue Strand
Conventional Rope. All these ropes have a 6x26 structure, however the two conventional ropes are
not swaged so this provided an opportunity to see if there is much difference between rope types.
Figure 7: Bridon wire rope types and diameters (Bridon, 2011)
The three ropes were eight metres in length from eye to eye and each rope had two pressed eyes at
either end which allowed the ends to be attached to shackles and strops for adding weight. The
outline of the three ropes are presented in Table 1 alongside their respective breaking loads.
Table 1: Wire Ropes used in the testing. Size, type and minimum breaking load quoted from Bridon’s Catalogue.
Cable Diameter (mm) Cable Type Minimum Breaking Load
(tonnes)
13 Blue Strand Swaged 15.3
13 Blue Strand Conventional 10.8
9 Blue Strand Conventional 5.39
These ropes were wrapped around two logs that were retrieved from the field in the Canterbury
area. The logs had different diameters and were recently harvested and had been debarked. The
logs were kept in similar conditions to minimise the differences between the two apart from
diameter size.
3.4 Testing Procedure
During testing, all trials followed the same procedure outlined below:

Coefficient of Friction Investigation Jack Palmer 12
1. Apply small increments of weight to the side under the crane.
2. Use sand as a smaller incremental change if needed.
3. Apply weight until system slips. The rope will slip in the direction of the weight applied,
moving the weight at the crane end downwards and the weight at the log end upwards. The
movement will cause the weight to fall and hit the ground, which will signal the end of the
test.
4. Repeat set up for second trial.
Steps one and two were done by adding metal weights to add the majority of the weight, followed
by filling bags up with sand to reach the point of slippage. An example of this can be seen in Figure 9
below.
Figure 8: Example of the weight applied to crane end to cause the system to move with 100kg starting weight on either side
The above example shows the extra weight that was applied to move the system with a 200kg
loading in the rope. The black bags contain 100kg of sand, the two green strops weighed one
kilogram each, and then large metal weights were added to get closer to the slipping point. The two
white bags were then filled with sand until the system moved. All these items were weighed on the
workshop scales and the result recorded down. For each set up, a minimum of 3 trials was
completed so that the average amount of added weight could be calculated for each scenario.

Coefficient of Friction Investigation Jack Palmer 13
The test set up changed to investigate the effects of loading, wrap angle, log diameter, rope type
and log condition.
3.4.1 Wrap Angle
To investigate the effect of wrap angle on the coefficient of friction, the 3 ropes were tested at a
wrap angle of 90 degrees and 45 degrees. To obtain a 90 degree wrap angle, the pulley was kept
level with the height of the log so that the total contact angle was as close to 90 degrees as possible.
Figure 9: Testing set up at 90 degree wrap angle
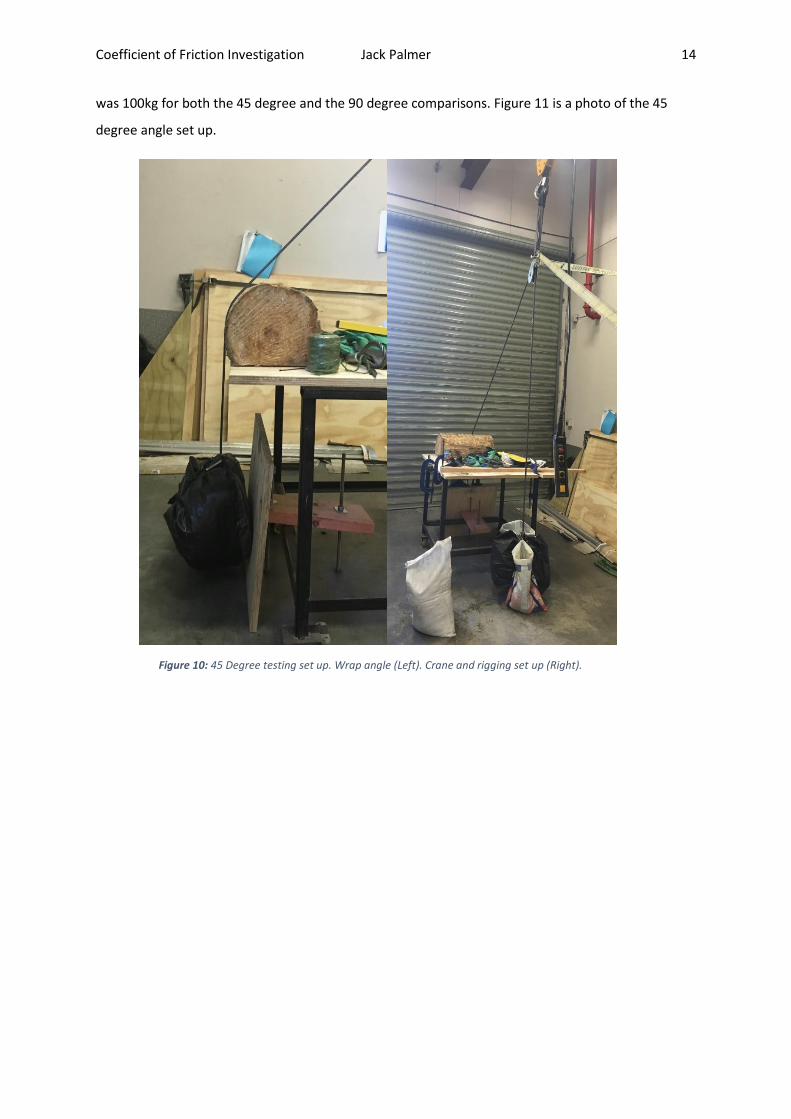
To set up for a 45 degree wrap angle the pulley was lifted higher up using the crane so that the rope
left the log at an angle very close to 45 degrees. This meant that the internal wrap angle of the rope
will be approximately 45 degrees and therefore it would be possible to see the difference in weight
required to move the system in comparison to the 90 degree wrap angle. These comparisons were
done with 50kg attached to either end of the rope. This meant that the total loading in the wire rope
Coefficient of Friction Investigation Jack Palmer 14
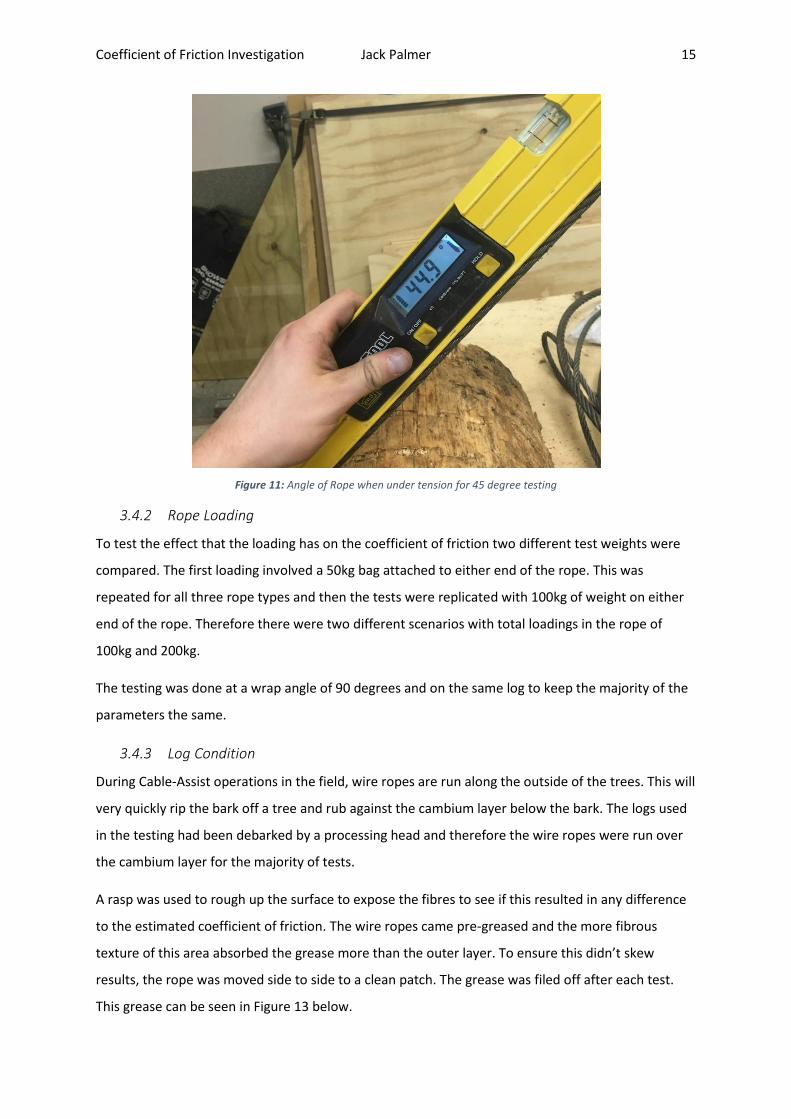
was 100kg for both the 45 degree and the 90 degree comparisons. Figure 11 is a photo of the 45
degree angle set up.
Figure 10: 45 Degree testing set up. Wrap angle (Left). Crane and rigging set up (Right).
Coefficient of Friction Investigation Jack Palmer 15
Figure 11: Angle of Rope when under tension for 45 degree testing
3.4.2 Rope Loading
To test the effect that the loading has on the coefficient of friction two different test weights were
compared. The first loading involved a 50kg bag attached to either end of the rope. This was
repeated for all three rope types and then the tests were replicated with 100kg of weight on either
end of the rope. Therefore there were two different scenarios with total loadings in the rope of
100kg and 200kg.
The testing was done at a wrap angle of 90 degrees and on the same log to keep the majority of the
parameters the same.
3.4.3 Log Condition
During Cable-Assist operations in the field, wire ropes are run along the outside of the trees. This will
very quickly rip the bark off a tree and rub against the cambium layer below the bark. The logs used
in the testing had been debarked by a processing head and therefore the wire ropes were run over
the cambium layer for the majority of tests.
A rasp was used to rough up the surface to expose the fibres to see if this resulted in any difference
to the estimated coefficient of friction. The wire ropes came pre-greased and the more fibrous
texture of this area absorbed the grease more than the outer layer. To ensure this didn’t skew
results, the rope was moved side to side to a clean patch. The grease was filed off after each test.
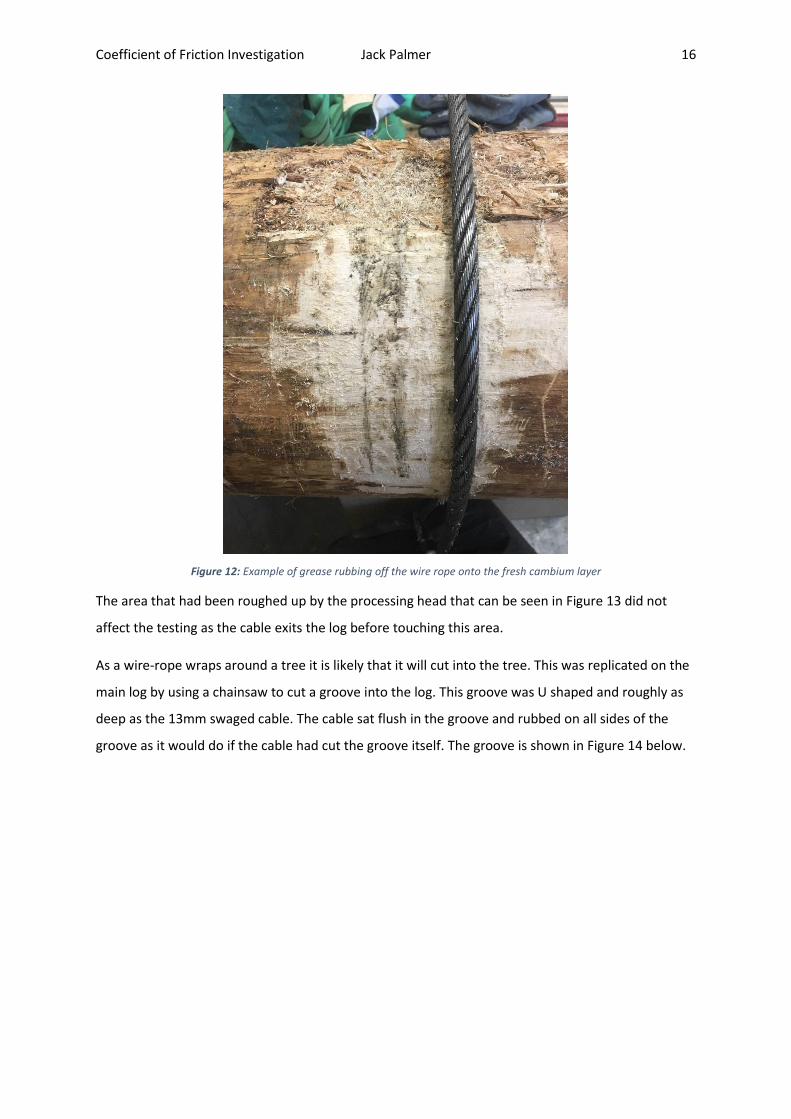
This grease can be seen in Figure 13 below.
Coefficient of Friction Investigation Jack Palmer 16
Figure 12: Example of grease rubbing off the wire rope onto the fresh cambium layer
The area that had been roughed up by the processing head that can be seen in Figure 13 did not
affect the testing as the cable exits the log before touching this area.
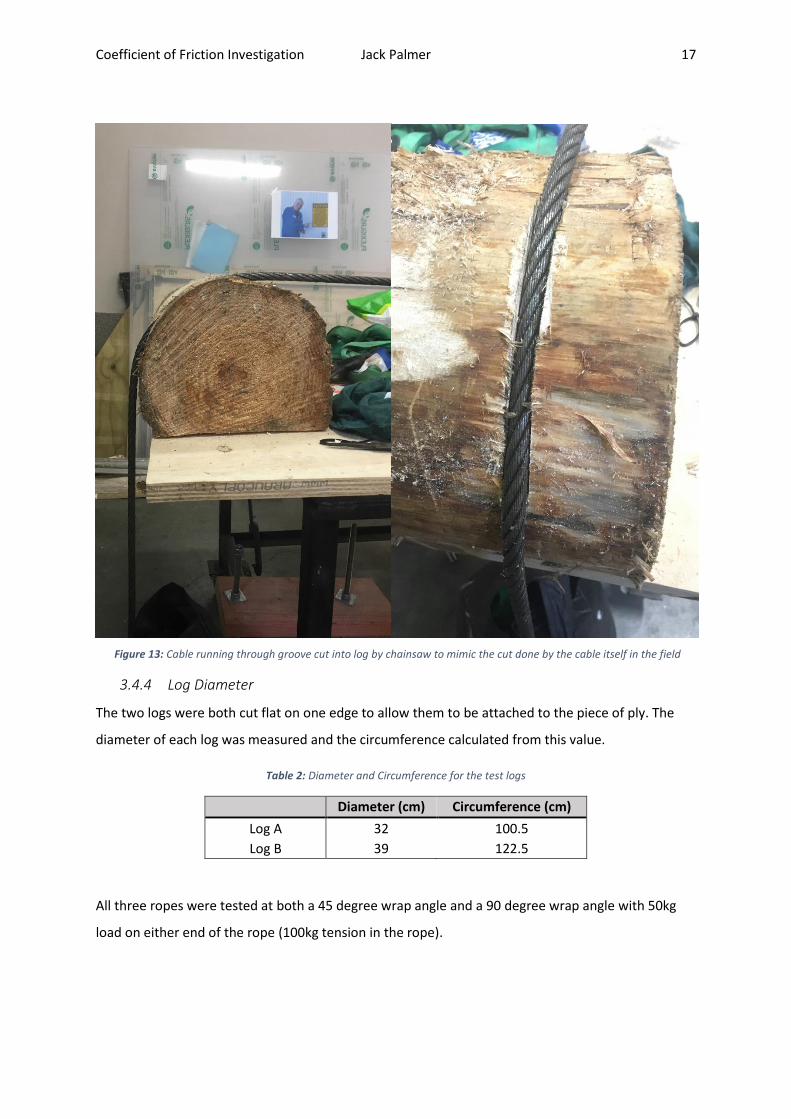
As a wire-rope wraps around a tree it is likely that it will cut into the tree. This was replicated on the
main log by using a chainsaw to cut a groove into the log. This groove was U shaped and roughly as
deep as the 13mm swaged cable. The cable sat flush in the groove and rubbed on all sides of the
groove as it would do if the cable had cut the groove itself. The groove is shown in Figure 14 below.
Coefficient of Friction Investigation Jack Palmer 17
3.4.4 Log Diameter
The two logs were both cut flat on one edge to allow them to be attached to the piece of ply. The
diameter of each log was measured and the circumference calculated from this value.
Table 2: Diameter and Circumference for the test logs
Diameter (cm) Circumference (cm)
Log A 32 100.5
Log B 39 122.5
All three ropes were tested at both a 45 degree wrap angle and a 90 degree wrap angle with 50kg
load on either end of the rope (100kg tension in the rope).
Figure 13: Cable running through groove cut into log by chainsaw to mimic the cut done by the cable itself in the field
Coefficient of Friction Investigation Jack Palmer 18
4. RESULTS
The results of the tests explained above are outlined below. The coefficients of friction are
calculated using the capstan equation:
𝑇2 = 𝑇1𝑒𝜇𝜃
T1 ,T2 and ϴ are all measured during the tests so it is possible to rearrange this equation for μ:
𝜇 =𝑙𝑛 (
𝑇2𝑇1)
𝜃
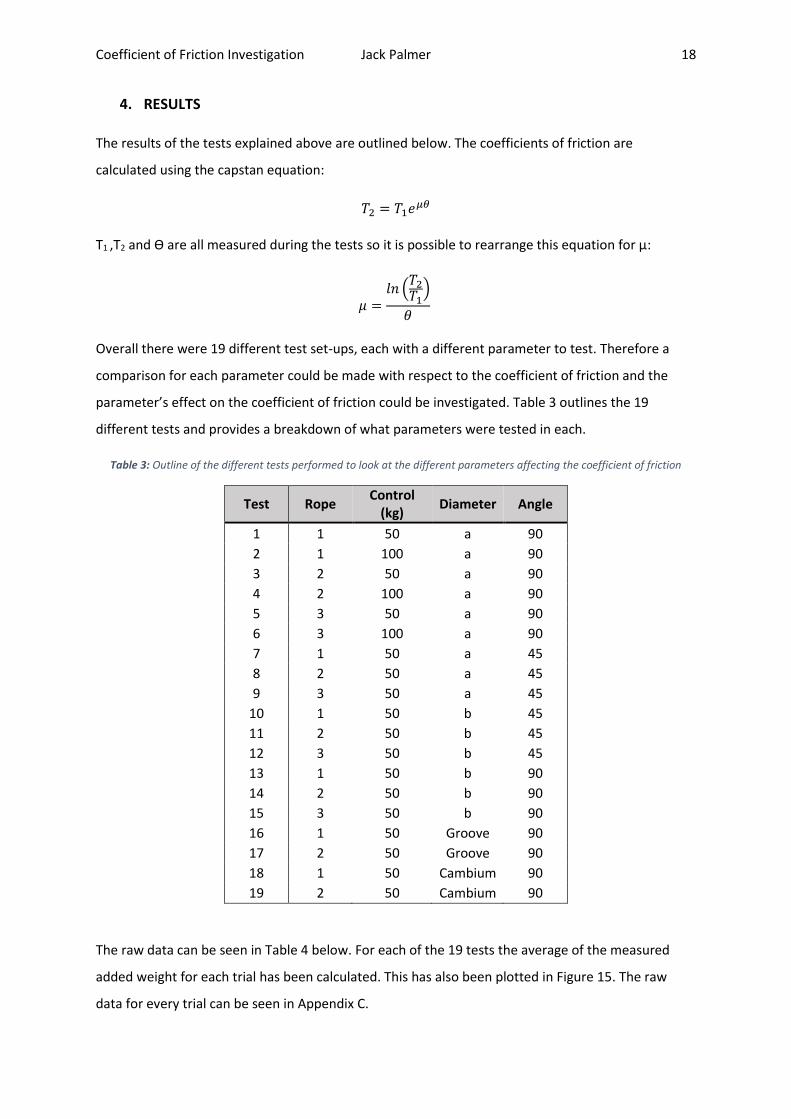
Overall there were 19 different test set-ups, each with a different parameter to test. Therefore a
comparison for each parameter could be made with respect to the coefficient of friction and the
parameter’s effect on the coefficient of friction could be investigated. Table 3 outlines the 19
different tests and provides a breakdown of what parameters were tested in each.
Table 3: Outline of the different tests performed to look at the different parameters affecting the coefficient of friction
Test Rope Control
(kg) Diameter Angle
1 1 50 a 90
2 1 100 a 90
3 2 50 a 90
4 2 100 a 90
5 3 50 a 90
6 3 100 a 90
7 1 50 a 45
8 2 50 a 45
9 3 50 a 45
10 1 50 b 45
11 2 50 b 45
12 3 50 b 45
13 1 50 b 90
14 2 50 b 90
15 3 50 b 90
16 1 50 Groove 90
17 2 50 Groove 90
18 1 50 Cambium 90
19 2 50 Cambium 90
The raw data can be seen in Table 4 below. For each of the 19 tests the average of the measured
added weight for each trial has been calculated. This has also been plotted in Figure 15. The raw
data for every trial can be seen in Appendix C.
Coefficient of Friction Investigation Jack Palmer 19
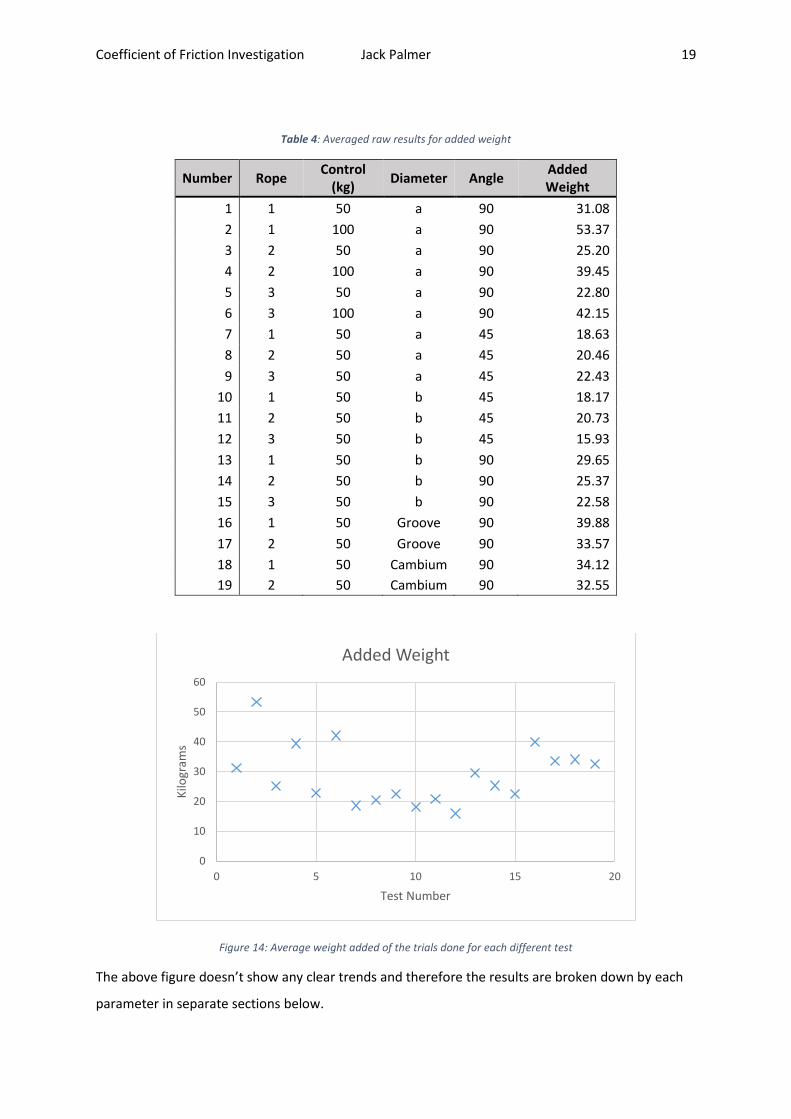
Table 4: Averaged raw results for added weight
Number Rope Control
(kg) Diameter Angle
Added Weight
1 1 50 a 90 31.08
2 1 100 a 90 53.37
3 2 50 a 90 25.20
4 2 100 a 90 39.45
5 3 50 a 90 22.80
6 3 100 a 90 42.15
7 1 50 a 45 18.63
8 2 50 a 45 20.46
9 3 50 a 45 22.43
10 1 50 b 45 18.17
11 2 50 b 45 20.73
12 3 50 b 45 15.93
13 1 50 b 90 29.65
14 2 50 b 90 25.37
15 3 50 b 90 22.58
16 1 50 Groove 90 39.88
17 2 50 Groove 90 33.57
18 1 50 Cambium 90 34.12
19 2 50 Cambium 90 32.55
Figure 14: Average weight added of the trials done for each different test
The above figure doesn’t show any clear trends and therefore the results are broken down by each
parameter in separate sections below.
0
10
20
30
40
50
60
0 5 10 15 20
Kilo
gram
s
Test Number
Added Weight
Coefficient of Friction Investigation Jack Palmer 20
4.1 Rope Type
At least 3 trials were conducted per test set and the coefficient of friction was calculated for each
trial. The average of these results was then calculated and recorded as the coefficient of friction for
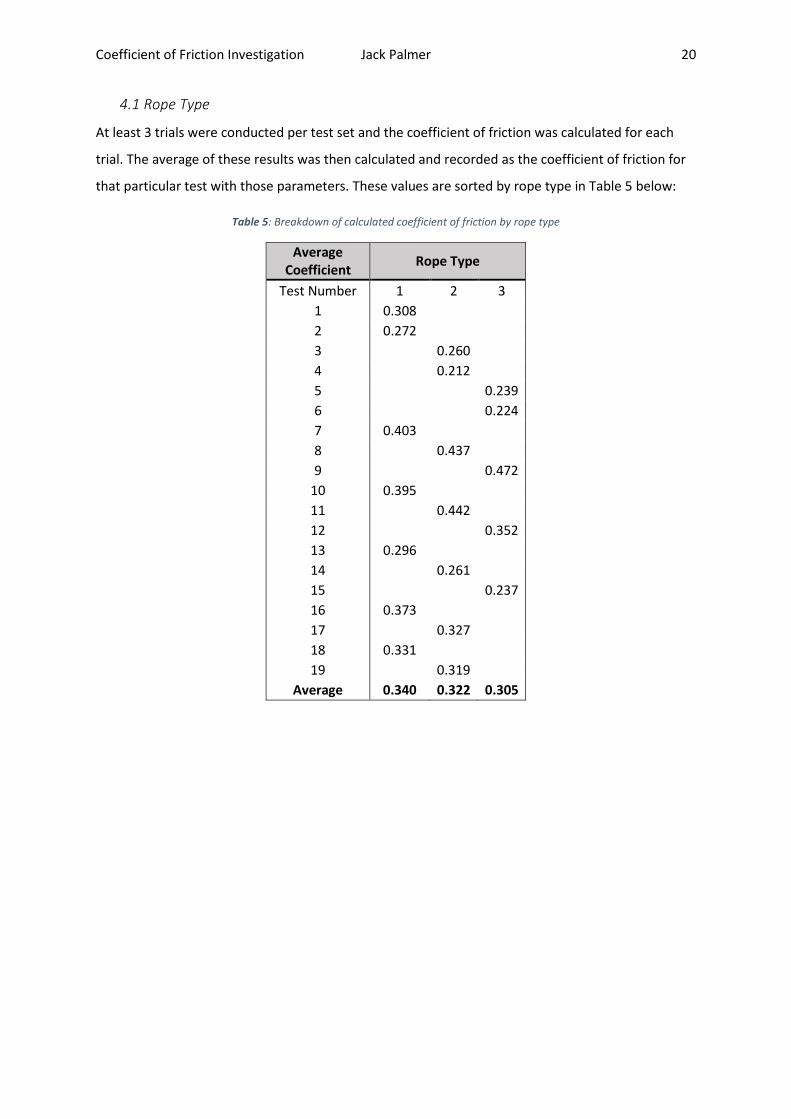
that particular test with those parameters. These values are sorted by rope type in Table 5 below:
Table 5: Breakdown of calculated coefficient of friction by rope type
Average Coefficient
Rope Type
Test Number 1 2 3
1 0.308
2 0.272
3 0.260
4 0.212
5 0.239
6 0.224
7 0.403
8 0.437
9 0.472
10 0.395
11 0.442
12 0.352
13 0.296
14 0.261
15 0.237
16 0.373
17 0.327
18 0.331
19 0.319
Average 0.340 0.322 0.305

Coefficient of Friction Investigation Jack Palmer 21
Figure 15: Box and Whisker Plot of the Coefficients of Friction by Rope Type. This plot illustrates the Maximum, 75th Quartile, Average, 25th Quartile and the Minimum values for each data set.
The mean coefficient of friction is the highest for the swaged rope. As expected the smallest rope
has the smallest coefficient of friction as it has the least contact area between the two materials.
4.2 Wrap Angle
The wrap angle was compared with a loading of 50 kilograms on either end of the rope and tests
were completed on both log A and log B. To compare between wrap angles, the tests that were
done with 100kg loading on each end of the rope with a 90 degree wrap angle and the tests that
were done with different log conditions have been removed. This is done so that the only parameter
compared is the wrap angle on the two different logs.
Table 6: Wrap angle comparison of all ropes on both logs with 50kg loading on each end of the rope.
Average Coefficient
Wrap Angle
Test Number 45 90
1 0.308
3 0.260
5 0.239
7 0.403
8 0.437
9 0.472
10 0.395
11 0.442
12 0.352
13 0.296
14 0.261
15 0.237
Average 0.417 0.267
0.2
0.25
0.3
0.35
0.4
0.45
0.5
1 2 3
Co
effi
cien
t o
f Fr
icti
on
Rope Type
Distribution of Coefficient of Friction by Rope Type
Coefficient of Friction Investigation Jack Palmer 22
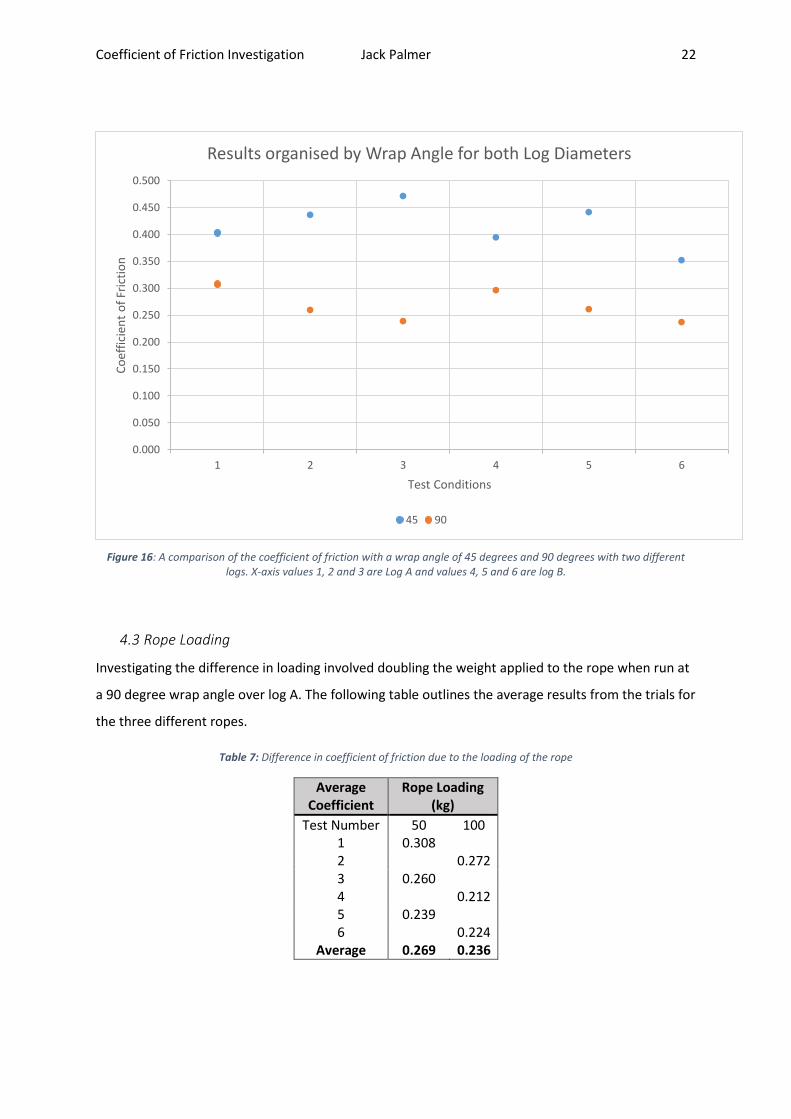
Figure 16: A comparison of the coefficient of friction with a wrap angle of 45 degrees and 90 degrees with two different logs. X-axis values 1, 2 and 3 are Log A and values 4, 5 and 6 are log B.
4.3 Rope Loading
Investigating the difference in loading involved doubling the weight applied to the rope when run at
a 90 degree wrap angle over log A. The following table outlines the average results from the trials for
the three different ropes.
Table 7: Difference in coefficient of friction due to the loading of the rope
Average Coefficient
Rope Loading (kg)
Test Number 50 100 1 0.308 2 0.272 3 0.260 4 0.212 5 0.239 6 0.224
Average 0.269 0.236
0.000
0.050
0.100
0.150
0.200
0.250
0.300
0.350
0.400
0.450
0.500
1 2 3 4 5 6
Co
effi
cien
t o
f Fr
icti
on
Test Conditions
Results organised by Wrap Angle for both Log Diameters
45 90
Coefficient of Friction Investigation Jack Palmer 23
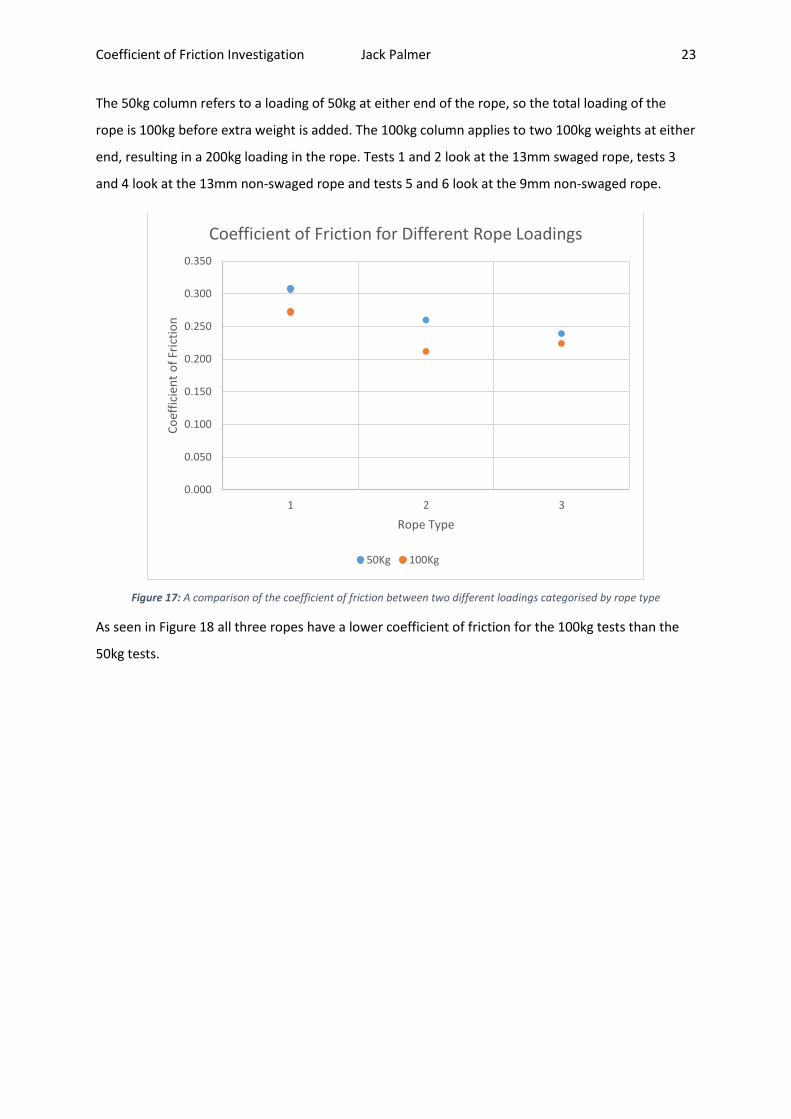
The 50kg column refers to a loading of 50kg at either end of the rope, so the total loading of the
rope is 100kg before extra weight is added. The 100kg column applies to two 100kg weights at either
end, resulting in a 200kg loading in the rope. Tests 1 and 2 look at the 13mm swaged rope, tests 3
and 4 look at the 13mm non-swaged rope and tests 5 and 6 look at the 9mm non-swaged rope.
Figure 17: A comparison of the coefficient of friction between two different loadings categorised by rope type
As seen in Figure 18 all three ropes have a lower coefficient of friction for the 100kg tests than the
50kg tests.
0.000
0.050
0.100
0.150
0.200
0.250
0.300
0.350
1 2 3
Co
effi
cien
t o
f Fr
icti
on
Rope Type
Coefficient of Friction for Different Rope Loadings
50Kg 100Kg
Coefficient of Friction Investigation Jack Palmer 24
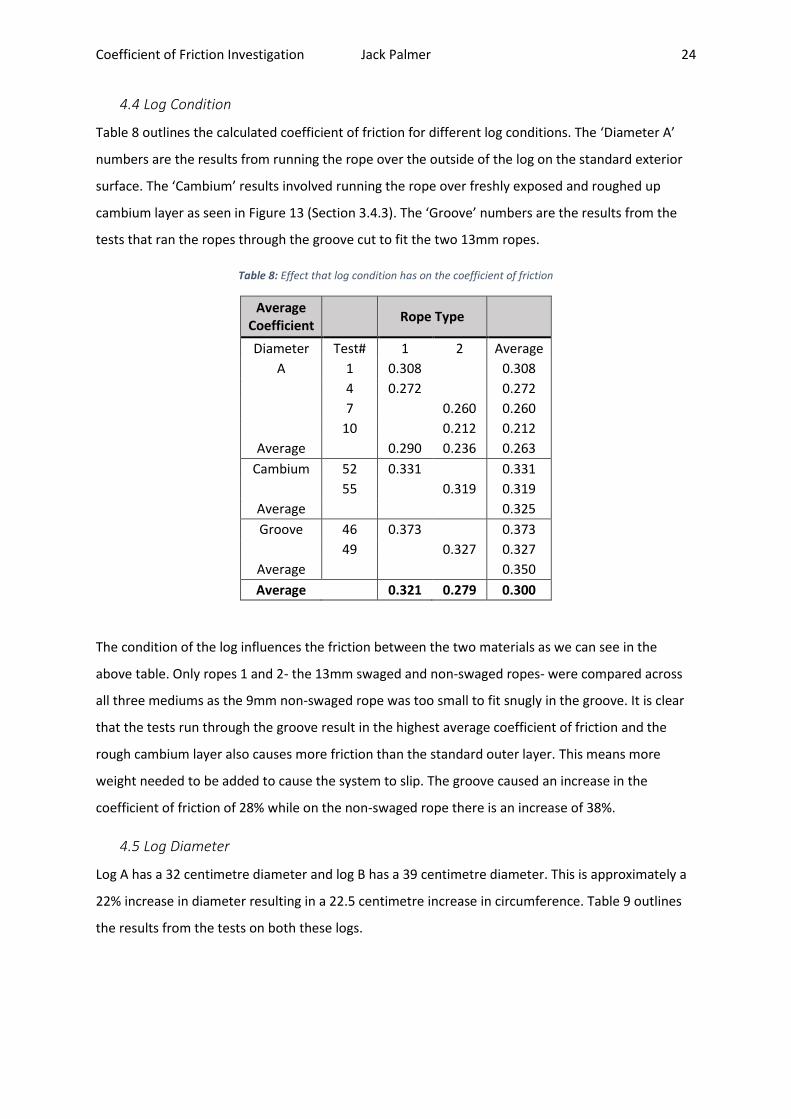
4.4 Log Condition
Table 8 outlines the calculated coefficient of friction for different log conditions. The ‘Diameter A’
numbers are the results from running the rope over the outside of the log on the standard exterior
surface. The ‘Cambium’ results involved running the rope over freshly exposed and roughed up
cambium layer as seen in Figure 13 (Section 3.4.3). The ‘Groove’ numbers are the results from the
tests that ran the ropes through the groove cut to fit the two 13mm ropes.
Table 8: Effect that log condition has on the coefficient of friction
Average Coefficient
Rope Type
Diameter Test# 1 2 Average
A 1 0.308 0.308
4 0.272 0.272
7 0.260 0.260
10 0.212 0.212
Average 0.290 0.236 0.263
Cambium 52 0.331 0.331
55 0.319 0.319
Average 0.325
Groove 46 0.373 0.373
49 0.327 0.327
Average 0.350
Average 0.321 0.279 0.300
The condition of the log influences the friction between the two materials as we can see in the
above table. Only ropes 1 and 2- the 13mm swaged and non-swaged ropes- were compared across
all three mediums as the 9mm non-swaged rope was too small to fit snugly in the groove. It is clear
that the tests run through the groove result in the highest average coefficient of friction and the
rough cambium layer also causes more friction than the standard outer layer. This means more
weight needed to be added to cause the system to slip. The groove caused an increase in the
coefficient of friction of 28% while on the non-swaged rope there is an increase of 38%.
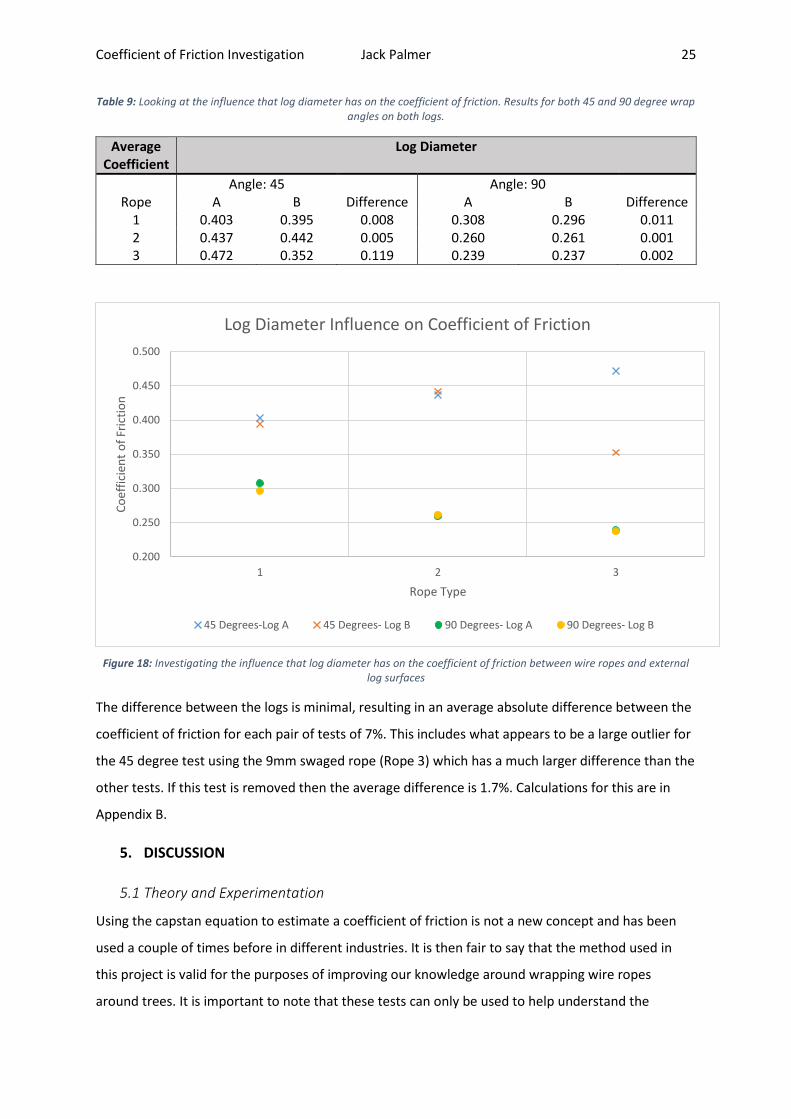
4.5 Log Diameter
Log A has a 32 centimetre diameter and log B has a 39 centimetre diameter. This is approximately a
22% increase in diameter resulting in a 22.5 centimetre increase in circumference. Table 9 outlines
the results from the tests on both these logs.
Coefficient of Friction Investigation Jack Palmer 25
Table 9: Looking at the influence that log diameter has on the coefficient of friction. Results for both 45 and 90 degree wrap angles on both logs.
Average Coefficient
Log Diameter
Angle: 45 Angle: 90 Rope A B Difference A B Difference
1 0.403 0.395 0.008 0.308 0.296 0.011 2 0.437 0.442 0.005 0.260 0.261 0.001 3 0.472 0.352 0.119 0.239 0.237 0.002
Figure 18: Investigating the influence that log diameter has on the coefficient of friction between wire ropes and external log surfaces
The difference between the logs is minimal, resulting in an average absolute difference between the
coefficient of friction for each pair of tests of 7%. This includes what appears to be a large outlier for
the 45 degree test using the 9mm swaged rope (Rope 3) which has a much larger difference than the
other tests. If this test is removed then the average difference is 1.7%. Calculations for this are in
Appendix B.
5. DISCUSSION
5.1 Theory and Experimentation
Using the capstan equation to estimate a coefficient of friction is not a new concept and has been
used a couple of times before in different industries. It is then fair to say that the method used in
this project is valid for the purposes of improving our knowledge around wrapping wire ropes
around trees. It is important to note that these tests can only be used to help understand the
0.200
0.250
0.300
0.350
0.400
0.450
0.500
1 2 3
Co
effi
cien
t o
f Fr
icti
on
Rope Type
Log Diameter Influence on Coefficient of Friction
45 Degrees-Log A 45 Degrees- Log B 90 Degrees- Log A 90 Degrees- Log B
Coefficient of Friction Investigation Jack Palmer 26
mechanics of the rope-tree relationship in a Cable-Assist system. The capstan equation has its own
limitations and furthermore can only provide an estimate for a coefficient of friction in these tests.
One of these limitations is that the capstan equation assumes the capstan to be perfectly circular
and a tree is generally never perfectly circular therefore further research is paramount. Scaling up
the tensions and stresses on the rope to the magnitude used within the field would provide a more
realistic estimation of the coefficient of friction for cable-assist systems. It is possible that the
coefficient of friction will change with high loadings as can be seen by the difference in results
testing at the two different loadings in this report.
An important limitation of the Capstan equation is the fact that it doesn’t take into consideration the
force applied by the rope on itself when a wrap angle of larger than 360 degrees occurs. Fulton
(2005) investigated this in a paper written about sailing winches where this is a common occurrence
and found that there is some difference between this scenario and a wrap angle of less than 360
degrees. This particular case is extremely unlikely to occur in a Cable-Assist situation, as the
maximum wrap angle would rarely even reach 180 degrees as this would mean the machine is
travelling back the way it came from, either uphill or across the slope while keeping the cable
wrapped around the tree.
The testing apparatus ended up being a very efficient and accurate set up. The largest hindrance was
the inability to load the system up to high weights however for the lower weights that were
measured, it worked very well. Accuracy of the results is relatively consistent as the rope angle was
measured each time using a digital level that was accurate to ± 0.1 degree. The scales used to weigh
the sand and extra weights were accurate to ± 0.05 kg. Therefore the measurement involved in the
testing was quite accurate and care was taken to avoid spilling sand and ensure no extra sand was
added to the weights by watching the rope for movement after every scoop.
At the start of the test period, both directions of movement were tested with regards to rope
movement over the log. This was done to ensure that there was no difference in the results due to
the direction the rope travelled with our testing apparatus. There was no difference between the
two directions and therefore every measured test was done the same way, with the rope moving
towards the crane end.
5.2 Result Analysis
From the results it appears that the friction coefficient comes down to the contact area between the
tree and rope. This appears to disagree with Attaway (1999) that the friction coefficient does not
depend on rope size, however the difference is evident in the comparison between the three ropes
as it appears that the flatter contact patch of the 13mm swaged rope could be the reason for a
Coefficient of Friction Investigation Jack Palmer 27
higher coefficient of friction for both the 50kg and 100kg tests. The higher ribbing of the non-swaged
rope when it is not being compressed provided a smaller contact area as the rope appeared to touch
on each strand. This meant that there were many tiny little contact patches between the rope and
the log. This may be the reason for the 5% difference in values. This is actually different to my
original hypothesis about the rope types as I believed the rough profile of the non-swaged would
provide more resistance but after testing this was proved to not be the case. This may be due to the
fact that the loading is not high enough for the rope to cut into the log itself, which would be an area
for further research. As expected, the smaller rope has a smaller coefficient of friction due to the
smaller contact area.
The results of the testing were actually slightly higher than expected as Kimbell (1982) stated a
coefficient of friction of 0.1768 however Kane (2007) found the co-efficient of friction for synthetic
arborist ropes on steel cambium saver rings to be higher with an average coefficient of friction of
0.24. When considering the materials used in this experiment, the averages hovering around the 0.3
mark seem reasonable due to the rougher nature of wood acting as a capstan than steel.
When investigating the notch that was cut into the log, it is important to note that the coefficient of
friction was higher. This is likely due to the higher contact area however it is important to note that
Kimbell (1982) investigated wrapping a rope around a tree in a V-notch. There was an adjustment to
the capstan equation which involved a β term where β was the notch angle. This only applied to a V-
notch and there was no reputable equation found for a U-notch that wasn’t regarding wrapping
rope on a pulley. The cut by the chainsaw closely resembled a U-notch and further investigation into
at U notch relationship could then be applied to the raw data found in Appendix C if a suitable
replacement equation was determined.
5.3 Further Research
This research project clearly shows that the relationship between a wire rope and a log or tree is
complicated. Further research into the effect of wire rope type on the log is important. Looking at
cables with a larger diameter or the same diameter as the ropes used in the field would be the
logical next step. This would require much larger forces and stronger gear and might need to be
tested in the field to more closely represent a real life situation as the cables themselves will be
much harder to bend around a log. Investigating different rope types, including rope lay and rope
structure could also be an area of further research.
Another area of interest could be determining how long it takes for a rope to cut into a tree, as the
results show that the ropes in the grooves that were cut returned a higher coefficient of friction. The
increase in coefficient of friction could cause issues in the field as the difference in tensions when
Coefficient of Friction Investigation Jack Palmer 28
wrapped around the tree within a groove could affect winch operation or increase the likelihood of
the tensions within the wire rope breaching the safe working load. As discussed in section 5.2,
further investigation into a U notch would be beneficial and to also investigate the general shape of
the notch that the rope cuts through repeated back and forth motion across the surface of the tree.
As this will cut in with the shape of the rope itself, it may have even more contact area than that of a
U-notch or V-notch resulting in larger coefficient of frictions and thus larger tension differences.
A final area of further research could be the investigation into much larger differences in diameter.
The capstan equation is independent of the diameter of the object that the rope is wrapping around.
While this project shows that an increase of 22% in diameter appeared to make very little difference
and reinforces this fact, there is no evidence that doubling the diameter will yield the same results as
the much larger contact area between the larger log and the wire rope could influence the results.
6. CONCLUSION
Cable-Assist is a relatively new technology which has introduced some new practices to the forestry
industry such as wrapping moving lines around trees. Doing so has introduced the need to
understand the interaction between the ropes and the trees. Exploring what happens to the tension
in these lines on either side of the tree is a big part of this problem. The intention of this project was
to investigate the interaction between a wire rope and a tree. A testing rig was fabricated in the
forestry workshop which was used to repeat multiple tests quickly and accurately. Two logs with
different diameters were obtained from a forest which had been felled relatively recently and these
were de-barked and tested with three wire ropes that were obtained from Bridon’s to study an array
of parameters with respect to the friction coefficient between these two materials.
A total of 69 tests were conducted to return an overall coefficient of friction average of 0.342 ±
0.009. This average included all three rope types from which individual averages could be calculated.
Rope 1 was a swaged 13mm rope that had an average coefficient of friction of 0.340 ± 0.019. Rope 2
was a conventional non-swaged 13mm rope with an average coefficient of friction of 0.322 ± 0.034.
Rope 3 was a 9mm conventional non-swaged rope and returned a coefficient of friction of 0.304 ±
0.048. The larger error found in the individual rope tests come from a lower number of respective
tests. An important result concluded from the tests was that running the ropes through a notch
directly affected the coefficient of friction, increasing it by 28-38% depending on the rope. A large
difference like this could directly relate to issues on a real system if tension spikes are already
reaching close to safe working loads.
Coefficient of Friction Investigation Jack Palmer 29
As expected, contact area was determined to be the major contributor to the coefficient of friction
however the 22% increase in diameter affected the coefficient of friction by only 1.7% even though
the area the rope would have been in contact with the wood would have been larger. This reinforces
the independent nature of the Capstan Equation with respect to capstan diameter, at least with
smaller increases in diameter. Further investigation into large diameter increases over 50% would be
beneficial for backing up this data.
The largest limitation of this study was the inability to replicate in-situ tensions and working loads.
Therefore a full size 7/8” or 1 1/8” cable that is used in a Cable-Assist system couldn’t be tested. This
is a good area of potential further research that could be done with tension monitors applied to a
working system in the field.
Coefficient of Friction Investigation Jack Palmer 30
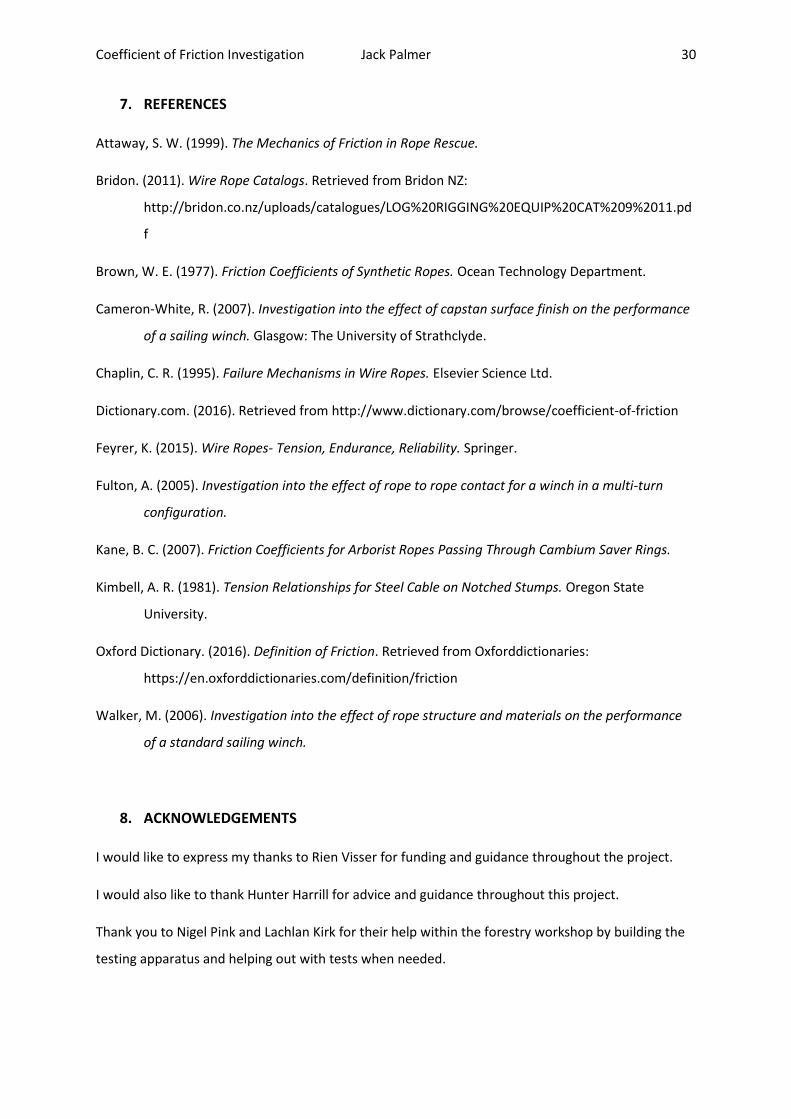
7. REFERENCES
Attaway, S. W. (1999). The Mechanics of Friction in Rope Rescue.
Bridon. (2011). Wire Rope Catalogs. Retrieved from Bridon NZ:
http://bridon.co.nz/uploads/catalogues/LOG%20RIGGING%20EQUIP%20CAT%209%2011.pd
f
Brown, W. E. (1977). Friction Coefficients of Synthetic Ropes. Ocean Technology Department.
Cameron-White, R. (2007). Investigation into the effect of capstan surface finish on the performance
of a sailing winch. Glasgow: The University of Strathclyde.
Chaplin, C. R. (1995). Failure Mechanisms in Wire Ropes. Elsevier Science Ltd.
Dictionary.com. (2016). Retrieved from http://www.dictionary.com/browse/coefficient-of-friction
Feyrer, K. (2015). Wire Ropes- Tension, Endurance, Reliability. Springer.
Fulton, A. (2005). Investigation into the effect of rope to rope contact for a winch in a multi-turn
configuration.
Kane, B. C. (2007). Friction Coefficients for Arborist Ropes Passing Through Cambium Saver Rings.
Kimbell, A. R. (1981). Tension Relationships for Steel Cable on Notched Stumps. Oregon State
University.
Oxford Dictionary. (2016). Definition of Friction. Retrieved from Oxforddictionaries:
https://en.oxforddictionaries.com/definition/friction
Walker, M. (2006). Investigation into the effect of rope structure and materials on the performance
of a standard sailing winch.
8. ACKNOWLEDGEMENTS
I would like to express my thanks to Rien Visser for funding and guidance throughout the project.
I would also like to thank Hunter Harrill for advice and guidance throughout this project.
Thank you to Nigel Pink and Lachlan Kirk for their help within the forestry workshop by building the
testing apparatus and helping out with tests when needed.

Coefficient of Friction Investigation Jack Palmer 31
9. APPENDICES
APPENDIX A -Initial design sketches for testing apparatus

Coefficient of Friction Investigation Jack Palmer 32
Coefficient of Friction Investigation Jack Palmer 33
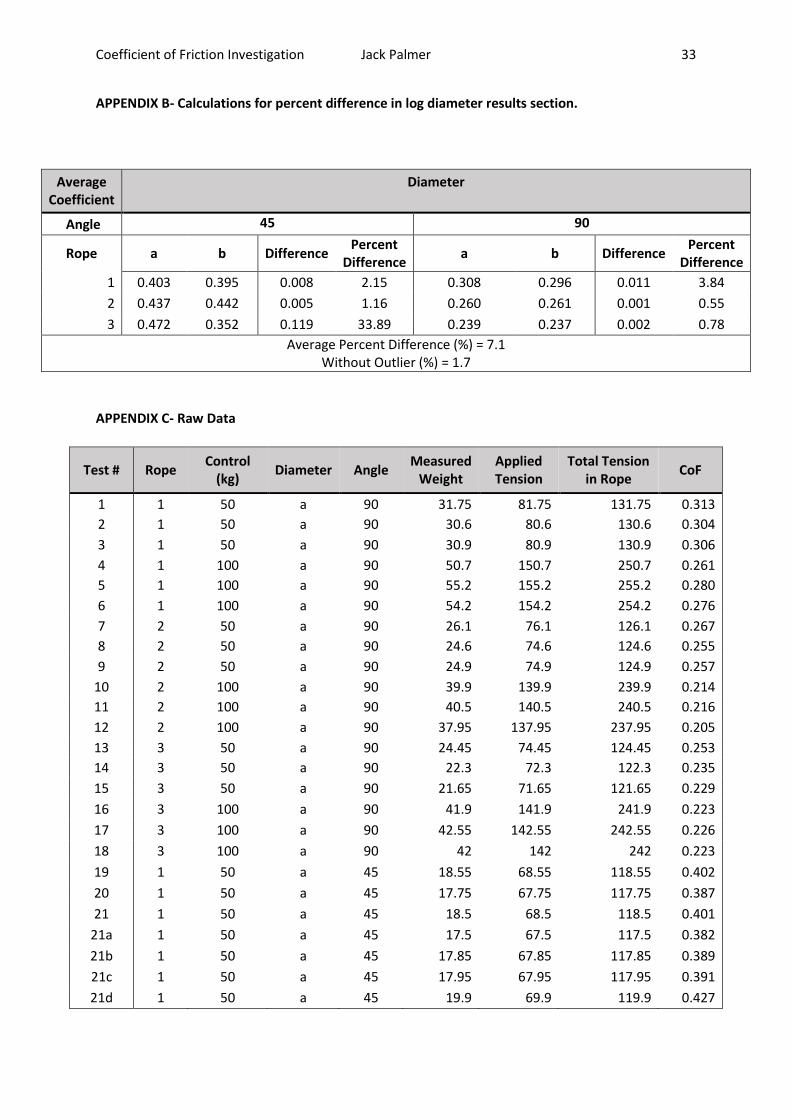
APPENDIX B- Calculations for percent difference in log diameter results section.
Average Coefficient
Diameter
Angle 45 90
Rope a b Difference Percent
Difference a b Difference
Percent Difference
1 0.403 0.395 0.008 2.15 0.308 0.296 0.011 3.84
2 0.437 0.442 0.005 1.16 0.260 0.261 0.001 0.55
3 0.472 0.352 0.119 33.89 0.239 0.237 0.002 0.78
Average Percent Difference (%) = 7.1 Without Outlier (%) = 1.7
APPENDIX C- Raw Data
Test # Rope Control
(kg) Diameter Angle
Measured Weight
Applied Tension
Total Tension in Rope
CoF
1 1 50 a 90 31.75 81.75 131.75 0.313
2 1 50 a 90 30.6 80.6 130.6 0.304
3 1 50 a 90 30.9 80.9 130.9 0.306
4 1 100 a 90 50.7 150.7 250.7 0.261
5 1 100 a 90 55.2 155.2 255.2 0.280
6 1 100 a 90 54.2 154.2 254.2 0.276
7 2 50 a 90 26.1 76.1 126.1 0.267
8 2 50 a 90 24.6 74.6 124.6 0.255
9 2 50 a 90 24.9 74.9 124.9 0.257
10 2 100 a 90 39.9 139.9 239.9 0.214
11 2 100 a 90 40.5 140.5 240.5 0.216
12 2 100 a 90 37.95 137.95 237.95 0.205
13 3 50 a 90 24.45 74.45 124.45 0.253
14 3 50 a 90 22.3 72.3 122.3 0.235
15 3 50 a 90 21.65 71.65 121.65 0.229
16 3 100 a 90 41.9 141.9 241.9 0.223
17 3 100 a 90 42.55 142.55 242.55 0.226
18 3 100 a 90 42 142 242 0.223
19 1 50 a 45 18.55 68.55 118.55 0.402
20 1 50 a 45 17.75 67.75 117.75 0.387
21 1 50 a 45 18.5 68.5 118.5 0.401
21a 1 50 a 45 17.5 67.5 117.5 0.382
21b 1 50 a 45 17.85 67.85 117.85 0.389
21c 1 50 a 45 17.95 67.95 117.95 0.391
21d 1 50 a 45 19.9 69.9 119.9 0.427

Coefficient of Friction Investigation Jack Palmer 34
21e 1 50 a 45 20.25 70.25 120.25 0.433
21f 1 50 a 45 19.4 69.4 119.4 0.417
22 2 50 a 45 22.15 72.15 122.15 0.467
23 2 50 a 45 20.1 70.1 120.1 0.430
24 2 50 a 45 20.55 70.55 120.55 0.438
24a 2 50 a 45 20.8 70.8 120.8 0.443
24b 2 50 a 45 19.55 69.55 119.55 0.420
24c 2 50 a 45 19.6 69.6 119.6 0.421
25 3 50 a 45 21.4 71.4 121.4 0.454
26 3 50 a 45 24.8 74.8 124.8 0.513
27 3 50 a 45 23.15 73.15 123.15 0.484
27a 3 50 a 45 20.6 70.6 120.6 0.439
27b 3 50 a 45 22.2 72.2 122.2 0.468
27c 3 50 a 45 22.4 72.4 122.4 0.471
28 1 50 b 45 18.4 68.4 118.4 0.399
29 1 50 b 45 18.3 68.3 118.3 0.397
30 1 50 b 45 17.8 67.8 117.8 0.388
31 2 50 b 45 20.3 70.3 120.3 0.434
32 2 50 b 45 20.8 70.8 120.8 0.443
33 2 50 b 45 21.1 71.1 121.1 0.448
34 3 50 b 45 15.95 65.95 115.95 0.353
35 3 50 b 45 15.8 65.8 115.8 0.350
36 3 50 b 45 16.05 66.05 116.05 0.354
37 1 50 b 90 30.75 80.75 130.75 0.305
38 1 50 b 90 29.6 79.6 129.6 0.296
39 1 50 b 90 28.6 78.6 128.6 0.288
40 2 50 b 90 24.85 74.85 124.85 0.257
41 2 50 b 90 25.8 75.8 125.8 0.265
42 2 50 b 90 25.45 75.45 125.45 0.262
43 3 50 b 90 23.5 73.5 123.5 0.245
44 3 50 b 90 22.4 72.4 122.4 0.236
45 3 50 b 90 21.85 71.85 121.85 0.231
46 1 50 Groove 90 40.45 90.45 140.45 0.377
47 1 50 Groove 90 38.25 88.25 138.25 0.362
48 1 50 Groove 90 40.95 90.95 140.95 0.381
49 2 50 Groove 90 34.25 84.25 134.25 0.332
50 2 50 Groove 90 32.5 82.5 132.5 0.319
51 2 50 Groove 90 33.95 83.95 133.95 0.330
52 1 50 Cambium 90 33.95 83.95 133.95 0.330
53 1 50 Cambium 90 33.55 83.55 133.55 0.327
54 1 50 Cambium 90 34.85 84.85 134.85 0.337
55 2 50 Cambium 90 33.35 83.35 133.35 0.325
56 2 50 Cambium 90 33.95 83.95 133.95 0.330
57 2 50 Cambium 90 30.35 80.35 130.35 0.302