Department of Economics Crop Market Outlook B.E.S.T. Peer Group West Des Moines, Iowa October 23,...
42
Department of Economics Crop Market Outlook B.E.S.T. Peer Group West Des Moines, Iowa October 23, 2008 Chad Hart Assistant Professor/Grain Markets Specialist [email protected] 515-294-9911
-
date post
21-Dec-2015 -
Category
Documents
-
view
215 -
download
1
Transcript of Department of Economics Crop Market Outlook B.E.S.T. Peer Group West Des Moines, Iowa October 23,...

Department of Economics
Crop Market Outlook
B.E.S.T. Peer GroupWest Des Moines, Iowa
October 23, 2008
Chad HartAssistant Professor/Grain Markets Specialist

Department of Economics
U.S. Corn Supply and Use
Source: USDA-WAOB, Oct. 2008
+1.7
+128
+150
+136
-0.80$5.50 $4.70
-100
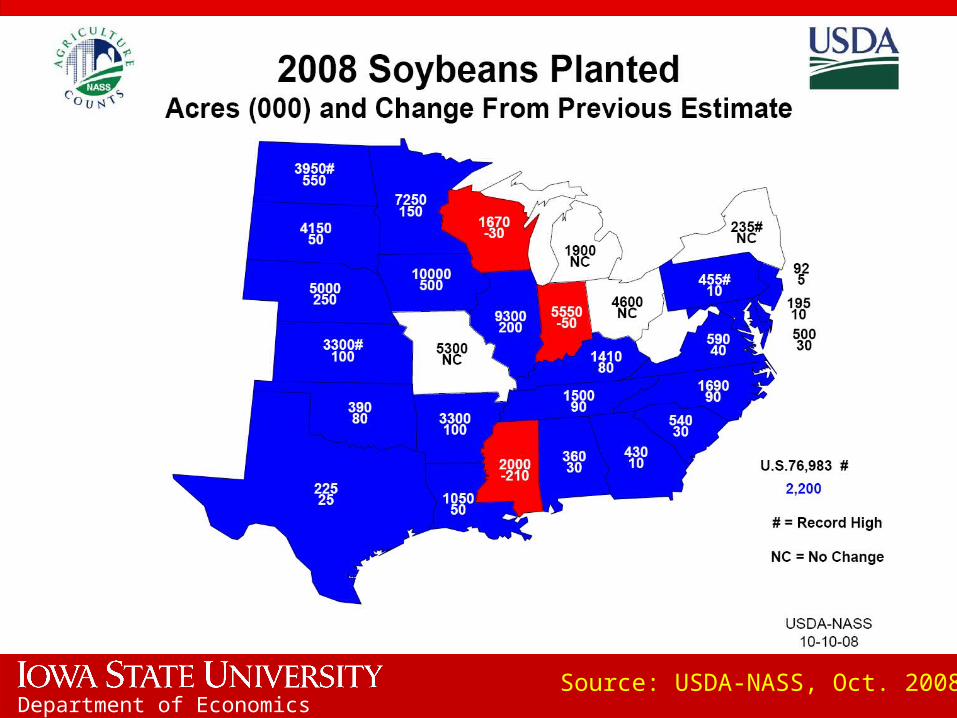
Department of EconomicsSource: USDA-NASS, Oct. 2008
Department of Economics
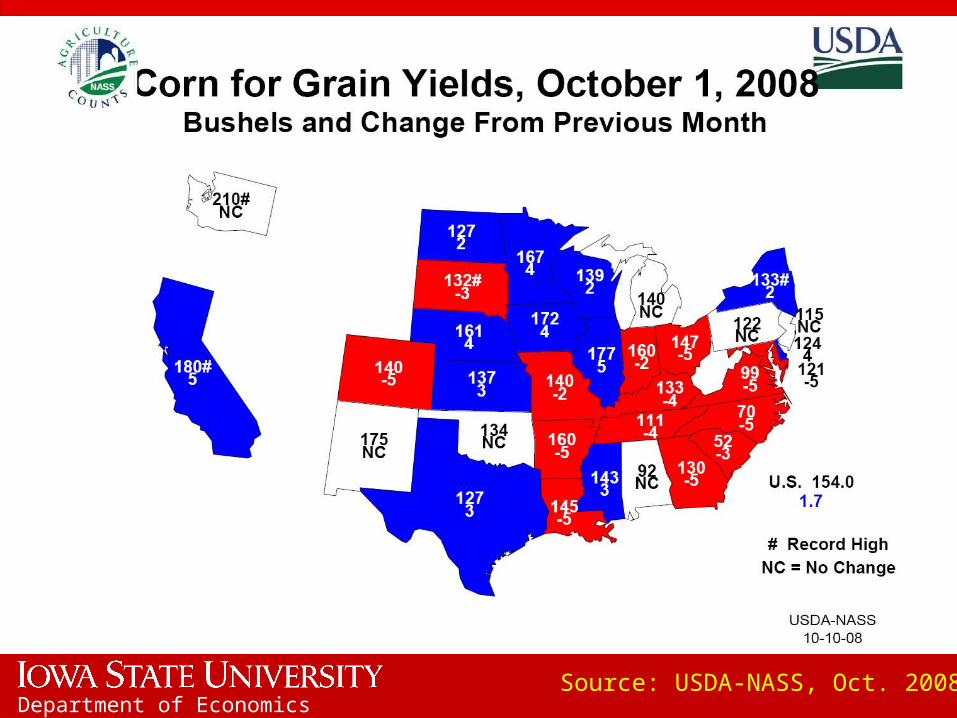
U.S. Soybean Supply and Use
Source: USDA-WAOB, Oct. 2008
-0.5
+65+49
-25+50
-2.00$12.35 $10.35
+2.2
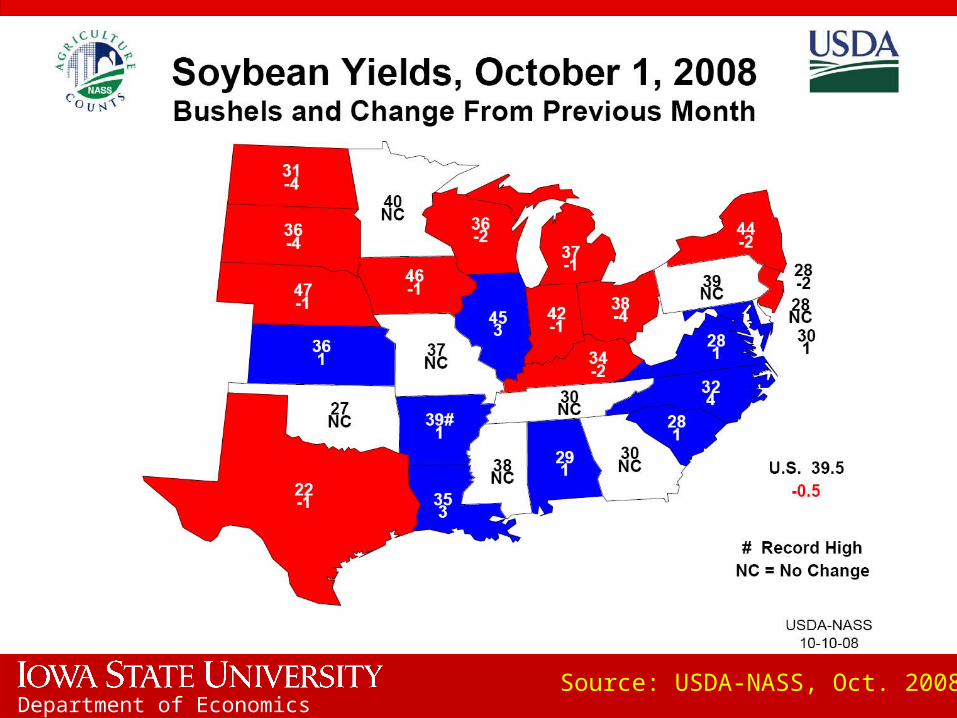
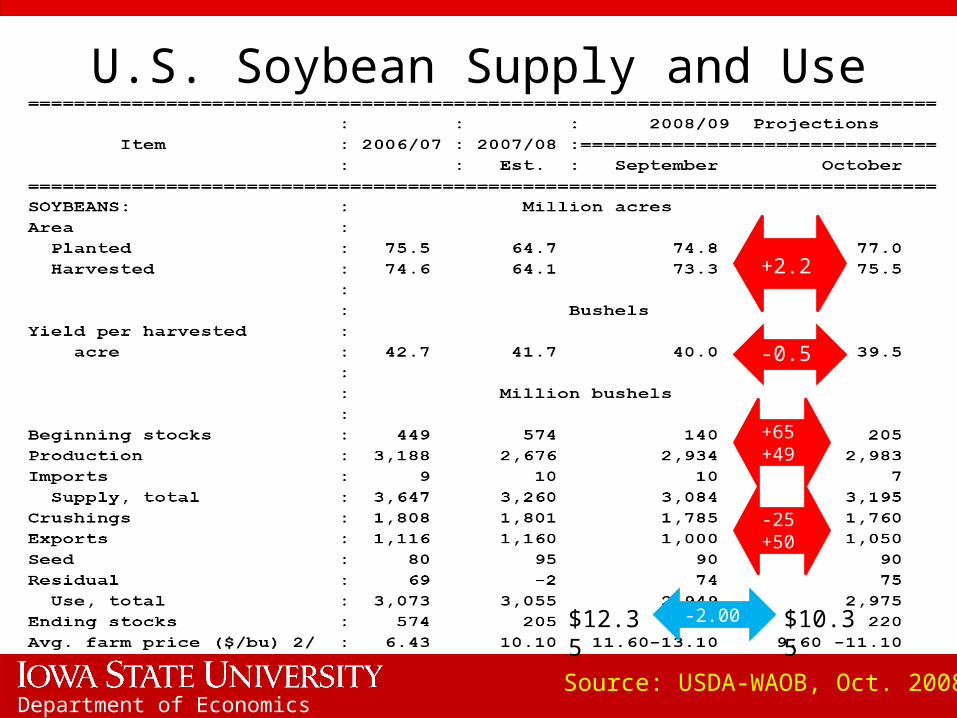
Department of EconomicsSource: USDA-NASS, Oct. 2008
Department of EconomicsSource: USDA-NASS, Oct. 2008

Department of Economics
World Corn Production
Source: USDA-WAOB, Oct. 2008
Department of Economics
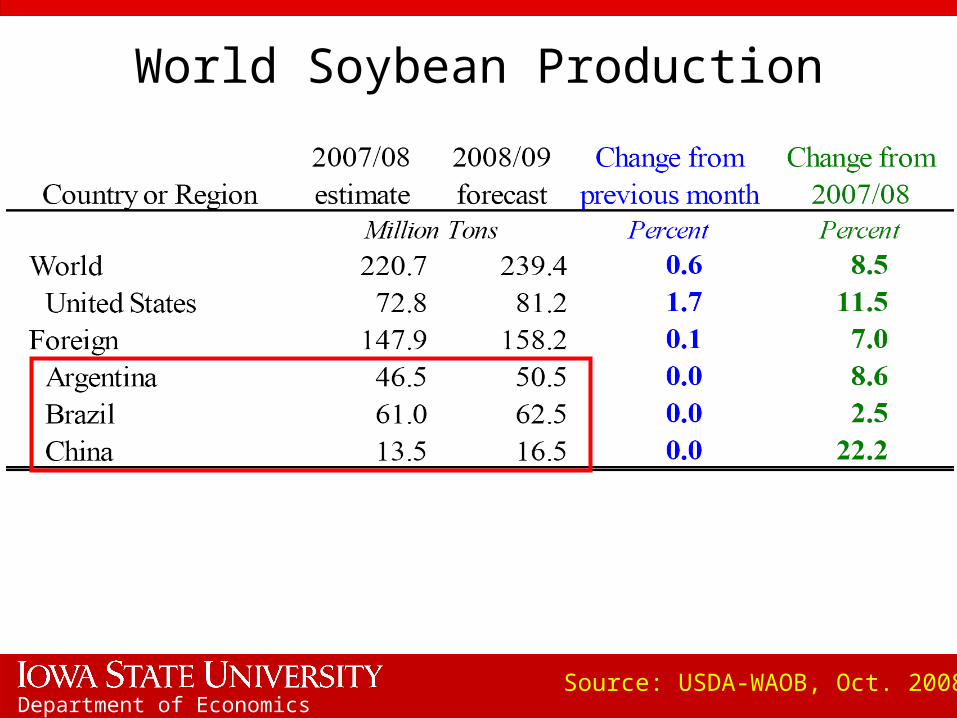
World Soybean Production
Source: USDA-WAOB, Oct. 2008
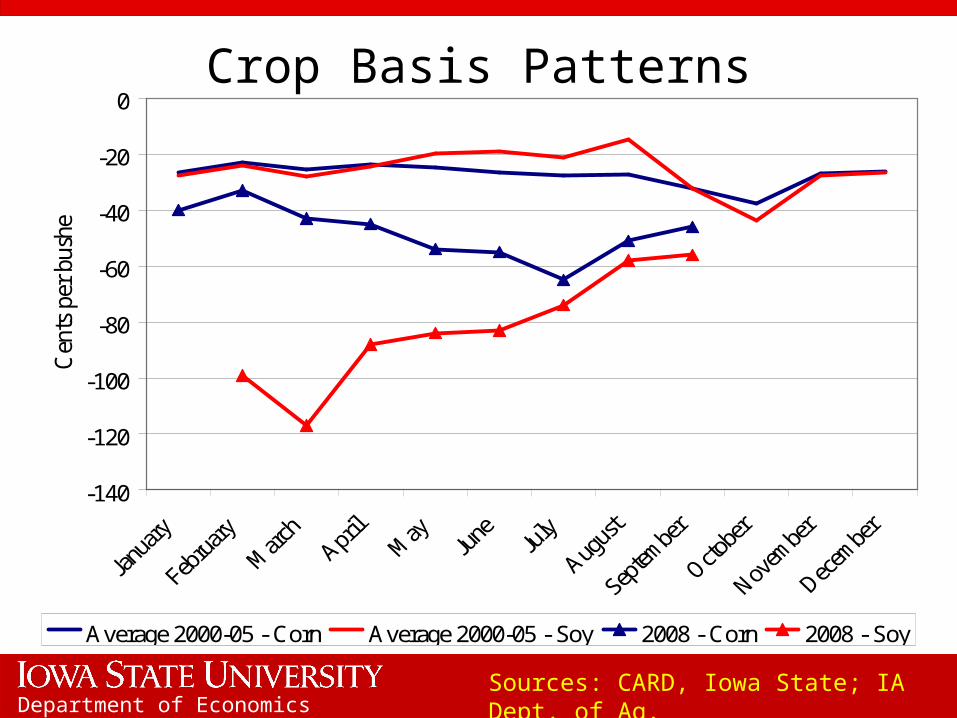
Department of EconomicsSources: CARD, Iowa State; IA Dept. of Ag.
Crop Basis Patterns
-140
-120
-100
-80
-60
-40
-20
0
Cen
ts p
er b
ushe
l
Average 2000-05 - Corn Average 2000-05 - Soy 2008 - Corn 2008 - Soy

Department of EconomicsSource: ISU, Dr. John Lawrence
Livestock Returns
-50
-25
0
25
50
Jan-0
1
Jul-0
1
Jan-0
2
Jul-0
2
Jan-0
3
Jul-0
3
Jan-0
4
Jul-0
4
Jan-0
5
Jul-0
5
Jan-0
6
Jul-0
6
Jan-0
7
Jul-0
7
Jan-0
8
Jul-0
8
Ne
t re
turn
($
/he
ad
)
-400
-200
0
200
400
Ne
t re
turn
($
/he
ad
)
Farrow to Finish Steer Calves
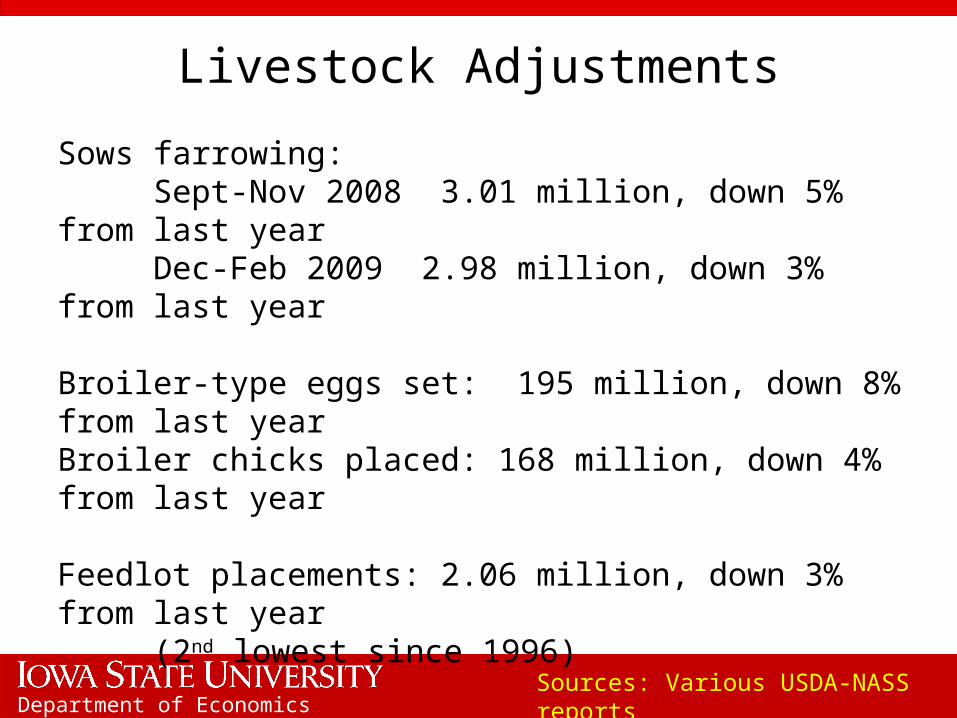
Department of EconomicsSources: Various USDA-NASS reports
Livestock Adjustments
Sows farrowing: Sept-Nov 2008 3.01 million, down 5% from last yearDec-Feb 2009 2.98 million, down 3% from last year
Broiler-type eggs set: 195 million, down 8% from last yearBroiler chicks placed: 168 million, down 4% from last year
Feedlot placements: 2.06 million, down 3% from last year(2nd lowest since 1996)
Department of Economics
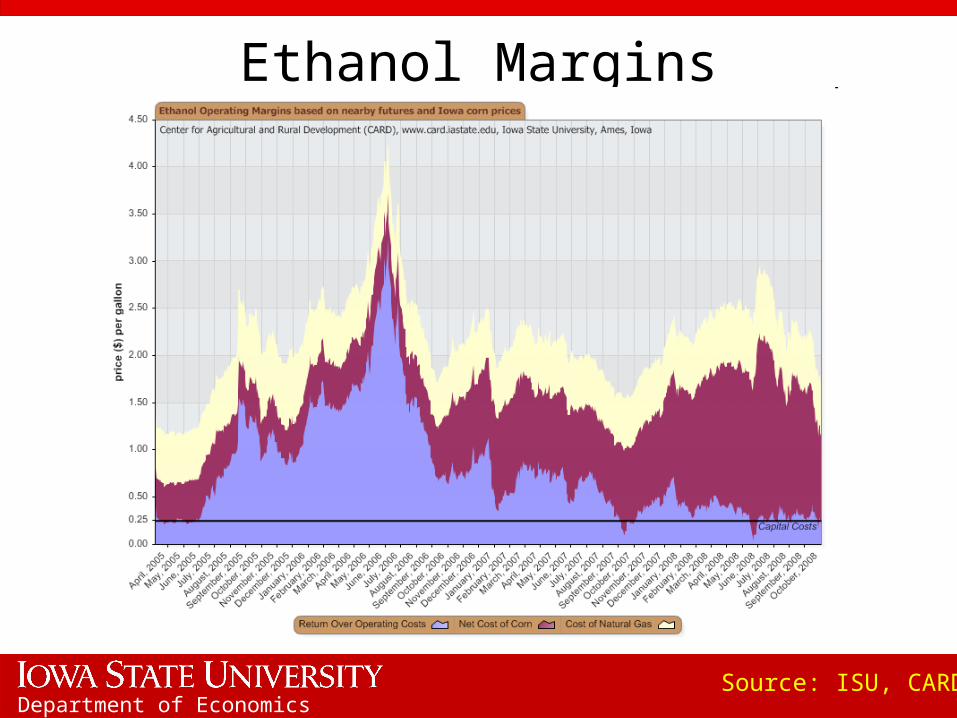
Ethanol Margins
Source: ISU, CARD

Department of Economics
Biodiesel Margins
Source: ISU, CARD
Department of Economics
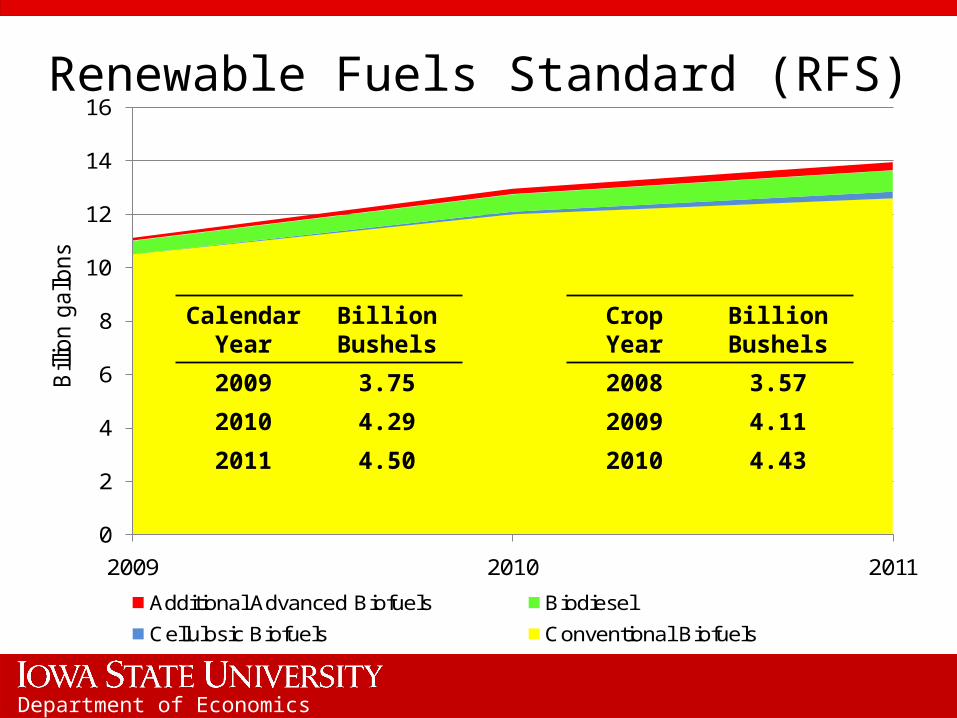
Renewable Fuels Standard (RFS)
0
2
4
6
8
10
12
14
16
2009 2010 2011
Bill
ion g
allo
ns
Additional Advanced Biofuels Biodiesel
Cellulosic Biofuels Conventional Biofuels
Calendar Year
Billion Bushels
2009 3.75
2010 4.29
2011 4.50
CropYear
Billion Bushels
2008 3.57
2009 4.11
2010 4.43
Department of Economics
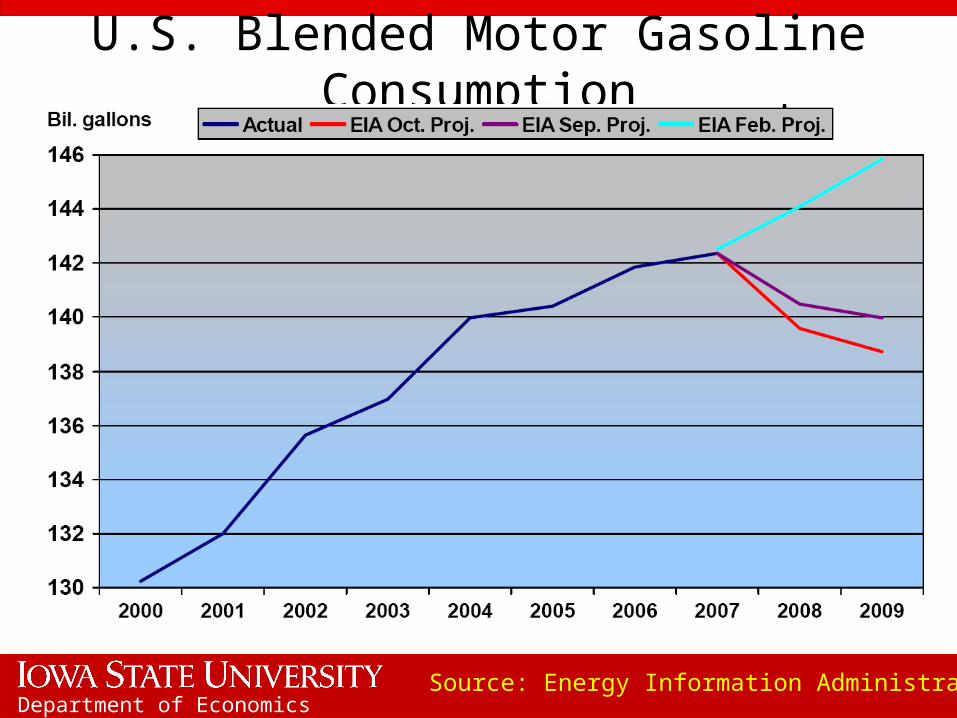
U.S. Blended Motor Gasoline Consumption
Source: Energy Information Administration

Department of Economics
Outside Influences (Jan. 2007 = 1)
0.5
0.7
0.9
1.1
1.3
1.5
1.7
1.9
2.1
2.3
2.51/3
/2007
3/3
/2007
5/3
/2007
7/3
/2007
9/3
/2007
11/3
/2007
1/3
/2008
3/3
/2008
5/3
/2008
7/3
/2008
9/3
/2008
Dow Oil Corn Soybeans
Department of Economics
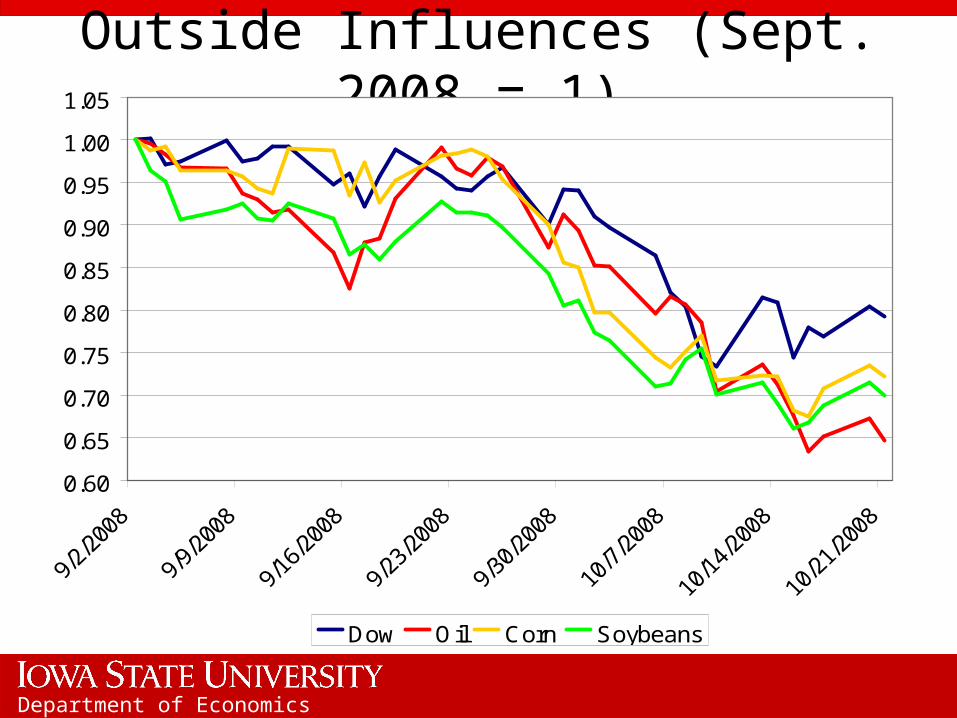
Outside Influences (Sept. 2008 = 1)
0.60
0.65
0.70
0.75
0.80
0.85
0.90
0.95
1.00
1.05
Dow Oil Corn Soybeans
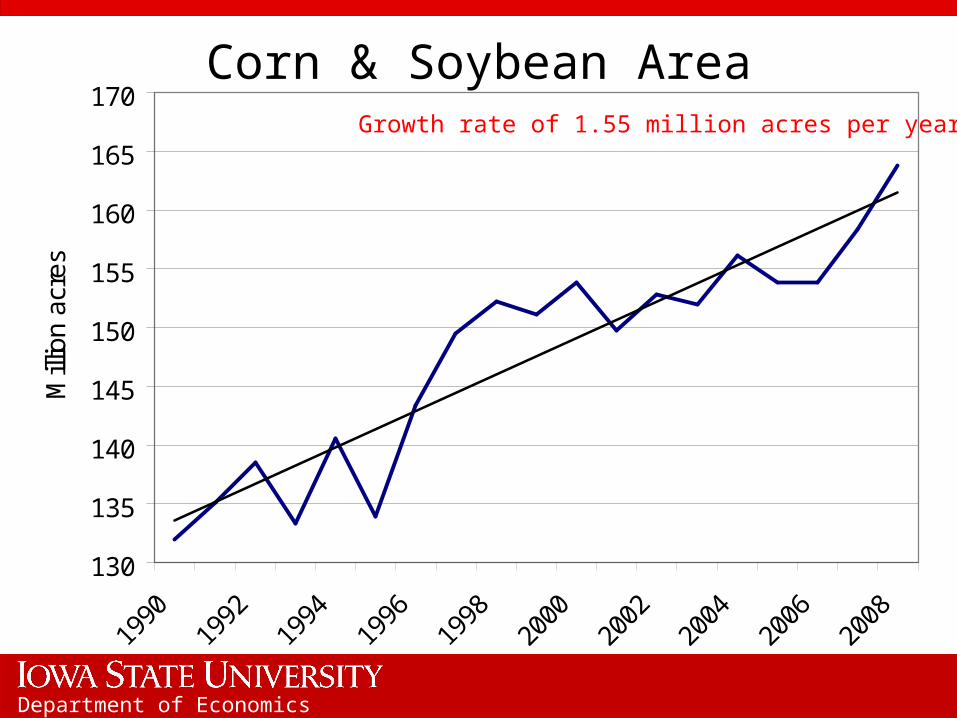
Department of Economics
130
135
140
145
150
155
160
165
170
Mill
ion
acr
es
Corn & Soybean AreaGrowth rate of 1.55 million acres per year
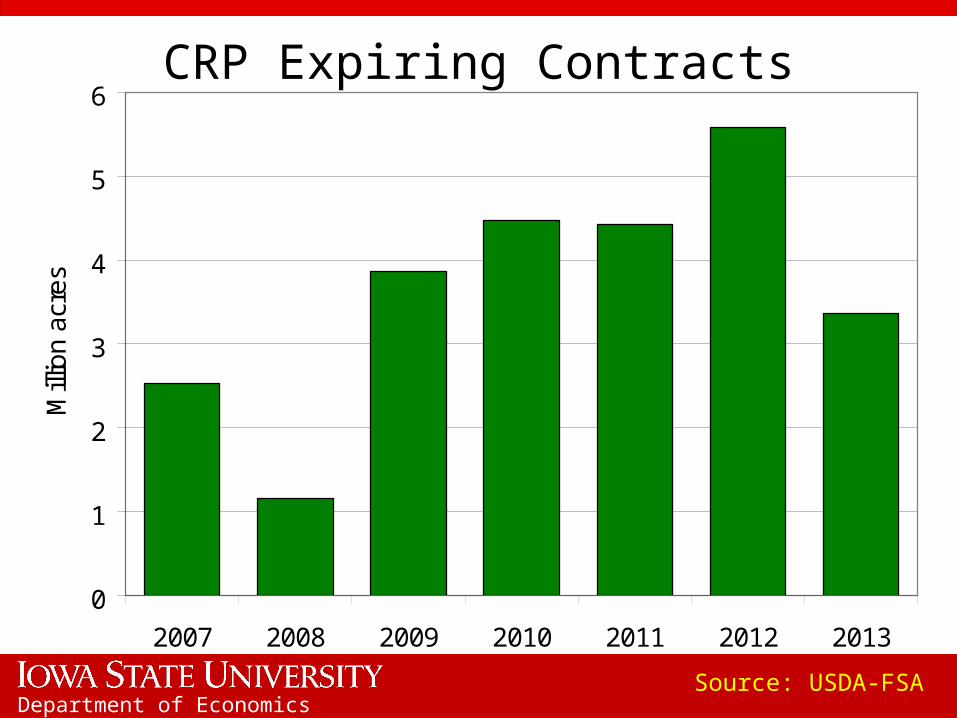
Department of Economics
CRP Expiring Contracts
Source: USDA-FSA
0
1
2
3
4
5
6
2007 2008 2009 2010 2011 2012 2013
Mill
ion
acr
es
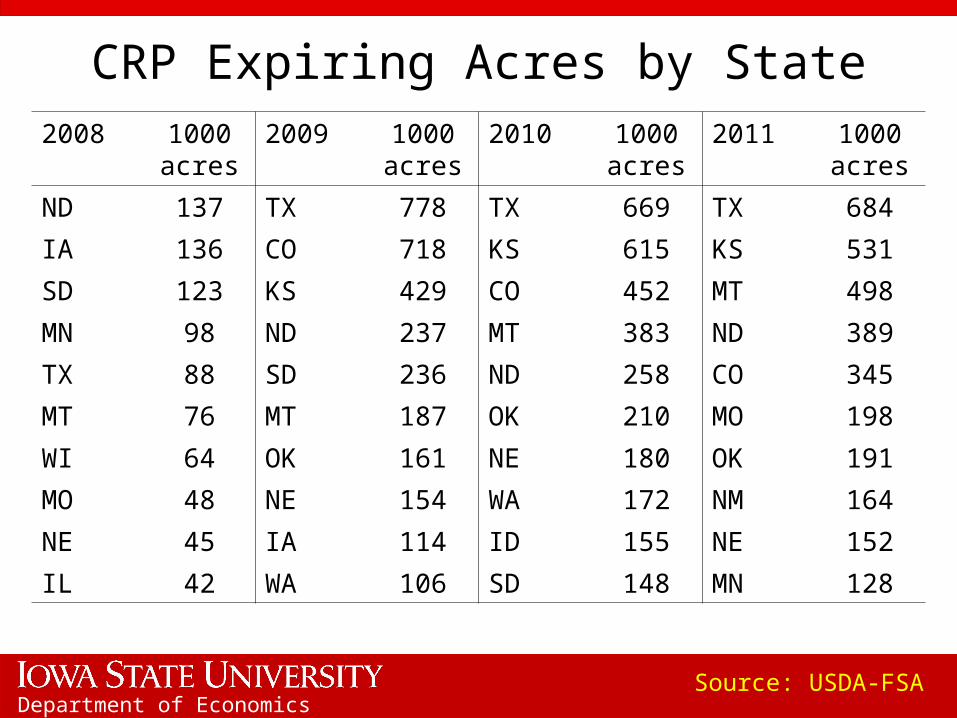
Department of Economics
CRP Expiring Acres by State
Source: USDA-FSA
2008 1000 acres
2009 1000 acres
2010 1000 acres
2011 1000 acres
ND 137 TX 778 TX 669 TX 684
IA 136 CO 718 KS 615 KS 531
SD 123 KS 429 CO 452 MT 498
MN 98 ND 237 MT 383 ND 389
TX 88 SD 236 ND 258 CO 345
MT 76 MT 187 OK 210 MO 198
WI 64 OK 161 NE 180 OK 191
MO 48 NE 154 WA 172 NM 164
NE 45 IA 114 ID 155 NE 152
IL 42 WA 106 SD 148 MN 128
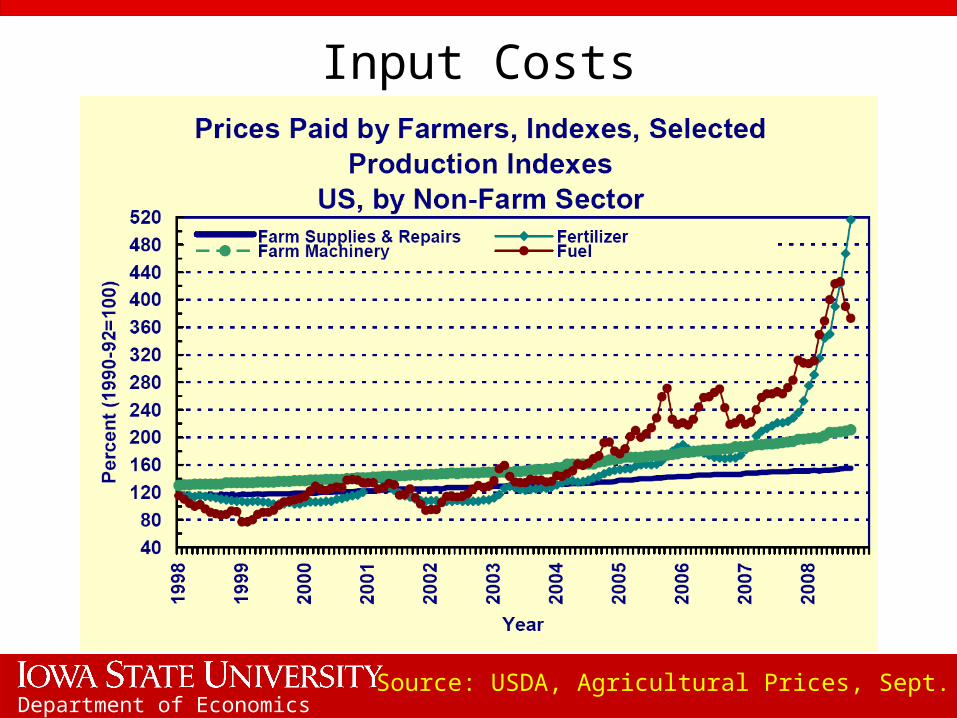
Department of Economics
Input Costs
Source: USDA, Agricultural Prices, Sept. 2008
Department of Economics
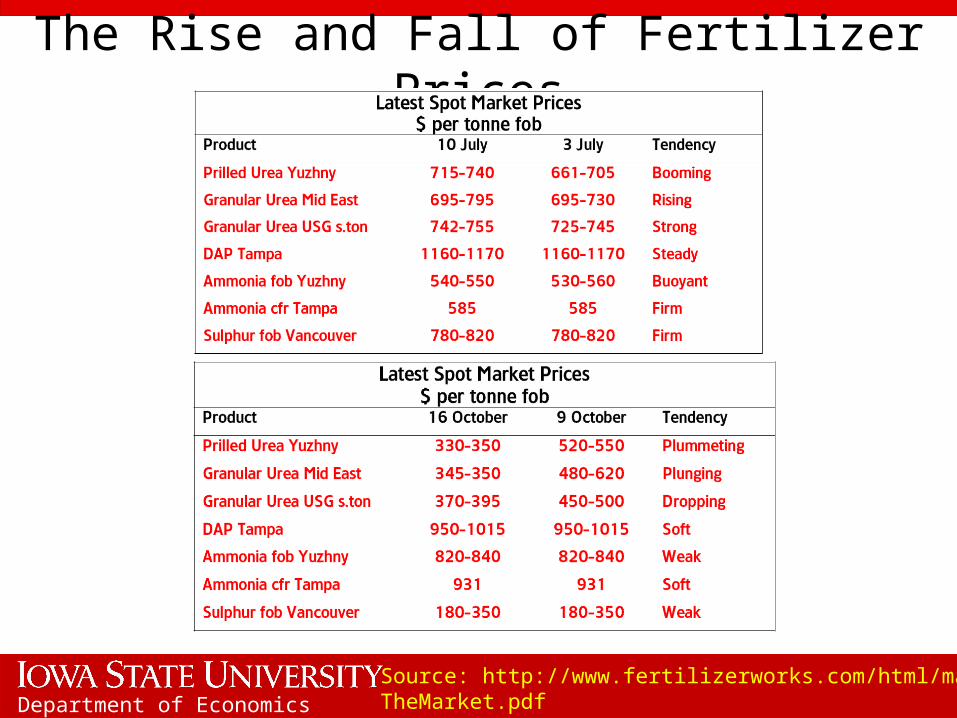
The Rise and Fall of Fertilizer Prices
Source: http://www.fertilizerworks.com/html/market/TheMarket.pdf

Department of Economics
Urea Prices
Source: http://www.fertilizerworks.com/html/market/TheMarket.pdf
Department of Economics
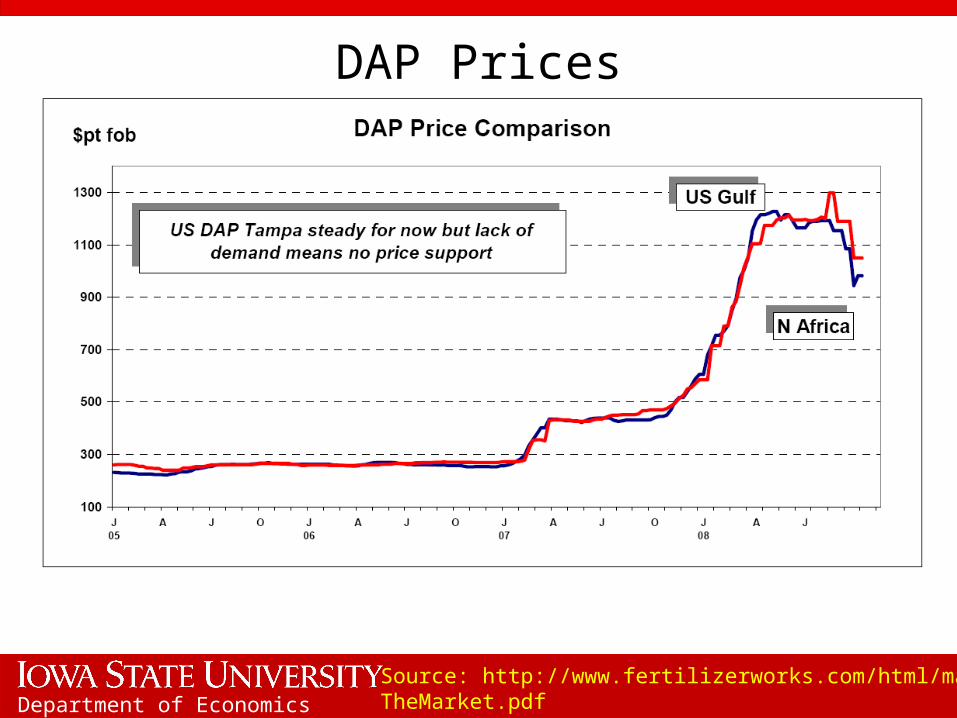
DAP Prices
Source: http://www.fertilizerworks.com/html/market/TheMarket.pdf
Department of Economics
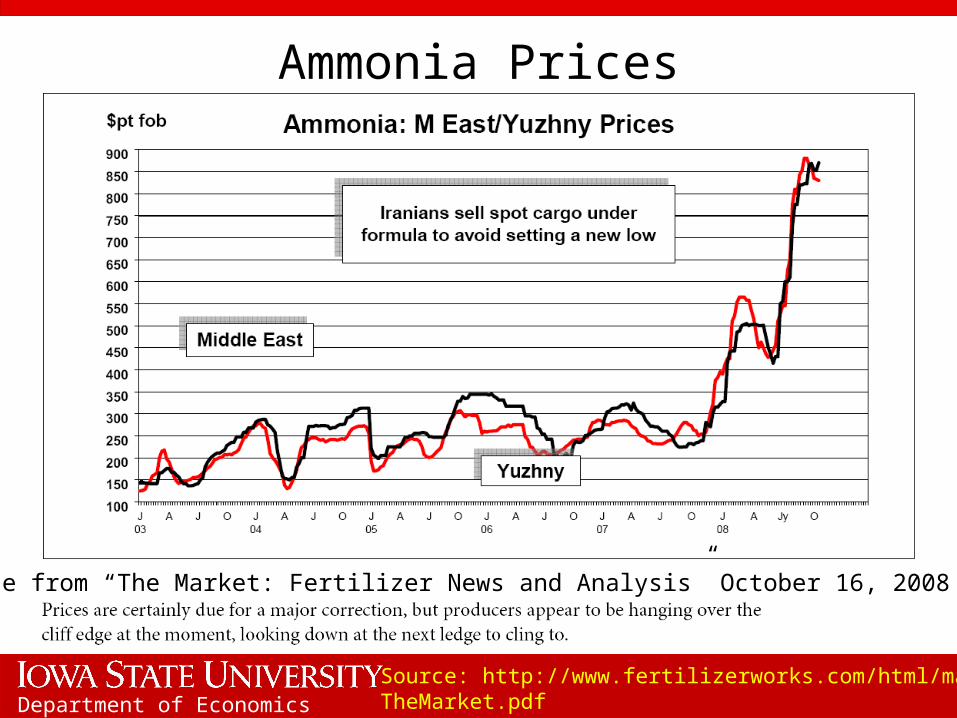
Ammonia Prices
Source: http://www.fertilizerworks.com/html/market/TheMarket.pdf
A quote from “The Market: Fertilizer News and Analysis” October 16, 2008

Department of Economics
Historical Iowa Corn Production Costs
Source: Duffy and Smith, http://www.extension.iastate.edu/agdm/crops/pdf/a1-21.pdf
0
100
200
300
400
500
600
$ pe
r ac
re
Machinery Seed, Chemicals, and Fertilizer Labor Land
Department of Economics
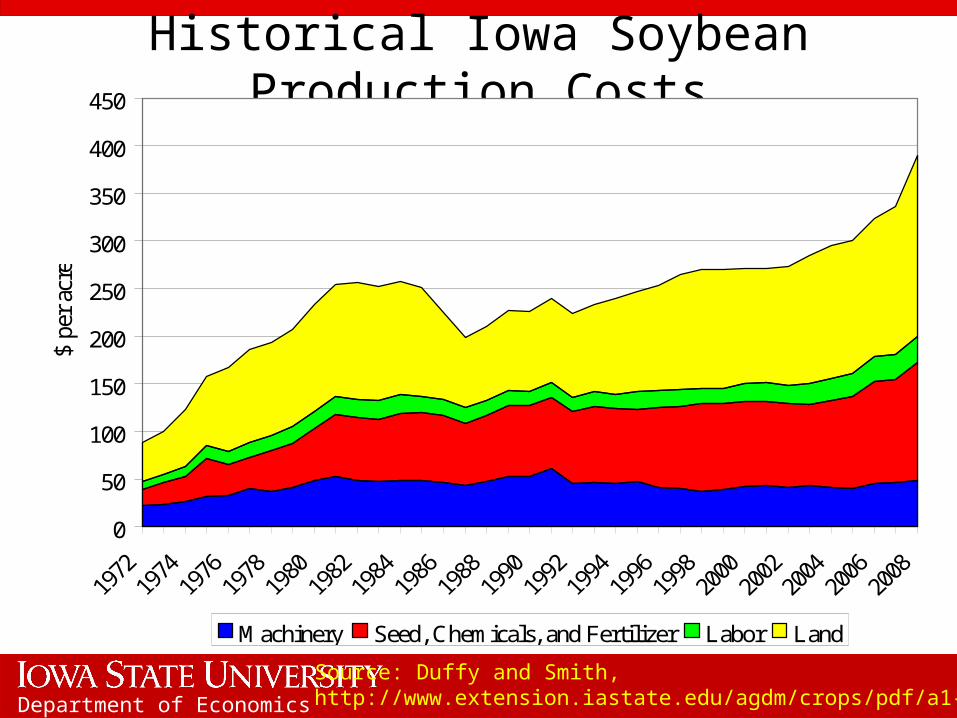
Historical Iowa Soybean Production Costs
Source: Duffy and Smith, http://www.extension.iastate.edu/agdm/crops/pdf/a1-21.pdf
0
50
100
150
200
250
300
350
400
450
$ pe
r ac
re
Machinery Seed, Chemicals, and Fertilizer Labor Land
Department of Economics
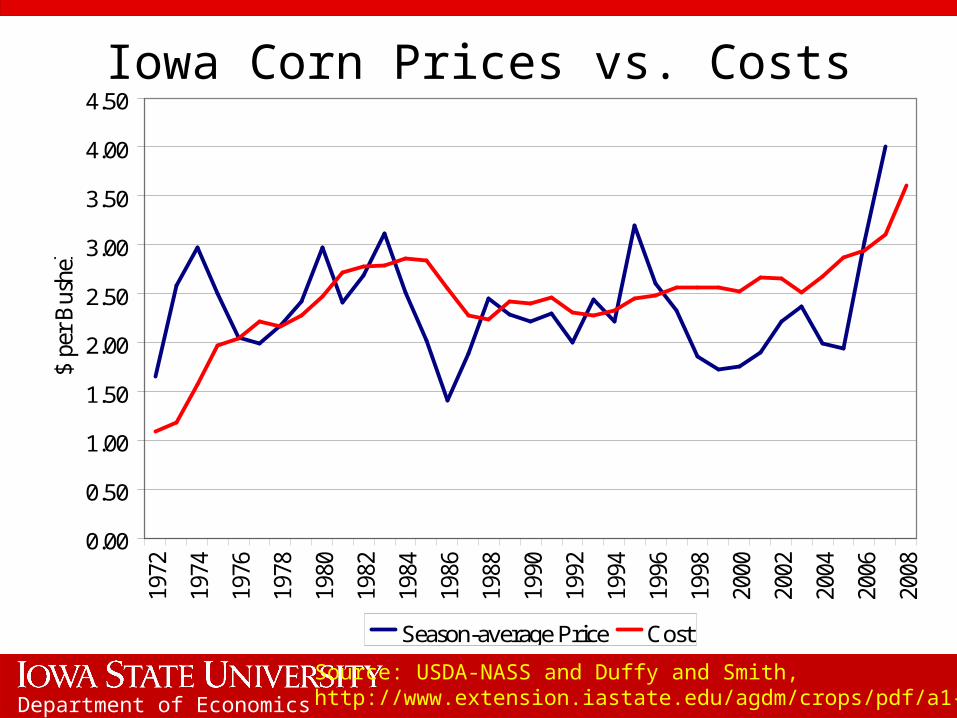
Iowa Corn Prices vs. Costs
Source: USDA-NASS and Duffy and Smith, http://www.extension.iastate.edu/agdm/crops/pdf/a1-21.pdf
0.00
0.50
1.00
1.50
2.00
2.50
3.00
3.50
4.00
4.50
1972
1974
1976
1978
1980
1982
1984
1986
1988
1990
1992
1994
1996
1998
2000
2002
2004
2006
2008
$ pe
r B
ushe
l
Season-average Price Cost
Department of Economics
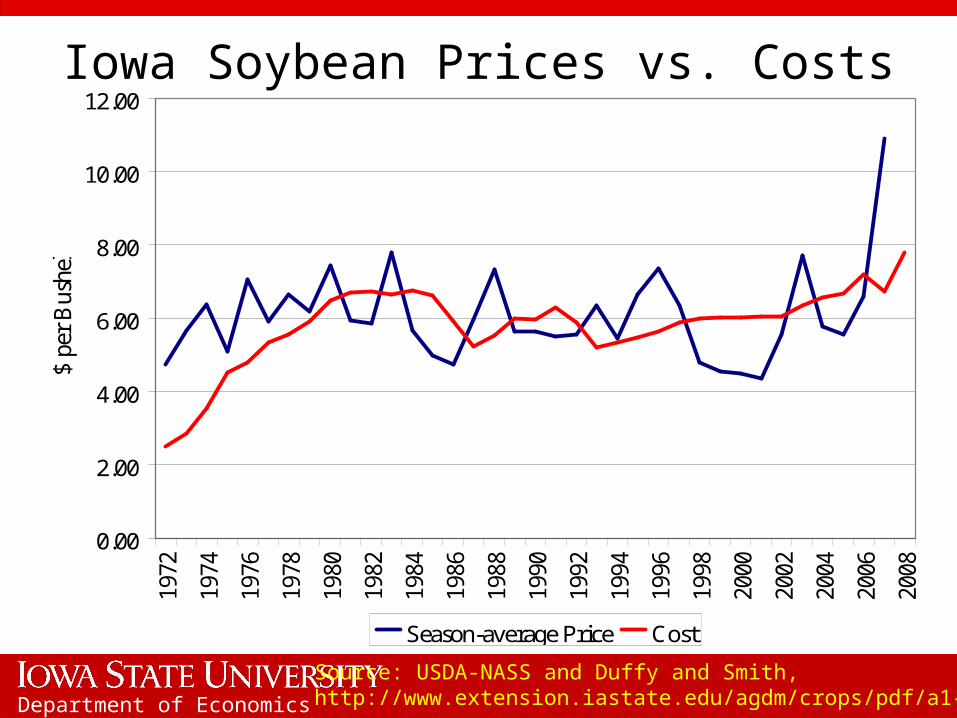
Iowa Soybean Prices vs. Costs
Source: USDA-NASS and Duffy and Smith, http://www.extension.iastate.edu/agdm/crops/pdf/a1-21.pdf
0.00
2.00
4.00
6.00
8.00
10.00
12.00
1972
1974
1976
1978
1980
1982
1984
1986
1988
1990
1992
1994
1996
1998
2000
2002
2004
2006
2008
$ pe
r B
ushe
l
Season-average Price Cost
Department of Economics
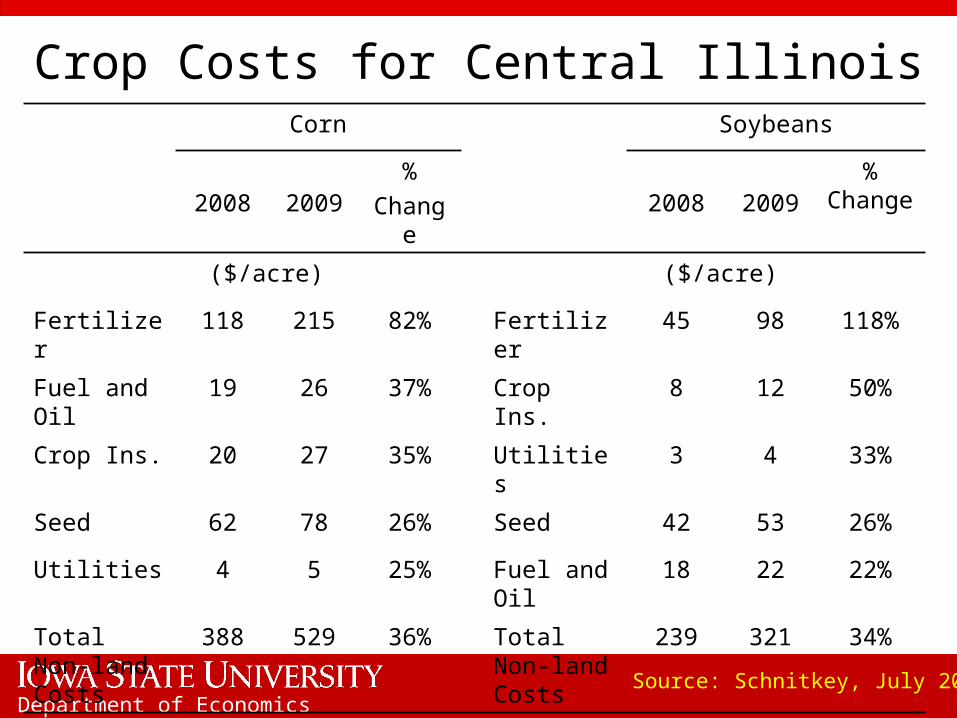
Crop Costs for Central Illinois
Source: Schnitkey, July 2008
Corn Soybeans
2008 2009%
Change2008 2009
% Change
($/acre) ($/acre)
Fertilizer 118 215 82% Fertilizer 45 98 118%
Fuel and Oil 19 26 37% Crop Ins. 8 12 50%
Crop Ins. 20 27 35% Utilities 3 4 33%
Seed 62 78 26% Seed 42 53 26%
Utilities 4 5 25% Fuel and Oil
18 22 22%
Total Non-land Costs
388 529 36% Total Non-land Costs
239 321 34%
Department of Economics
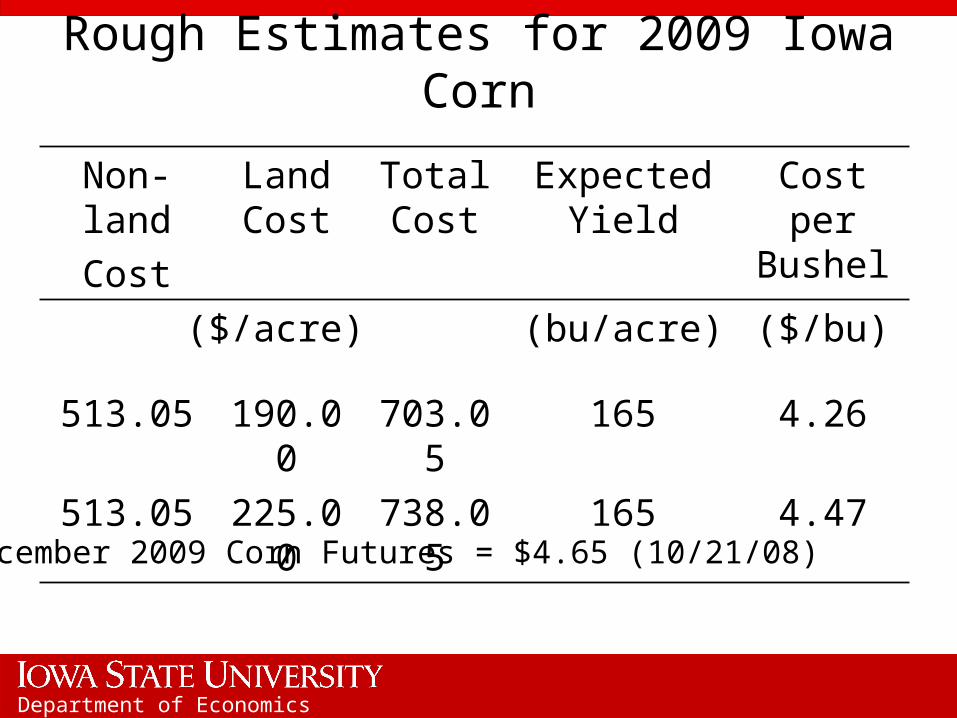
Rough Estimates for 2009 Iowa Corn
Non-land
Cost
Land Cost
Total Cost
Expected Yield
Cost per Bushel
($/acre) (bu/acre) ($/bu)
513.05 190.00 703.05 165 4.26
513.05 225.00 738.05 165 4.47
December 2009 Corn Futures = $4.65 (10/21/08)
Department of Economics
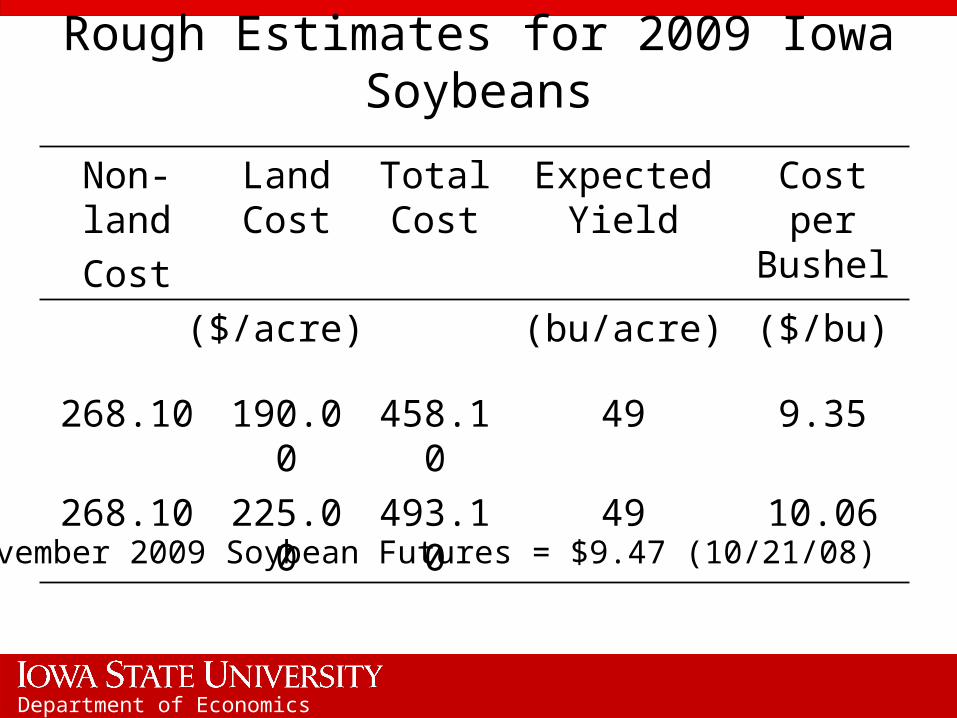
Rough Estimates for 2009 Iowa Soybeans
Non-land
Cost
Land Cost
Total Cost
Expected Yield
Cost per Bushel
($/acre) (bu/acre) ($/bu)
268.10 190.00 458.10 49 9.35
268.10 225.00 493.10 49 10.06
November 2009 Soybean Futures = $9.47 (10/21/08)
Department of Economics
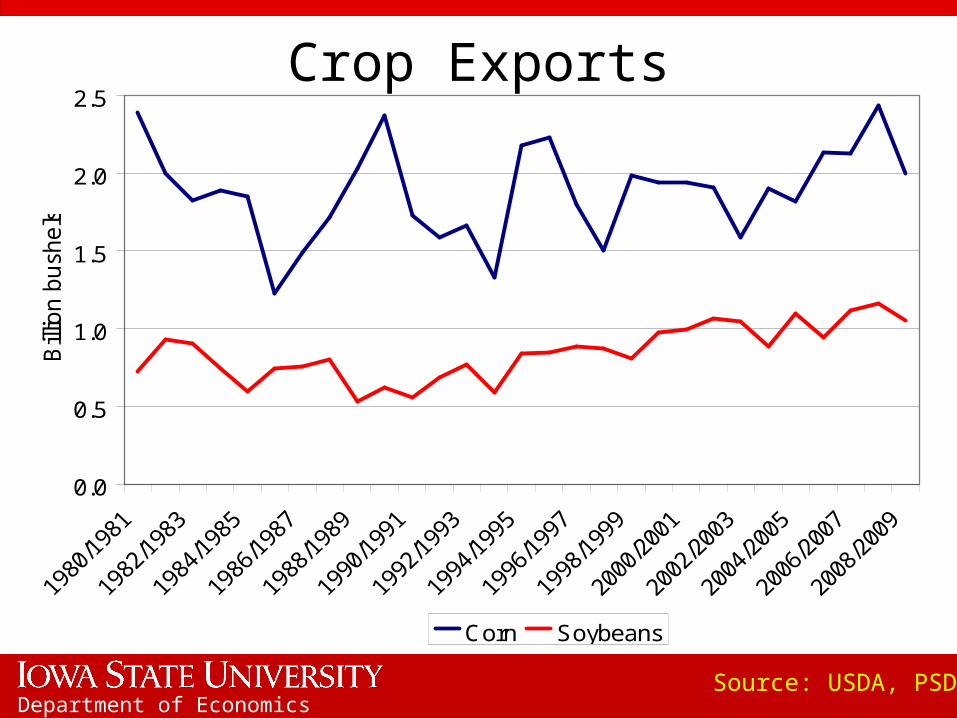
Crop Exports
Source: USDA, PSD
0.0
0.5
1.0
1.5
2.0
2.5
Bill
ion
bush
els
Corn Soybeans
Department of Economics
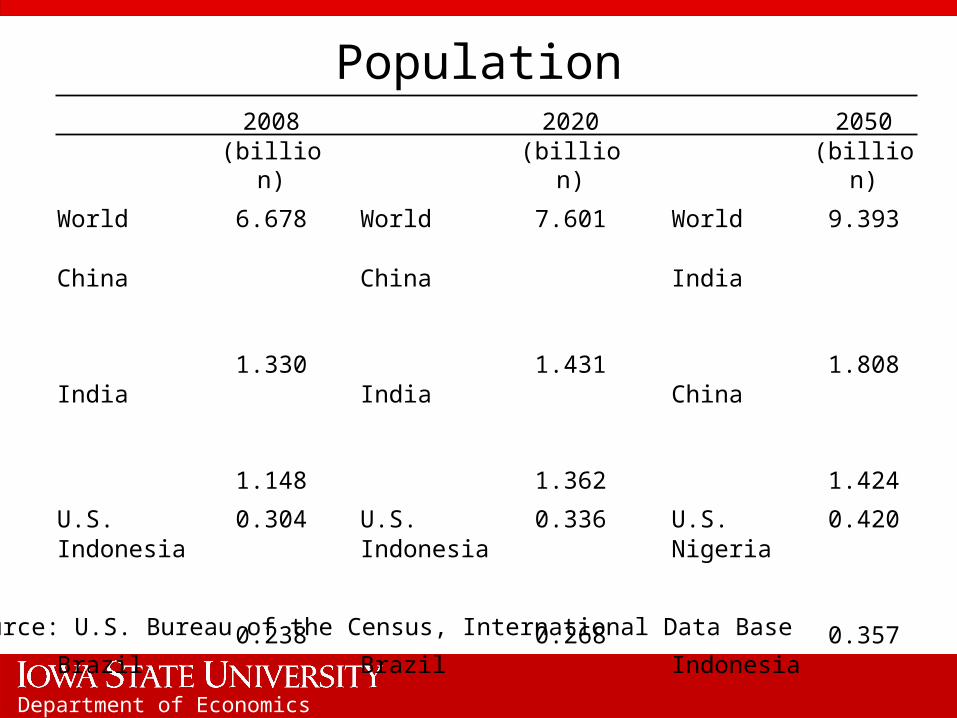
Population2008 2020 2050
(billion) (billion) (billion)World 6.678 World 7.601 World 9.393
China 1.330
China 1.431
India 1.808
India 1.148
India 1.362
China 1.424
U.S. 0.304 U.S. 0.336 U.S. 0.420Indonesia 0.238
Indonesia 0.268
Nigeria 0.357
Brazil 0.192
Brazil 0.212
Indonesia 0.313
Pakistan 0.168
Pakistan 0.204
Bangladesh 0.280
Bangladesh 0.154
Bangladesh 0.190
Pakistan 0.278
Russia 0.141
Nigeria 0.184
Brazil 0.228
Nigeria 0.138
Russia 0.132 Congo 0.189
Source: U.S. Bureau of the Census, International Data Base
Department of Economics
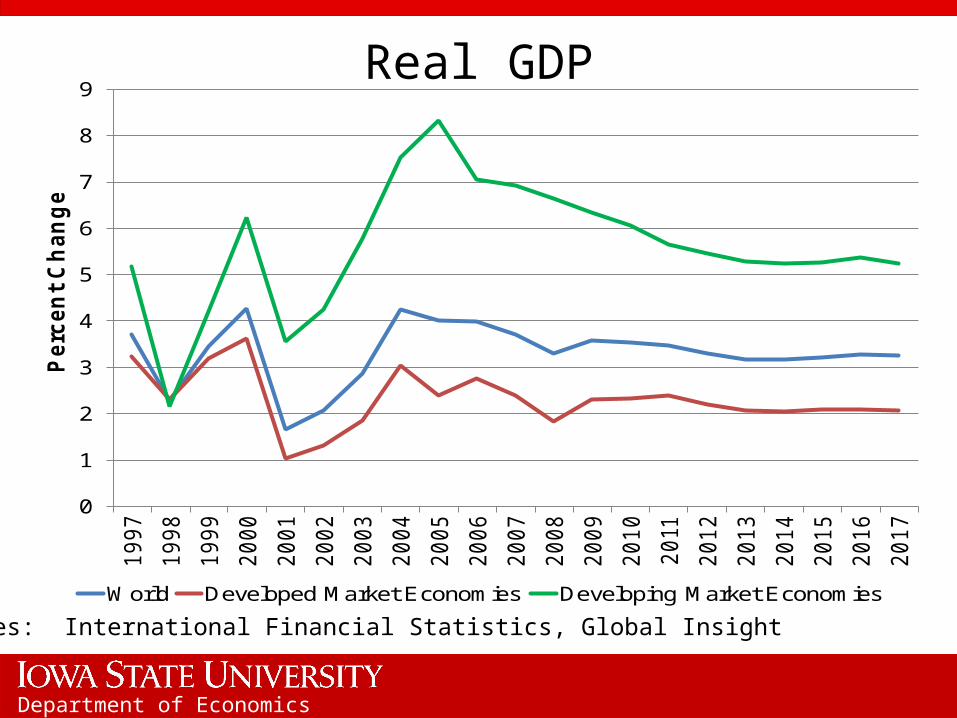
Real GDP
0
1
2
3
4
5
6
7
8
9
1997
1998
1999
2000
2001
2002
2003
2004
2005
2006
2007
2008
2009
2010
2011
2012
2013
2014
2015
2016
2017
Perc
en
t C
han
ge
World Developed Market Economies Developing Market Economies
Sources: International Financial Statistics, Global Insight
Department of Economics
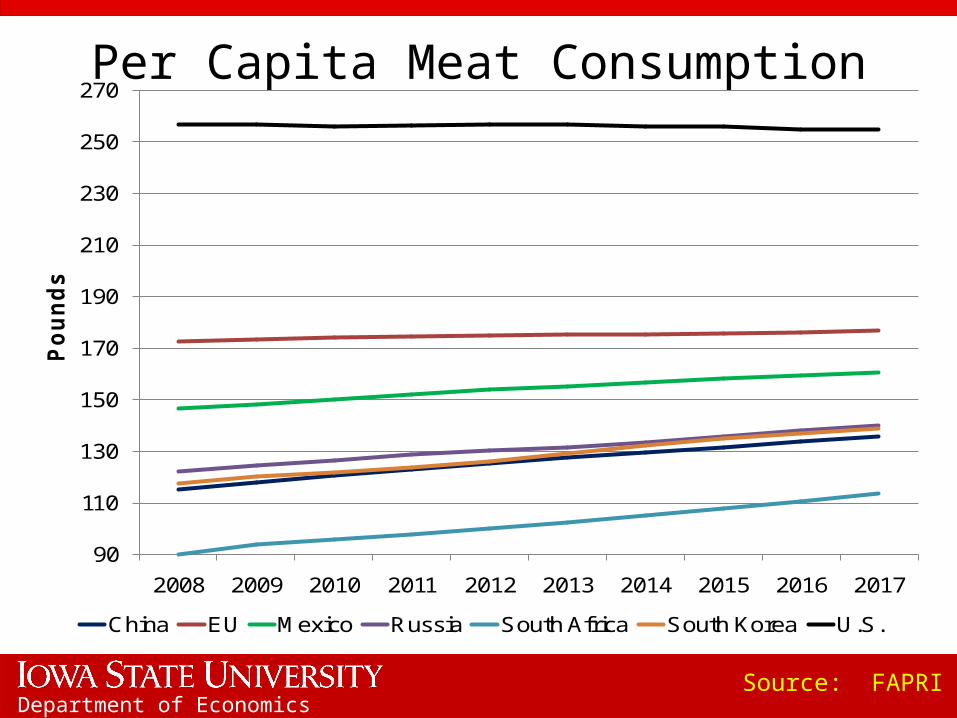
Per Capita Meat Consumption
90
110
130
150
170
190
210
230
250
270
2008 2009 2010 2011 2012 2013 2014 2015 2016 2017
Po
un
ds
China EU Mexico Russia South Africa South Korea U.S.
Source: FAPRI

Department of Economics
Exchange Rate Ratios (Jan. 2007 = 1)
Source: OANDA.com
0.7
0.8
0.9
1.0
1.1
1.2
1.3
1.4
1.51
/1/2
00
7
3/1
/20
07
5/1
/20
07
7/1
/20
07
9/1
/20
07
11/1
/20
07
1/1
/20
08
3/1
/20
08
5/1
/20
08
7/1
/20
08
9/1
/20
08
EU Brazil Japan South Korea
Department of Economics
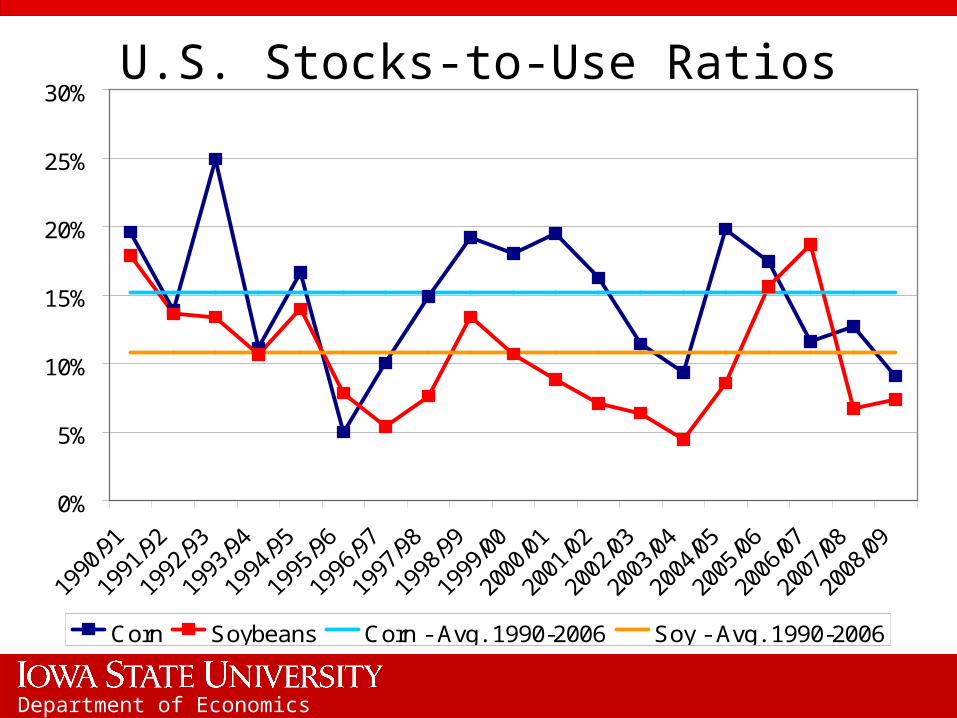
U.S. Stocks-to-Use Ratios
0%
5%
10%
15%
20%
25%
30%
Corn Soybeans Corn - Avg. 1990-2006 Soy - Avg. 1990-2006

Department of Economics
World Stocks-to-Use Ratios
0%
5%
10%
15%
20%
25%
Corn Soybeans Corn - Avg. 1990-2006 Soy - Avg. 1990-2006
Department of Economics
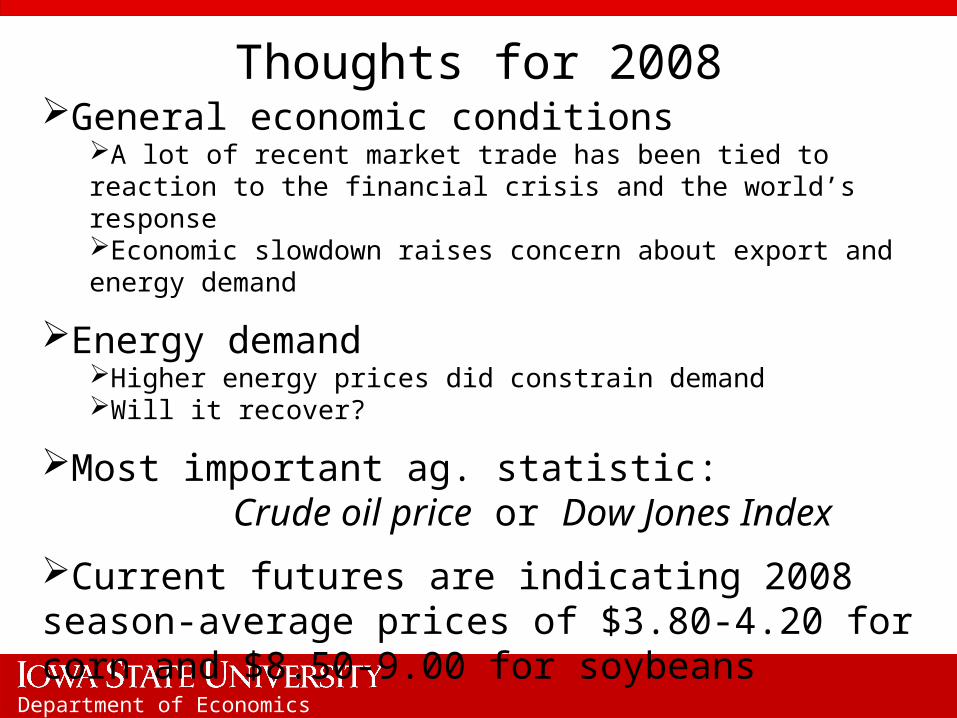
Thoughts for 2008General economic conditions
A lot of recent market trade has been tied to reaction to the financial crisis and the world’s responseEconomic slowdown raises concern about export and energy demand
Energy demandHigher energy prices did constrain demandWill it recover?
Most important ag. statistic: Crude oil price or Dow Jones Index
Current futures are indicating 2008 season-average prices of $3.80-4.20 for corn and $8.50-9.00 for soybeans
Department of Economics
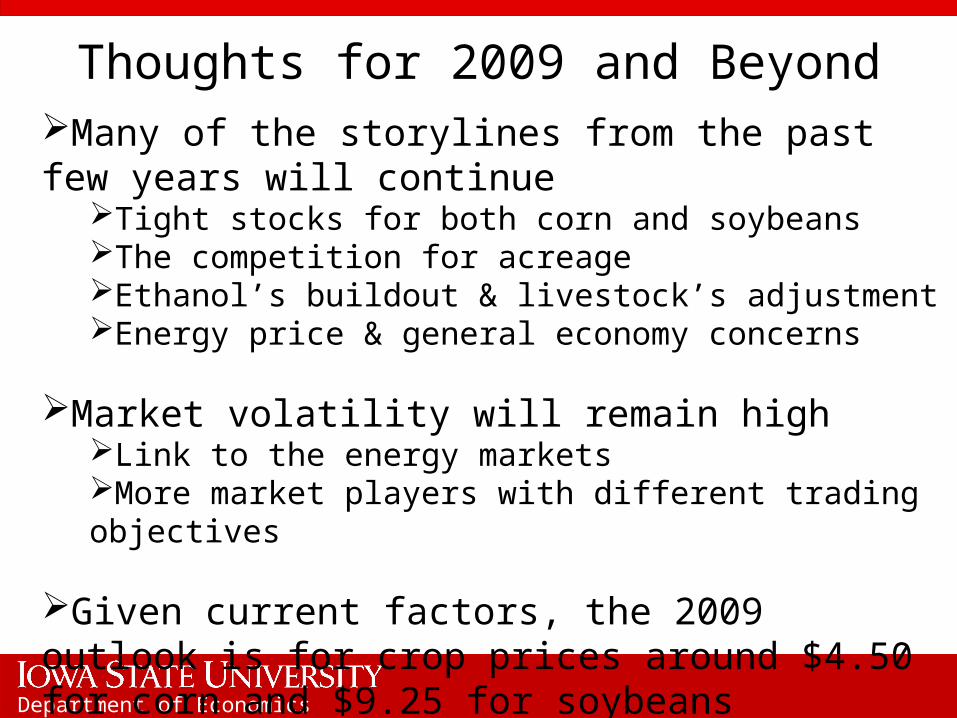
Thoughts for 2009 and BeyondMany of the storylines from the past few years will continue
Tight stocks for both corn and soybeansThe competition for acreageEthanol’s buildout & livestock’s adjustmentEnergy price & general economy concerns
Market volatility will remain highLink to the energy marketsMore market players with different trading objectives
Given current factors, the 2009 outlook is for crop prices around $4.50 for corn and $9.25 for soybeans

Department of Economics
Thank you for your time!
Any questions?