Department of Developmental Services · iii Executive Summary Mission: The California Department of...
65
Department of Developmental Services 2013-2014 Annual Report Employment and Day Programs California Department of Developmental Services 1600 Ninth Street Sacramento, CA 95814 Phone: (916) 654-1690 TTY: (916) 654-2054 Email: DDS Work Services Section
Transcript of Department of Developmental Services · iii Executive Summary Mission: The California Department of...

Department of Developmental Services
2013-2014 Annual Report
Employment and Day Programs
California Department of Developmental Services 1600 Ninth Street Sacramento, CA 95814 Phone: (916) 654-1690 TTY: (916) 654-2054 Email: DDS Work Services Section

i
Table of Contents
Executive Summary . . . . . . . . . . . . . . . . . . . . . . . . . . . . . . . . . . . . . . . . . . . iii
Introduction . . . . . . . . . . . . . . . . . . . . . . . . . . . . . . . . . . . . . . . . . . . . . . . . . vi
Part 1
Employment Rates . . . . . . . . . . . . . . . . . . . . . . . . . . . . . . . . . . . . . . 2
Annual Earnings Comparison . . . . . . . . . . . . . . . . . . . . . . . . . . . . . . 3
Percentage of Change . . . . . . . . . . . . . . . . . . . . . . . . . . . . . . . . . . . 5
Part 2
National Data Reports . . . . . . . . . . . . . . . . . . . . . . . . . . . . . . . . . . . . 7
Part 3
Purchase of Service Cost for Regional Centers . . . . . . . . . . . . . . . . 20
Part 4
Statewide Report Consumers and Programs . . . . . . . . . . . . . . . . . . 23
Part 5
Statewide Report Net Changes . . . . . . . . . . . . . . . . . . . . . . . . . . . . . 30
Part 6
Consumers Services . . . . . . . . . . . . . . . . . . . . . . . . . . . . . . . . . . . . 37
Consumers Diagnosis . . . . . . . . . . . . . . . . . . . . . . . . . . . . . . . . . . . . 38
Purchase of Service Type . . . . . . . . . . . . . . . . . . . . . . . . . . . . . . . . . 40
Part 7
Number of Consumers Reporting They Worked . . . . . . . . . . . . . . . . 43
Working Consumers’ Average per Person Cost . . . . . . . . . . . . . . . . 44

ii
Part 8
Residence by Service Code . . . . . . . . . . . . . . . . . . . . . . . . . . . . . . . 46
Percentage of Residence by Service Code . . . . . . . . . . . . . . . . . . . 49
Part 9
Program by Gender . . . . . . . . . . . . . . . . . . . . . . . . . . . . . . . . . . . . . 53
Program by Gender and Age Groups . . . . . . . . . . . . . . . . . . . . . . . . 56

iii
Executive Summary
Mission: The California Department of Developmental Services (DDS) is committed to providing leadership resulting in quality services to the people of California with intellectual and developmental disabilities (ID/DD) and assuring the opportunity for individuals to exercise their right to make choices. This includes supporting individuals with ID/DD to achieve competitive integrated employment. This report summarizes employment-related data compiled from a variety of sources, including California state agencies and national sources. This report describes the types of day and employment services provided to adults with ID/DD, the comparative costs of those services, and the earnings. In addition, this report provides a breakdown of services by a variety of demographic information such as age, gender and ethnicity.
Background: DDS is one of 12 departments and 1 board comprising the California Health and Human Services Agency. DDS, through the Work Services Section, oversees and administers services provided by 21 regional centers (RC) and three developmental centers (DC), (Lanterman the fourth DC, transitioned the last resident into the community December 2014, the Outpatient Clinic closed June 30, 2015) to address employment needs of people with ID/DD. The laws and regulations that govern the Work Services Programs are:
Lanterman Developmental Disabilities Services Act, enacted in 1969 The Americans with Disabilities Act (ADA) of 1990 California Code of Regulations, Title 17. Public Health – Division 2, Chapter 3:
Community Services, Subchapter 21: Habilitation Services Program established in 2004
Ticket to Work and Work Incentives Improvement Act of 1999 California Welfare and Institutions Code Sections 4868-4869, California
Employment First Policy, enacted in 2013
Over time, these laws and regulations have authorized a variety of service delivery models and funding mechanisms to provide supports during the day for adults with ID/DD. The most recent change was the enactment of the Employment First policy which states:
“...it is the policy of the state that opportunities for integrated, competitive employment shall be given the highest priority for working age individuals with developmental disabilities, regardless of the severity of their disabilities.”
Despite some identified gains in disability rights, individuals with ID/DD continue to face considerable barriers to full integration, independence and self-determination. Unemployment rates for individuals with ID/DD are above those for people with any other disability, and significantly above the general population. The fiscal year 2013-2014 Annual Employment and Day Programs Report provides a variety of information regarding employment and economic outcomes in California for people with ID/DD, and the programs funded to provide employment and day program supports.

iv
Key Findings: As a consequence of the 2008 recession, California’s employment loss for those without disabilities had an extensive economic impact. For those with ID/DD, the decline in employment opportunities and an already low employment rate, resulted in a significantly greater economic impact. The report will show:
Continued population growth since 2008 of adults with ID/DD. An increase in costs of publically funded services. High utilization of day services that typically do not provide, or provide limited,
employment opportunities. Low utilization of services that support competitive integrated employment
services that do provide employment opportunities. An increase in the employment rate and wages of the general population. A decrease in the employment rate and wages of individuals with ID/DD. Stability in the utilization of employment and day services over time. Individuals with ID/DD with individually supported jobs earn, on average, wages
above minimum wage. Over 40 percent of individuals with ID/DD without jobs, would like a job.
Statewide Efforts: DDS currently collaborates with multiple state and national agencies to address the common barriers and policies that impact employment outcomes. This collaborative is known as the California Consortium on Youth with ID/DD (CECY) and is supported by a five-year grant. The CECY project is partnering with DDS, the Department of Rehabilitation, Department of Education, Employment Development Department, the State Council on Developmental Disabilities (SCDD), and other statewide partners, coordinated by the Tarjan Center of the University of California, Los Angeles* to identify and work toward policy changes, thus improving competitive integrated employment outcomes for adults with ID/DD.
This annual report is a key tool used by DDS, CECY, and other stakeholders to identify areas of concern, changes that are needed, and promising practices. Some of the data elements included in the report are used to develop the State of California Developmental Disabilities System Employment Data Dashboard (Data Dashboard) hosted by the SCDD website at SCDD Data Dashboard.
Goals and Recommendations : Identify and develop promising practices including partnerships to help individuals with ID/DD transition from segregated non-work programs and facility-based employment to competitive integrated employment.
Continue to develop data measures that will track the employment rate. Restructure funding to support employment training and support services
consistent with the Employment First policy.
Footnote: *Tarjan Center of the University of California, Los Angeles: A University Center for Excellence in Developmental Disabilities Education, Research and Service. End of footnote.

v
Establish benchmarks and measurable outcomes. Promote strategies to increase the recruitment and hiring of qualified individuals
from the talent pool of people with ID/DD. Develop and update systems to ensure all workers with disabilities are paid an
equitable wage. Empower consumers to advocate for the right to employment consistent with
their interests, talents and education.
There is sufficient evidence that workers with disabilities can meet, or exceed, the job performance of co-workers without disabilities. Part of the solution will be to educate employers on how to begin the process of recruiting employees from the pool of qualified people with disabilities. This report will be one way to measure the progress made annually.

vi
Introduction
This report summarizes economic and employment outcomes for California Department
of Developmental Services (DDS) consumers with intellectual and developmental
disabilities. Consumer information is used to develop program evaluation processes,
project growth in costs, and to develop future outcome-based program changes. Age
group reports, such as a report showing data for 22-31 year olds, provide a look at how
education is preparing young adults who are transitioning from school to work and day
programs.
The DDS Employment and Day Program Annual Report includes community caseloads,
age of individuals served by DDS, purchase of service (POS) dollars expended by
service type, percentage of consumers employed by year, statewide counts of persons
receiving services, per person costs, and percentage of consumers staying in the same
service type year to year. The report includes data aggregated by the following services
and/or categories:
Support Employment Program (SEP) Individual
SEP Group
Work Activity Programs (WAP)
Day Programs
Look Alike Day Programs
Combination of two or more programs
Not In Day Programs or Work Programs
Also, the report summarizes statewide service-type data on level and type of disability,
ethnicity, gender and age, and living arrangements.
Data sources for the report are DDS POS and Client Master File data; Department of
Rehabilitation (DOR) vocational rehabilitation/supported employment data; Employment
Development Department (EDD) unemployment insurance wage data; StateData: The
National Report on Employment Services and Outcomes 2014 published by the Institute
for Community Inclusion (UCEDD), University of Massachusetts Boston; and Cornell
University data based on analysis of United States Census Bureau data.
This report is published annually on the DDS website, where prior editions can be
downloaded as well. Questions regarding this report can be directed to the DDS Work
Services Section at DDS Work Services Section or (916) 651-6309.

1
Part 1
United States and California employment rates for working-age people
(21-64) with and without disabilities.
2013 median annual earnings in the United States, plus California’s
fourth quarter earnings for individuals with developmental disabilities.
Annual percentage changes in unemployment of the regional center
consumers and those consumers receiving wages.
What does this data tell us: The employment rate of people with disabilities
is far lower than the employment rate for people without disabilities; and the
employment rate for people with developmental disabilities is far lower than
the employment rate for people with all types of disabilities.

2
Employment Rates
2013 Comparison of California to the United States employment rates of working-age people
**Please see footnotes for working-age.
Footnote: 1The data is from the 2013 Disability Status Report, United States, by Cornell University, by calendar year based on analysis of the US Census Bureau's, American Community Survey (ACS). The data reflects non-institutionalized working-age people (21-64) with disabilities who work full-time/full year in the United States. Types of disabilities included in the data are: hearing disability, visual disability, cognitive disability, self-care disability, and independent living disability. 2The data is from National Population Statistics, page 49, table 2 (23.4%). Employment Participation for Working-Age People (Ages 16 to 64), StateData: The National Report on Employment Services and Outcomes 2013 published by the Institute for Community Inclusion, UMASS. The data reflects individuals with cognitive disability employed in the United States. 3The data is from Employment Development Department (EDD). CA EDD data is by calendar year (12.5%) and reflects wages reported to EDD for the purpose of unemployment insurance reporting. There is a limitation of the data, as some people have contract earnings that are unreported. End of footnote.
3
Annual Earnings Comparison
2013 Median Earnings of working-age people without a disability, who work full-time/full-year in the United States was $43,300; with a disability was $38,3004.
2013 Median Earnings of working-age people without a disability, who work full-time/full-year in California was $46,800; with a disability was $41,5004.
Department of Developmental Services consumer’s average 2013 yearly wage was $6,4905.
Footnote: 4The data is from the 2013 Disability Status Report, United States and California, by Cornell University, based on analysis of the US Census Bureau's 2013 American Community Survey (ACS) Public Use Microdata Sample (PUMS). The data reflects non-institutionalized working-age people (21-64) with disabilities who work full-time/full year in the United States, compared to California. Types of disabilities included in the data are: hearing disability, visual disability, cognitive disability, self-care disability, and independent living disability. 5The data is from Employment Development Department (EDD). CA EDD data reflects wages reported to EDD for the purpose of unemployment insurance reporting. There is a limitation of the data, as some people have contract earnings that are unreported. End of footnote.

4
State of California Earnings for Individuals with Developmental Disabilities6
Years: 2010 - 2014
Year
4th Qtr. (October-
December) Wages
(Ages 16-64)
4th Qtr. Regional
Center (RC) Consumers (Ages 16-64)
4th Qtr. Consumers Receiving
Wages (Ages 16-64)
4th Qtr. Percentage
of RC Consumers Receiving
Wages (Ages 16-64)
4th Qtr. Average Monthly
Consumer Wages
(Ages 16-64)
Average Yearly
Consumer Wages
(Ages 16-64)
2010 $28,604,005 135,745 17,577 12.95% $542 $6,022
2011 $26,187,981 141,092 17,559 12.45% $497 $5,818
2012 $28,028,196 140,697 17,553 12.48% $532 $6,274
2013 $29,689,611 145,844 17,848 12.24% $554 $6,490
2014 $35,014,444 151,132 19,380 12.82% $565 $6,776
Footnote: 6The data is from Employment Development Department (EDD). CA EDD data reflects wages reported to EDD for the purpose of unemployment insurance reporting. There is a limitation of the data, as some people have contract earnings that are unreported. End of footnote.

5
Percentage of Change
Annual consumer percentage of change for an individual earning wages reportable to the Employment Development Department (EDD)7
Year
Percentage Increase/Decrease in
Total of RC Consumers
Percentage Increase/Decrease of
RC Consumers Receiving Wages
2010-2011 3.9% -0.1%
2011-2012 -0.3% 0.0%
2012-2013 3.7% 1.7%
2013-2014 3.6% 8.6%
2010-2014* 11.3% 10.3%
*Average increase/decrease of 2010 compared to 2014.
Footnote: 7The percentages were calculated by calendar year from California EDD data. CA EDD data reflects wages reported to EDD for the purpose of unemployment insurance reporting. There is a limitation of the data, as some people have contract earnings that are unreported. End of footnote.

6
Part 2
Three consecutive years of California Vocational Rehabilitation (VR)
case closures and employment outcomes from the National Data
Reports.
Comparison of the California report data and the United States VR case
closures and employment outcomes from the National Data Reports.
What does this data tell us: This data shows that consumers with intellectual and developmental disabilities have steady participation rates in VR services compared to all other consumers.
The data also shows California is near the National VR outcome measures, or slightly higher, each year.

7
National Data Reports
California: Vocational Rehabilitation (VR) Case Closures and Employment Outcomes8
Calendar Year 2011 2012 2013
Total number of case closures 42,895 31,183 47,356
Total number of case closures (for persons) with ID* 3,081 2,343 3,503
Percentage of ID case closures from the total closures 7.2% 7.5% 7.4%
*ID: Intellectual Disability
Footnote: 8StateData: The National Report on Employment Services and Outcomes 2014, Institute for Community Inclusion (UCEDD), University of Massachusetts Boston, page 83, table 8. All data is from the Rehabilitation Services Administration 911 (RSA-911) dataset. For the purpose of this report, a person was considered to have an ID, if code 25 ("mental retardation" in the RSA-911 dataset) was reported as the cause of either a primary or secondary impairment to employment. This is different from previous reports, in which the StateData report included people with other developmental disabilities, such as autism, cerebral palsy, and epilepsy. In addition, previous editions of the StateData report focused exclusively on the primary, rather than primary and secondary, cause of impairment. End of footnote.

8
National Data Reports
National: Vocational Rehabilitation (VR) Case Closures and Employment Outcomes9
Calendar Year 2011 2012 2013
Total number of case closures 581,258 571,975 582,323
Total number of case closures (for persons) with ID* 47,812 46,672 48,847
Percentage of ID case closures from the total closures 8.2% 8.2% 8.4%
*ID: Intellectual Disability
Footnote: 9StateData: The National Report on Employment Services and Outcomes 2014, Institute for Community Inclusion (UCEDD), University of Massachusetts Boston, page 53, table 8. All data is from the Rehabilitation Services Administration 911 (RSA-911) dataset. For the purpose of this report, a person was considered to have an ID, if code 25 ("mental retardation" in the RSA-911 dataset) was reported as the cause of either a primary or secondary impairment to employment. This is different from previous reports, in which the StateData report included people with other developmental disabilities, such as autism, cerebral palsy, and epilepsy. In addition, previous editions of the StateData report focused exclusively on the primary, rather than primary and secondary, cause of impairment. End of footnote.

9
National Data Reports
California: Vocational Rehabilitation (VR) Case Closures and Employment Outcomes10
Calendar Year 2011 2012 2013
Closures with a job 11,602 11,187 12,239
Closures (for persons) with ID* with a job 1,348 1,217 1,291
Comparison Percentage 11.6% 10.9% 10.5%
*ID: Intellectual Disability
Footnote: 10StateData: The National Report on Employment Services and Outcomes 2014, Institute for Community Inclusion (UCEDD), University of Massachusetts Boston, page 83, table 8. All data is from the Rehabilitation Services Administration 911 (RSA-911) dataset. For the purpose of this report, a person was considered to have an ID, if code 25 ("mental retardation" in the RSA-911 dataset) was reported as the cause of either a primary or secondary impairment to employment. This is different from previous reports, in which the StateData report included people with other developmental disabilities, such as autism, cerebral palsy, and epilepsy. In addition, previous editions of the StateData report focused exclusively on the primary, rather than primary and secondary, cause of impairment. End of footnote.
10
National Data Reports
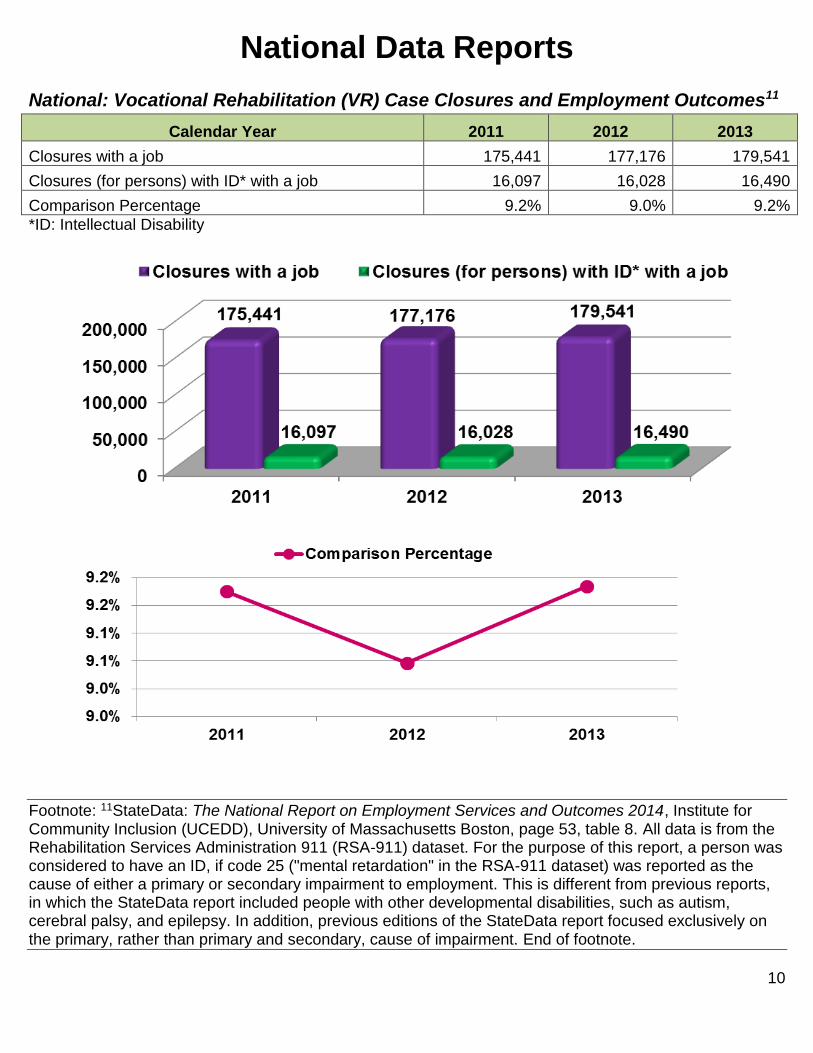
National: Vocational Rehabilitation (VR) Case Closures and Employment Outcomes11
Calendar Year 2011 2012 2013
Closures with a job 175,441 177,176 179,541
Closures (for persons) with ID* with a job 16,097 16,028 16,490
Comparison Percentage 9.2% 9.0% 9.2%
*ID: Intellectual Disability
Footnote: 11StateData: The National Report on Employment Services and Outcomes 2014, Institute for Community Inclusion (UCEDD), University of Massachusetts Boston, page 53, table 8. All data is from the Rehabilitation Services Administration 911 (RSA-911) dataset. For the purpose of this report, a person was considered to have an ID, if code 25 ("mental retardation" in the RSA-911 dataset) was reported as the cause of either a primary or secondary impairment to employment. This is different from previous reports, in which the StateData report included people with other developmental disabilities, such as autism, cerebral palsy, and epilepsy. In addition, previous editions of the StateData report focused exclusively on the primary, rather than primary and secondary, cause of impairment. End of footnote.

11
National Data Reports
California: Vocational Rehabilitation (VR) Case Closures and Employment Outcomes12
Calendar Year 2011 2012 2013
Closures with a plan but no job 15,205 8,120 20,737
Closures (for persons) with ID* and a plan but with no job 1,172 615 1,514
Comparison Percentage 7.7% 7.6% 7.3%
*ID: Intellectual Disability
Footnote: 12StateData: The National Report on Employment Services and Outcomes 2014, Institute for Community Inclusion (UCEDD), University of Massachusetts Boston, page 83, table 8. All data is from the Rehabilitation Services Administration 911 (RSA-911) dataset. For the purpose of this report, a person was considered to have an ID, if code 25 ("mental retardation" in the RSA-911 dataset) was reported as the cause of either a primary or secondary impairment to employment. This is different from previous reports, in which the StateData report included people with other developmental disabilities, such as autism, cerebral palsy, and epilepsy. In addition, previous editions of the StateData report focused exclusively on the primary, rather than primary and secondary, cause of impairment. End of footnote.

12
National Data Reports
National: Vocational Rehabilitation (VR) Case Closures and Employment Outcomes13
Calendar Year 2011 2012 2013
Closures with a plan but no job 150,980 141,971 156,654
Closures (for persons) with ID* and a plan but with no job 15,227 14,329 15,949
Comparison Percentage 10.1% 10.1% 10.2%
*ID: Intellectual Disability
Footnote: 13StateData: The National Report on Employment Services and Outcomes 2014, Institute for Community Inclusion (UCEDD), University of Massachusetts Boston, page 53, table 8. All data is from the Rehabilitation Services Administration 911 (RSA-911) dataset. For the purpose of this report, a person was considered to have an ID, if code 25 ("mental retardation" in the RSA-911 dataset) was reported as the cause of either a primary or secondary impairment to employment. This is different from previous reports, in which the StateData report included people with other developmental disabilities, such as autism, cerebral palsy, and epilepsy. In addition, previous editions of the StateData report focused exclusively on the primary, rather than primary and secondary, cause of impairment. End of footnote.

13
National Data Reports
California: Vocational Rehabilitation (VR) Case Closures and Employment Outcomes14
Calendar Year 2011 2012 2013
Closures with supported employment as a goal 3,128 2,214 3,211
Closures (for persons) with ID* and supported employment as a goal 2,201 1,504 2,102
Comparison Percentage 70.4% 67.9% 65.5%
*ID: Intellectual Disability
Footnote: 14StateData: The National Report on Employment Services and Outcomes 2014, Institute for Community Inclusion (UCEDD), University of Massachusetts Boston, page 83, table 8. All data is from the Rehabilitation Services Administration 911 (RSA-911) dataset. For the purpose of this report, a person was considered to have an ID, if code 25 ("mental retardation" in the RSA-911 dataset) was reported as the cause of either a primary or secondary impairment to employment. This is different from previous reports, in which the StateData report included people with other developmental disabilities, such as autism, cerebral palsy, and epilepsy. In addition, previous editions of the StateData report focused exclusively on the primary, rather than primary and secondary, cause of impairment. End of footnote.

14
National Data Reports
National: Vocational Rehabilitation (VR) Case Closures and Employment Outcomes15
Calendar Year 2011 2012 2013
Closures with supported employment as a goal 34,396 35,457 39,865
Closures (for persons) with ID* and supported employment as a goal 13,771 13,351 14,688
Comparison Percentage 40.0% 37.7% 36.8%
*ID: Intellectual Disability
Footnote: 15StateData: The National Report on Employment Services and Outcomes 2014, Institute for Community Inclusion (UCEDD), University of Massachusetts Boston, page 53, table 8. All data is from the Rehabilitation Services Administration 911 (RSA-911) dataset. For the purpose of this report, a person was considered to have an ID, if code 25 ("mental retardation" in the RSA-911 dataset) was reported as the cause of either a primary or secondary impairment to employment. This is different from previous reports, in which the StateData report included people with other developmental disabilities, such as autism, cerebral palsy, and epilepsy. In addition, previous editions of the StateData report focused exclusively on the primary, rather than primary and secondary, cause of impairment. End of footnote.

15
National Data Reports
California: Vocational Rehabilitation (VR) Case Closures and Employment Outcomes16
Calendar Year 2011 2012 2013
Rehabilitation rate for all closures with an IPE* 43.3% 57.9% 37.1%
Rehabilitation rate for all closures (for persons) with ID** 53.5% 66.4% 46.0%
*IPE: Individual Plan for Employment **ID: Intellectual Disability, Rehabilitation Rate = (# closures into employment) / (# closures into employment + # closures with an IPE but no employment outcome)
Footnote: 16StateData: The National Report on Employment Services and Outcomes 2014, Institute for Community Inclusion (UCEDD), University of Massachusetts Boston, page 83, table 8. All data is from the Rehabilitation Services Administration 911 (RSA-911) dataset. For the purpose of this report, a person was considered to have an ID, if code 25 ("mental retardation" in the RSA-911 dataset) was reported as the cause of either a primary or secondary impairment to employment. This is different from previous reports, in which the StateData report included people with other developmental disabilities, such as autism, cerebral palsy, and epilepsy. In addition, previous editions of the StateData report focused exclusively on the primary, rather than primary and secondary, cause of impairment. End of footnote.

16
National Data Reports
National: Vocational Rehabilitation (VR) Case Closures and Employment Outcomes17
Calendar Year 2011 2012 2013
Rehabilitation rate for all closures with an IPE* 53.7% 55.5% 53.4%
Rehabilitation rate for all closures (for persons) with ID** 51.4% 52.8% 50.8%
*IPE: Individual Plan for Employment **ID: Intellectual Disability, Rehabilitation Rate = (# closures into employment) / (# closures into employment + # closures with an IPE but no employment outcome)
Footnote: 17StateData: The National Report on Employment Services and Outcomes 2014, Institute for Community Inclusion (UCEDD), University of Massachusetts Boston, page 53, table 8. All data is from the Rehabilitation Services Administration 911 (RSA-911) dataset. For the purpose of this report, a person was considered to have an ID, if code 25 ("mental retardation" in the RSA-911 dataset) was reported as the cause of either a primary or secondary impairment to employment. This is different from previous reports, in which the StateData report included people with other developmental disabilities, such as autism, cerebral palsy, and epilepsy. In addition, previous editions of the StateData report focused exclusively on the primary, rather than primary and secondary, cause of impairment. End of footnote.

17
National Data Reports
California: Vocational Rehabilitation (VR) Case Closures and Employment Outcomes18
Calendar Year 2011 2012 2013
Percentage of all closures with a job 27.0% 35.9% 25.8%
Percentage of all closures (for persons) with ID* with a job 43.8% 51.9% 36.9%
*ID: Intellectual Disability
Footnote: 18StateData: The National Report on Employment Services and Outcomes 2014, Institute for Community Inclusion (UCEDD), University of Massachusetts Boston, page 83, table 8. All data is from the Rehabilitation Services Administration 911 (RSA-911) dataset. For the purpose of this report, a person was considered to have an ID, if code 25 ("mental retardation" in the RSA-911 dataset) was reported as the cause of either a primary or secondary impairment to employment. This is different from previous reports, in which the StateData report included people with other developmental disabilities, such as autism, cerebral palsy, and epilepsy. In addition, previous editions of the StateData report focused exclusively on the primary, rather than primary and secondary, cause of impairment. End of footnote.

18
National Data Reports
National: Vocational Rehabilitation (VR) Case Closures and Employment Outcomes19
Calendar Year 2011 2012 2013
Percentage of all closures with a job 30.2% 30.9% 30.8%
Percentage of all closures (for persons) with ID* with a job 33.7% 34.3% 33.8%
*ID: Intellectual Disability
Footnote: 19StateData: The National Report on Employment Services and Outcomes 2014, Institute for Community Inclusion (UCEDD), University of Massachusetts Boston, page 53, table 8. All data is from the Rehabilitation Services Administration 911 (RSA-911) dataset. For the purpose of this report, a person was considered to have an ID, if code 25 ("mental retardation" in the RSA-911 dataset) was reported as the cause of either a primary or secondary impairment to employment. This is different from previous reports, in which the StateData report included people with other developmental disabilities, such as autism, cerebral palsy, and epilepsy. In addition, previous editions of the StateData report focused exclusively on the primary, rather than primary and secondary, cause of impairment. End of footnote.

19
Part 3
Percentage of cost for regional centers funded services, fiscal year
2013/2014 and fiscal year 2009/2010.
What does this data tell us: This data shows us the regional center purchase of service programs funding changes over time. With the decline in work activity programs, the day and look alike programs indicate an increase in programs and funding.

20
Purchase of Service Cost for Regional Centers
Percentage of Cost for Regional Center Funded Services – All Ages
Fiscal Year 13/1420
Budget Category POS Dollars % of Total
Out-of Home $952,184,796.54 24.5%
Day Programs $871,014,736.79 22.4%
Support Services $864,551,676.01 22.3%
Misc. Services $437,186,184.41 11.3%
Transportation $251,106,108.49 6.5%
In-Home Respite $220,542,945.76 5.7%
Supported Employment $91,877,164.73 2.4%
Health Care $90,578,428.77 2.3%
Work Activity Program $57,329,431.23 1.5%
Out-of-Home Respite $42,492,739.99 1.1%
Total $3,878,864,212.72 100.0%
Footnote: 20FY 13/14 Information Systems Data purchase of service dollars, by budget category, as of January 2015. End of footnote.

21
Purchase of Service Cost for Regional Centers
Percentage of Cost for Regional Center Funded Services – All Ages
Fiscal Year 09/1021
Budget Category POS Dollars % of Total
Out-of-Home $810,461,393.31 23.9%
Day Program $757,008,391.92 22.3%
Support Services $677,377,349.08 20.0%
Misc. Services $442,679,735.45 13.1%
Transportation $218,630,821.75 6.4%
In-Home Respite $209,115,961.01 6.2%
Supported Employment $87,207,263.98 2.6%
Health Care $78,416,694.01 2.3%
Work Activity Program $58,169,416.33 1.7%
Out-of-Home Respite $51,028,278.06 1.5%
Total $3,390,095,304.90 100.0%
Footnote: 21FY 13/14 Information Systems Data purchase of service dollars, by budget category, as of January 2015. End of footnote.

22
Part 4
Statewide report for the number of regional center consumers by service
code.
Average statewide regional center purchase of service cost by service
code.
Statewide percentage of regional center consumers by age groupings
(16-99 and 22-31) staying in the same service type.
Comparison of statewide percentage of regional center consumers
staying in the same service type.
What does this data tell us: This data shows us that utilization of day and look alike programs increased faster than supported employment programs. The data also shows a slow, steady decline in the utilization of work activity programs.
Finally, the data shows, that over time consumers tend to stay in the same service.

23
Statewide Report Consumers and Programs
Number of regional center consumers (16 or older) receiving services: Statewide22
Fiscal Year
Supported Employment
Programs Individual
Supported Employment
Programs Group
Work Activity Programs
Day Program Look Alike
Day Programs
10/11 4,683 5,932 10,612 43,687 10,719
11/12 4,506 5,425 10,295 45,571 11,197
12/13 4,345 5,589 10,242 47,531 12,131
13/14 4,341 5,729 10,036 49,619 13,238
Footnote: 22Data from DDS Purchase of Service System Habilitation Services transition FY 10/11-13/14. End of footnote.

24
Statewide Report Consumers and Programs
Regional center per person (16 or older) purchase of services (POS) cost: Statewide23
Fiscal Year
Supported Employment
Programs Individual
Supported Employment
Programs Group
Work Activity Programs
Day Programs Look Alike
Day Programs
10/11 $4,118 $10,836 $5,301 $11,718 $14,275
11/12 $4,081 $12,495 $5,471 $11,749 $14,737
12/13 $4,069 $12,534 $5,576 $12,015 $14,995
13/14 $4,122 $12,718 $5,715 $12,138 $15,421
Footnote: 23Data from DDS Purchase of Service System Habilitation Services transition FY 10/11-13/14. End of footnote.

25
Statewide Report Consumers and Programs
Percentage of regional center consumers ages 16-99, who stayed in the same service type year to year: Statewide24
FY 10/11-11/12 FY 11/12-12/13 FY 12/13-13/14
SEP Individual* 85% 85% 86%
SEP Group* 78% 83% 83%
Work Activity Programs 82% 82% 82%
Day Programs 92% 92% 91%
Look Alike Day Programs 82% 84% 82%
Combination 52% 61% 61%
Not in Day or Work Programs 72% 68% 61%
*Supported Employment Programs (SEP)
Footnote: 24Data from DDS Purchase of Services System transition between SEP Individual, SEP Group, Work Activity Programs, Day Programs, Look Alike Day Programs, Combination, and Not in Day or Work Programs, by fiscal year. End of footnote.

26
Statewide Report Consumers and Programs
Comparison percentage of regional center consumers ages 16-99, who stayed in the same service type FY 10/11 and 13/14: Statewide25
Age Range 16-99 FY 10/11 and 13/14
SEP Individual* 60%
SEP Group* 53%
Work Activity Programs 55%
Day Programs 77%
Look Alike Day Programs 53%
Combination 30%
Not in Day or Work Programs 16%
*Supported Employment Programs (SEP)
Footnote: 25Data from DDS Purchase of Services System transition between SEP Individual, SEP Group, Work Activity Programs, Day Programs, Look Alike Day Programs, Combination, and Not in Day or Work Programs, by fiscal year. End of footnote.

27
Statewide Report Consumers and Programs
Percentage of regional center consumers ages 22-31, who stayed in the same service type year to year: Statewide26
FY 10/11-11/12 FY 11/12-12/13 FY 12/13-13/14
SEP Individual* 78% 75% 75%
SEP Group* 71% 74% 77%
Work Activity Programs 73% 73% 72%
Day Programs 86% 85% 84%
Look Alike Day Programs 76% 79% 76%
Combination 48% 55% 57%
Not in Day or Work Programs 73% 69% 64%
*Supported Employment Programs (SEP)
Footnote: 26Data from DDS Purchase of Services System transition between SEP Individual, SEP Group, Work Activity Programs, Day Programs, Look Alike Day Programs, Combination, and Not in Day or Work Programs, by fiscal year. End of footnote.

28
Statewide Report Consumers and Programs
Comparison percentage of regional center consumers ages 22-31, who stayed in the same service type FY 10/11 and 13/14: Statewide27
Age Range 22-31 FY 10/11 and 13/14
SEP Individual* 35%
SEP Group* 35%
Work Activity Programs 33%
Day Programs 53%
Look Alike Day Programs 41%
Combination 20%
Not in Day or Work Programs 15%
*Supported Employment Programs (SEP)
Footnote: 27Data from DDS Purchase of Services System transition between SEP Individual, SEP Group, Work Activity Programs, Day Programs, Look Alike Day Programs, Combination, and Not in Day or Work Programs, by fiscal year. End of footnote.

29
Part 5
Statewide regional center net changes in consumers transferring out of
Supported Employment Programs (SEP) Individual.
California regional center net changes in consumers transferring into
SEP Individual.
Statewide regional center net changes in consumers transferring out of
SEP group.
California regional center net changes in consumers transferring into
SEP group.
What does this data tell us: This data shows the movement of consumers into and out of SEP. It also shows what service consumers are leaving to move into SEP and which service they are moving out of SEP.

30
Statewide Report Net Changes
Net changes in Supported Employment Programs (SEP) Individual population FY 10/11 thru FY 13/14: Statewide28
Transfers out of SEP Individual FY 10/11 thru 13/14
Ages
Total FY
10/11 SEP Indv
SEP Grp
Work Activity Program
Day Program
Look Alike Day Programs Combo
Not in Day or Work
Programs
16-99 IP 4,448 2,681 145 117 205 103 64 1,133
22-31 IP 1,625 563 44 17 52 16 19 914
Below graph reflects the number of consumers (16-99), transferring out of SEP Individual, into the following programs: SEP Group, Work Activity Programs (WAP), Day Programs, Look Alike Day Programs, Combo, and Not in Day or Work Programs.
Below graph reflects the number of 22-31 year old consumers, transferring out of SEP Individual, into the following Programs: SEP Group, WAP, Day Programs, Look Alike Day Programs, Combo, and Not in Day or Work Programs.
Footnote: 28Data from DDS Purchase of Service System transition between SEP Individual, SEP Group, WAP, Day Programs, Look Alike Day Programs, Combo, and Not in Day or Work Programs, by fiscal year. End of footnote.

31
Statewide Report Net Changes
Net changes in Supported Employment Programs (SEP) Individual population FY 10/11 thru FY 13/14: Statewide29
Transfers into SEP Individual FY 10/11 thru 13/14
Ages
Total FY
10/11 SEP Indv
SEP Grp
Work Activity
Programs Day
Programs
Look Alike Day Programs Combo
Not in Day or Work
Programs
16-99 IP 3,987 2,681 157 44 63 66 38 938
22-31 IP 1,383 563 57 15 29 29 12 678
Below graph reflects the number of consumers (16-99), transferring out of SEP Individual, into the following programs: SEP Group, Work Activity Programs (WAP), Day Programs, Look Alike Day Programs, Combo, and Not in Day or Work Programs.
Below graph reflects the number of 22-31 year old consumers, transferring out of SEP Individual, into the following Programs: SEP Group, WAP, Day Programs, Look Alike Day Programs, Combo, and Not in Day or Work Programs.
Footnote: 29Data from DDS Purchase of Service System transition between SEP Individual, SEP Group, WAP, Day Programs, Look Alike Day Programs, Combo, and Not in Day or Work Programs, by fiscal year. End of footnote.

32
Statewide Report Net Changes
Net changes in Supported Employment Programs (SEP) Individual population FY 10/11 thru FY 13/14: Statewide30
Net changes for movement in and out of SEP Individual FY 10/11 thru 13/14
Ages
Total FY
10/11 SEP Indv
SEP Grp
Work Activity
Programs Day
Programs
Look Alike Day Programs Combo
Not in Day or Work
Programs
16-99 IP -461 0 12 -73 -142 -37 -26 -195
22-31 IP -242 0 13 -2 -23 13 -7 -236
Below graph reflects the net number of consumers (16-99), transferring into SEP Individual from the following programs: SEP Group, Work Activity Programs (WAP), Day Programs, Look Alike Day Programs, Combo, and Not in Day or Work Programs.
Below graph reflects the net number of 22-31 year old consumers, transferring into SEP Individual from the following programs: SEP Group, WAP, Day Programs, Look Alike Day Programs, Combo, and Not in Day or Work Programs.
Footnote: 30Data from DDS Purchase of Service System transition between SEP Individual, SEP Group, WAP, Day Programs, Look Alike Day Programs, Combo, and Not in Day or Work Programs, by fiscal year. End of footnote.

33
Statewide Report Net Changes
Net changes in Supported Employment Programs (SEP) Group population FY 10/11 thru FY 13/14: Statewide31
Transfers out of SEP Group FY 10/11 thru 13/14
Ages
Total FY
10/11 SEP Grp
SEP Indv
Work Activity
Programs Day
Programs
Look Alike Day Programs Combo
Not in Day or Work
Programs
16-99 IP 5,097 2,710 157 483 444 179 40 1,084
22-31 IP 1,926 669 57 79 93 46 10 972
Below graph reflects the number of consumers (16-99), transferring out of SEP Group into the following programs: SEP Individual, Work Activity Programs (WAP), Day Programs, Look Alike Day Programs, Combo, and Not in Day or Work Programs.
Below graph reflects the number of 22-31 year old consumers, transferring out of SEP Group into the following programs: SEP Individual, WAP, Day Programs, Look Alike Day Programs, Combo, and Not in Day or Work Programs.
Footnote: 31Data from DDS Purchase of Service System transition between SEP Individual, SEP Group, WAP, Day Programs, Look Alike Day Programs, Combo, and Not in Day or Work Programs, by fiscal year. End of footnote.

34
Statewide Report Net Changes
Net changes in Supported Employment Programs (SEP) Group population FY 10/11 thru FY 13/14: Statewide32
Transfers into SEP Group FY 10/11 thru 13/14
Ages
Total FY
10/11 SEP Grp
SEP Indv
Work Activity
Programs Day
Programs
Look Alike Day Programs Combo
Not In Day or Work
Programs
16-99 IP 5,131 2,710 145 429 148 105 60 1,534
22-31 IP 2,091 669 44 148 59 25 19 1,127
Below graph reflects the number of consumers (16-99), transferring into SEP Group from the following programs: SEP Individual, Work Activity Programs (WAP), Day Programs, Look Alike Day Programs, Combo, and Not in Day or Work Programs.
Below graph reflects the number of 22-31 year old consumers, transferring into SEP Group from the following programs: SEP Individual, WAP, Day Programs, Look Alike Day Programs, Combo, and Not in Day or Work Programs.
Footnote: 32Data from DDS Purchase of Service System transition between SEP Individual, SEP Group, WAP, Day Programs, Look Alike Day Programs, Combo, and Not in Day or Work Programs, by fiscal year. End of footnote.

35
Statewide Report Net Changes
Net changes in Supported Employment Programs (SEP) Group population FY 10/11 thru FY 13/14: Statewide33
Net changes for movement in and out of SEP Group FY 10/11 thru 13/14
Ages
Total FY
10/11 SEP Grp
SEP Indv
Work Activity
Programs Day
Programs
Look Alike Day Programs Combo
Not In Day or Work
Programs
16-99 IP 34 0 -12 -54 -296 -74 20 450
22-31 IP 165 0 -13 69 -34 -21 9 155
Below graph reflects the net number of consumers (16-99), transferring into SEP Group from the following programs: SEP Individual, Work Activity Programs (WAP), Day Programs, Look Alike Day Programs, Combo, and Not in Day or Work Programs.
Below graph reflects the net number of 22-31 year old consumers, transferring into SEP Group from the following programs: SEP Individual, WAP, Day Programs, Look Alike Day Programs, Combo, and Not in Day or Work Programs.
Footnote: 33Data from DDS Purchase of Service System transition between SEP Individual, SEP Group, WAP, Day Programs, Look Alike Day Programs, Combo, and Not in Day or Work Programs, by fiscal year. End of footnote.

36
Part 6
California regional center consumers moving from service to service
and those staying in the same service, by age groups.
Regional center consumers in multiple services, and those staying in
the same service by diagnosis, and age groups.
Consumers in multiple or same service types, average cost for
purchase of service, by fiscal years and age grouping.
What does this data tell us: This data shows us consumers usually stay in the same service over time, no matter what their diagnosis(es), or age is.

37
Consumers Services34
Age Group Multiple Services Same Service
17 or Younger 7 2,416
18-21 442 3,267
22-31 7,359 24,195
32 or Older 11,615 43,784
Grand Total 19,423 73,662
Multiple Services: Consumers that move from one service to another. Same Services: Consumers that stay in the same services.
Footnote: 34Data from DDS Purchase of Service System showing consumers moving from service to service by age group. The report contains a list of consumers who received 505, 515, 063, 950, 954 services during FY 10/11 to FY 13/14. A variable indicating if the consumer utilized only one service code (Same Service), or utilized multiple service codes (Multiple Services), and No/Yes indicators for each of the five diagnosis categories (ID, Autism, Cerebral Palsy, Epilepsy, and Fifth Category). Consumer age was calculated as of January 22, 2015. End of footnote.

38
Consumers Diagnosis(es)35
Multiple Services
Intellectual Disability Autism
Cerebral Palsy Epilepsy
Fifth Category
Age Group NO YES NO YES NO YES NO YES NO YES
17 or Younger 5 2 1 6 6 1 6 1 6 1
18-21 172 270 295 147 409 33 392 50 373 69
22-31 1,486 5,873 6,098 1,261 6,436 923 6,074 1,285 6,327 1,032
32-99 1,208 10,407 10,946 669 9,893 1,722 8,956 2,659 10,499 1,116
NOTE: Consumers may have one or more diagnosis and may be counted more than once.
Footnote: 35Data from DDS Purchase of Service System showing consumers moving from service to service by age group. The report contains a list of consumers who received 505, 515, 063, 950, 954 services during FY 10/11 to FY 13/14. A variable indicating if the consumer utilized only one service code (Same Service), or utilized multiple service codes (Multiple Services), and No/Yes indicators for each of the five diagnosis categories (ID, Autism, Cerebral Palsy, Epilepsy, and Fifth Category). Consumer age was calculated as of January 22, 2015. End of footnote.

39
Consumers Diagnosis(es)36
Same Service
Intellectual Disability Autism
Cerebral Palsy Epilepsy
Fifth Category
Age Group NO YES NO YES NO YES NO YES NO YES
17 or Younger 1,679 737 744 1,672 2,292 124 2,252 164 2,273 143
18-21 1,251 2,016 2,084 1,183 2,935 332 2,887 380 2,810 457
22-31 4,420 19,775 20,123 4,072 19,946 4,249 19,349 4,846 21,439 2,756
32-99 4,172 39,612 40,673 3,111 35,241 8,543 32,125 11,659 39,912 3,872
NOTE: Consumers may have one or more diagnosis and may be counted more than once.
Footnote: 36Data from DDS Purchase of Service System showing consumers moving from service to service by age group. The report contains a list of consumers who received 505, 515, 063, 950, 954 services during FY 10/11 to FY 13/14. A variable indicating if the consumer utilized only one service code (Same Service), or utilized multiple service codes (Multiple Services), and No/Yes indicators for each of the five diagnosis categories (ID, Autism, Cerebral Palsy, Epilepsy, and Fifth Category). Consumer age was calculated as of January 22, 2015. End of footnote.

40
Purchase of Service Type37
Multiple Services FY 9/10 FY 10/11 FY 11/12 FY 12/13 FY 13/14
17 or Younger $4,281.43 $415.14 $1,529.43 $1,344.14 $4,219.57
18-21 $748.43 $1,394.92 $4,064.77 $6,081.25 $9,077.59
22-31 $6,611.20 $7,751.70 $8,883.35 $9,983.65 $10,873.25
32-99 $9,582.31 $9,951.45 $10,258.25 $10,656.66 $11,176.99
Footnote: 37Data from DDS Purchase of Service System showing consumers moving from service to service by age group. The report contains a list of consumers who received 505, 515, 063, 950, 954 services during FY 10/11 to FY 13/14. A variable indicating if the consumer utilized only one service code (Same Service), or utilized multiple service codes (Multiple Services), and No/Yes indicators for each of the five diagnosis categories (ID, Autism, Cerebral Palsy, Epilepsy, and Fifth Category). Consumer age was calculated as of January 22, 2015. End of footnote.

41
Purchase of Service Type38
Same Service FY 9/10 FY 10/11 FY 11/12 FY 12/13 FY 13/14
17 or Younger $1,303.91 $1,326.15 $1,607.06 $1,823.64 $1,873.91
18-21 $560.54 $692.41 $1,515.94 $2,800.80 $5,029.06
22-31 $5,172.35 $6,136.12 $7,120.72 $8,323.23 $9,502.01
32-99 $9,750.49 $9,585.14 $9,511.72 $9,622.00 $9,593.49
Footnote: 38Data from DDS Purchase of Service System showing consumers moving from service to service by age group. The report contains a list of consumers who received 505, 515, 063, 950, 954 services during FY 10/11 to FY 13/14. A variable indicating if the consumer utilized only one service code (Same Service), or utilized multiple service codes (Multiple Services), and No/Yes indicators for each of the five diagnosis categories (ID, Autism, Cerebral Palsy, Epilepsy, and Fifth Category). Consumer age was calculated as of January 22, 2015. End of footnote.

42
Part 7
Regional center consumers reporting they worked, by service programs
and ethnic groups, from the Client Development Evaluation Report
(CDER).
Average per person cost by ethnic groups.
What does this data tell us: These data reports show consumers’ participation rates by ethnicity in regional center funded services. They include consumers reporting they worked and per person costs by service and ethnicity.

43
Number of Consumers Reporting They Worked Ages 16 and Older, Fiscal Year 13/1439
Asian
Black or African
American Hispanic White Other
Groups
SEP Individual* 240 382 827 2,131 224
SEP Group* 311 669 1,381 2,215 239
Work Activity Programs 716 924 1,992 3,825 374
Day Programs 776 1,338 2,713 6,385 644
Look Alike Day Programs 195 443 632 2,122 189
Not in Day or Work Programs 1,643 3,186 5,965 13,853 1,273
*Supported Employment Programs (SEP)
Footnote: 39Data from DDS Purchase of Service System Habilitation Services transition, with Client Development Evaluation Report (CDER) variances, FY 10/11-13/14. Hours worked per week for pay include “Less than 20 hours, 10 to 25 hours, 26 to 39 hours, or 40 hours or more”. Data is self-reported by consumers for CDER, and does not include other data sources. End of footnote.

44
Working Consumers’ Average per Person Cost Ages 16 and Older, Fiscal Year 13/1440
Asian
Black or African
American Hispanic White Other
Groups
SEP Individual* $3,965 $4,983 $4,761 $4,016 $4,120
SEP Group* $13,317 $13,194 $13,662 $13,274 $12,134
Work Activity Programs $6,429 $6,256 $6,056 $6,166 $5,996
Day Programs $12,566 $12,644 $12,180 $12,126 $12,313
Look Alike Day Programs $13,844 $13,442 $13,019 $15,128 $16,837
Not in Day or Work Programs $12,272 $16,937 $11,426 $18,526 $16,242
*Supported Employment Programs (SEP)
Footnote: 40Data from DDS Purchase of Service System Habilitation Services transition, with Client Development Evaluation Report (CDER) variances, FY 10/11-13/14. Data is self-reported by consumers for CDER, and does not include other data sources. End of footnote.

45
Part 8
Number of regional center consumers ages 18 and older, by residence
type and service program, from the Client Development Evaluation
Report.
Percentage of consumers ages 22-31, from the number of regional
center consumers ages 18 and older, by residence type and service
program.
What does this data tell us: This data shows where people live, and the type of services they receive, by two different age groupings.

46
Residence by Service Code, Ages 18 and Older41
FY 13/14
Own Home/Parent
Guardian Own Home
Independent Supported
Living
Community Care
Facility Licensed
by Department
of Social Services
Intermediate Care Facility
Skilled Nursing Facility
Licensed by Department
of Public Health
Foster Care,
Family Home, Foster Home
All Other
SEP Individual* 2,265 1,399 432 189 9 29 14
SEP Group* 3,038 1,299 465 786 23 86 32
Work Activity Programs 5,455 1,259 371 2,498 240 150 56
Day Programs 23,432 2,348 2,163 15,008 5,750 654 258
Look Alike Day Programs 6,417 1,300 1,383 2,943 706 255 116
Not in Day or Work Programs 32,573 8,638 5,487 21,020 6,165 1,150 634
*Supported Employment Programs (SEP)
Footnote: 41Data from DDS Purchase of Service System Habilitation Services transition, with Client Development Evaluation Report (CDER) variances, FY 10/11-13/14. Data is self-reported by consumers for CDER, and does not include other data sources. End of footnote.

47
Residence by Service Code (Cont.)42
Footnote: 42Data from DDS Purchase of Service System Habilitation Services transition, with Client Development Evaluation Report (CDER) variances, FY 10/11-13/14. Data is self-reported by consumers for CDER, and does not include other data sources. End of footnote.

48
Residence by Service Code (Cont.)43
Footnote: 43Data from DDS Purchase of Service System Habilitation Services transition, with Client Development Evaluation Report (CDER) variances, FY 10/11-13/14. Data is self-reported by consumers for CDER, and does not include other data sources. End of footnote.

49
Percentage of Residence by Service Code, Ages 22-3144
FY 13/14
Own Home/Parent
Guardian Own Home
Independent Supported
Living
Community Care
Facility Licensed
by Department
of Social Services
Intermediate Care Facility
Skilled Nursing Facility
Licensed by Department
of Public Health
Foster Care,
Family Home, Foster Home
All Other
SEP Individual* 2.7% 6.6% 3.5% 0.4% 0.1% 1.7% 1.5%
SEP Group* 4.1% 8.3% 4.6% 2.0% 0.4% 4.7% 3.9%
Work Activity Programs 6.3% 7.2% 2.6% 4.5% 1.5% 7.4% 4.1%
Day Programs 32.9% 14.2% 19.0% 36.0% 43.4% 24.9% 21.2%
Look Alike Day Programs 9.2% 9.0% 16.9% 8.0% 7.3% 12.7% 10.9%
Not in Day or Work Programs 44.8% 54.7% 53.4% 49.1% 47.3% 48.6% 58.4%
*Supported Employment Programs (SEP)
Footnote: 44Data from DDS Purchase of Service System Habilitation Services transition, with Client Development Evaluation Report (CDER) variances, FY 10/11-13/14. Data is self-reported by consumers for CDER, and does not include other data sources. End of footnote.

50
Percentage of Residence by Service Code (Cont.)45
Footnote: 45Data from DDS Purchase of Service System Habilitation Services transition, with Client Development Evaluation Report (CDER) variances, FY 10/11-13/14. Data is self-reported by consumers for CDER, and does not include other data sources. End of footnote.

51
Percentage of Residence by Service Code (Cont.)46
Footnote: 46Data from DDS Purchase of Service System Habilitation Services transition, with Client Development Evaluation Report (CDER) variances, FY 10/11-13/14. Data is self-reported by consumers for CDER, and does not include other data sources. End of footnote.

52
Part 9
Fiscal year 2013/2014 and 2010/2011, purchase of service programs,
by gender, from the Client Development Evaluation Report.
Age and gender groupings for service programs.
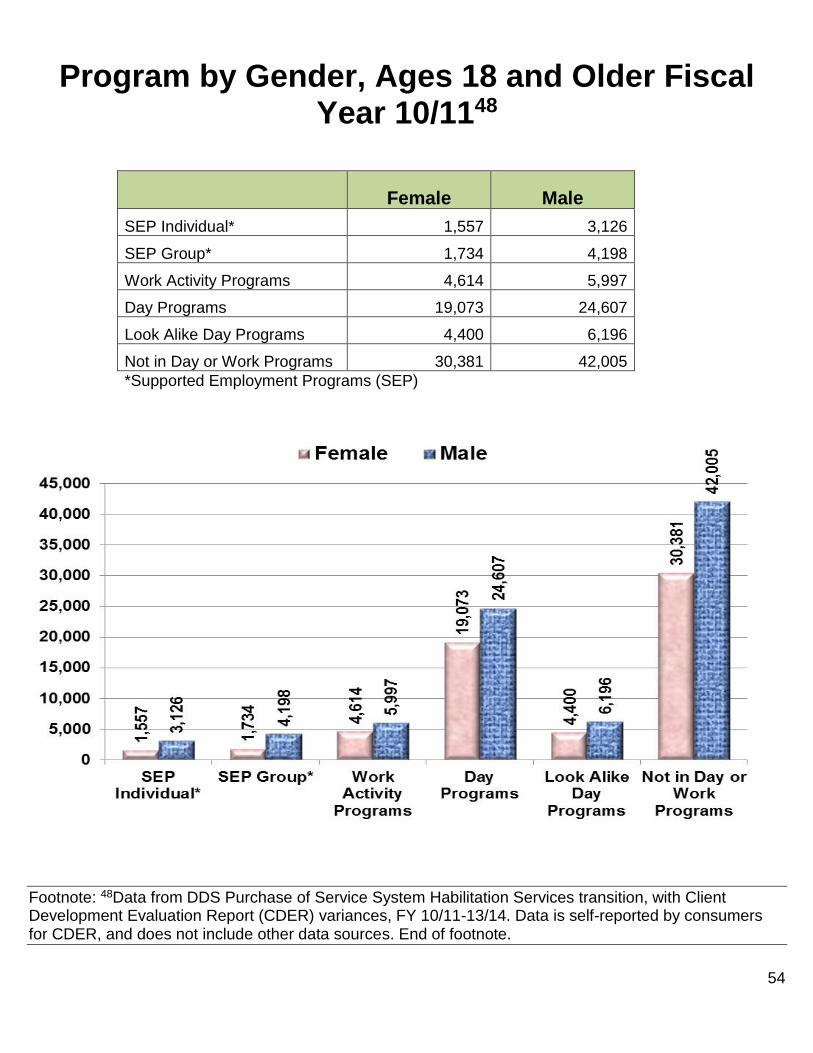
What does this data tell us: This data shows us the number of male and female consumers by program and age groups.
This data also shows a decrease from FY 10/11 to FY 13/14, in employment services and an increase in day program services participation.

53
Programs by Gender, Ages 18 and Older, Fiscal Year 13/1447
Female Male
SEP Individual* 1,316 3,021
SEP Group* 1,655 4,074
Work Activity Programs 4,147 5,882
Day Programs 21,349 28,264
Look Alike Day Programs 5,266 7,854
Not in Day or Work Programs 31,539 44,128
*Supported Employment Programs (SEP)
Footnote: 47Data from DDS Purchase of Service System Habilitation Services transition, with Client Development Evaluation Report (CDER) variances, FY 10/11-13/14. Data is self-reported by consumers for CDER, and does not include other data sources. End of footnote.
54
Program by Gender, Ages 18 and Older Fiscal Year 10/1148
Female Male
SEP Individual* 1,557 3,126
SEP Group* 1,734 4,198
Work Activity Programs 4,614 5,997
Day Programs 19,073 24,607
Look Alike Day Programs 4,400 6,196
Not in Day or Work Programs 30,381 42,005
*Supported Employment Programs (SEP)
Footnote: 48Data from DDS Purchase of Service System Habilitation Services transition, with Client Development Evaluation Report (CDER) variances, FY 10/11-13/14. Data is self-reported by consumers for CDER, and does not include other data sources. End of footnote.

55
Program by Gender, Ages 18 and Older, Net Changes, FY 10/11 to FY 13/1449
Female Male
SEP Individual* -79 -124
SEP Group* -467 -115
Work Activity Programs 2,276 3,657
Day Programs 866 1,658
Look Alike Day Programs 1,158 2,123
Not in Day or Work Programs 3,513 7,094
*Supported Employment Programs (SEP)
Footnote: 49Data from DDS Purchase of Service System Habilitation Services transition, with Client Development Evaluation Report (CDER) variances, FY 10/11-13/14. Data is self-reported by consumers for CDER, and does not include other data sources. End of footnote.

56
Program by Gender and Age Groups, Fiscal Year 13/1450
Female 18-21
Male 18-21
Female 22-31 Years Old
Male 22-31 Years Old
Female 32 and Older
Male 32 and Older
SEP Individual* 19 77 382 1,030 915 1,914
SEP Group* 50 175 606 1,603 999 2,296
Work Activity Programs 118 279 1,218 1,993 2,811 3,610
Day Programs 429 817 6,983 10,390 13,937 17,057
Look Alike Day Programs 326 765 1,957 3,182 2,983 3,907
Not in Day or Work Programs 858 1,814 10,067 15,818 20,614 26,496
*Supported Employment Programs (SEP)
Footnote: 50Data from DDS Purchase of Service System Habilitation Services transition, with Client Development Evaluation Report (CDER) variances, FY 10/11-13/14. Data is self-reported by consumers for CDER, and does not include other data sources. End of footnote.

57
Program by Gender and Age Groups (Cont.) Fiscal Year 13/1451
Footnote: 51Data from DDS Purchase of Service System Habilitation Services transition, with Client Development Evaluation Report (CDER) variances, FY 10/11-13/14. Data is self-reported by consumers for CDER, and does not include other data sources. End of footnote.

58
Program by Gender and Age Groups (Cont.) Fiscal Year 13/1452
Footnote: 52Data from DDS Purchase of Service System Habilitation Services transition, with Client Development Evaluation Report (CDER) variances, FY 10/11-13/14. Data is self-reported by consumers for CDER, and does not include other data sources. End of footnote.