Department of Defense Revolving Funds · The PFPA is the DoD focal point for coordination with DoD...
45
Department of Defense Revolving Funds Justification/Overview Fiscal Year 2020 President’s Budget March 2019
Transcript of Department of Defense Revolving Funds · The PFPA is the DoD focal point for coordination with DoD...

Department of Defense Revolving FundsJustification/Overview
Fiscal Year 2020 President’s Budget
March 2019

This page intentionally left blank.
2

Table of Contents
Preparation of the Defense Revolving Funds Justification book cost the Department of Defense a total of approximately$23,000 in Fiscal Year (FY) 2019.
Page
5
21
31
Copies
1
2
4
3
2
1
Pentagon Reservation Maintenance Revolving Fund (PRMRF)
Buildings Maintenance Fund (BMF)
Defense Logistics Agency (DLA), Strategic Materials
Defense Counterintelligence and Security Agency
DISTRIBUTION LIST
Senate Armed Services Committee
House Armed Services Committee
Senate Appropriations Committee
House Appropriations Committee
Congressional Budget Office
Library of Congress
This document is available to the public on the Internet at http://comptroller.defense.gov/
3
36

This page intentionally left blank.
4

Summary of Operations WASHINGTON HEADQUARTERS SERVICES
Pentagon Reservation Maintenance Revolving Fund Fiscal Year 2020 Budget Estimate
February 2019
The FY 1991 National Defense Authorization Act established the Pentagon Reservation Maintenance Revolving Fund (PRMRF) and Title 10, United States Code (USC) Section 2674 codified it. The fund finances the maintenance, sustainment, protection, repair and renovation of the Pentagon Reservation. As established, the “Pentagon Reservation” refers to the 240 acres of land located in Arlington, Virginia, on which stand the Pentagon Building, the Pentagon Heating and Refrigeration Plant and the Sewage Treatment Plant. It also refers to other related facilities including parking areas, the Raven Rock Mountain Complex (RRMC), and the Mark Center (MC) Campus (effective in FY 2018). The PRMRF customers pay a basic user charge for space and standard building services. Customers who request above standard services pay an additional charge for those services.
Activity Group Composition
The PRMRF finances the activities of the Washington Headquarters Services (WHS) and the Pentagon Force Protection Agency (PFPA) within the Pentagon Reservation. The PRMRF provides space, building services, deep underground relocation capability, and force protection for Department of Defense (DoD) Components, including Military Departments and other activities located within the Pentagon Reservation.
Real Property Operations (RPO): Through the RPO WHS provides for safe and efficient operation, maintenance and repair of the Pentagon Reservation, the RRMC and the MC. The RPO services include cleaning, preventive maintenance, operation and repair of building mechanical and electrical systems, trash removal, landscaping, and administrative support. Additional services include purchased utilities and operation of the Pentagon’s heating and refrigeration plant and classified waste incinerator. The RPO maintains the facilities at levels adequate to support the assigned mission and to prevent deterioration and damage to Reservation buildings, support systems, and operating equipment. The RPO also provides financial management and acquisition services for the Pentagon Reservation and the Pentagon Force Protection Agency.
The RRMC satisfies the DoD Continuity of Operations Plan (COOP) for the Office of the Secretary of Defense, the Joint Staff and Senior DoD Leadership. COOP support includes cleaning, operation and repair of mechanical and utility systems, roads and grounds maintenance, fire and emergency services, food services, information management support services, and administrative support. The RRMC provides facility maintenance and upkeep of facilities within the complex at levels adequate to support assigned mission and to prevent deterioration and damage to facilities, systems, and operating equipment. The RRMC also supports operational readiness by providing a safe and secure environment for DoD essential functions.
5
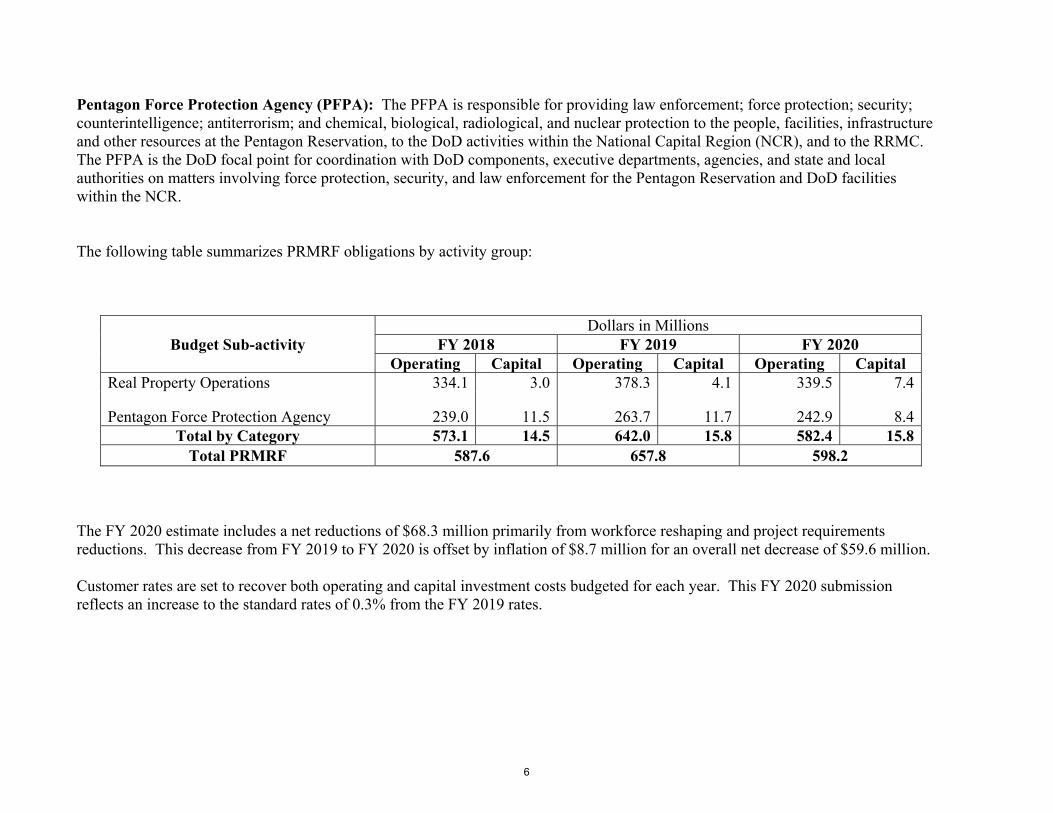
Pentagon Force Protection Agency (PFPA): The PFPA is responsible for providing law enforcement; force protection; security; counterintelligence; antiterrorism; and chemical, biological, radiological, and nuclear protection to the people, facilities, infrastructure and other resources at the Pentagon Reservation, to the DoD activities within the National Capital Region (NCR), and to the RRMC. The PFPA is the DoD focal point for coordination with DoD components, executive departments, agencies, and state and local authorities on matters involving force protection, security, and law enforcement for the Pentagon Reservation and DoD facilities within the NCR.
The following table summarizes PRMRF obligations by activity group:
Budget Sub-activity Dollars in Millions
FY 2018 FY 2019 FY 2020 Operating Capital Operating Capital Operating Capital
Real Property Operations 334.1 3.0 378.3 4.1 339.5 7.4
Pentagon Force Protection Agency 239.0 11.5 263.7 11.7 242.9 8.4 Total by Category 573.1 14.5 642.0 15.8 582.4 15.8
Total PRMRF 587.6 657.8 598.2
The FY 2020 estimate includes a net reductions of $68.3 million primarily from workforce reshaping and project requirements reductions. This decrease from FY 2019 to FY 2020 is offset by inflation of $8.7 million for an overall net decrease of $59.6 million.
Customer rates are set to recover both operating and capital investment costs budgeted for each year. This FY 2020 submission reflects an increase to the standard rates of 0.3% from the FY 2019 rates.
6

Financial Profile: (Dollars in Millions)
FY 2018 FY 2019 FY 2020 Revenue 602.7 600.7 599.7 Operating Expenses 515.1 642.0 582.4 Capital Investments 14.5 15.8 15.8 Net Operating Result (NOR) 73.1 (57.1) 1.5
Disbursements 545.5 736.1 620.8 Collections 542.7 601.3 599.8 Net Outlays 2.8 134.8 21.0
Beginning Cash Balance 404.5 401.7 266.9 Ending Cash Balance 401.7 266.9 245.8 Change in Cash Balance 2.8 134.8 21.0
Note: Totals may not add due to rounding
Operating Budget
The operating budget includes annual inflationary increases for supplies, equipment, service contracts and personnel. It also provides for a safe and secure environment, including effective, proactive force protection and anti-terrorism programs, for Pentagon personnel, assets and facilities.
Capital Budget
The capital budget includes security improvements at the Pentagon, and network upgrades and Facility Sustainment, Restoration, and Modernization (FSRM) projects at the RRMC. The capital budget also includes security infrastructure modernization and access control upgrades to meet Homeland Security Presidential Directive 12 (HSPD-12) requirements.
7

Recent Initiatives
The WHS and the PFPA continually pursue opportunities to improve business practices and reduce costs to customers. Some examples of recent initiatives are:
Continued review by the Services Requirements Review Board (SRRB) to identify cost reductions that are passed on tothe tenants
Reevaluating contract support requirements, and the use of insourcing when cost effective
Reduced personnel costs by workforce reshaping
Identification and reduction of services that are no longer cost effective
Staffing Full Time Equivalents (FTE) FY 2018 FY 2019 FY 2020
Real Property Operations 596 629 631 Pentagon Force Protection Agency 1,002 1,167 1,055 Total 1,598 1,796 1,686
The RPO’s staffing increases by 2 FTEs.
The PFPA staffing decreases by 112 FTEs from workforce reshaping, and repricing.
8

Changes in the Costs of OperationsWashington Headquarters Services
Pentagon Reservation Maintenance Revolving FundFiscal Year (FY) 2020 Budget Estimates
February 2019($ in Millions)
FY 2018 Estimate in President's Budget (actuals) 587.6
FY 2019 Estimate in President's Budget (as adjusted) 657.8
Pricing Adjustments: 8.7Annualization of Pay Raises 0.0
Price Growth Pay 0.0
General Purchase Inflation 8.7
Program Changes: (68.3)
Compensation and Benefits: Decrease of 110 FTEs 1.2
Decrease in management and professional support requirements (5.6)
Decrease in Equip Purchase Rqmts (24.6)
Decrease in maintenance/repair efforts (36.4)
Decrease in utilities requirements (1.4)
Decrease in other purchases/contracts from overall decrease in requirements (1.6)
Increased travel costs 0.2
FY 2020 Estimate 598.2
Note: Totals may not add due to rounding.
Exhibit Fund-2 Changes in the Cost of Operations9

Sources of New Orders and RevenueWashington Headquarters Services
Pentagon Reservation Maintenance Revolving FundFiscal Year (FY) 2020 Budget Estimates
February 2019($ in Millions)
FY 2018 FY 2019 FY 2020New Orders
Department of the Air Force 87.6 87.8 88.3Department of the Army 101.7 95.4 96.3United States Marine Corps 31.1 29.9 29.8Department of the Navy 62.1 61.9 62.3
Subtotal Military Departments 282.5 275.1 276.7
Defense-Wide Defense Intelligence Agency 17.1 17.6 17.7Defense Information Systems Agency 19.8 29.1 30.4Defense Logistics Agency 0.3 0.3 0.3Joint Chiefs of Staff 78.3 77.2 75.2National Geospatial-Intelligence Agency 1.2 1.2 1.2National Security Agency 0.3 0.3 0.3National Guard Bureau 2.7 2.6 2.6Washington Headquarters Services and Office of the Secretary of Defense 150.4 144.7 147.7Defense Finance and Accounting Service 0.5 0.6 0.5Defense Human Resources Activity 8.8 9.1 8.4Dept of Defense Education Activity 3.8 4.0 3.7
a. Orders from DoD Components
Exhibit Fund 11 Source of New Orders and Revenue10

Sources of New Orders and RevenueWashington Headquarters Services
Pentagon Reservation Maintenance Revolving FundFiscal Year (FY) 2020 Budget Estimates
February 2019($ in Millions)
Defense-Wide (Cont.) FY 2018 FY 2019 FY 2020
Dept of Defense Inspector General 11.0 11.4 10.4Defense Technology Security Administration 1.9 2.0 1.9Office of Military Commissions 0.4 0.5 0.4Test Resource Mgmt Center 0.9 0.9 0.8
Subtotal Defense-Wide 297.5 301.4 301.6
b. Orders from Non-DoD ActivitiesDoD Concessions Committee 1.0 1.0 1.0
581.0 577.5 579.2
d. Above Standard Level Service OrdersBuilding Services and Space Adjustments 12.2 14.7 11.4Force Protection 7.7 6.6 7.1Raven Rock Mountain Complex 1.9 1.9 1.9
Subtotal Above Standard Services 21.7 23.2 20.5
Total New Orders: 602.7 600.7 599.7
17.5 18.5
602.7 618.2 618.2
c. Total Standard Level Rent Orders
Carry-In Orders:
Total Gross Orders:
Exhibit Fund 11 Source of New Orders and Revenue11

Revenue and ExpenseWashington Headquarters Services
Pentagon Reservation Maintenance Revolving FundFiscal Year (FY) 2020 Budget Estimates
February 2019($ in Millions)
FY 2018 FY 2019 FY 2020Revenue Standard level 581.0 577.6 579.2 Above standard level 21.7 23.1 20.5
Total Revenue 602.7 600.7 599.7
Standard Level Operating Expenses:
Real Property Operations 331.7 332.1 333.6Compensation and Benefits 78.4 74.4 76.1Cleaning 19.3 19.4 26.2Utilities and Fuel 22.4 28.8 21.8Maintenance 34.3 54.9 54.4Other Building Services 63.4 57.1 56.6Administration 13.4 15.9 15.5Repairs (over $10,000) 39.6 20.8 17.9Information Technology 15.5 15.8 16.1Library 2.3 2.3 2.3Acquisition Services 0.4 0.2 0.2Misc. Support (Human Resources, Financial Management) 1.4 1.4 2.2Other Services (RRMC) 13.1 2.5 5.2RRMC Improvements 28.2 38.7 39.2
Exhibit Fund-14 Revenue and Expense12

Revenue and ExpenseWashington Headquarters Services
Pentagon Reservation Maintenance Revolving FundFiscal Year (FY) 2020 Budget Estimates
February 2019($ in Millions)
FY 2018 FY 2019 FY 2020
Pentagon Force Protection Agency 244.0 244.6 244.1Compensation and Benefits 144.1 139.6 138.9Mission Integration 14.3 17.8 15.5Science and Technology 10.0 11.2 11.8Threat Management 12.4 4.9 5.9Emergency Management 0.0 0.6 0.0Security Services 34.5 48.5 51.1Law Enforcement 12.6 10.3 11.8Human Capital and Training 4.4 0.0 0.7Project Integration 11.7 11.7 8.4
Subtotal Standard Level Expenses 575.7 576.8 577.7
Exhibit Fund-14 Revenue and Expense13

Revenue and ExpenseWashington Headquarters Services
Pentagon Reservation Maintenance Revolving FundFiscal Year (FY) 2020 Budget Estimates
February 2019($ in Millions)
FY 2018 FY 2019 FY 2020
Above Standard Reimbursable Expenses:
Real Property Operations 5.4 50.3 13.3Projects and Services 1.4 42.4 4.9Compensation and Benefits 2.1 6.0 6.4RRMC Projects and Services 1.9 1.9 1.9
Pentagon Force Protection Agency 6.4 30.7 7.1Supplies and Equipment Maintenance 3.6 15.4 1.7Advisory and Assistance Services 0.0 11.4 1.4Compensation and Benefits 2.8 3.9 4.1
Subtotal Above Standard Level 11.9 81.0 20.5
Total Operating Expenses 587.6 657.8 598.2
Recovery of Prior Year Balances 57.9
Net Operating Result 73.1 (57.1) 1.5
Accumulated Operating Results Prior Year 151.8 224.8 167.7Deferred Accumulated Operating Results 0.0 0.0 (169.2)
Accumulated Operating Results End of Year 224.8 167.7 0.0
Notes: Totals may not add due to rounding.Total expenses include Capital Investment Program expenses
Exhibit Fund-14 Revenue and Expense14

Cost of ServicesWashington Headquarters Services
Pentagon Reservation Maintenance Revolving FundFiscal Year (FY) 2020 Budget Estimates
February 2019
Square Footage
Cost per SF
Square Footage
Cost per SF
Square Footage
Cost per SF
Pentagon 4,570,296 4,570,342 4,570,340Real Property Operations 49.53$ 48.64$ 48.56$ Pentagon Force Protection 45.74$ 45.39$ 45.85$
Total Cost/SF 95.27$ 94.03$ 94.41$
Mark Center 1,281,580 1,281,580 1,281,580Real Property Operations 25.40$ 28.60$ 28.80$ Pentagon Force Protection 15.68$ 14.22$ 11.63$
Total Cost/SF 41.08$ 42.82$ 40.43$
FY 2020FY 2019FY 2018
Cost Center
Square footage is the total amount of billable space in the building.
Exhibit PR-1 PRMRF Cost of Services 15
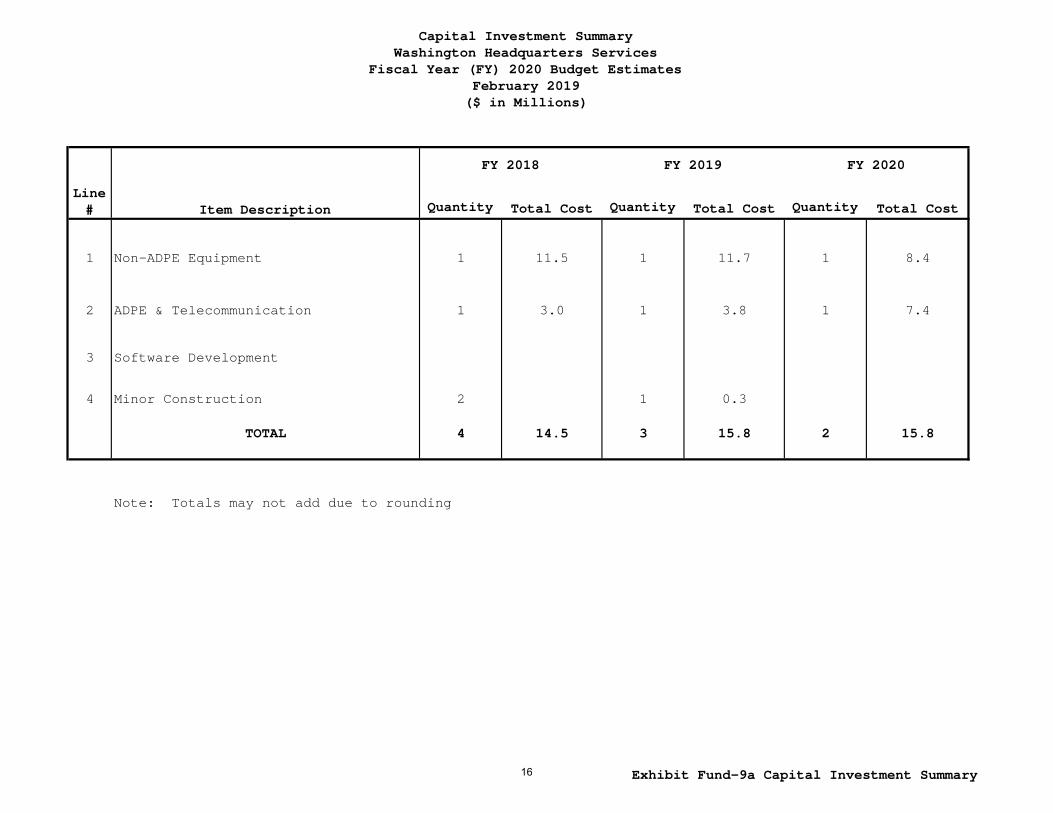
Capital Investment SummaryWashington Headquarters Services
Fiscal Year (FY) 2020 Budget Estimates February 2019
($ in Millions)
Quantity Total Cost Quantity Total Cost Quantity Total Cost
1 Non-ADPE Equipment 1 11.5 1 11.7 1 8.4
2 ADPE & Telecommunication 1 3.0 1 3.8 1 7.4
3 Software Development
4 Minor Construction 2 1 0.3
TOTAL 4 14.5 3 15.8 2 15.8
Note: Totals may not add due to rounding
Line # Item Description
FY 2018 FY 2019 FY 2020
Exhibit Fund-9a Capital Investment Summary16

Activity Group Capital Purchase JustificationWashington Headquarters Services
Pentagon Reservation Maintenance Revolving FundFiscal Year (FY) 2020 Budget Estimates
February 2019($ in Thousands)
Element of Cost ($000)
Non-ADPE and Telecom Equip. 1 11,486 11,486 1 11,657 11,657 1 8,382 8,382TOTAL 1 11,486 11,486 1 11,657 11,657 1 8,382 8,382
FY 2018: $11.5 million in PFPA initiatives for Sentry
FY 2020FY 2019Total Cost
- Sentry Access Control Proc ($1.6 million)
- Sentry Access Control Procurement ($6.0 million)- Sentry Equipment ($1.5 million)
QuantityUnit CostQuantity
- Sentry Vehicle Entry Control Point - Procurement($0.5 million)- Sentry Personnel Entry Control Point - Procurement($0.6 million)
- Sentry Pers Ent Ctrl Pt ($0.3 million)FY 2020: $8.4 million in PFPA initiatives for Sentry and Video Surveillance Program
- PFPA MILCON Equipment ($3.7 million)- Electronic Access Control ($3.8 million)- Physical Security Force Protection ($0.6 million)
- Video Surveillance Program ($2.5 million)FY 2019: $11.7 million in PFPA initiatives for Video surveillance, Access Control, Physical Security, & MILCON SPT Equipment.
PENTAGON RESERVATION MAINTENANCE REVOLVING FUND CAPITAL INVESTMENT JUSTIFICATION A. Fiscal Year (FY) 2020 Budget Estimates
B. Pentagon Force Protection Agency C. Equipment/OtherFY 2018
Total CostQuantity
Unit Cost
Total Cost
Unit Cost
- Sentry Perimeter Fence ($0.4 million)
Note: Pentagon Sentry is a multi-year effort to upgrade Pentagon Reservation physical and electronic security systems to comply with applicable laws, regulations and directives.
- Video Surveillance Program ($3.0 million)
- Video Surveillance Program ($3.6 million)
- Sentry Access Control Spt ($3.6 million)
Exhibit Fund 9b Capital Purchase Justification17

Activity Group Capital Purchase JustificationWashington Headquarters Services
Pentagon Reservation Maintenance Revolving FundFiscal Year (FY) 2020 Budget Estimates
February 2019($ in Thousands)
ADPE and Telecomm (RRMC) 1 2,991 2,991 1 3,843 3,843 1 7,398 7,398TOTAL 1 2,991 2,991 1 3,843 3,843 1 7,398 7,398
FY 2018 FY 2019 FY 2020Total Cost
B. Real Property Operations
- JSCR/network/optical lifecycle ($3.0 million)
Unit Cost
Total Cost Quantity
Unit Cost
Unit Cost
- Lifecycle ADPE hardware and softwareFY 2019: $3.8 million
FY 2020: $7.4 million- Lifecycle ADPE hardware and software
PENTAGON RESERVATION MAINTENANCE REVOLVING FUND CAPITAL INVESTMENT JUSTIFICATION A. Fiscal Year (FY) 2020 Budget Estimates
C. ADPE & Telecommunications
Element of Cost ($000) Quantity QuantityTotal Cost
FY 2018: $3.0 million
Exhibit Fund 9b Capital Purchase Justification18

Activity Group Capital Purchase JustificationWashington Headquarters Services
Pentagon Reservation Maintenance Revolving FundFiscal Year (FY) 2020 Budget Estimates
February 2019($ in Thousands)
Minor Construction (RRMC) 0 1 300 300 0Minor Construction (Pentagon) 0 0TOTAL 0 0 0 1 300 300 0 0 0
Quantity
FY 2019Unit Cost
Total Cost Quantity
Unit Cost
Total Cost
FY 2020
QuantityUnit Cost
Total Cost
FY 2019: $0.3 million Infrastructure Repair- Infrastructure Repair at the RRMC ($0.3 million)
Element of Cost ($000)
B. Real Property Operations C. Construction
PENTAGON RESERVATION MAINTENANCE REVOLVING FUND CAPITAL INVESTMENT JUSTIFICATION A. Fiscal Year (FY) 2020 Budget Estimates
FY 2018
Exhibit Fund 9b Capital Purchase Justification19

Capital Investment SummaryWashington Headquarters Services
Pentagon Reservation Maintenance Revolving FundFiscal Year (FY) 2020 Budget Estimates
February 2019($ in Millions)
Major CategoryInitial Request
Current Projected
CostApproved Change Explanation
2018 Non-ADPE 12.7 11.5 (1.2)ADPE and Telecom 4.0 3.0 (1.0)Minor ConstructionTotal 2018 16.7 14.5 (2.2)
2019 Non-ADPE 11.7ADPE and Telecom 3.8Minor Construction 0.3
Total 2019 15.8 0.0 0.02020 Non-ADPE 8.4
ADPE and Telecom 7.4Minor Construction
Total 2020 15.8 0.0 0.0
Note: Totals may not add due to rounding
Projects came in below original estimates
Exhibit Fund 9c Capital Budget Execution20

Summary of Operations WASHINGTON HEADQUARTERS SERVICES
Buildings Maintenance Fund Fiscal Year 2020 Budget Estimate
February 2019
In Fiscal Year (FY) 1995, the Secretary established the Buildings Maintenance Fund (BMF) per Title 10, United States Code (U.S.C.) Section 2208. The BMF provides space, building services and force protection for one federally owned facility (U.S. Court of Appeals), as well as 13 delegated leased and 63 non-delegated leased facilities, which Washington Headquarters Services (WHS) operates under delegated authority per the General Services Administration (GSA). Customers pay a basic user charge for space and basic building services. Customers who request above standard services pay an additional amount for those services.
The BMF also includes the GSA/Department of Homeland Security (DHS) Rent Program which enables WHS to collect and pay the GSA rent and DHS security bills for all DoD tenants in leased facilities throughout the National Capital Region (NCR). The program improves billing, earnings and collection processes, enabling the Department to make timely payments to GSA and DHS.
Activity Group Composition
The BMF finances the activities of the Washington Headquarters Services (WHS) and Pentagon Force Protection Agency (PFPA) within the NCR. The BMF provides space, building services and force protection for DoD components, including Military Departments and other activities located within the NCR.
Real Property Operations (RPO): RPO is responsible for the safe and efficient operation and management of all DoD delegated buildings within the NCR. RPO includes services such as cleaning, preventive maintenance, operation and repair of building mechanical and electrical systems, trash removal, landscaping, administrative support and metering utilities in leased facilities. The scheduled maintenance and day-to-day customer support provide operational continuity for the customer’s mission. The GSA/DHS Rent Program simplifies lease and security payments for BMF customers by combining these GSA and DHS costs into one rent bill. The program has significantly improved oversight and visibility of the transactions and costs associated with the BMF.
Pentagon Force Protection Agency (PFPA): The Deputy Secretary of Defense established the PFPA as a Defense Agency under Title 10 USC 191. The PFPA provides force protection, security, anti-terrorism, law enforcement, and chemical, biological, radiological, and nuclear protection as required for the people, facilities, infrastructure and other DoD resources within the NCR.
21

The following table summarizes BMF obligations by activity group:
(Dollars in Millions) FY 2018 FY 2019 FY 2020
Real Property Operations 240.2 271.6 260.3 Pentagon Force Protection Agency 27.0 44.8 35.2 Total Obligations 267.2 316.4 295.5
The FY 2020 estimate includes a net reduction of $27 million primarily from a reduction in Federal Protective Services (FPS) costs and from prior year carry forward projects to be obligated in FY 2019. The decrease from FY 2019 to FY 2020 is offset by inflation of $6.0 million for an overall net increase of $21.0 million.
Financial Profile (Dollars in Millions)
FY 2018 FY 2019 FY 2020
Revenue 265.9 290.5 296.8 Expenses 255.7 316.4 295.5 Net Operating Results 10.2 (25.9) 1.3
Disbursements 227.8 422.3 294.8 Collections 236.9 370.2 295.1 Net Outlays (9.1) 52.1 (0.3)
Beginning Cash Balance 68.6 77.7 25.7 Ending Cash Balance 77.7 25.7 25.9 Change in Cash Balance 9.1 (52.0) 0.2
Note: Totals may not add due to rounding
22

Operating Budget
The operating budget includes annual inflationary increases for supplies, equipment, service contracts and personnel. It also provides for a safe and secure environment, including effective, proactive force protection and anti-terrorism programs, for Pentagon personnel, assets and facilities.
The BMF financed two types of facilities: government-owned (U.S. Court of Appeals) and leased facilities (designated and non- designated). The following table depicts revenue by facility type:
(Dollars in Millions) Facility Type FY 2018 FY 2019 FY 2020 Government Owned 2.0 2.3 2.6 Leased Facilities 254.4 268.9 273.3 Above Standard Work 9.5 19.3 21.9 Total Revenue 265.9 290.5 296.8
Note: Totals may not add due to rounding.
Staffing Full Time Equivalents (FTE) FY 2018 FY 2019 FY 2020
Real Property Operations 42 34 42 Pentagon Force Protection Agency 72 90 82 Total 114 124 124
The workforce requirements remain steady in the BMF.
23

Changes in the Costs of OperationsWashington Headquarters Services
Building Maintenance FundFiscal Year (FY) 2020 Budget Estimates
February 2019($ in Millions)
FY 2018 Estimate in President's Budget (actuals) 267.2
FY 2019 Estimate in President's Budget (as adjusted) 316.4
Pricing Adjustments: 6.0Annualization of pay raises 0.0Price Growth Payroll 0.0General Purchase Inflation 6.0
Program Changes (major items): (27.0)
Increase in labor costs from repricing based on execution 2.6
Decreases due to changed/decreased efforts for Advisory and Assistance Services (11.3)
Increase in supplies/materials requirements 0.2
Decrease in maintenance/repair efforts (16.9)
Decrease in utilities requirements (lease reduction) (0.0)
Decrease due to reduction in FPS costs for leased facilities (1.5)
FY 2020 Estimate 295.5
Note: Totals may not add due to rounding.
Exhibit Fund 2 - Changes in the Costs of Operations24

Sources of New Orders and RevenueWashington Headquarters Services
Buildings Maintenance FundFiscal Year (FY) 2020 Budget Estimates
February 2019($ in Millions)
1. New Orders FY 2018 FY 2019 FY 2020
Department of the Air Force 3.3 3.8 3.5Department of the Army 55.5 51.5 47.4Department of the Navy 19.4 20.3 18.6
Subtotal Military Departments 78.2 75.5 69.5
Defense-Wide US Court of Appeals of the Armed Forces 2.0 2.3 2.6COWARDIN 0.3 0.4 0.3Defense Acquisition University 0.0 0.0 0.0Defense Advanced Research Project Agency 20.1 19.5 19.3Defense Contract Audit Agency 1.5 1.6 2.0Defense Contract Management Agency 2.2 2.2 3.9Defense Human Resources Activity 0.6 0.0 0.0Defense Intelligence Agency 28.0 28.0 29.6Defense Information Systems Agency 1.7 9.6 10.6Defense Logistics Agency 4.3 5.1 5.1Defense Legal Services Activity 2.5 1.9 1.9Defense Media Activity 1.6 1.4 1.0Defense Missing Persons Organization 1.2 1.2 1.3DoD Classified Program 1.3 1.0 1.1
a. Orders from DoD Components
Exhibit Fund 11 Sources of New Orders and Revenue25

Sources of New Orders and RevenueWashington Headquarters Services
Buildings Maintenance FundFiscal Year (FY) 2020 Budget Estimates
February 2019($ in Millions)
Defense-Wide (Cont.) FY 2018 FY 2019 FY 2020Dept of Defense Inspector General 0.0 0.0 0.2Dept of Hearings and Appeals 3.1 3.2 2.7Defense Security Cooperation Agency 4.2 4.9 4.5Defense Security Service 2.9 3.0 6.9Defense Threat Reduction Agency 2.9 9.2 8.5Joint Staff 0.2 0.2 0.2Joint Strike Fighter 9.8 10.2 10.1Missile Defense Agency 3.7 3.6 0.8National Commission on Public Service 0.0 0.0 0.5Office of Economic Adjustment 0.8 0.7 0.7Office of Military Commissions 5.1 5.7 4.3Pentagon Force Protection Agency 4.3 4.2 4.2Defense Health Agency 51.0 52.6 53.3Strategic Capabilities Office 0.0 1.0 0.9Southern Command 0.0 0.0 0.2Transportation Command 0.1 0.1 0.1White House Management Office 2.5 2.7 3.2Washington Headquarters Services and Office of the Secretary of Defense 19.1 19.0 25.0Boards, Commissions & Task Forces 1.0 1.1 1.1
Subtotal Defense-Wide 178.1 195.6 206.3
Exhibit Fund 11 Sources of New Orders and Revenue26

Sources of New Orders and RevenueWashington Headquarters Services
Buildings Maintenance FundFiscal Year (FY) 2020 Budget Estimates
February 2019($ in Millions)
FY 2018 FY 2019 FY 2020
256.4 271.2 275.9
Building Services and Space Adjustments 6.1 13.9 17.0Force Protection 3.4 5.4 3.9
Subtotal Above Standard Services 9.5 19.3 21.0
Total New Orders 265.9 290.5 296.8
Carry-In Orders 0.0 8.9 9.1
Total Gross Orders 265.9 299.4 305.9
b. Total Standard Level Rent Orders
c. Above Standard Level Service Orders
Exhibit Fund 11 Sources of New Orders and Revenue27

Cost of ServicesWashington Headquarters Services
Buildings Maintenance FundFiscal Year (FY) 2020
February 2019($ in Millions)
FY 2018 FY 2019 FY 2020Revenue Standard level 256.4 271.2 275.9 Above standard level 9.5 19.3 21.0 Total Revenue 265.9 290.5 296.8
Standard Level Operating Expenses:
Real Property Operations 229.4 240.8 244.6Cleaning/Trash/General 0.0 0.0 0.0Utilities and Fuel 0.5 0.2 0.1Maintenance 14.6 1.3 0.0Other Building Services 2.7 1.4 1.8Administration 8.8 6.1 9.0Repairs (over $10,000) 0.0 0.2 0.0Travel and Transportation of Personnel 2.5 0.0 0.0Information Technology 0.0 0.0 0.0Defense Post Office 0.0 0.0 0.0GSA/DHS Rent Program 200.3 231.6 233.8
Pentagon Force Protection Agency 23.5 30.4 31.2Compensation and Benefits 7.1 7.7 8.4Deputy Director 0.1 0.0 0.0Human Capital and Workforce Development 0.0 0.0 0.0Law Enforcement 0.7 15.8 17.0Mission Integration 0.4 0.3 0.2Security Services 4.2 6.4 5.5Threat Management 11.1 0.2 0.0
Subtotal Standard Level Expenses 253.0 271.2 275.9
Exhibit Fund‐14 Revenue and Expense28

Cost of ServicesWashington Headquarters Services
Buildings Maintenance FundFiscal Year (FY) 2020
February 2019($ in Millions)
FY 2018 FY 2019 FY 2020Above Standard Reimbursable Expenses:
Real Property Operations 10.8 30.8 15.7Pentagon Force Protection Agency 3.4 14.5 3.9
Subtotal Above Standard Level Expenses 14.2 45.2 19.6
Total Operating Expenses 267.2 316.4 295.5
Recovery of Prior Year Balances 11.4
Net Operating Result 10.1 (25.9) 1.3
Accumulating Operating Results Prior Year 14.4 24.5 (1.3)Deferred Accumulated Operating Results 0.0 0.0 (0.0)
Accumulated Operating Results End of Year 24.5 (1.3) 0.0
Note: Totals may not add due to rounding.
Exhibit Fund‐14 Revenue and Expense29

Cost of ServicesWashington Headquarters Services
Buildings Maintenance FundFiscal Year (FY) 2020 Budget Estimates
February 2019
Square Footage
Cost per SF
Square Footage
Cost per SF
Square Footage
Cost per SF
US Court of Appeals of the Armed Forces 26,008 26,008 26,008Real Property Operations 73.23$ 78.86$ 88.69$ Pentagon Force Protection 2.03$ 9.39$ 12.94$ Security Services* 96.51$ 80.90$ 101.51$
Total Cost/SF 171.77$ 169.14$ 203.14$
FY 2020
* Security Services are provided by Pentagon Force Protection Agency on areimbursable (above standard) basis
FY 2019FY 2018
Cost Center
Square footage is the total amount of billable space in the building.
Exhibit PR-1 PRMRF Cost of Services 30

Summary of Operations
DEFENSE LOGISTICS AGENCY, Strategic Materials
National Defense Stockpile Transaction Fund
Fiscal Year 2020 Budget Estimate
February 2019
The Defense Logistics Agency Strategic Materials (DLA-SM) operates under the authority of the Strategic and Critical Materials
Stockpiling Act (50 U.S.C. §98, et seq.). The Stockpiling Act provides for the acquisition and retention of certain strategic and critical
materials in the National Defense Stockpile (NDS) to serve the interest of national defense. The Act also encourages the conservation
and development of sources of such materials within the United States to mitigate dangerous and costly dependence upon foreign or
single sources of supply in times of national emergency. DLA Strategic Materials identifies risks and develops mitigation strategies for
the supply chain of defense and essential civilian industrial materials. DLA Strategic Materials’ activities include acquisition, storage,
disposal and management of the NDS.
DLA Strategic Materials will continue to mitigate risks by using strategies such as research and development, responsible management of
NDS material inventory, qualification of substitute materials, recycling and acquisition of strategic and critical materials.
Funding Request:
Historically, operations and new acquisitions of strategic and critical materials necessary to mitigate emerging and updated shortfall risks
have been funded from past and ongoing sales of NDS materials deemed excess to requirements. In addition, Congress has mandated
that NDS sell material to fund activities unrelated to the NDS mission. Sales proceeds are covered into the NDS Transaction Fund, the
revolving fund established to transact NDS business. The fund’s cash corpus and inventory of salable assets have been declining for
decades.
While DLA-SM is currently positioned to fund operations and the acquisition of strategic and critical materials, the Transaction Fund
will eventually require an appropriation or alternate financing source for future mission requirements. Current projections show NDS
program budgetary resources may not meet annual operating budget requirements by FY 2024.
Principal Sales Program:
The Principal Sales Program offers quantities of select strategic and critical materials for sale that have been deemed excess to current
NDS requirement levels. DLA-SM develops and executes a non-market disrupting sales plan.
31

Collections (Dollars in Millions)
FY 2018 FY 2019 FY 2020
Principal Sales Program 65.6 64.2 64.0
Budget Highlights
Program Costs (Dollars in Millions)
FY 2018 FY 2019 FY 2020
Labor 8.5 8.8 9.7
Non-Labor 23.8 29.2 39.2
Acquisitions (Critical Materials) 11.2 23.3 51.0
Environmental 9.2 5.3 7.3
Total Costs 52.7 89.9 107.2
Critical Material Risk Mitigation
In FY 2018, DLA Strategic Materials procured $11.2M in strategic and critical materials. In FY 2019, $23.3M and FY 2020, $51.0M are
budgeted for additional strategic and critical material acquisitions. This budget provides funding for costs to recycle critical materials
from surplus Federal assets in order to satisfy NDS critical material requirements and to create domestic sources of supply and eliminate
the need to stockpile certain materials.
Labor
The DLA Strategic Materials will continue to identify and close emerging skill gaps, enabling the agency to carry out its mission.
Budget projections through FY 2020 ensure optimal staffing levels to achieve program objectives
Non-Labor
Mobilization Studies Program: The Mobilization Studies program is comprised of a broad range of research and analysis techniques
32

that enable DLA-SM to gain a clear and comprehensive understanding of the requirements and vulnerabilities of U.S. defense and
essential civilian industries. These research, analyses, and development projects support reconstitution and expansion of stockpiling
capabilities, through (1) laboratory-based scientific research and analyses, (2) expanded processes to model material supply chains
downstream from mines to finished platforms, and development of effective risk mitigation strategies and solutions, and (3) development
of additional data and analyses collection and evaluation sources from industry and academia.
Material Handling Program: The Material Handling Program supports: (1) continuation of the beryllium upgrade project, (2) long
term mercury storage operations, (3) reclamation of surplus materials from the Department of Energy and other Federal Agencies that are
suitable for transfer to or required for the NDS, (4) storage of new semi-process NDS materials at vendor locations to expedite finish
processing in the event these materials are required in a contingency, and (5) ingot production at Rock Island Arsenal from NDS tin
reserves.
Depot Operations: Depot Operations are costs associated with operating and maintaining the day-to-day depot mission, which include
security, operations, maintenance, janitorial services, fuel, and equipment.
Rents and Leases: Real property rental and leasing required to support stockpiling operations include warehouses, administrative
buildings, service buildings and open land for outdoor storage; obtained through occupancy agreements with the General Services
Administration (GSA), other Federal Agencies or commercial leases.
Environmental
Normal compliance requirements to sustain an environmental management system, sustain all required compliance programs and
trainings, perform compliance audits, track and report liabilities and pay fees are approximately $700-800 K per year and are expected to
remain relatively constant through FY 2024. Environmental remediation projects at Somerville, NJ are expected to be active between
FY 2019 and FY 2024. At Somerville, NJ, the Remedial Investigation and associated Feasibility Study was completed in FY 2018. A
contract for soil and sediment remediation has been awarded, and the feasibility study is being used to inform the environmental remedial
design and remediation action work plan that are currently under development for the site. A second contract will be issued for
groundwater remediation at the Somerville location in FY 2019. Soil, sediment, and groundwater remediation work will all initiate at the
site in FY 2019. The Somerville location will be a multi-million dollar project, expected to run through FY 2024. At Large, PA, there
could potentially be issues, activity and remediation between FY 2019 and FY 2024.
33

FY 2018 FY 2019 FY 2020 FY 2021 FY 2022 FY 2023 FY 2024
ASSETS:
Selected Assets:
Cash (EOY)* 294.1 250.8 207.6 149.1 104.2 42.6 (22.7)
Accounts Receivable - - - - - - -
Inventories* 785.8 745.0 732.0 738.3 731.8 741.3 754.1
Other Asset Accounts: 1.5 1.3 1.0 0.8 0.6 0.4 0.1
TOTAL ASSETS 1,081.5 997.0 940.7 888.2 836.6 784.2 731.6
LIABILITIES
Selected Liabilities
Accounts Payable 2.2 2.5 2.5 2.5 2.5 2.5 2.5
Advances Received - - - - - - -
Environmental Clean-up Liability 17.6 6.0 6.0 6.0 6.0 6.0 6.0
Other Liabilities 2.9 2.0 2.0 2.0 2.0 2.0 2.0
TOTAL LIABILITIES 22.7 10.5 10.5 10.5 10.5 10.5 10.5
GOVERNMENT EQUITY
Cumulative Results of Operations 1,058.8 986.5 930.2 877.7 826.1 773.7 721.1
TOTAL NET POSITION 1,058.8 986.5 930.2 877.7 826.1 773.7 721.1
TOTAL LIABILITIES AND EQUITY 1,081.5 997.0 940.7 888.2 836.6 784.2 731.6
* This projection does not include PBR20 Issue# 1221701 request for $70 million annual appropriation to the Transaction Fund beginning in FY20.
($M)
Defense Logistics Agency
National Defense Stockpile Transaction Fund
DLA Strategic Materials
Statement of Financial Condition
Fiscal Year (FY) 2020 Budget Estimates
February 2019
Exhibit Fund-23 Statement of Financial Condition34

FY 18 FY 19 FY 20 FY 21 FY 22 FY 23 FY 24
Treasury Cash Balance, End of Prior Year* 273.1 294.1 291.6 248.4 189.9 145.0 83.5
Collections 65.6 64.2 64.0 42.7 42.2 26.2 22.8
Disbursements 44.7 66.6 107.2 101.2 87.1 87.8 88.2
Labor 8.5 8.8 9.7 9.9 10.1 10.3 9.6
Non-Labor 24.1 34.5 46.5 42.4 41.3 41.8 42.9
Other Program Costs 12.1 23.3 51.0 48.9 35.7 35.7 35.7
Payments to Treasury
Payments from Current Year Sales 0.0 0.0 0.0 0.0 0.0 0.0 0.0
Carryover Payments from Previous Year 0.0 0.0 0.0 0.0 0.0 0.0 0.0
Anticipated Transfers Out 0.0 0.0 0.0 0.0 0.0 0.0 0.0
Total Payments and Transfers 0.0 0.0 0.0 0.0 0.0 0.0 0.0
Cash Balance 294.1 291.6 248.4 189.9 145.0 83.5 18.1
Selected Liabilities
Accounts Payable 2.2 2.0 2.0 2.0 2.0 2.0 2.0
Advances Received 0.0 0.0 0.0 0.0 0.0 0.0 0.0
Environmental Clean-up Liability 17.6 12.7 6.7 6.0 6.0 6.0 6.0
Other Liabilities 2.9 2.0 2.0 1.0 1.0 1.0 1.0
Undelivered Orders 41.2 35.0 35.0 30.0 30.0 30.0 30.0
Other Contingencies (Sequester) 25.6 24.8 25.2 20.9 15.7 11.3 5.2
Totals 89.5 76.5 70.9 59.9 54.7 62.8 44.2
Estimated Available Cash 204.5 215.2 177.6 130.0 90.4 20.6 -26.1
* This projection does not include PBR20 Issue# 1221701 request for $70 million annual appropriation to the Transaction Fund beginning in FY20.
February 2019
(Dollars in Millions)
Defense Logistics Agency
National Defense Stockpile Transaction Fund
DLA Strategic Materials
Stockpile Financial Status Report
Fiscal Year (FY) 2020 Budget Estimates
Exhibit SP-1 Stockpile Financial Status Report35

Summary of Operations
DEFENSE COUNTERINTELLIGENCE AND SECURITY AGENCY
Fiscal Year 2020 Budget Estimate
February 2019
Overview
The Defense Counterintelligence and Security Agency (DCSA), future personnel vetting program
formerly known as National Background Investigation Bureau (NBIB), provides personnel background
investigative services on a fee-for-service basis to assist its over 100 Federal agency customers
in determining personnel:
(1) Suitability and fitness for Federal civilian, military, and contract employment;
(2) Eligibility for logical and physical access to agency systems and facilities; and
(3) Eligibility for access to classified information.
Effective FY 2020, the background investigation mission will transfer from the Office of Personnel
Management (OPM) to the Department of Defense (DoD), Defense Security Service (DSS). At the time
of the transfer, the DSS will be renamed as the Defense Counterintelligence Security Agency
(DCSA), which will serve as the primary federal entity for conducting background investigations
for the federal government.
The FY 2018 National Defense Authorization Act (NDAA) (Public Law 115-91), Section 925 stated the
Secretary of Defense has the authority to conduct all types of background investigations for DoD
personnel and mandated that, not later than October 1, 2020, the Secretary of Defense shall
commence carrying out its background investigations implementation plan developed pursuant to §
951(a)(1) of the FY 2017 NDAA. In June 2018, the Administration released its Reform Plan and
Reorganization Recommendations, which identified its intent to transfer the entire NBIB background
investigation mission from OPM to DoD. OPM, DoD, and NBIB, among other stakeholders, are working
collaboratively to ensure continued efficient and effective delivery of high-quality background
investigation products and services to the federal government during the transition from OPM to
DoD, and the standup of DCSA.
The background investigation mission is poised to continue to evolve and improve in FY 2020 and
beyond. The development of the Trusted Workforce 2.0 Framework led jointly by the Security
Executive Agent and Suitability and Credentialing Executive Agent effort will transform how the
federal government executes background investigations. Trusted Workforce 2.0 will identify and
establish a new set of policy standards that will transform the U.S. government’s approach to
vetting its workforce, overhaul the enterprise business processes, and modernize information
technology. The expected short-term objective is to reduce the current background investigation
36

inventory, and in the long-term to fundamentally transform the approach for personnel vetting,
including evaluation, development, and promulgation of revised investigative standards.
Strategy
The legacy NBIB has made great strides to decrease its investigation case inventory and improve
the timely delivery of quality background investigations products and services to its agency
customers. One of its main goals is to achieve a healthy, and sustainable steady-state inventory
level. Continued investments in innovative new policies and procedures, artificial intelligence
automation, and data and analytics will further enable DCSA’s future personnel vetting program to
reduce man-hours required to complete cases, permitting DCSA to strategically and efficiently use
field investigators while providing improved scrutiny to each investigation. In addition to its
emphasis on innovation and process improvement, DCSA will focus on maintaining current federal and
contractor investigator capacity and further developing quality review capacity. Maintaining a
healthy investigator capacity and improved timely delivery of high-quality cases to federal agency
customers remains pivotal to decreasing the current case inventory. Other federal-wide initiatives
slated to help reduce the overall requirement for investigative requests coming to DCSA,
especially re-investigations, are policy changes, and Continuous Evaluation/Continuous Vetting
(CE/CV), which promise better results in less time than traditional labor-intensive methods.
DCSA will implement these new processes (e.g., CE/CV) pursuant to guidance prescribed by new
Federal Investigative Standards, and Executive Order 13467, as amended. CE/CV is a vetting process
to review the background of an individual who has been determined to be eligible for access to
classified information or to hold a sensitive position at any time during the period of
eligibility and affiliation with the Department determines whether that individual continues to
meet applicable requirements.
Innovation and the use of cutting-edge commercial technology are major drivers in creating
efficiencies in the background investigation mission. As required by Executive Order 13741, the
DoD is responsible for designing, developing, and securing new background investigation
Information Technology (IT) system, the National Background Investigation System (NBIS). In FY
2019, NBIB will continue to work collaboratively with DoD to develop, test, and deploy NBIS while
sustaining legacy IT systems within OPM for the current NBIB operations. This will help to
provide a smooth and seamless IT transition to NBIS. During the development and deployment of
NBIS, legacy IT systems vital to DCSA’s operations will continue to be secured, maintained, and
updated by OPM. In FY 2020, NBIS is planned to become operational in phases. Phase 1 includes Tier
1 investigations for a select number of federal customers. The remainder of investigations will
continue to be processed using OPM’s legacy system until NBIS is ready to assume additional
workload.
37

DCSA’s future personnel vetting program will continue to implement enhanced analytical tools that
support background investigations to better anticipate, detect, and counter malicious activities,
as well as threats posed by trusted insiders who may seek to do harm to government personnel,
property, and information systems. In addition, DCSA will continue to identify ways to transform
the investigative process by improving access to record information, ingesting and utilizing
information more efficiently, and developing a continuous process improvement roadmap. In managing
the workload, DCSA will leverage current technologies to automate the personnel background
investigation process, increase productivity in the field by realigning administrative tasks, and
continue making changes as directed by national policy to reduce case inventory. These efforts
are anticipated to increase data sharing, standardization, enhance and enable streamlined and
automated end-to-end processes to manage cost, increase capability, and improve quality,
timeliness, and data integrity.
DCSA will continue to enhance its Law Enforcement Liaison Office to increase centralization and
outreach efforts, as well as educate the law enforcement community on the needs of the national
background investigation program. Also, DCSA is centralizing capabilities for statewide law checks
and other checks required by the Federal Investigative Standards that are capable of being done
remotely from a central location. Centralization of law checks will reduce the average cost per
check. DCSA will continue to identify law enforcement agencies that are unable to meet background
investigation record requests as required under 5 U.S.C. § 9101. In concert with those agencies,
DCSA will continue to build out its strategy to include identifying resources such as staffing,
funding, and automation to permit those agencies to become compliant.
Budget Assumptions
This FY 2020 budget submission assumes that effective 1 October 2019, the background investigation
mission will transfer from OPM to the DCSA. Because of this, NBIB is not included in the OPM FY
2020 Congressional Budget Justification (CBJ). During the transition phase, DCSA may utilize
OPM’s existing processes and systems on a reimbursable basis and likewise OPM may utilize some of
DCSA’s resources, also on a reimbursable basis, in order to complete the existing backlog
inventory. As part of the transfer and transition from OPM to DoD, DCSA plans to increase its
direct embedded staffing levels by up to 250 employees to replace support functions previously
provided as part of the OPM’s common services.
Another assumption is that as the capability and capacity of CE/CV expand, the workload for
background investigations is projected to decrease accordingly, which is reflected in the
decreased budget estimate from FY 2019 to FY 2020. Leveraging CE/CV is expected to reduce the
number of reinvestigations in DCSA’s inventory, allowing investigators’ valuable time to be
38

redirected to more complex investigations, or for initial entry applicants into government
workforce. While the FY 2020 budget submission assumes decreases in the overall budgetary
requirements and workload due to CE/CV, DCSA will closely monitor the actual impacts. Conversely,
agencies using CE/CV for non-issue cases in lieu of traditional reinvestigations may result in a
higher percentage of more complex investigations in DCSA’s inventory, requiring contract
modifications with vendors.
DCSA offers its federal customers a variety of investigative products and services to meet their
investigative needs, as published in the FY 2020 Federal Investigations Notice (FIN) number 18-04
in August 2018 published by OPM/NBIB. The prices published in the FY 2020 Pricing and
Product/Services Catalog will not increase from the FY 2019 prices. The significant cost drivers
that impact pricing considerations include federal and contracted investigative fieldwork, third-
party record search fees, the accuracy of workload projections, policy changes (for example, new
Federal investigative standards), and infrastructure upgrades.
The FY 2020 rates are detailed in the table below which remained constant from FY 2019 to FY 2020.
Standard Priority
National Agency Check (NAC) $159 Not Available
Tier 1 (T1) $198 Not Available
Tier 2 (T2) $559 Not Available
Tier 2 Reinvestigation (T2R) $265 Not Available
Tier 3 (T3) $440 Not Available
Tier 3 Reinvestigation (T3R) $424 Not Available
Tier 4 (T4) $4,233 $4,571
Tier 4 Reinvestigation (T4R) $2,723 $2,940
Tier 5 (T5) $5,706 $6,163
Tier 5 Reinvestigation (T5R) $3,134 $3,385
Case Type Case Service
39

Budget Summary
DCSA’s personnel vetting program is a fee-for-service organization that provides personnel
background investigations that are financed using a business-like working capital fund
(revolving fund) model. The goal of the fund is to break even each year. Funding
received from customer orders should equal the operating costs incurred to deliver those
orders. The table below represents DCSA’s future personnel vetting program key budget data
summary:
($M) FY 2018 FY 2019* FY 2020
Revenue -$ 1,361.7$ 1,251.6$
Cost -$ 1,361.7$ 1,251.6$
Net Operating Result (NOR) -$ -$ -$
Prior Year Accumulated Operating Results (AOR) -$ -$ -$
Ending AOR -$ -$ -$
Capital Budget -$ -$ -$
Civilian Work Years (FTEs) 3,216 3,513
Key Budget Data
*Please note: FY 2019 planned estimates in this budget exhibit are included for reference only. The funding
and FTE associated w ith FY 2019 is and w ill be part of OPM's revolving fund budget, and is included in
OPM's FY 2019 Congressional Budget Justif ication (CBJ)
40

Cost
FY 19 Current Estimate* 1361.7
Pricing Adjustments
Annualization of Prior Year Pay Raises 0.0
FY 20 Pay Raise 0.0
General Purpose Inflation 19.5
Program Changes:
Civilian Personnel 37.5
Travel of Persons (1.7)
Material & Supplies 0.7
Commercial Equipment Purchases (0.6)
Other Purchased Services from Revolving Fund 0.0
Transportation of things 0.0
Printing and Reproduction (0.1)
Advisory and Assistance Services 0.9
Rent, Communications, Utilities, and Misc 1.2
Other Purchased Services (147.9)
Capital Investment Recovery 0.0
FY 20 Current Estimate 1251.6
($ in Millions)
*Please note: FY 2019 planned estimates in this budget exhibit are included for reference only. The funding and FTE associated with FY2019 is and will
be part of OPM's revolving fund budget, and is included in OPM's FY 2019 Congressional Budget Justification (CBJ)
DEFENSE COUNTERINTELLIGENCE AND SECURITY AGENCY
Working Capital Fund
Background Investigation Services
Summary of Price, Program, and Other Changes (Operating Budget) - Costs
Fiscal Year (FY) 2020 Budget Estimates
February 2019
Exhibit Fund 2 - Changes in Cost of Operations
41
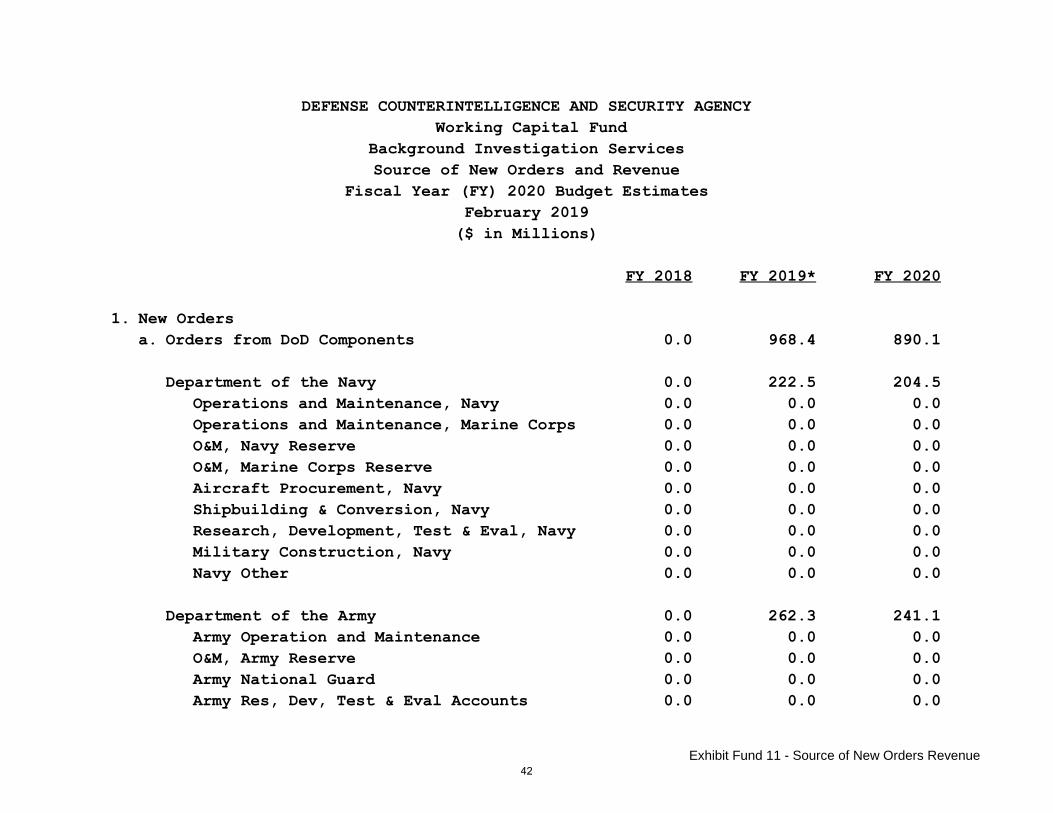
FY 2018 FY 2019* FY 2020
1. New Orders
a. Orders from DoD Components 0.0 968.4 890.1
Department of the Navy 0.0 222.5 204.5
Operations and Maintenance, Navy 0.0 0.0 0.0
Operations and Maintenance, Marine Corps 0.0 0.0 0.0
O&M, Navy Reserve 0.0 0.0 0.0
O&M, Marine Corps Reserve 0.0 0.0 0.0
Aircraft Procurement, Navy 0.0 0.0 0.0
Shipbuilding & Conversion, Navy 0.0 0.0 0.0
Research, Development, Test & Eval, Navy 0.0 0.0 0.0
Military Construction, Navy 0.0 0.0 0.0
Navy Other 0.0 0.0 0.0
Department of the Army 0.0 262.3 241.1
Army Operation and Maintenance 0.0 0.0 0.0
O&M, Army Reserve 0.0 0.0 0.0
Army National Guard 0.0 0.0 0.0
Army Res, Dev, Test & Eval Accounts 0.0 0.0 0.0
($ in Millions)
DEFENSE COUNTERINTELLIGENCE AND SECURITY AGENCY
Working Capital Fund
Background Investigation Services
Source of New Orders and Revenue
Fiscal Year (FY) 2020 Budget Estimates
February 2019
Exhibit Fund 11 - Source of New Orders Revenue42

DEFENSE COUNTERINTELLIGENCE AND SECURITY AGENCY
Working Capital Fund
Background Investigation Services
Source of New Orders and Revenue
Fiscal Year (FY) 2020 Budget Estimates
February 2019
Army Procurement Accounts 0.0 0.0 0.0
Military Construction, Army 0.0 0.0 0.0
Army Other 0.0 0.0 0.0
Department of the Air Force 0.0 183.3 168.5
Air Force Operation & Maintenance 0.0 0.0 0.0
O&M, Air Force Reserve 0.0 0.0 0.0
Air Force National Guard 0.0 0.0 0.0
Air Force Res, Dev, Test & Eval Accounts 0.0 0.0 0.0
Air Force Procurement Accounts 0.0 0.0 0.0
Military Construction, Air Force 0.0 0.0 0.0
Air Force Other 0.0 0.0 0.0
DoD Appropriated Accounts 0.0 300.4 276.1
Operation & Maintenance Accounts 0.0 0.0 0.0
Res, Dev, Test & Eval Accounts 0.0 0.0 0.0
Procurement Accounts 0.0 0.0 0.0
Military Construction, Defense 0.0 0.0 0.0
Defense Health Program 0.0 0.0 0.0
DoD Other 0.0 300.4 276.1
b. Orders from other Fund Activity Groups 0.0 0.0 0.0
Navy 0.0 0.0 0.0
Exhibit Fund 11 - Source of New Orders Revenue43

DEFENSE COUNTERINTELLIGENCE AND SECURITY AGENCY
Working Capital Fund
Background Investigation Services
Source of New Orders and Revenue
Fiscal Year (FY) 2020 Budget Estimates
February 2019
Army 0.0 0.0 0.0
Air Force 0.0 0.0 0.0
Other DoD 0.0 0.0 0.0
c. Total DoD 0.0 968.4 890.1
d. Other Orders 0.0 393.3 361.5
Other Federal Agencies 0.0 393.0 361.2
Non-Federal Agencies and Other 0.0 0.3 0.3
Total New Orders 0.0 1,361.7 1,251.6
2. Carry-In Orders 0.0 0.0 0.0
3. Total Gross Orders 0.0 1,361.7 1,251.6
4. Funded Carry-Over 0.0 0.0 0.0
5. Total Gross Sales 0.0 1,361.7 1,251.6
*Please note: FY 2019 planned estimates in this budget exhibit are included for reference only. The funding and FTE associated
with FY 2019 is and will be part of OPM's revolving fund budget, and is included in OPM's FY 2019 Congressional Budget
Justification (CBJ)
Exhibit Fund 11 - Source of New Orders Revenue44

FY 2018 FY 2019* FY 2020
Revenue
Gross Sales 0.0 1,361.7 1,251.6
Operations 0.0 1,361.7 1,251.6
Capital Surcharge 0.0 0.0 0.0
Capital Investment Recovery 0.0 0.0 0.0
Other Income 0.0 0.0 0.0
Refunds/Discounts (-) 0.0 0.0 0.0
Total Income 0.0 1,361.7 1,251.6
Costs
Cost of Material Sold from Inventory 0.0 0.0 0.0
Salaries and Wages
Civilian Personnel Compensation & Benefits 0.0 385.2 422.7
Travel & Transportation of Personnel 0.0 22.5 20.8
Materials & Supplies (For Internal Operations) 0.0 2.7 3.4
Equipment 0.0 5.5 4.9
Other Purchases from Revolving Funds 0.0 0.0 0.0
Transportation of Things 0.0 0.0 0.0
Capital Investment Recovery 0.0 0.0 0.0
Printing and Reproduction 0.0 0.7 0.6
Advisory and Assistance Services 0.0 65.7 66.5
Rent, Communications, Utilities, & Misc. Charges 0.0 18.5 19.6
Other Purchased Services 0.0 860.9 713.0
Total Expenses 0.0 1,361.7 1,251.6
Operating Result 0.0 0.0 0.0
Adjustments affecting NOR (specify) 0.0 0.0 0.0
Net Operating Result 0.0 0.0 0.0
Prior Year AOR 0.0 0.0 0.0
Accumulated Operating Result 0.0 0.0 0.0
Non-Recoverable Adjustment Impacting AOR 0.0 0.0 0.0
Accumulated Operating Results for Budget Purposes 0.0 0.0 0.0
($ in Millions)
*Please note: FY 2019 planned estimates in this budget exhibit are included for reference only. The funding and FTE associated with FY 2019
is and will be part of OPM's revolving fund budget, and is included in OPM's FY 2019 Congressional Budget Justification (CBJ)
DEFENSE COUNTERINTELLIGENCE AND SECURITY AGENCY
Working Capital Fund
Background Investigation Services
Revenue and Expenses
Fiscal Year (FY) 2020 Budget Estimates
February 2019
Exhibit Fund 14 - Revense and Expenses
45