Department of Defense Family Advocacy Program
37
Transcript of Department of Defense Family Advocacy Program
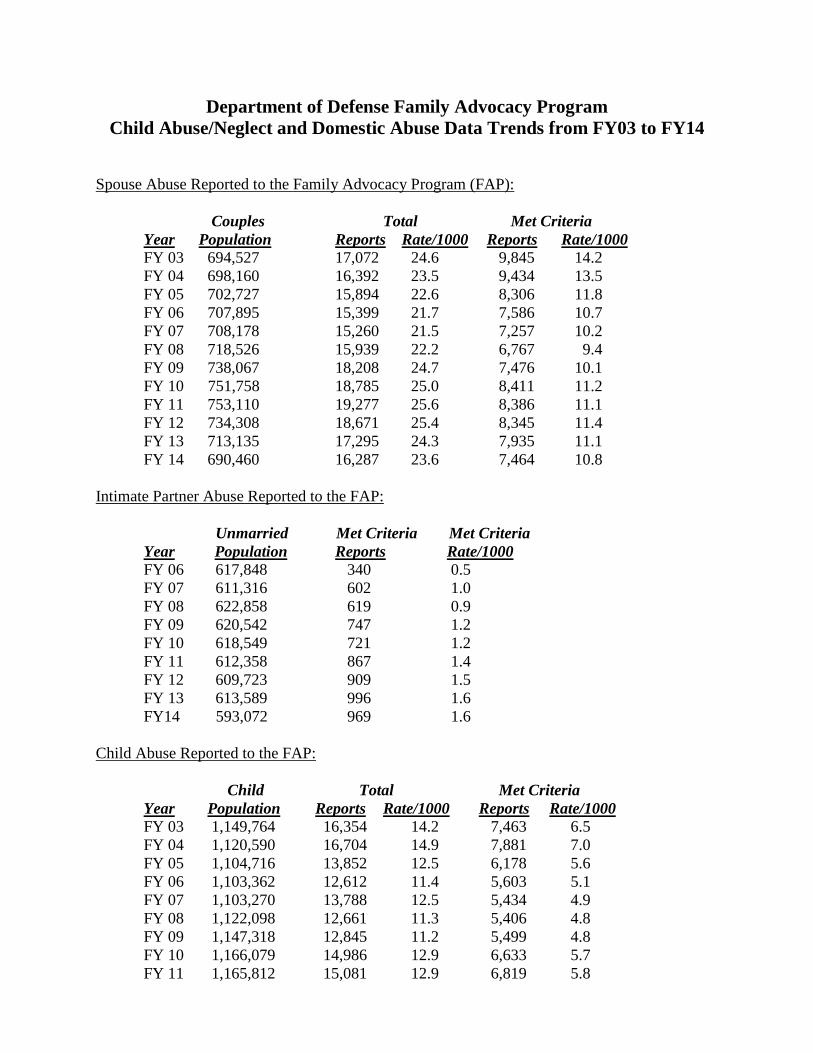
Department of Defense Family Advocacy Program Child Abuse/Neglect and Domestic Abuse Data Trends from FY03 to FY14
Spouse Abuse Reported to the Family Advocacy Program (FAP):
Couples Total Met Criteria Year Population Reports Rate/1000 Reports Rate/1000 FY 03 694,527 17,072 24.6 9,845 14.2 FY 04 698,160 16,392 23.5 9,434 13.5 FY 05 702,727 15,894 22.6 8,306 11.8 FY 06 707,895 15,399 21.7 7,586 10.7 FY 07 708,178 15,260 21.5 7,257 10.2 FY 08 718,526 15,939 22.2 6,767 9.4 FY 09 738,067 18,208 24.7 7,476 10.1 FY 10 751,758 18,785 25.0 8,411 11.2
FY 11 753,110 19,277 25.6 8,386 11.1 FY 12 734,308 18,671 25.4 8,345 11.4 FY 13 713,135 17,295 24.3 7,935 11.1 FY 14 690,460 16,287 23.6 7,464 10.8 Intimate Partner Abuse Reported to the FAP:
Unmarried Met Criteria Met Criteria Year Population Reports Rate/1000 FY 06 617,848 340 0.5 FY 07 611,316 602 1.0 FY 08 622,858 619 0.9 FY 09 620,542 747 1.2 FY 10 618,549 721 1.2
FY 11 612,358 867 1.4 FY 12 609,723 909 1.5 FY 13 613,589 996 1.6 FY14 593,072 969 1.6 Child Abuse Reported to the FAP:
Child Total Met Criteria Year Population Reports Rate/1000 Reports Rate/1000 FY 03 1,149,764 16,354 14.2 7,463 6.5 FY 04 1,120,590 16,704 14.9 7,881 7.0 FY 05 1,104,716 13,852 12.5 6,178 5.6 FY 06 1,103,362 12,612 11.4 5,603 5.1 FY 07 1,103,270 13,788 12.5 5,434 4.9 FY 08 1,122,098 12,661 11.3 5,406 4.8 FY 09 1,147,318 12,845 11.2 5,499 4.8
FY 10 1,166,079 14,986 12.9 6,633 5.7 FY 11 1,165,812 15,081 12.9 6,819 5.8
2
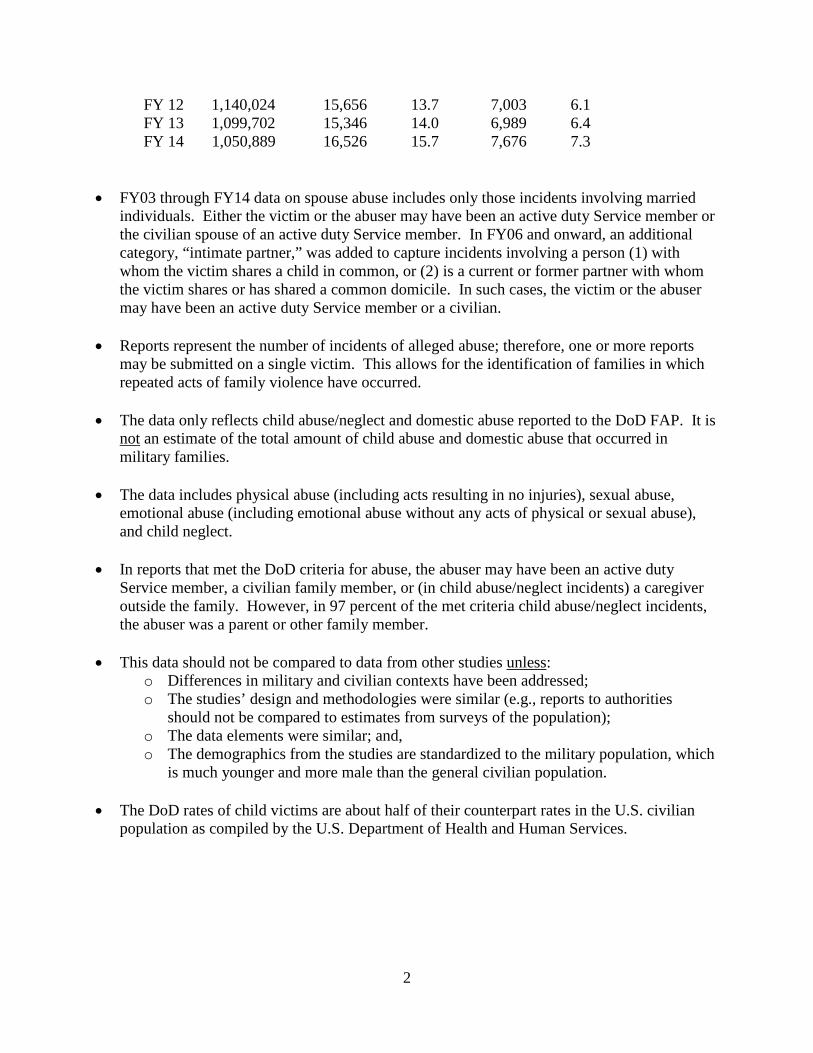
FY 12 1,140,024 15,656 13.7 7,003 6.1 FY 13 1,099,702 15,346 14.0 6,989 6.4 FY 14 1,050,889 16,526 15.7 7,676 7.3
• FY03 through FY14 data on spouse abuse includes only those incidents involving married individuals. Either the victim or the abuser may have been an active duty Service member or the civilian spouse of an active duty Service member. In FY06 and onward, an additional category, “intimate partner,” was added to capture incidents involving a person (1) with whom the victim shares a child in common, or (2) is a current or former partner with whom the victim shares or has shared a common domicile. In such cases, the victim or the abuser may have been an active duty Service member or a civilian.
• Reports represent the number of incidents of alleged abuse; therefore, one or more reports
may be submitted on a single victim. This allows for the identification of families in which repeated acts of family violence have occurred.
• The data only reflects child abuse/neglect and domestic abuse reported to the DoD FAP. It is
not an estimate of the total amount of child abuse and domestic abuse that occurred in military families.
• The data includes physical abuse (including acts resulting in no injuries), sexual abuse,
emotional abuse (including emotional abuse without any acts of physical or sexual abuse), and child neglect.
• In reports that met the DoD criteria for abuse, the abuser may have been an active duty
Service member, a civilian family member, or (in child abuse/neglect incidents) a caregiver outside the family. However, in 97 percent of the met criteria child abuse/neglect incidents, the abuser was a parent or other family member.
• This data should not be compared to data from other studies unless:
o Differences in military and civilian contexts have been addressed; o The studies’ design and methodologies were similar (e.g., reports to authorities
should not be compared to estimates from surveys of the population); o The data elements were similar; and, o The demographics from the studies are standardized to the military population, which
is much younger and more male than the general civilian population. • The DoD rates of child victims are about half of their counterpart rates in the U.S. civilian
population as compiled by the U.S. Department of Health and Human Services.
1
FREQUENTLY ASKED QUESTIONS ABOUT THE FAMILY ADVOCACY PROGRAM
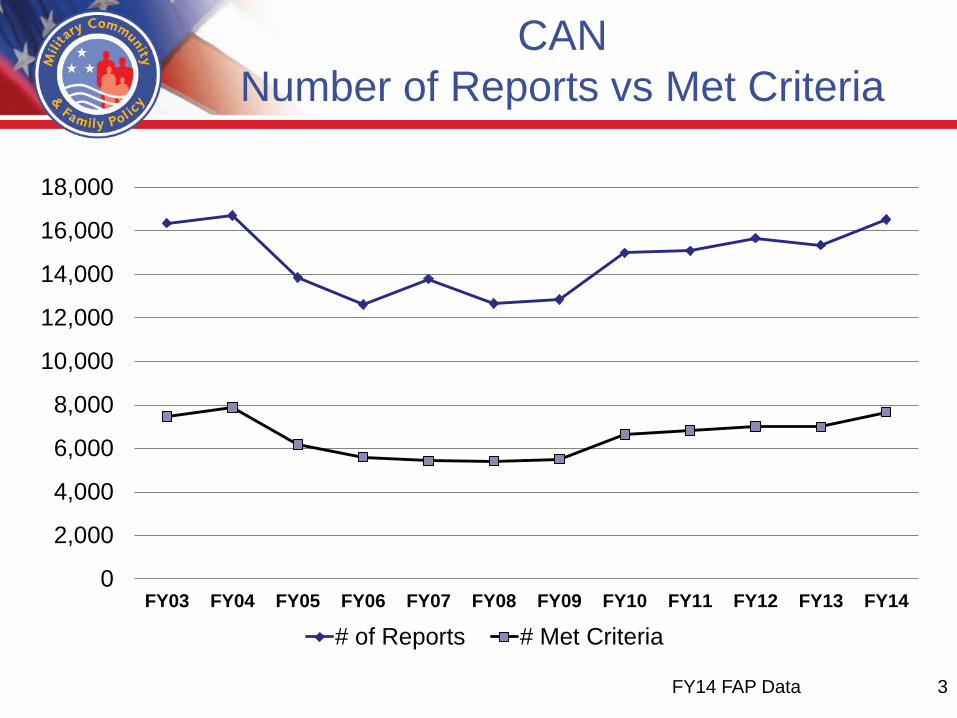
FY14 DOMESTIC ABUSE and CHILD ABUSE and NEGLECT DATA Q: What does the Family Advocacy Program FY14 domestic abuse and child abuse and neglect data tell us about family violence in the military community? A: The Department of Defense keeps track of how many incidents of child abuse and neglect are reported to the Family Advocacy Program. FY14 data shows a decline from FY13 data in both the number of reports of suspected domestic abuse and the number of those reports that met the DoD criteria for domestic abuse. The rate per thousand couples of met criteria incidents of domestic abuse has remained relatively stable for the last five years. The number of reports of suspected child abuse and neglect and the number of those reports that met the DoD criteria for child abuse and neglect have risen steadily over the past five years. Child neglect represents the largest percentage of child abuse. The rate per thousand children of met criteria incidents that involved child neglect was 14% higher in FY14 than in FY13. Q: How does DoD define child neglect? A: Child neglect is defined as the negligent treatment of a child through acts or omissions by an individual responsible for the child’s welfare under circumstances indicating the child’s welfare is harmed or threatened. Neglect includes abandonment, deprivation of necessities, exposure to physical hazards, educational neglect, lack of supervision, medical neglect, and/or non-organic failure to thrive. The two most prevalent forms of child neglect in military families are lack of supervision that is appropriate to the age and functioning of the child and exposure to physical hazards such as bathtubs, electrical outlets and unsafe cribs. Q. The number of met criteria incidents of child abuse and neglect reported to the FAP is steadily increasing from FY09. What does this change mean? A. We continue to monitor this data closely. There are several possible explanations for these increases. First, they may reflect the cumulative effects of the high rates of deployment on the military family’s ability to sustain coping strategies during the last decade of war and the current stressors related to reintegration and concerns about potential involuntary separation.
2
Q: How does the DoD child abuse and neglect data compare to civilian studies? A: DoD rates of child abuse and neglect are approximately half of their counterpart rates in the U.S. civilian population, as compiled by the U.S. Department of Health and Human Services. This may be explained in part by the strong support military families receive and the success of prevention efforts sponsored by the FAP and other military family support programs. Q: How does the DoD plan to address this increase in child abuse and neglect? A: This emerging trend in child abuse and neglect requires our focused attention. We have engaged the Military Service Family Advocacy Programs to leverage every available resource at the local, installation, regional, and Service headquarters level to reach families who may be at risk. My office is launching a first-ever DoD digital strategy to reach, inform, and engage military families where they live and thrive online, with available resources to protect and strengthen families. Secondly, through the Integrated Project Team for Child Abuse and Neglect and Domestic Abuse, all members of the coordinated community response are working to reduce incidents across DoD. PREPARED BY: Mary E. Campise, Office of Family Readiness Policy, 571-372-5346
DEPARTMENT OF DEFENSE
FAMILY ADVOCACY PROGRAM CHILD ABUSE/NEGLECT (CAN) DATA
FY14 Report
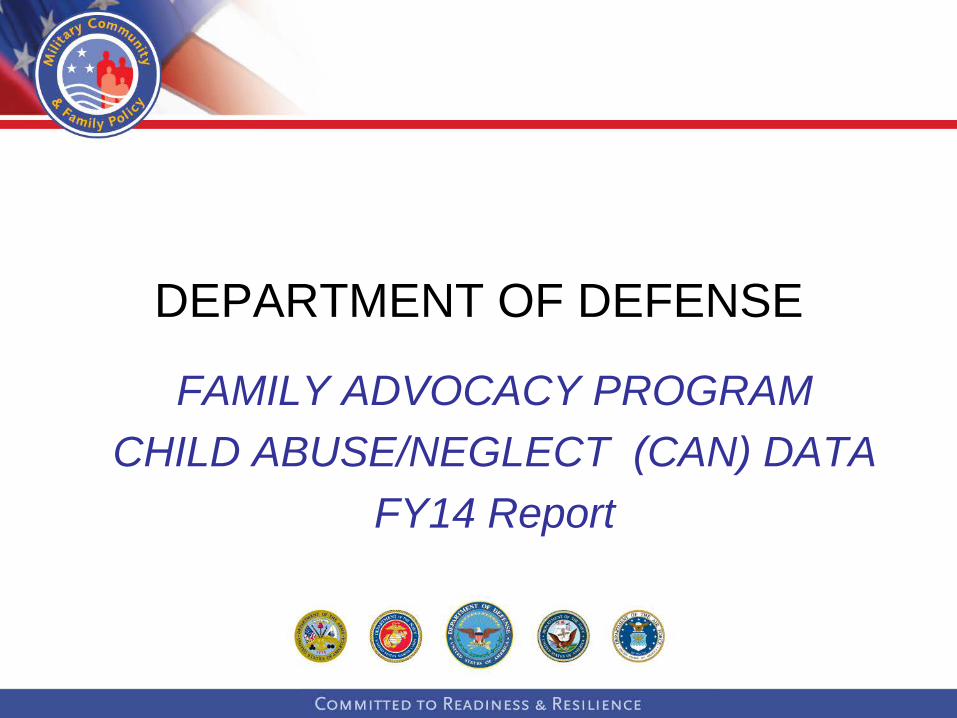
CAN* Incidents FY03-14
Year Child Population
Total Reports** Rate/1000
Met Criteria Reports** Rate/1000
FY03 1,149,764 16,354 14.2 7,463 6.5
FY04 1,120,590 16,704 14.9 7,881 7.0
FY05 1,104,716 13,852 12.5 6,178 5.6
FY06 1,103,362 12,612 11.4 5,603 5.1
FY07 1,103,270 13,788 12.5 5,434 4.9
FY08 1,122,098 12,661 11.3 5,406 4.8
FY09 1,147,318 12,845 11.2 5,499 4.8
FY10 1,166,079 14,986 12.9 6,633 5.7
FY11 1,165,812 15,081 12.9 6,819 5.8
FY12 1,140,024 15,656 13.7 7,003 6.1
FY13 1,099,702 15,346 14.0 6,989 6.4
FY14 1,050,889 16,526 15.7 7,676 7.3
*Abuse includes acts of physical violence, and/or sexual violence, and/or emotional abuse, and/or neglect. For more specific breakdown, refer to slide 8 ** Reports represent # incidents of abuse; one or more reports may be submitted on a single victim.
2
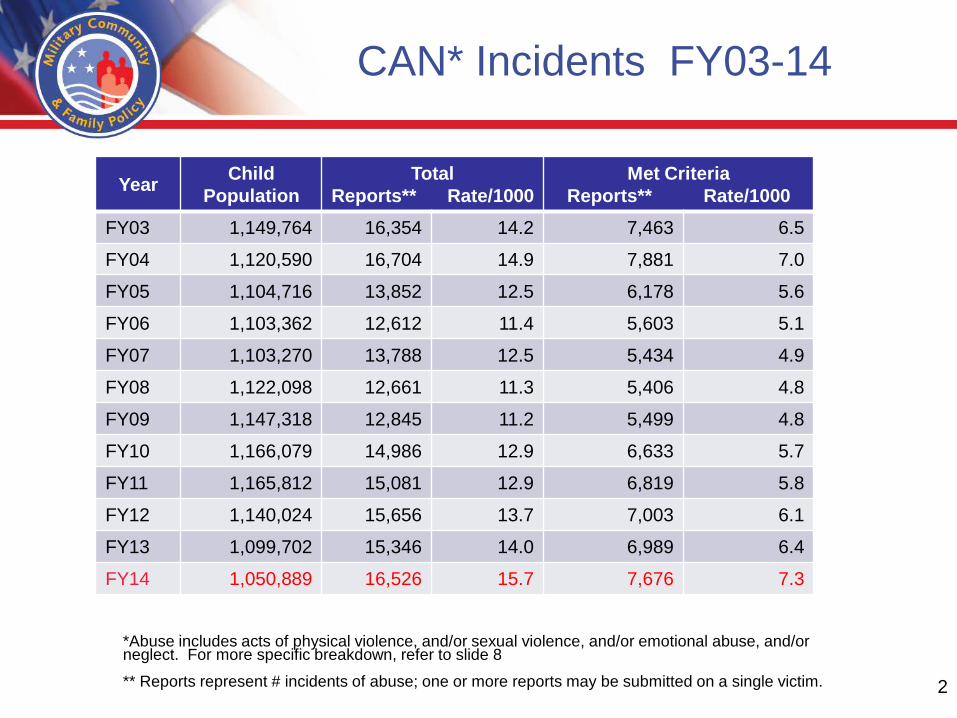
CAN Number of Reports vs Met Criteria
0
2,000
4,000
6,000
8,000
10,000
12,000
14,000
16,000
18,000
FY03 FY04 FY05 FY06 FY07 FY08 FY09 FY10 FY11 FY12 FY13 FY14
# of Reports # Met Criteria
FY14 FAP Data 3
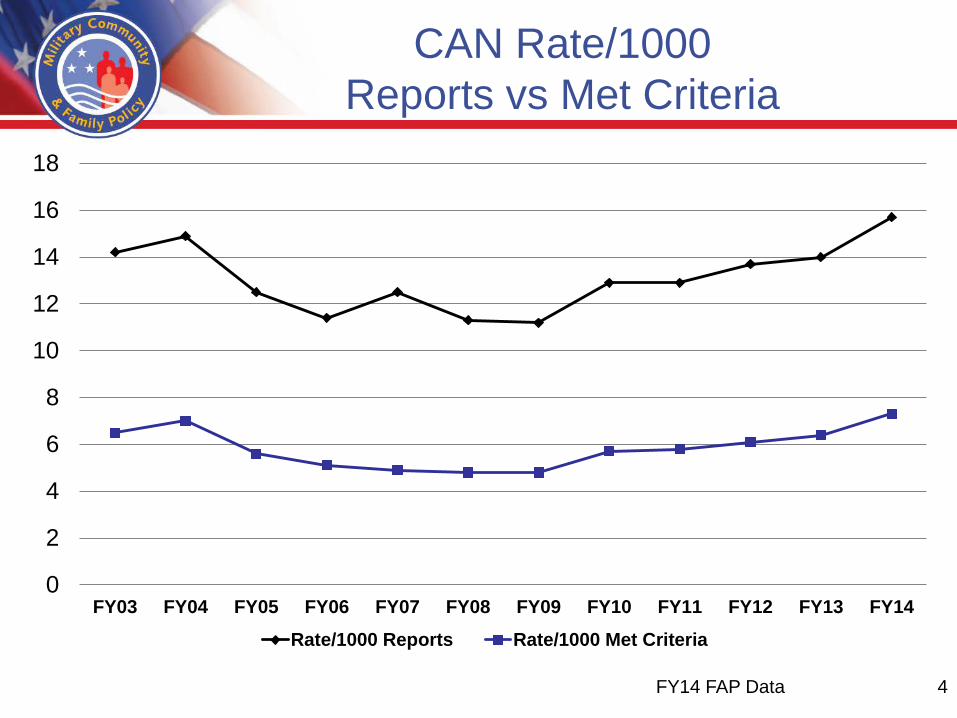
CAN Rate/1000 Reports vs Met Criteria
0
2
4
6
8
10
12
14
16
18
FY03 FY04 FY05 FY06 FY07 FY08 FY09 FY10 FY11 FY12 FY13 FY14
Rate/1000 Reports Rate/1000 Met Criteria
FY14 FAP Data 4
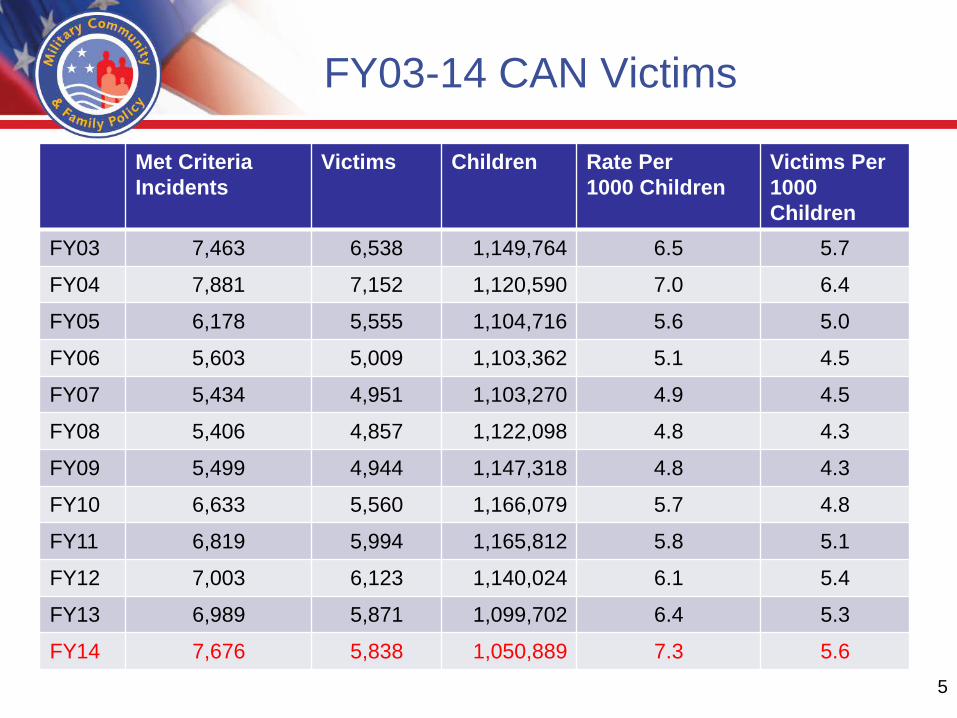
FY03-14 CAN Victims
Met Criteria Incidents
Victims Children Rate Per 1000 Children
Victims Per 1000 Children
FY03 7,463 6,538 1,149,764 6.5 5.7
FY04 7,881 7,152 1,120,590 7.0 6.4
FY05 6,178 5,555 1,104,716 5.6 5.0
FY06 5,603 5,009 1,103,362 5.1 4.5
FY07 5,434 4,951 1,103,270 4.9 4.5
FY08 5,406 4,857 1,122,098 4.8 4.3
FY09 5,499 4,944 1,147,318 4.8 4.3
FY10 6,633 5,560 1,166,079 5.7 4.8
FY11 6,819 5,994 1,165,812 5.8 5.1
FY12 7,003 6,123 1,140,024 6.1 5.4
FY13 6,989 5,871 1,099,702 6.4 5.3
FY14 7,676 5,838 1,050,889 7.3 5.6 5
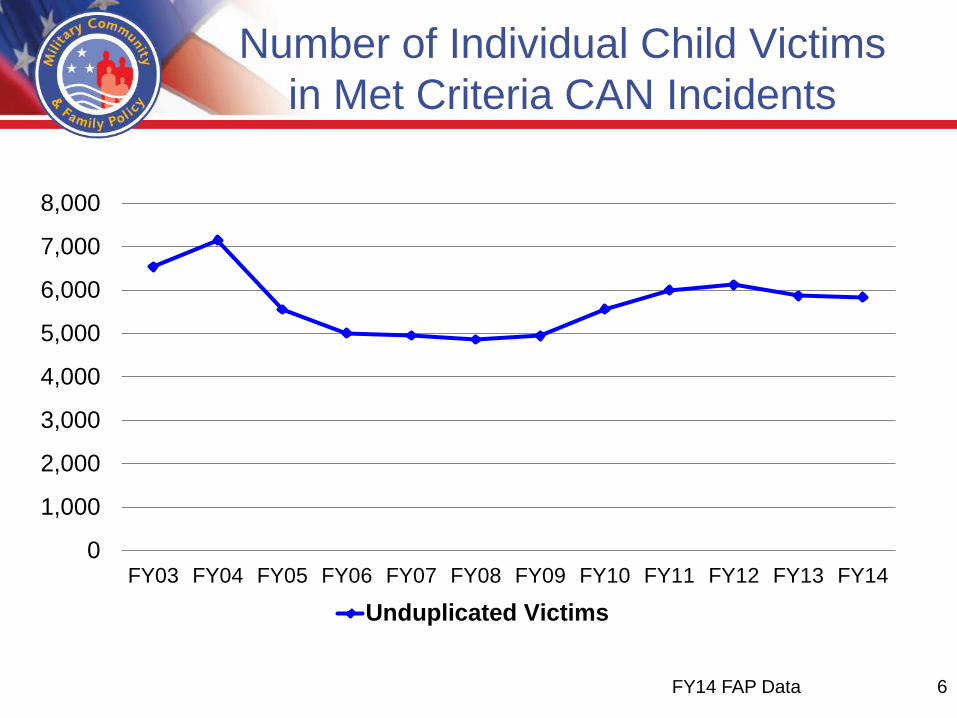
Number of Individual Child Victims in Met Criteria CAN Incidents
0
1,000
2,000
3,000
4,000
5,000
6,000
7,000
8,000
FY03 FY04 FY05 FY06 FY07 FY08 FY09 FY10 FY11 FY12 FY13 FY14
Unduplicated Victims
FY14 FAP Data 6
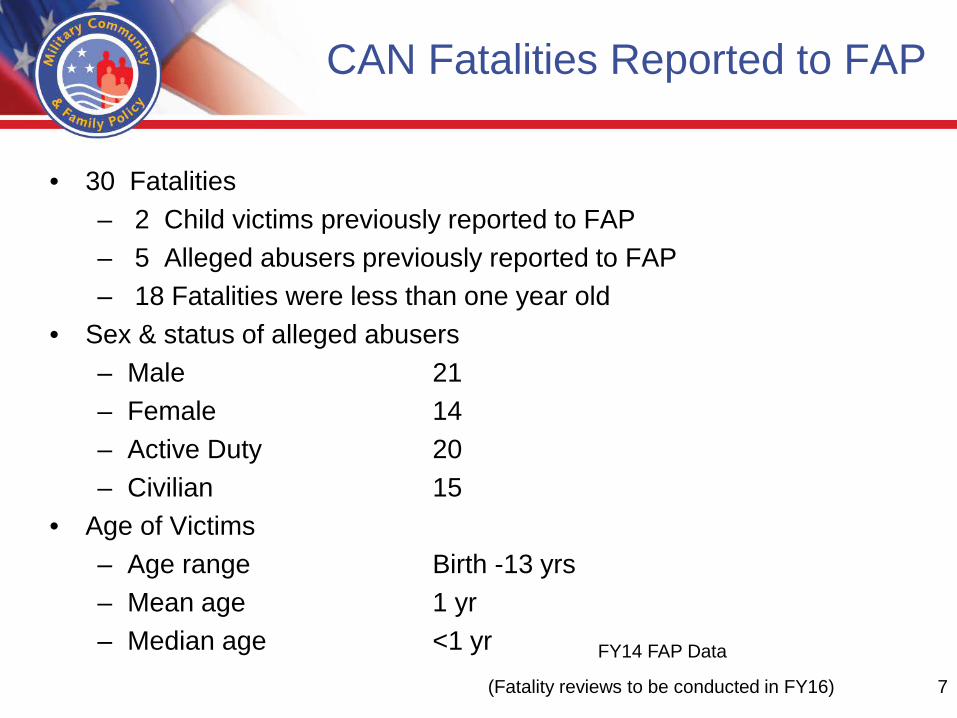
CAN Fatalities Reported to FAP
• 30 Fatalities – 2 Child victims previously reported to FAP – 5 Alleged abusers previously reported to FAP – 18 Fatalities were less than one year old
• Sex & status of alleged abusers – Male 21 – Female 14 – Active Duty 20 – Civilian 15
• Age of Victims – Age range Birth -13 yrs – Mean age 1 yr – Median age <1 yr
(Fatality reviews to be conducted in FY16)
FY14 FAP Data
7
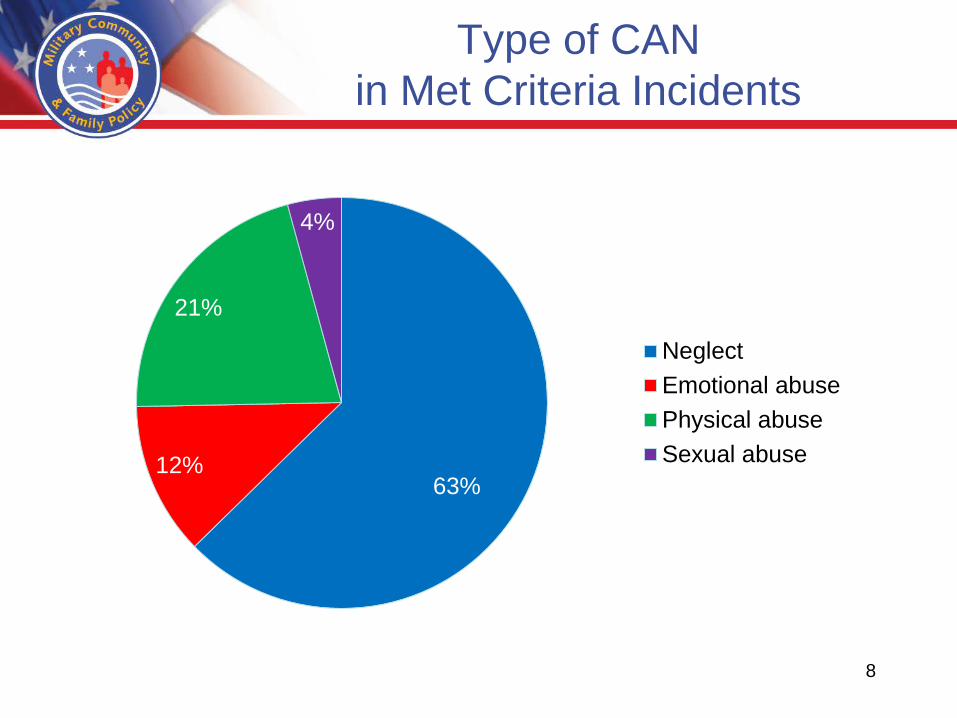
63% 12%
21%
4%
NeglectEmotional abusePhysical abuseSexual abuse
8
Type of CAN in Met Criteria Incidents
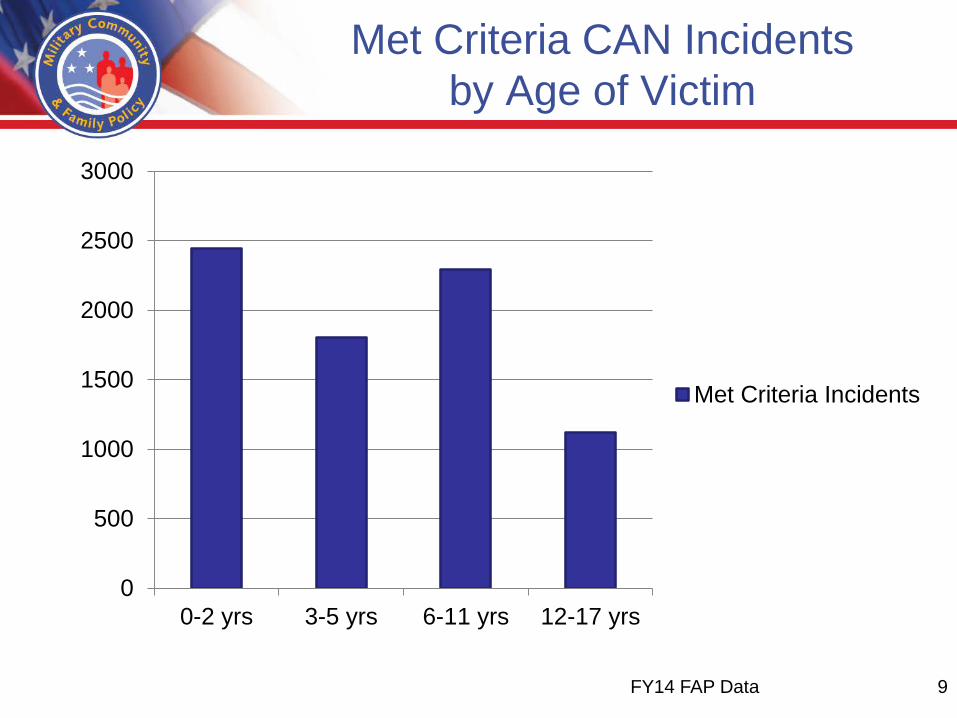
Met Criteria CAN Incidents by Age of Victim
0
500
1000
1500
2000
2500
3000
0-2 yrs 3-5 yrs 6-11 yrs 12-17 yrs
Met Criteria Incidents
FY14 FAP Data 9
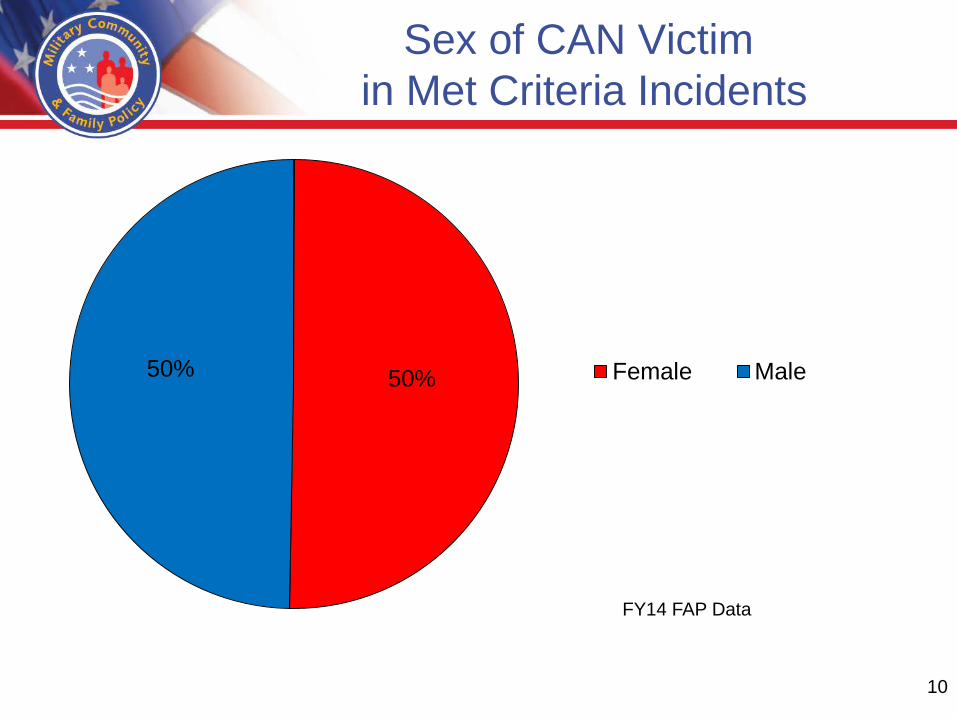
Sex of CAN Victim in Met Criteria Incidents
50% 50% Female Male
FY14 FAP Data
10
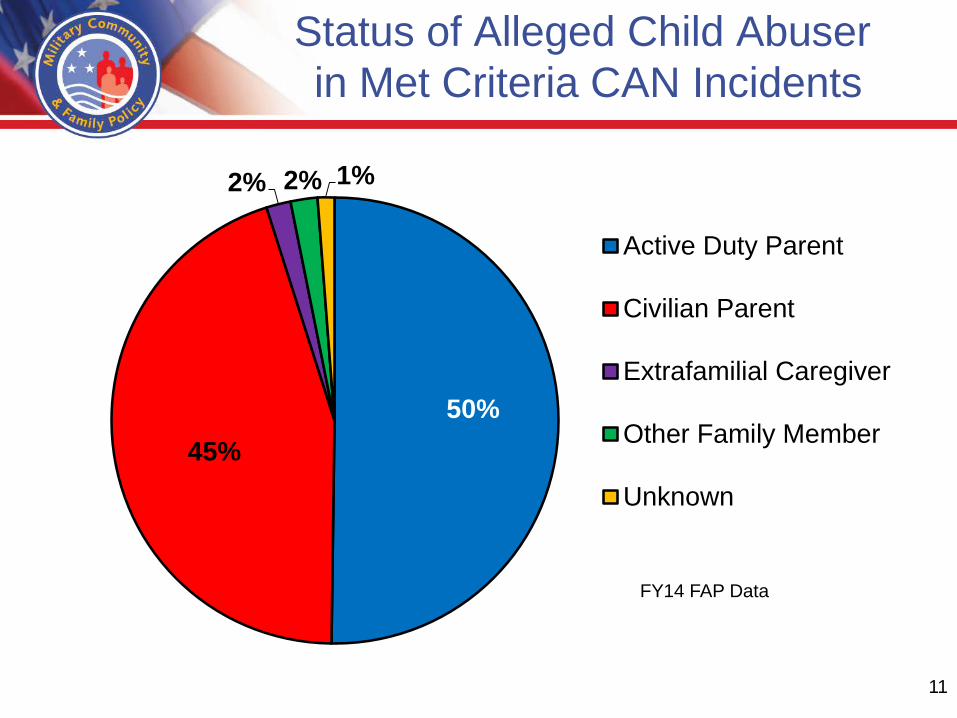
Status of Alleged Child Abuser in Met Criteria CAN Incidents
50% 45%
2% 2% 1%
Active Duty Parent
Civilian Parent
Extrafamilial Caregiver
Other Family Member
Unknown
FY14 FAP Data
11
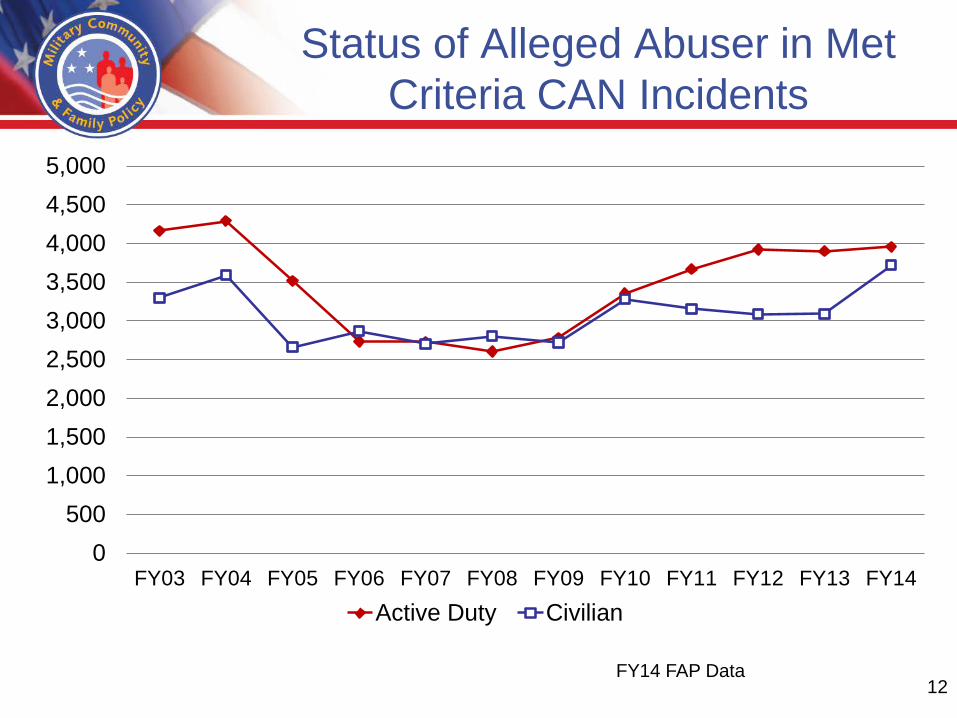
Status of Alleged Abuser in Met Criteria CAN Incidents
0500
1,0001,5002,0002,5003,0003,5004,0004,5005,000
FY03 FY04 FY05 FY06 FY07 FY08 FY09 FY10 FY11 FY12 FY13 FY14Active Duty Civilian
FY14 FAP Data 12
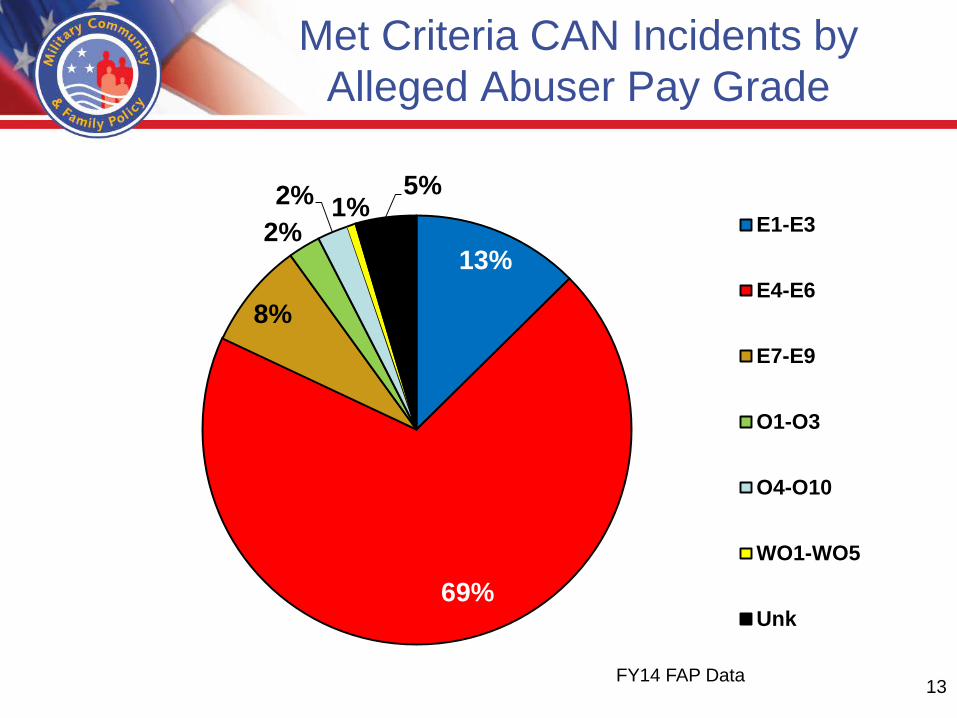
Met Criteria CAN Incidents by Alleged Abuser Pay Grade
13%
69%
8%
2% 2% 1%
5% E1-E3
E4-E6
E7-E9
O1-O3
O4-O10
WO1-WO5
Unk
FY14 FAP Data 13
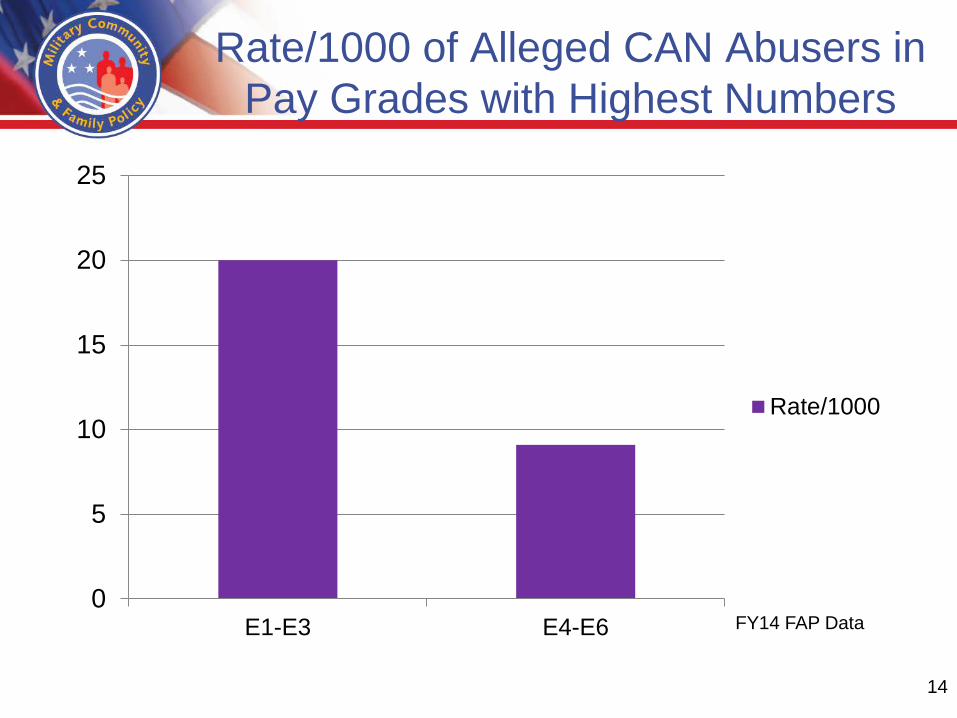
Rate/1000 of Alleged CAN Abusers in Pay Grades with Highest Numbers
0
5
10
15
20
25
E1-E3 E4-E6
Rate/1000
FY14 FAP Data
14
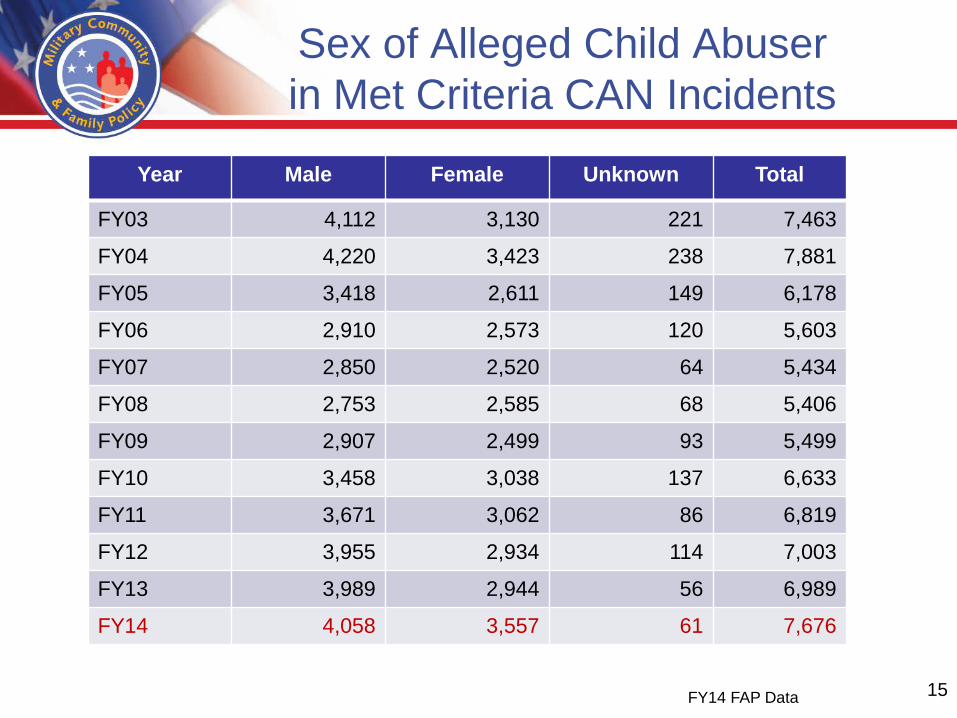
Sex of Alleged Child Abuser in Met Criteria CAN Incidents
Year Male Female Unknown Total
FY03 4,112 3,130 221 7,463
FY04 4,220 3,423 238 7,881
FY05 3,418 2,611 149 6,178
FY06 2,910 2,573 120 5,603
FY07 2,850 2,520 64 5,434
FY08 2,753 2,585 68 5,406
FY09 2,907 2,499 93 5,499
FY10 3,458 3,038 137 6,633
FY11 3,671 3,062 86 6,819
FY12 3,955 2,934 114 7,003
FY13 3,989 2,944 56 6,989
FY14 4,058 3,557 61 7,676
FY14 FAP Data 15
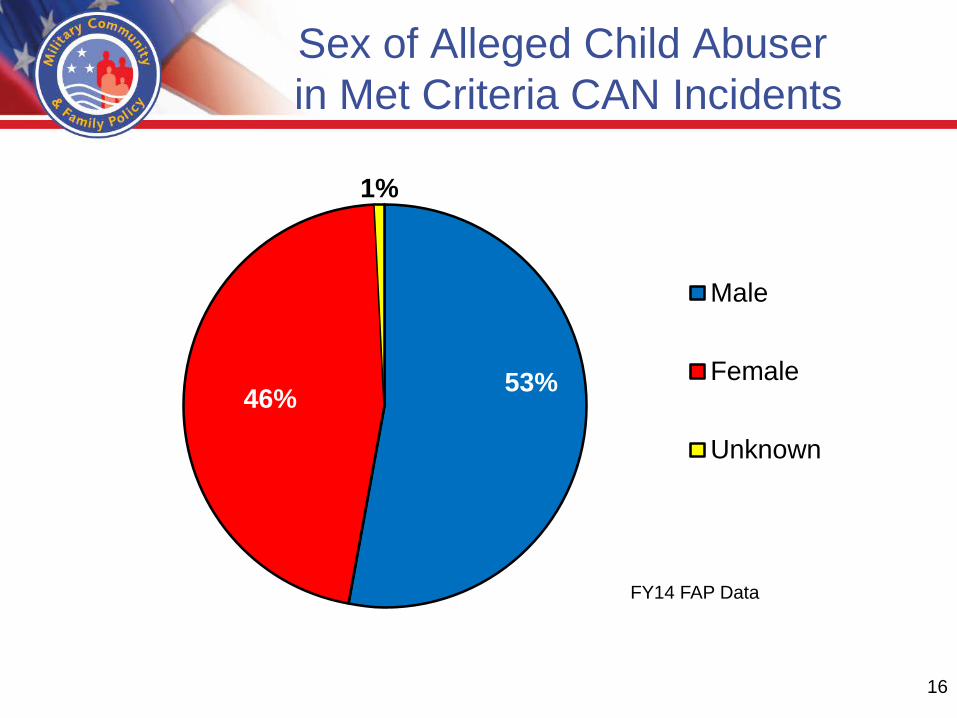
Sex of Alleged Child Abuser in Met Criteria CAN Incidents
53% 46%
1%
Male
Female
Unknown
FY14 FAP Data
16
DEPARTMENT OF DEFENSE
FAMILY ADVOCACY PROGRAM DOMESTIC ABUSE (DA) DATA
FY14 Report
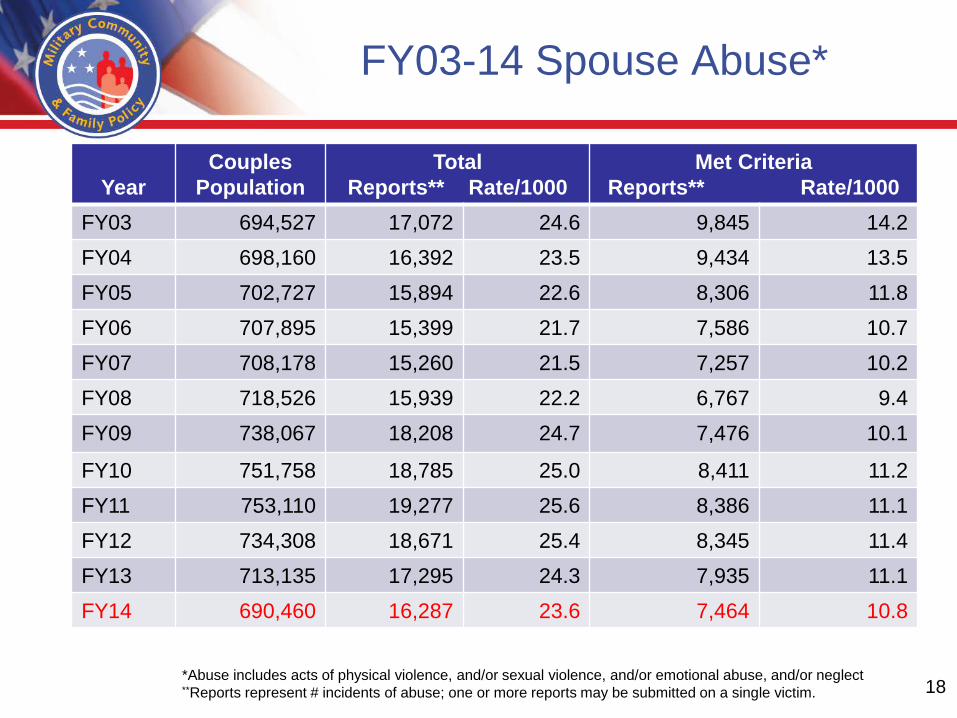
FY03-14 Spouse Abuse*
Year
Couples Population
Total Reports** Rate/1000
Met Criteria Reports** Rate/1000
FY03 694,527 17,072 24.6 9,845 14.2 FY04 698,160 16,392 23.5 9,434 13.5 FY05 702,727 15,894 22.6 8,306 11.8 FY06 707,895 15,399 21.7 7,586 10.7 FY07 708,178 15,260 21.5 7,257 10.2 FY08 718,526 15,939 22.2 6,767 9.4 FY09 738,067 18,208 24.7 7,476 10.1
FY10 751,758 18,785 25.0 8,411 11.2 FY11 753,110 19,277 25.6 8,386 11.1 FY12 734,308 18,671 25.4 8,345 11.4 FY13 713,135 17,295 24.3 7,935 11.1 FY14 690,460 16,287 23.6 7,464 10.8
*Abuse includes acts of physical violence, and/or sexual violence, and/or emotional abuse, and/or neglect **Reports represent # incidents of abuse; one or more reports may be submitted on a single victim. 18
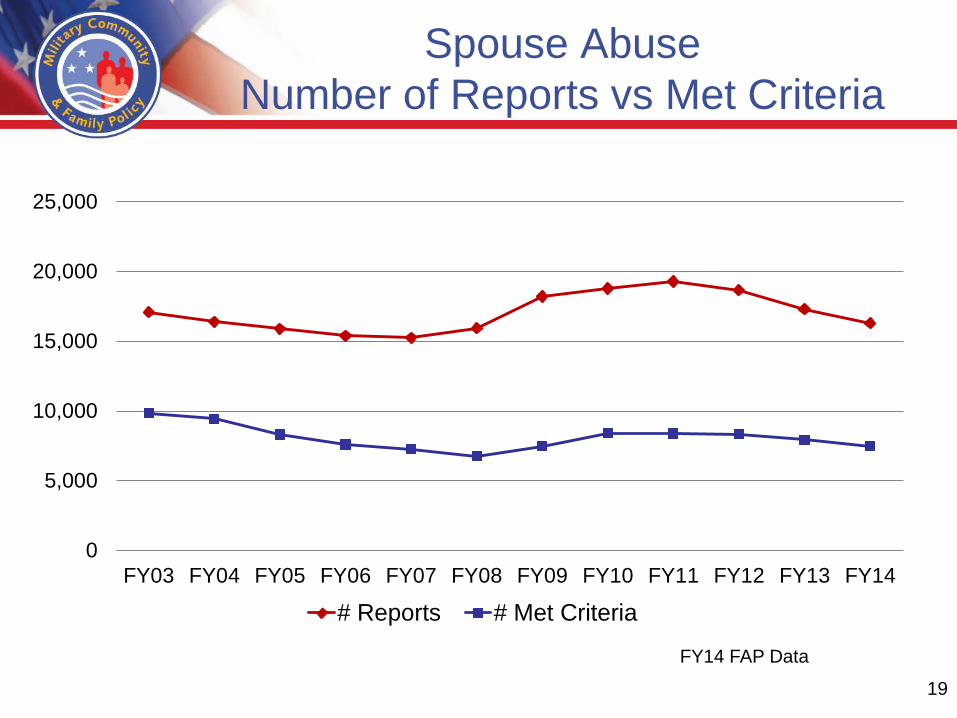
Spouse Abuse Number of Reports vs Met Criteria
0
5,000
10,000
15,000
20,000
25,000
FY03 FY04 FY05 FY06 FY07 FY08 FY09 FY10 FY11 FY12 FY13 FY14
# Reports # Met Criteria
FY14 FAP Data
19
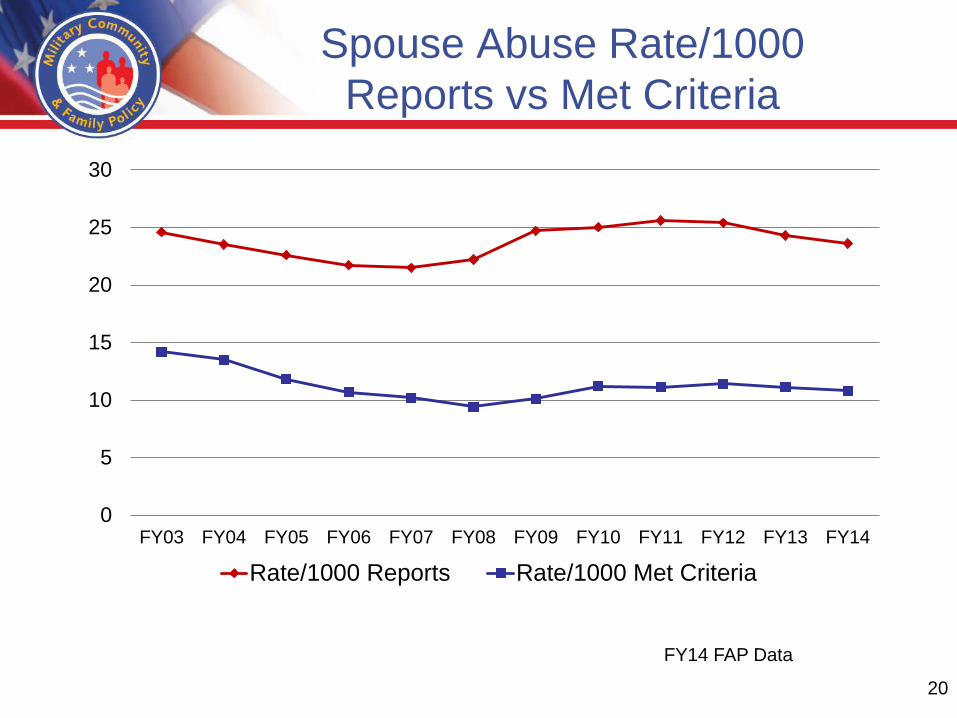
Spouse Abuse Rate/1000 Reports vs Met Criteria
0
5
10
15
20
25
30
FY03 FY04 FY05 FY06 FY07 FY08 FY09 FY10 FY11 FY12 FY13 FY14
Rate/1000 Reports Rate/1000 Met Criteria
FY14 FAP Data
20
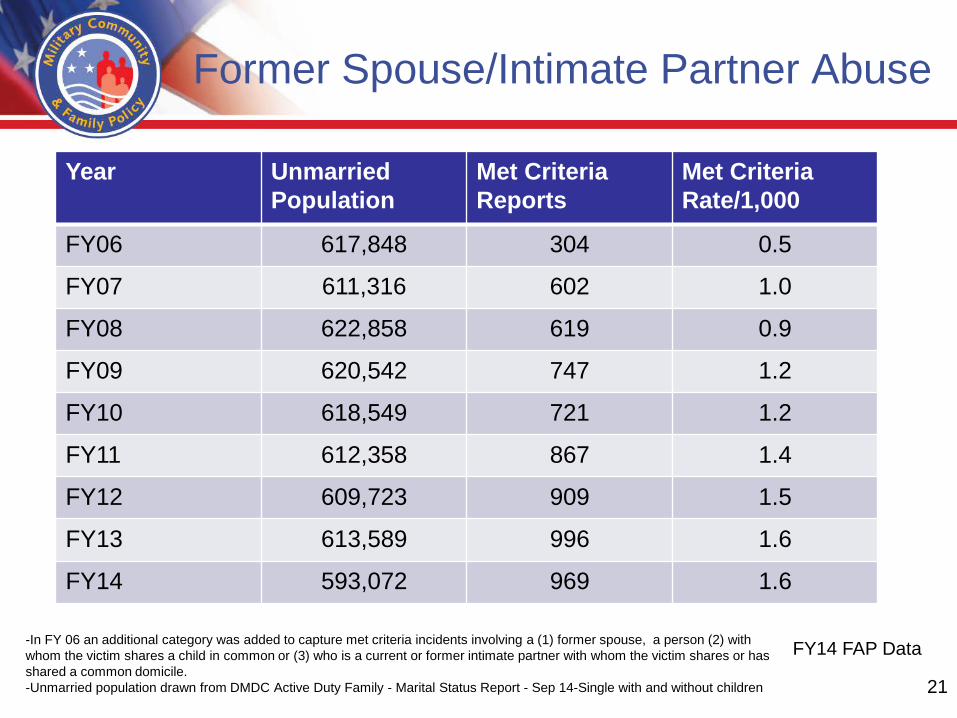
Former Spouse/Intimate Partner Abuse
Year Unmarried Population
Met Criteria Reports
Met Criteria Rate/1,000
FY06 617,848 304 0.5
FY07 611,316 602 1.0
FY08 622,858 619 0.9
FY09 620,542 747 1.2
FY10 618,549 721 1.2
FY11 612,358 867 1.4
FY12 609,723 909 1.5
FY13 613,589 996 1.6
FY14 593,072 969 1.6
-In FY 06 an additional category was added to capture met criteria incidents involving a (1) former spouse, a person (2) with whom the victim shares a child in common or (3) who is a current or former intimate partner with whom the victim shares or has shared a common domicile. -Unmarried population drawn from DMDC Active Duty Family - Marital Status Report - Sep 14-Single with and without children
FY14 FAP Data
21
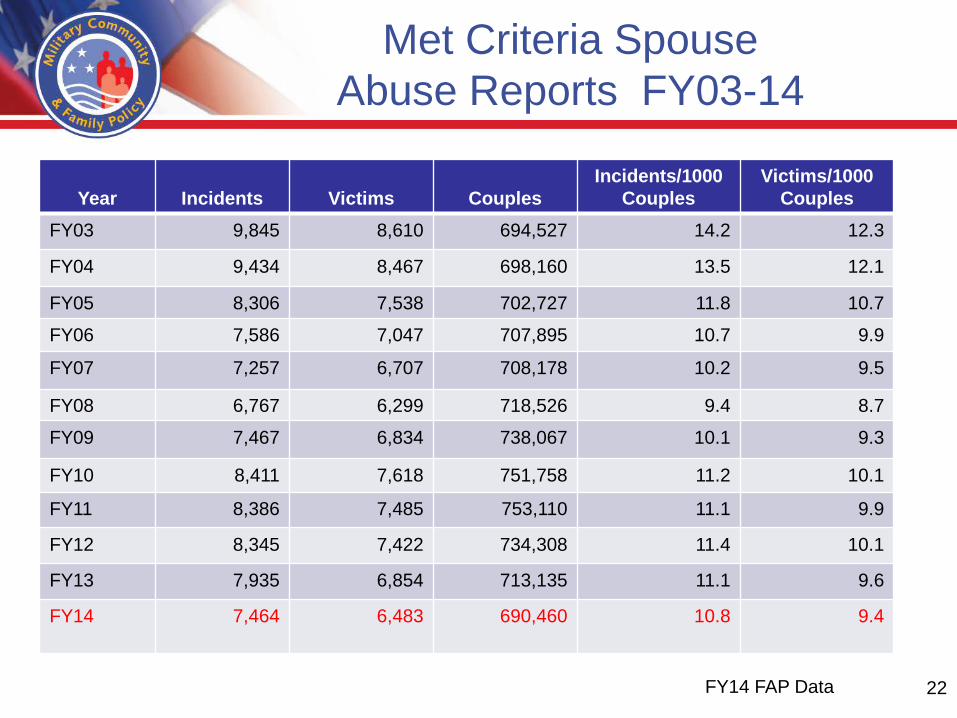
Met Criteria Spouse Abuse Reports FY03-14
Year Incidents Victims Couples Incidents/1000
Couples Victims/1000
Couples FY03 9,845 8,610 694,527 14.2 12.3
FY04 9,434 8,467 698,160 13.5 12.1
FY05 8,306 7,538 702,727 11.8 10.7
FY06 7,586 7,047 707,895 10.7 9.9
FY07 7,257 6,707 708,178 10.2 9.5
FY08 6,767 6,299 718,526 9.4 8.7
FY09 7,467 6,834 738,067 10.1 9.3
FY10 8,411 7,618 751,758 11.2 10.1
FY11 8,386 7,485 753,110 11.1 9.9
FY12 8,345 7,422 734,308 11.4 10.1
FY13 7,935 6,854 713,135 11.1 9.6
FY14 7,464 6,483 690,460
10.8 9.4
FY14 FAP Data 22
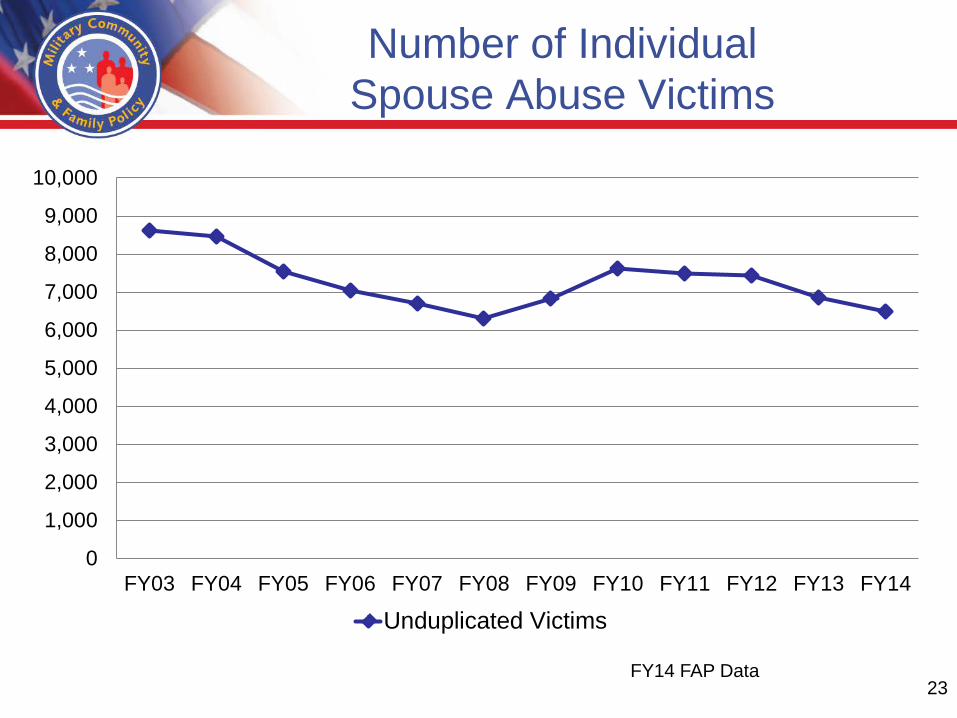
Number of Individual Spouse Abuse Victims
0
1,000
2,000
3,000
4,000
5,000
6,000
7,000
8,000
9,000
10,000
FY03 FY04 FY05 FY06 FY07 FY08 FY09 FY10 FY11 FY12 FY13 FY14
Unduplicated Victims
FY14 FAP Data 23
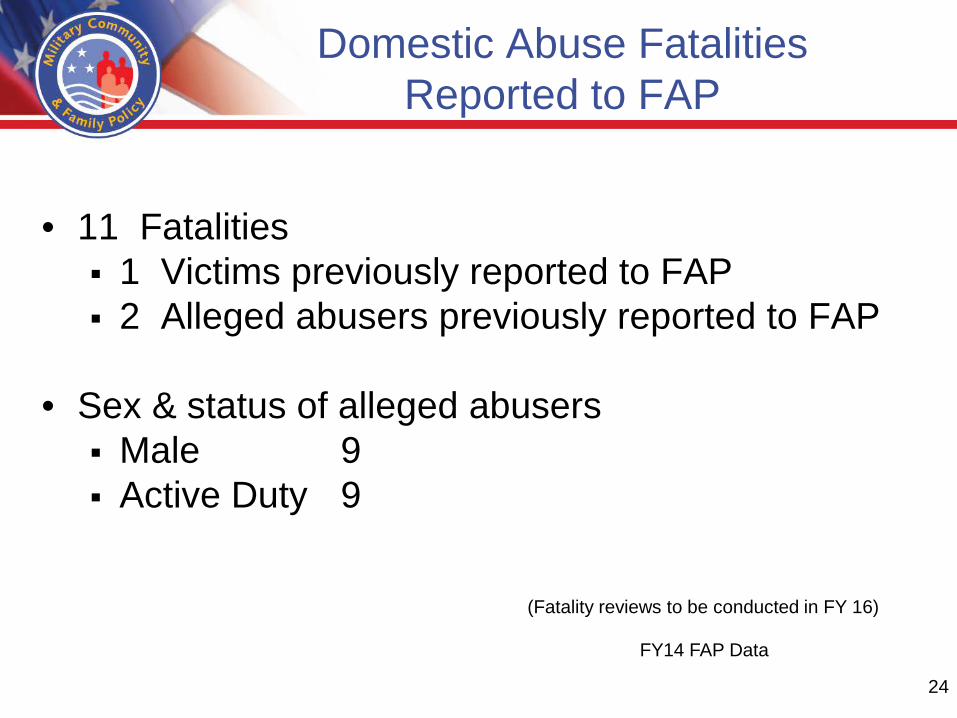
Domestic Abuse Fatalities Reported to FAP
• 11 Fatalities 1 Victims previously reported to FAP 2 Alleged abusers previously reported to FAP
• Sex & status of alleged abusers Male 9 Active Duty 9
(Fatality reviews to be conducted in FY 16)
FY14 FAP Data
24

Type of Spouse Abuse in Met Criteria Incidents
82%
4%
13% 1%
Any physical abusewithout sexual abuse
Any sexual abuse
Emotional abuse orneglect only
Unknown
FY14 FAP Data
25
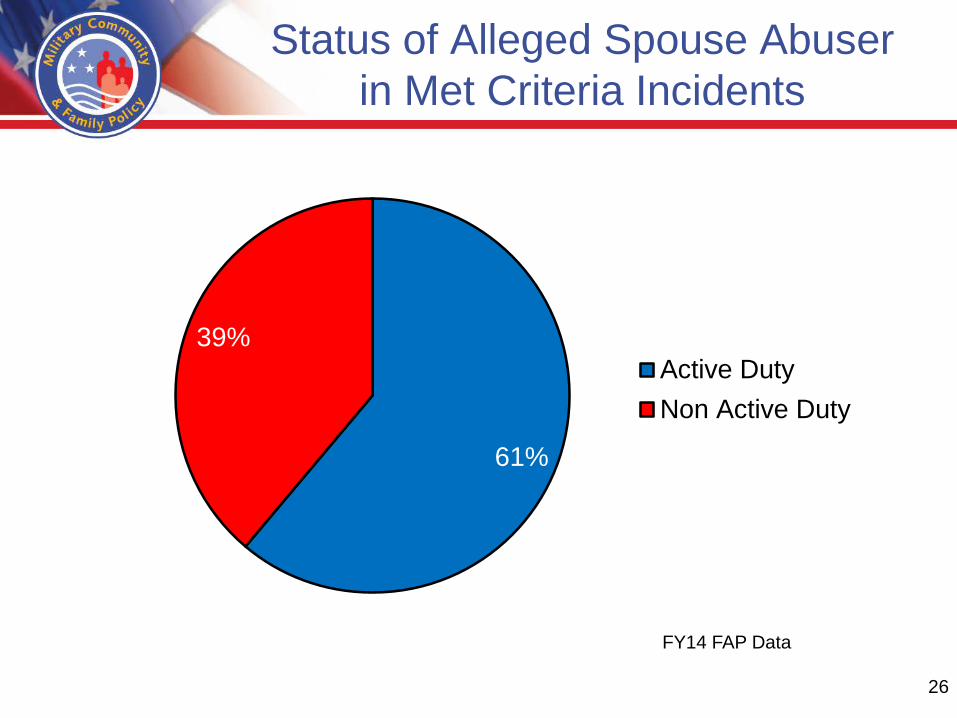
Status of Alleged Spouse Abuser in Met Criteria Incidents
61%
39% Active DutyNon Active Duty
FY14 FAP Data
26
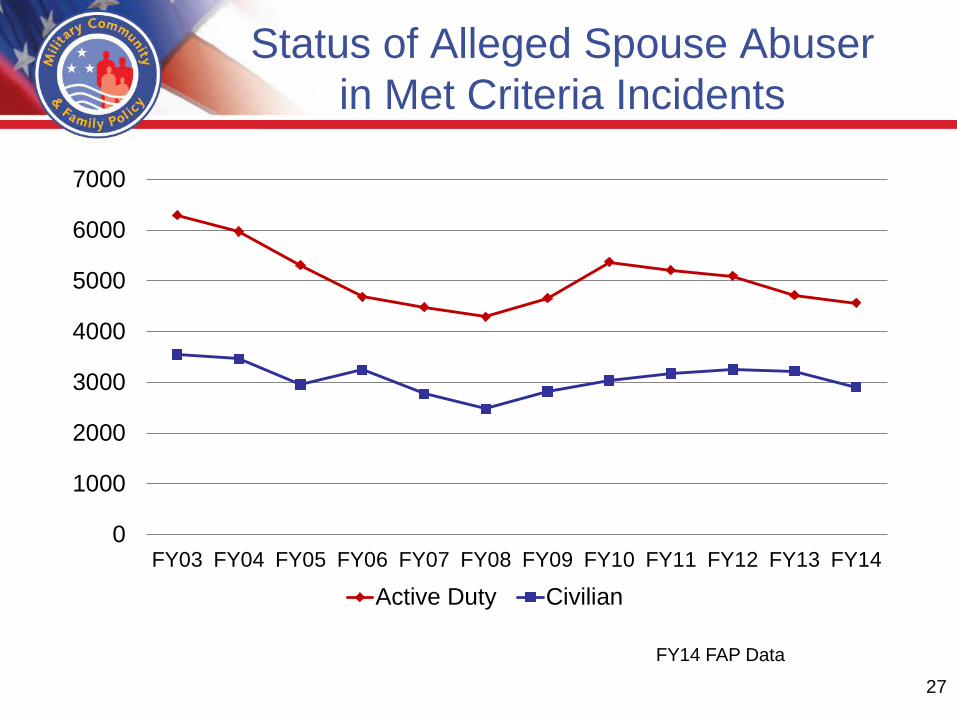
Status of Alleged Spouse Abuser in Met Criteria Incidents
0
1000
2000
3000
4000
5000
6000
7000
FY03 FY04 FY05 FY06 FY07 FY08 FY09 FY10 FY11 FY12 FY13 FY14
Active Duty Civilian
FY14 FAP Data
27
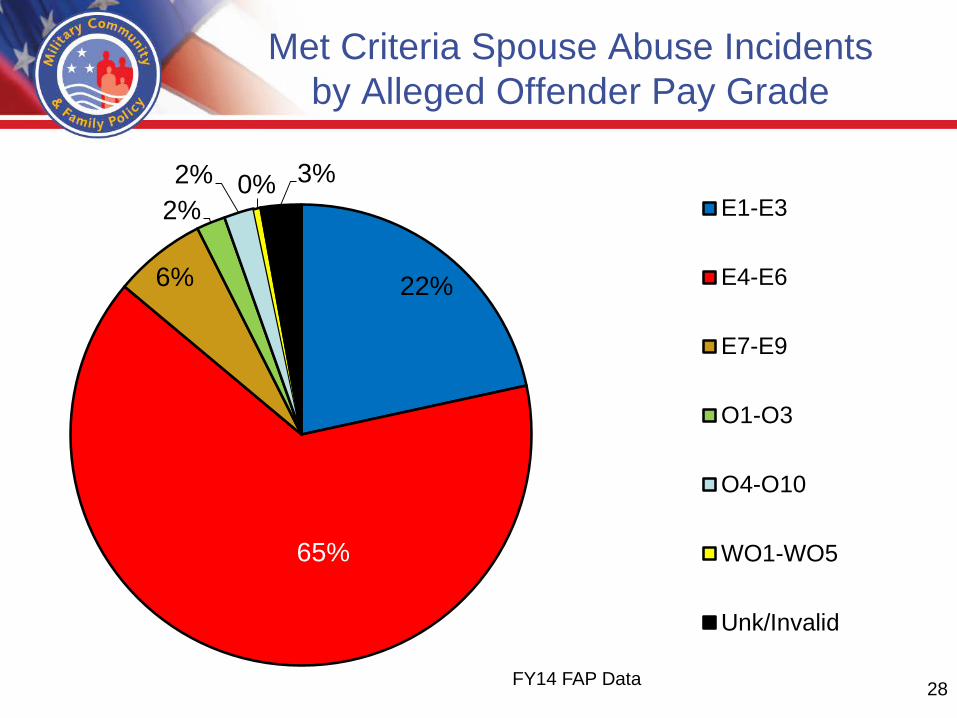
Met Criteria Spouse Abuse Incidents by Alleged Offender Pay Grade
22%
65%
6%
2% 2% 0% 3%
E1-E3
E4-E6
E7-E9
O1-O3
O4-O10
WO1-WO5
Unk/Invalid
FY14 FAP Data 28
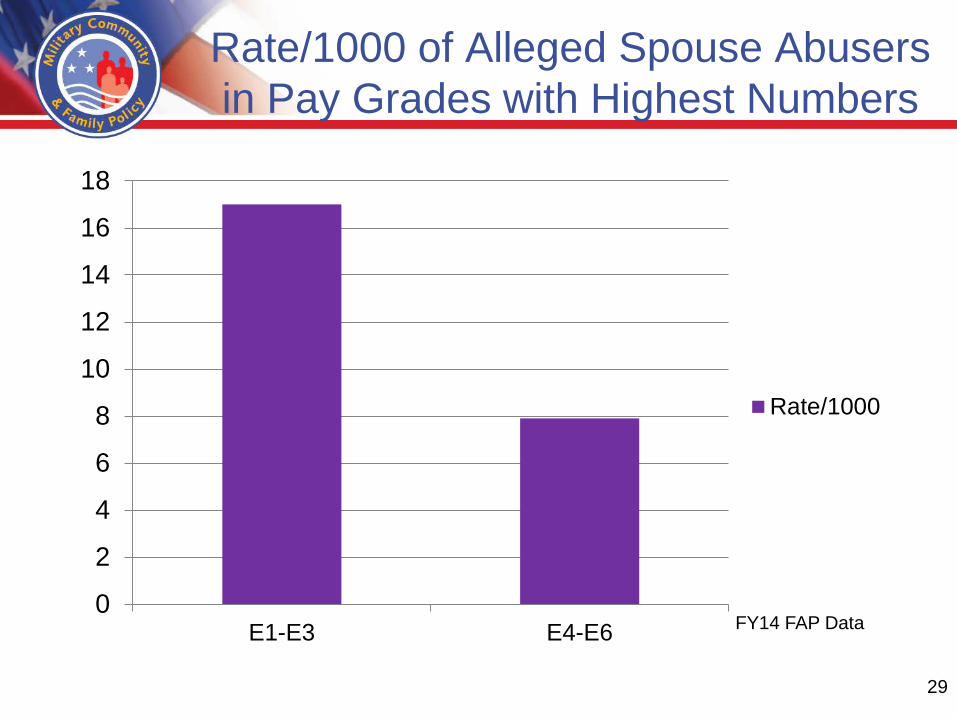
Rate/1000 of Alleged Spouse Abusers in Pay Grades with Highest Numbers
0
2
4
6
8
10
12
14
16
18
E1-E3 E4-E6
Rate/1000
FY14 FAP Data
29
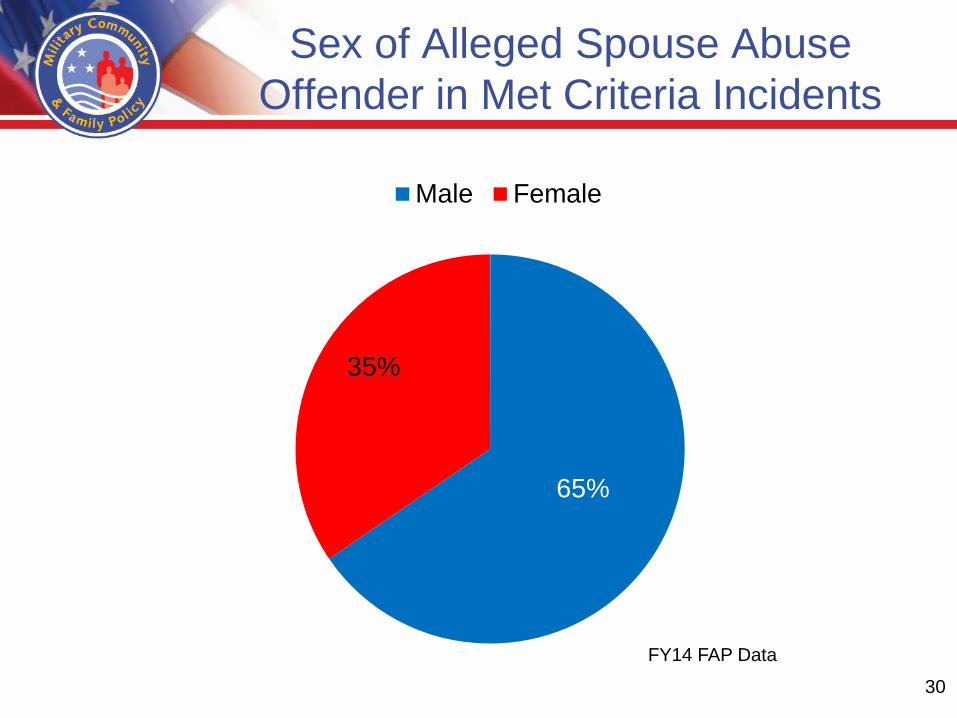
Sex of Alleged Spouse Abuse Offender in Met Criteria Incidents
65%
35%
Male Female
FY14 FAP Data
30
Family Advocacy Program Fiscal Year 2014 Spouse and Child Abuse Data Key Findings
Spouse Abuse • The number of reports of suspected spouse abuse to the Family Advocacy Program (FAP)
decreased 5.8 percent from FY13 and decreased 4.6 percent from FY03.
• The rate of reported spouse abuse per 1,000 couples decreased 2.9 percent from FY13 and decreased 4.1 percent from FY03 rates.
• The number of spouse abuse reports that met the DoD criteria for abuse and entry into the FAP Central Registry fell 5.9 percent from FY13 and have declined 24 percent since FY03. The rate of incidents that met criteria per 1,000 couples decreased 2.7 from FY13 rates and is 24 percent below FY03 rates.
• Eleven domestic abuse fatalities were reported to the FAP in FY14, of which one victim and
two alleged abusers were previously known to the FAP. In the domestic abuse fatality reports, 9 of the alleged abusers were male and 9 were active duty.
• In FY14, alleged abusers who were on active duty in incidents that met criteria for abuse represented 61 percent of all alleged abusers.
• Of the active duty alleged abusers in incidents that met criteria where the rank is known, 65 percent are in pay grades E4 - E6. These pay grades have the second highest rate per 1,000 at 7.9. The pay grades E1-E3 have the highest rate per 1,000 at 17.
• In FY14, 65 percent of victims in incidents that met criteria were female. Of all adult spouse abuse victims in incidents that met criteria, 41 percent were between the ages of 18 and 24, and 46 percent were between the ages of 25 and 35.
Child Abuse
• The number of reports of suspected child abuse/neglect to the FAP increased 7.7 percent from FY13 and increased 1.1 percent from FY03. The rate of reported child abuse/neglect per 1,000 children increased 12.1 percent over FY13 rates and increased 10.6 percent above FY03 rates.
• The number of incidents of child abuse/neglect that met criteria increased by 9.8 percent from FY13, and increased 2.9 percent from FY03. The rate of incidents per 1,000 children that met criteria increased 14.1 percent over FY13 rates and increased 12.3 percent over FY03 rates.
• Of those incidents of child abuse and neglect that met criteria in FY14, 75 percent involved child neglect or child emotional abuse only. Child neglect accounts for 63 percent of all
2
incidents that met criteria. Incidents involving child neglect only increased by 14% from FY13.
• There were 30 child abuse-related fatalities reported to FAP in FY14, of which two child
victims and five abusers were previously known to FAP. In the child fatality incidents, 21 of the alleged abusers were male and 20 were active duty. Eighteen of the child abuse related fatalities involved children under the age of one.
• Of the active duty alleged abusers in incidents that met criteria, 69 percent are in the E4 - E6 pay grades. These pay grades have the second highest rate per 1,000 at 9.1. The pay grades E1 - E3 have the highest rate per 1,000 at 20.
• In FY14, 53 percent of the alleged abusers in incidents that met criteria were male. 95 percent of the alleged abusers were parents. The ratio of male to female alleged abusers and the percentage of parent alleged abusers in incidents that met criteria have remained relatively constant since FY03.