Department of Atmospheric and Oceanic Sciences,...
49
1 Tropical precipitation variability and convectively coupled equatorial waves 1 on submonthly time-scales in reanalyses and TRMM 2 3 JI-EUN KIM 4 Department of Atmospheric and Oceanic Sciences, University of Colorado, Boulder, Colorado 5 M. JOAN ALEXANDER 6 NorthWest Research Associates/CoRA, Boulder, Colorado 7 8 9 10 Submitted June 15, 2012 11 Revised October XX, 2012 12 13 14 15 16 17
-
Upload
nguyenngoc -
Category
Documents
-
view
217 -
download
1
Transcript of Department of Atmospheric and Oceanic Sciences,...

1
Tropical precipitation variability and convectively coupled equatorial waves 1
on submonthly time-scales in reanalyses and TRMM 2
3
JI-EUN KIM 4
Department of Atmospheric and Oceanic Sciences, University of Colorado, Boulder, Colorado 5
M. JOAN ALEXANDER 6
NorthWest Research Associates/CoRA, Boulder, Colorado 7
8
9
10
Submitted June 15, 2012 11
Revised October XX, 2012 12
13
14
15
16
17

2
ABSTRACT 18
Tropical precipitation characteristics are investigated using the Tropical Rainfall Measuring 19
Mission (TRMM) 3-hourly estimates, and the result is compared with five reanalyses including 20
ERA-interim (ERA), Modern-Era Retrospective Analysis (MERRA), National Centers for 21
Environmental Prediction (NCEP)-National Center for Atmospheric Research (NCEP1), NCEP-22
Department of Energy (NCEP2), and NCEP-Climate Forecast System Reanalysis (CFSR). 23
Precipitation characteristics are evaluated in terms of the mean, convectively coupled equatorial 24
wave (CCEW) activity, frequency characteristics, diurnal cycle, and seasonality of regional 25
precipitation variability associated with submonthly scale waves. Generally the latest reanalyses 26
such as ERA, MERRA, and CFSR show better performances over NCEP1 and NCEP2. However, 27
all the reanalyses are still different from observations. Besides the positive mean bias in the 28
reanalyses, a spectral analysis revealed that the reanalyses have over-reddened spectra with 29
persistent rainfall. MERRA has the most persistent rainfall, and CFSR appears to have the most 30
realistic variability. The diurnal cycle in NCEP1 is extremely exaggerated compared to TRMM. 31
The low-frequency CCEWs with the period longer than 3 days are well represented in ERA, 32
MERRA, and CFSR, but all the reanalyses have significant deficiencies in representing CCEWs 33
and variability in the high-frequency scale. 34
35
36
37
38

3
1. Introduction 39
40
Tropical convection plays a vital role in global climate by driving large-scale circulation, 41
releasing latent heat, modulating radiative forcing, and most importantly redistributing water in 42
the earth system. Due to complex interactions of moist convection with dynamical, 43
thermodynamical, and cloud processes, it is difficult to fully understand the tropical precipitation 44
system. Over the past few decades, global observations with the advent of satellites have enabled 45
better understanding of how tropical convection is organized and evolves. Studies about 46
cloudiness and precipitation have revealed that tropical convective systems are often organized 47
by equatorial waves, rather than initiated randomly (Cho et al. 2004; Wheeler and Kiladis 1999). 48
The equatorial waves trigger moist convection, and at the same time the tropical convection itself 49
generates waves that propagate horizontally and vertically. These intriguing inter-dynamical 50
responses between convection and equatorial waves occur at broad temporal and spatial scales 51
ranging from the mesoscale to the planetary scale. 52
The pronounced spectral peaks in the observed equatorial waves correspond to the predicted 53
dispersion curves, solutions of the shallow water equations on the equatorial beta plane (Matsuno 54
1966). As mathematically derived by Matsuno, observations have confirmed the existence of 55
equatorial waves such as the Kelvin, mixed Rossby-Gravity (MRG), equatorial Rossby, and 56
inertio-gravity (IG) waves (Kiladis et al. 2009). In addition to these waves, the Madden-Julian 57
Oscillation (MJO) and tropical depression (TD)-type waves (Takayabu and Nitta 1993) also have 58
significant impact on tropical weather and climate by coupling with convection. The MJO is the 59
eastward propagating convective envelope, dominating intraseasonal (30-90 days) variability 60
4
with the speed of about 5 m/s (Zhang 2005). Within the active phase of the MJO, a broad 61
spectrum of cloud clusters coupled with waves has been identified. The tropical depression (TD)-62
type waves, also known as “easterly waves”, are westward propagating synoptic scale 63
disturbances along the ITCZ with periods of 2-6 days—predominantly 3-6 days—and speeds of 64
5-10 m/s (Frank and Roundy 2006; Kiladis et al. 2006; Dickinson and Molinari 2002). This type 65
of wave is very important for the formation of tropical cyclones (Frank and Roundy 2006). 66
In addition to direct impacts of CCEWs on tropical weather, indirect effects of convection 67
are also significant for the tropical middle atmosphere and global climate. Observational studies 68
of meteorological variables have discovered the existence of equatorial waves in the stratosphere 69
(Wallace and Kousky 1968; Yanai and Maruyama 1966). These waves are called dry or free 70
waves, because although they are generated by latent heating due to tropospheric moist 71
convection they are no longer coupled with convection as they propagate into the upper 72
atmosphere (Holton 1972). More vertically propagating waves are preferentially excited by small 73
and transient scale convection (Alexander and Holton 2004). The prime example of the dry wave 74
impacts is the forcing of the QBO, which is a quasi-periodic downward propagation of easterly 75
and westerly zonal flows (Baldwin et al. 2001). By depositing easterly and westerly momentum 76
in the stratosphere, vertically propagating waves modulate the background zonal wind 77
(Alexander and Holton 1997; Kawatani et al. 2010; Lindzen and Holton 1968). Also, the tropical 78
waves are partially responsible for driving the global-scale stratospheric transport circulation. 79
Redistribution of important chemical constituents such as ozone and water vapor by this 80
circulation modulates the tropospheric and stratospheric climate (Forster and Shine 2002; 81
Hegglin and Shepherd 2009; Solomon et al. 2010). 82
5
Hence, generating realistic precipitation variability and CCEWs in climate simulation models 83
is a fundamental problem in correct prediction of middle atmosphere climate as well as in 84
accurate weather forecasting. Despite its importance, precipitation in current climate simulations 85
shows large disagreements among different models. Studies have revealed that many general 86
circulation models (GCMs) still do not produce CCEWs properly (Lin et al. 2006; Straub et al. 87
2010). Moreover, most of the studies have been conducted only for intraseasonal scale variability. 88
Evaluation studies of precipitation have also been conducted for reanalyses (Betts et al. 2006; 89
Bosilovich et al. 2008; Janowiak et al. 1998; Janowiak et al. 2010; Roads 2003; Wang et al. 90
2010a). Reanalysis datasets are produced by a “frozen” model with data assimilation, the process 91
that integrates observations with model simulations, to provide a dynamically consistent analysis 92
for an extended period of time. Unlike the state variables, which are assimilated, precipitation in 93
reanalyses is almost entirely a model product. In some cases, precipitation is assimilated, but 94
weighting of observational information in the analysis procedure is so low that final precipitation 95
products still heavily depend on model physics (Rienecker et al. 2011). So, precipitation in 96
reanalyses can be a metric of model performance in dealing with convective processes, 97
constrained by more realistic weather and climate states than GCMs. The studies for 98
precipitation in reanalyses have also focused on intraseasonal or longer time scales. 99
To investigate precipitation characteristics as a result of CCEWs and as a source of vertically 100
propagating waves, we extracted the highest available time resolution precipitation products 101
from five reanalyses and the Tropical Rainfall Measuring Mission (TRMM) satellite 102
observations. The spectral analysis for fine time resolution data enables us to access precipitation 103
variability in the context of CCEW activity. By choosing the time frame of 36 days for each 104

6
spectral analysis set, we can investigate the seasonal evolution of submonthly precipitation 105
variability in different tropical regions. 106
107
2. Datasets 108
109
We analyzed precipitation data for the period of January 2005 through December 2007 from five 110
reanalyses: ERA-interim (ERA) (Dee et al. 2011), Modern-Era Retrospective Analysis (MERRA) 111
(Rienecker et al. 2011), National Centers for Environmental Prediction (NCEP)-National Center 112
for Atmospheric and Research (NCEP1) (Kalnay et al. 1996), NCEP-Department of Energy 113
(NCEP2) (Kanamitsu et al. 2002), and NCEP-Climate Forecast System Reanalysis (CFSR) (Saha 114
et al. 2010). ERA-interim is the latest reanalysis produced at the European Centre for Medium-115
Range Weather Forecasts (ECMWF). MERRA is generated by NASA’s Goddard Earth 116
Observing System (GEOS) atmospheric model v. 5.2.0 and data assimilation system (DAS). 117
CFSR is the ocean-atmosphere coupled global NCEP reanalysis, an improved version of NCEP1 118
and NCEP2. The key features and basic information related to precipitation in the reanalyses are 119
listed in Table 1. We used 6-hourly or 3-hourly products, if available, to capture temporal 120
precipitation variability of high-frequency scales. 121
To compare with the reanalysis results, we used the 3B42 dataset from the Tropical Rainfall 122
Measuring Mission (TRMM) (Huffman et al. 2007). The TRMM 3B42 is a 3-hourly product 123
with the grid resolution of 0.25ox0.25
o between 50S and 50N. Various satellite measurements 124
were used to generate the precipitation data of 3B42. A combination of the TRMM precipitation 125
radar (PR), the TRMM microwave imager (TMI), and microwave data from other satellites 126

7
provide precipitation estimates, but there are measurement gaps due to sparse sampling. By using 127
the infrared (IR) channel data from geostationary earth orbit satellites, precipitation estimates 128
were adjusted and covered uniformly in space and time. The final rain products were merged 129
with rain gauge analyses where available. 130
Although TRMM 3B42 is one of the best high-resolution precipitation datasets, and TRMM 131
monthly precipitation is well validated, we note that it still has uncertainties on subdaily time 132
scales. Using IR brightness temperatures where microwave measurements are unavailable would 133
yield problems with non-convective precipitation. Furthermore, Huffman et al. (2007) described 134
how lack of sensitivity to light precipitation over the ocean in one microwave product has 135
resulted in lower skill in moderate and light rainfall events on subdaily time scales. Nonetheless, 136
their results show TRMM 3-hourly products capture most of the rainfall events observed in a 137
buoy gauge dataset in the western Pacific ITCZ. Histograms of TRMM 3B42 and radar data 138
generally match, and the diurnal cycle of TRMM 3B42 has good agreement with gauge 139
observations with slight phase and amplitude differences. 140
141
3. Methodology 142
143
We performed a spectral analysis for longitude-time cross sections to identify space-time 144
precipitation variability. This method is especially useful for studying zonally propagating 145
disturbances, giving the spectral dispersion in the wavenumber-frequency space. A power 146
spectrum and variance are proportional to a squared value of precipitation perturbation. Since 147
precipitation is spatially and temporally intermittent, a finer resolution gives higher values of 148

8
power spectrum and variance. For more reliable quantitative comparisons of variance, we 149
rebinned data in the horizontal to approximately the same resolution of about 1.875ox1.875
o. 150
Table 1 shows the available temporal and spatial resolutions of five reanalyses. The spatial 151
rebinning process is not applied to NCEP1, NCEP2, and CFSR, which are already provided at 152
relatively coarse resolution of approximately 1.875ox1.905
o in the tropics. We calculate area-153
weighted average rain rates to rebin the different horizontal resolutions of TRMM, ERA, and 154
MERRA into 1.875ox1.875
o. Hourly data from MERRA and CFSR are averaged into the 3-155
hourly resolution. 156
Since we are interested in submonthly scale variability and its seasonal changes, the time 157
period of 36 days was chosen for the Fast Fourier Transform (FFT) with 6-day overlap and taper. 158
This time period will resolve westward and eastward IG waves, TD-type waves, MRG waves, 159
most Kelvin waves, and transient parts of the Rossby wave spectrum. The disturbances longer 160
than the monthly scale lie at zero frequency in our wavenumber-frequency spectrum. We define 161
this as the “quasi-stationary” part of the spectrum. Rossby waves have spectral peaks with the 162
periods of 30 days, and the MJO is a 30-90 day intraseasonal oscillation. Thus, the quasi-163
stationary spectrum is contributed mostly by the MJO and very slowly moving Rossby waves. 164
Many studies for CCEWs utilize the method of symmetric and anti-symmetric decomposition 165
against the background spectrum to identify wave signals (Hendon and Wheeler 2008; Lin et al. 166
2006; Wheeler and Kiladis 1999). In these studies, the symmetric component is defined by the 167
average of perturbation variables between the northern and southern hemispheres, and anti-168
symmetric is half of the difference. Then the symmetric and anti-symmetric spectra are divided 169
by the smoothed background spectrum. Although this method has an advantage in identifying the 170
CCEWs and their phase speeds through the statistically significant dispersion curves in the 171

9
spectrum, its resultant spectrum only shows relatively significant spectral peaks for meridionally 172
symmetric and anti-symmetric disturbances against the background. On the other hand, the raw 173
spectrum gives absolute variance in Fourier space so that we can compare total precipitation 174
variance as a function of wavenumber and frequency in different datasets. In this paper, we are 175
interested not only in CCEW signals but also in precipitation variability and frequency 176
characteristics. Hence, to evaluate total precipitation variability depending on wavenumber and 177
frequency, we used the raw spectrum without smoothing. To determine whether and how 178
CCEWs are represented in reanalyses, we examine prominent lobes in raw spectra of symmetric 179
and anti-symmetric components. 180
181
4. Results 182
183
a. Mean precipitation 184
Fig. 1 shows the spatial distribution of 3-year mean precipitation. All reanalyses have biases in 185
the tropics as pointed out in other studies. ERA and MERRA have almost the same mean value 186
of 0.2 mm/hr, and they share similar characteristics in mean precipitation with consistent positive 187
biases over all tropical regions and over the time series. (See Figs. 1-3.) The mean of NCEP1 is 188
0.19 mm/hr, which is close to the mean of ERA and MERRA, but it shows a more spatially 189
uniform distribution with less precipitation in the ITCZ compared to other datasets. In contrast, 190
NCEP2 has a significant high bias in the ITCZ. CFSR also has strong precipitation along the 191
ITCZ, but intensified precipitation distributions in the ITCZ are very different between NCEP2 192
and CFSR. While the positive bias of NCEP2 is significant in the western Pacific, precipitation 193

10
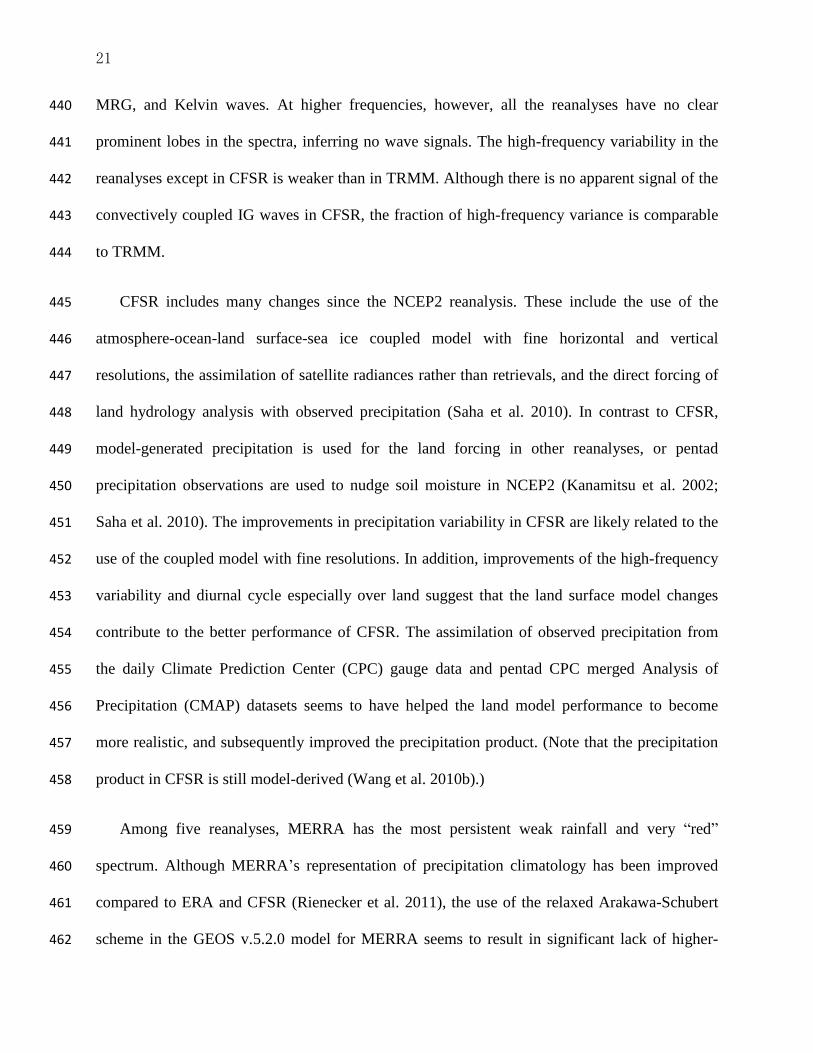
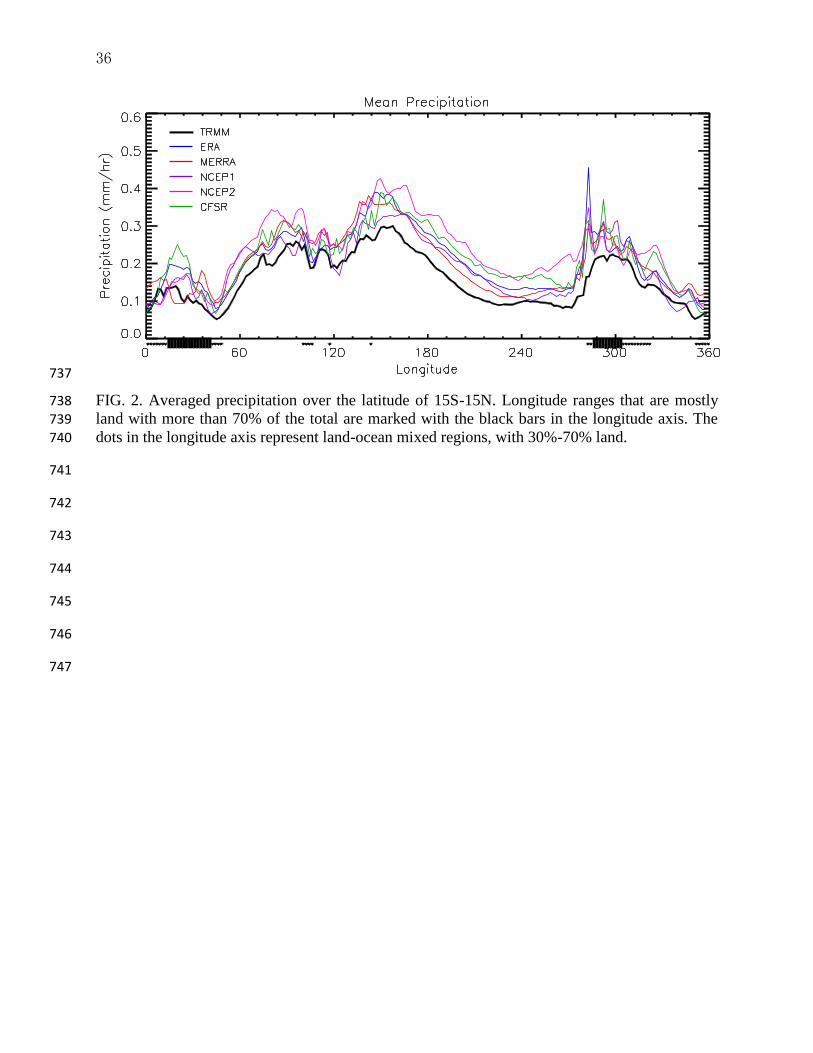
along the ITCZ in CFSR is exaggerated mainly in the central and eastern Pacific. In Fig. 2, 194
precipitation is averaged over tropical latitudes 15S-15N. Longitude ranges that are mostly land 195
with more than 70% of the total are marked with the black bars in the longitude axis. The dots in 196
the longitude axis represent land-ocean mixed regions, with 30%-70% land. The geographical 197
precipitation patterns of ERA and MERRA look the same except in Africa. ERA and CFSR 198
generate more rainfall than other datasets in Africa, while MERRA shows suppressed rainfall in 199
Africa. Peaks in reanalyses on the west side of America reveal excessive orographic precipitation 200
along the Andes. The time series of zonally averaged precipitation as a function of latitude in Fig. 201
3 shows the seasonal migration of the ITCZ and the Southern Pacific Convergence Zone (SPCZ). 202
Although there are some biases in mean precipitation (mostly in the ITCZ), all datasets generally 203
agree on the seasonal changes: the ITCZ moves farther to the north at 7N-12N during July-204
August-September, and strong precipitation in the SPCZ occurs during January-February. 205
206
b. Longitude-Time section and PDF 207
Fig. 4 shows zonal propagation of precipitation at 5N between June-September 2006. Observed 208
TRMM precipitation in Fig. 4a identifies the diurnal cycle and ubiquitous eastward and 209
westward propagating features with different speeds. The large-scale eastward moving envelope 210
is the MJO with the period of 30-90 days. The active phase of the MJO is initiated in the Indian 211
Ocean and progresses through the Maritime Continent and the western Pacific at the speed of 5 212
m/s. There are also smaller-scale eastward and westward waves within the MJO envelope. 213
In Fig. 4a, relatively faster eastward moving signals with the phase speed of about 10 m/s are 214
Kelvin waves. Westward signals are composed of TD-type and westward IG waves. Western 215
11
African rainfall is dominated by small-scale westward propagating waves, mostly triggered by 216
the diurnal cycle, which are strongly coupled to convection. The diurnal cycle is clearly seen 217
over the land regions. 218
Figs. 4b-f show the same longitude-time cross sections for reanalyses. Precipitation patterns 219
in ERA, MERRA, and NCEP1 are broadened in space and time. Widespread persistent, weak 220
rainfall is a common problem in climate models. The probability density function (PDF) and the 221
99th
percentile of 3-year precipitation in Fig. 5 shows that intense rainfall events are highly 222
underestimated in ERA, MERRA, and NCEP1. NCEP2, however, has more intense and less 223
persistent precipitation patterns. Westward propagating precipitation features in NCEP2 in Fig. 224
4e are very strong compared to TRMM, especially in the eastern Pacific. CFSR seems to have 225
the most realistic variability and wave propagation characteristics. The PDF and the 99th
226
percentile of precipitation intensity in CFSR matches the values in TRMM very well in Fig. 5, 227
and the spurious strong westward waves in the Pacific of NCEP2 have become more realistic in 228
CFSR shown in Fig. 4f. We will examine zonal propagation characteristics more closely in the 229
following sections. 230
231
c. Spectrum 232
Fig. 6 illustrates averaged spectra, without filtering or smoothing, between 15S-15N over the 233
time period of 2005-2007. These raw spectra are very “red”, which means spectral density gets 234
higher with lower wavenumber and lower frequency. This “redness” of the spectrum is a 235
universal property of climatic variables. It suggests that the atmospheric processes occur in the 236

12
broad space and time scales, and that one scale of process is always accompanied by the other 237
scales. 238
Although the “redness” is an apparent feature of the spectra, we can also identify wave 239
signals in the raw spectra, following preferred lobes in each propagation direction. In Fig. 6, the 240
slopes (frequency/wavenumber) of dotted lines correspond to wave phase speeds, so eastward 241
(westward) propagating disturbances compose the positive (negative) wavenumber spectrum. 242
There is a prominent lobe in the eastward direction with a phase speed of about 14 m/s, which 243
corresponds to the equivalent depth of 20 m, in the TRMM spectrum in Fig. 6a. This is mostly 244
contributed by the Kelvin waves and the eastward IG waves. In the westward direction with 245
negative zonal wavenumbers, the preferred speed depends on the wavenumber and frequency. In 246
the low-frequency range with periods longer than 7 days, the preferred westward phase speed is 247
slowest and corresponds to the equatorial Rossby wave dispersion curve. As the frequency 248
becomes higher, the preferred phase speed increases. At the higher-frequencies with periods 249
shorter than 3 days, the prominent lobe follows along a phase speed of -18 m/s mainly due to 250
westward IG waves. The phase speed of the westward IG wave mode is slightly faster than the 251
value of the eastward IG wave mode. The Doppler shift by the westward zonal wind in the 252
tropical troposphere is considered to be the cause of the directional difference in the preferred 253
phase speeds. The intensified spectrum at the frequency of 1 CPD is due to the diurnal cycle. 254
Low-frequency large-scale waves including Kelvin, MRG, and Rossby waves can be better 255
illustrated in spectra of the symmetric and anti-symmetric components in Figs. 7 and 8. The 256
symmetric and anti-symmetric spectra of TRMM observations show enhanced power following 257
theoretical dispersion curves of the equatorial shallow water equations with the equivalent depth 258
of 20 m. Kelvin waves are prominent in the symmetric spectrum in Fig. 7a, MRG waves have a 259

13
signal in the anti-symmetric spectrum in Fig. 8a, and Rossby waves are evident in the both 260
spectra. As Tulich et al. (2011) have shown, observed Rossby waves in the westward spectrum 261
are faster than the theoretical dispersion relation due to background easterlies. 262
The spectrum of each reanalysis in Figs. 6-9 reveals its own characteristics and drawbacks. 263
As observed in the longitude-time sections in Figs. 4b and 4c, spectra of ERA and MERRA are 264
also similar in Figs. 6b and 6c with weaker spectral densities compared to TRMM (see also 265
frequency characteristics of power spectra in Fig. 9). At lower frequencies shown in Figs. 7b, 7c, 266
8b, and 8c, preferred phase speeds of Kelvin, MRG, and Rossby waves are the same as TRMM. 267
This suggests that the low-frequency large-scale CCEWs are well represented in ERA and 268
MERRA. However, they are lacking in wave signals at frequencies higher than 1 CPD. 269
NCEP1 and NCEP2 have spectra only up to 2 CPD due to the limitation of the time 270
resolution. The striking feature of NCEP1 is the very strong diurnal cycle (Figs. 6d, 9d, and 11). 271
Janowiak et al. (1998) reported the overly vigorous diurnal cycle in NCEP1 precipitation by 272
comparing with the Global Precipitation Climatology Project (GPCP), which is a product that 273
combines rain gauge and satellite-derived precipitation. As a complement to this, our spectral 274
analysis has found that the non-migrating diurnal signal near zero wavenumber is especially high, 275
and the migrating diurnal signals are also significant (see Fig. 6d). The diurnal cycle is so strong 276
that it affects the spectral shape making it difficult to see whether any preferred phase speeds 277
exist in NCEP1. The spectral shapes at low frequencies in Figs. 7d and 8d show weak CCEW 278
signals compared to all other datasets. The spectra of NCEP2 in Figs. 6-8e has strong westward 279
signals at all frequencies less than 1 CPD and with a consistent phase speed between -5 m/s and -280
10 m/s. The different preferred phase speeds in the different wavenumbers and frequencies 281
indicate the properties of dominant wave modes. In the westward direction in NCEP2, it is 282

14
ambiguous to differentiate the Rossby and IG wave modes since the preferred phase speeds in 283
Figs. 6-8e look the same for these wave modes. Considering the phase speeds of 5-10 m/s in the 284
westward direction, NCEP2 appears to have overly strong TD-type waves, resulting in weak 285
signals on other westward waves. Moreover, MRG waves lack in the anti-symmetric spectrum in 286
Fig. 8e. In the positive wavenumber space in Figs. 6-7e, the Kelvin and eastward IG waves are 287
very weak with slower phase speeds than in TRMM. 288
The spectra of CFSR in Figs. 6-9f reveals that CFSR has improved skill in producing tropical 289
precipitation in terms of the large-scale waves and diurnal variations. Although CFSR is still 290
lacking in wave signals at frequencies higher than 1CPD, the unrealistic strong westward signal 291
in the low-frequency wave modes seen in NCEP2 has in CFSR become closer to the TRMM 292
spectrum. The weak diurnal peaks in NCEP2 are also enhanced in CFSR to very reasonable 293
values. 294
More quantitative comparison of diurnal variation is depicted in Fig. 9, which shows the 295
spectrum integrated over all wavenumbers at a given frequency. In ERA and MERRA, the 296
diurnal peaks relative to the background spectra are overestimated compared to TRMM. The 297
extremely exaggerated diurnal signal in NCEP1 is reduced in NCEP2 with the relative peak 298
value less than TRMM. NCEP2 has the weakest relative diurnal peak intensity. The relative 299
diurnal peak intensity in CFSR has a value closest to the TRMM result. 300
The ratio of the westward to the eastward power spectrum in Fig. 10 shows the frequency 301
dependence of eastward and westward wave activity. Except at periods longer than 25 days 302
affected by the MJO, westward disturbances in TRMM are larger than eastward disturbances. At 303
frequencies lower than 1/3 CPD, all reanalyses overestimate the westward component, 304

15
suggesting strong low-frequency easterly wave activity in reanalyses. This large ratio is also 305
partly due to the underrepresentation of Kelvin waves in NCEP1, NCEP2, and CFSR as 306
indicated by the symmetric spectra in Fig. 7. Tulich et al. (2012) have concluded that vertical 307
zonal wind shear at low levels, not just the mean flow, is crucial to the direction of convective 308
wave propagation, suggesting the westward bias at lower frequencies in models might be 309
strongly influenced by the unrealistic background shear. At higher frequencies over 0.7 CPD, 310
however, most reanalyses have weaker westward variance, indicating significant model 311
deficiencies in generating high-frequency westward IG waves. 312
The directional scale-dependent propagation information in precipitation can be gained by 313
integrating spectra within desired spectral bands (Fig. 11). Here, we divided the wavenumber-314
frequency spectrum into five categories: 315
quasi-stationary [eastward and westward with period > 30 days], 316
westward_high [westward with frequency > 1/3 CPD (period < 3 days)], 317
westward_low [westward with frequency < 1/3 CPD (period > 3 days)], 318
eastward_high [eastward with frequency > 1/3 CPD (period < 3 days)], and 319
eastward_low [eastward with frequency < 1/3 CPD (period > 3 days)]. 320
321
The gray color represents the percentage of disturbances with periods longer than the 322
monthly scale. Thus, the MJO and the slowly moving Rossby wave signals with periods longer 323
than 30 days will be in this quasi-stationary category in our study. To the left of the gray color 324
are the westward percentages and to the right are the eastward portions. We distinguished the 325
high frequency from the low frequency with respect to 1/3 CPD (period of 3 days) so that the 326
Kelvin, Rossby, MRG, and TD-type waves are included in the low-frequency category. The 327

16
contribution of IG waves and the diurnal cycle is included in the high-frequency category. The 328
number in the parenthesis is the percentage of the harmonics of the diurnal cycle, at the 329
frequencies of 1, 2, 3, and 4 CPD, relative to the total variance. 330
Generally, reanalysis spectra are “redder” than TRMM. This means the spectral densities are 331
more concentrated in the low wavenumbers and low frequencies. The overly red spectra can be 332
interpreted that individual convection events are more persistent in physical space, as discussed 333
in the studies of Ricciardulli and Sardeshmukh (2002) and Tulich et al. (2011) showing higher 334
autocorrelation values from an over-reddened spectrum. In Fig. 11 MERRA has the most 335
persistent tropical precipitation. About 27 % of the total variance in MERRA is contributed by 336
disturbances at scales longer than 30 days, while only 8 % of the variance from TRMM 337
observations is from this quasi-stationary scale. Due to the persistent rainfall in MERRA, the 338
high-frequency variance seems to be sacrificed: total eastward and westward high-frequency 339
variance is only 29 %, which is much lower than the TRMM percentage of 61 %. The choice of 340
the convective parameterization is known to mainly control the mean and variability of 341
precipitation as well as the existence of CCEWs in model simulations. Ruane and Roads (2007) 342
pointed out that the relaxed Arakawa-Schubert scheme tends to have a lack of high-frequency 343
variability in spite of its better performance in interannual variability. Here, we have found the 344
same conclusion for the relaxed Arakawa-Schubert scheme, which has been used in the MERRA 345
GEOS v.5.2.0 assimilation system. ERA shows a better spectral distribution than MERRA, but 346
the low-frequency disturbances are still overestimated. About 30 % of the high-frequency 347
spectrum is contributed by the diurnal cycle in NCEP1. NCEP2 and CFSR have the most 348
reasonable fraction of precipitation variance at the quasi-stationary scale. CFSR’s variance at 349
high frequencies is the most realistic compared to other reanalyses. 350

17
351
d. Regional and Seasonal Variance 352
Regional distribution of precipitation variance is shown in Fig. 12. The variance is defined by an 353
integral of the inverse FFT of a spectrum. As suggested in the previous sections, variances in 354
ERA, MERRA, and NCEP1 are much smaller than in TRMM. NCEP2 has strong variance along 355
the ITCZ and SPCZ. CFSR has exaggerated variance from the central to eastern Pacific, which is 356
also observed in mean precipitation in Fig. 1f. 357
The ratio of the high-frequency variance (> 1/3 CPD) to the low-frequency variance (< 1/3 358
CPD) in Fig. 13 illustrates regional differences in the frequency characteristics. The white color 359
depicts regions where total integrated variance for the high frequency variance is nearly the same 360
as the low frequency variance. A high ratio with red colors in Fig. 13 shows that precipitation in 361
these areas is more influenced by the high-frequency disturbances. In western Africa, TRMM 362
shows up to four times stronger variance in the high-frequency waves than in the low-frequency 363
waves. The convectively coupled IG waves may be the largest contribution of the high-frequency 364
variance. Generally, over land, the impact of high-frequency precipitation variability is most 365
important: the ratio is relatively high over Africa, America and the Maritime Continent (Fig. 13a). 366
Although the ratio along the ITCZ is low compared to the ratio over land, high-frequency 367
variability is still important in the ITCZ areas. 368
As discussed in the previous section, the high-frequency variability in ERA and MERRA is 369
much weaker than in TRMM. The weakness of these high-frequency variances in ERA and 370
MERRA is a problem over all tropical regions in Fig. 13b and 13c. The lowest value of the mean 371
ratio (See numbers in Fig. 13) in MERRA indicates that MERRA has the most persistent tropical 372

18
precipitation. The ratios over Africa in all reanalyses, except in CFSR, are significantly lower 373
than the ratio in TRMM. It appears that NCEP1 shows a good regional correlation of the 374
variance ratio with TRMM, but this is because of the strong diurnal cycle in NCEP1 (Fig. 14). In 375
other words, the patterns of the ratios from TRMM and NCEP1 look similar in Fig. 13 for a 376
different reason. Fig. 14 indicates the location of the exaggerated diurnal cycle in each reanalysis. 377
Compared with TRMM, the regional correlation of the diurnal cycle is most reasonable in CFSR, 378
while NCEP2 has weaker variation. 379
To investigate seasonality of CCEW activity in different wave modes for each tropical region, 380
we divided the tropics into seven regions: Africa, the Indian Ocean, the Maritime Continent, the 381
western Pacific, the eastern Pacific, America, and the Atlantic Ocean. We will mainly discuss 382
seasonal changes in regional precipitation variability from TRMM observations, shown in Fig. 383
15. Here, we have used the same five categories (quasi-stationary: green, westward_high: dark 384
blue, westward_low: light blue, eastward_high: red, and eastward_low: orange) distinguished by 385
the frequency and the propagation direction as used in Fig. 11. 386
In TRMM observations, some regions such as Africa, the western and eastern Pacific, and 387
America have obvious seasonal variations. Fig. 15 reveals that westward_high variance is much 388
more significant than variances from other wave modes over all seasons in Africa. 389
Westward_high variance is suppressed during the dry season around December-January-390
February, and it gets higher for March-April. Then it is suppressed again around June-July. In 391
August westward_high variance shows the most enhanced activity. Since TD-type waves have 392
predominant periods of 3-6 days and IG waves have periods shorter than 3 days, we infer that the 393
strongly enhanced westward_high variance in August corresponds to strong westward IG wave 394
activity influenced by African easterly jet. Tulich et al. (2012) have shown that the composite 395

19
evolution of TRMM rainfall associated with African mesoscale squall lines is perfectly aligned 396
with filtered anomalies of the westward IG wave band with the phase speed of -18 m/s. His result 397
further supports the idea that African precipitation is greatly affected by westward IG waves. 398
In TRMM in Fig. 15, America and the Atlantic Ocean have different phases of seasonality 399
from Africa, although some of westward waves in these regions originated in western Africa. It 400
seems that the variance in the Maritime Continent is mainly characterized by the MJO, because 401
the variances of all wave modes generally go with the quasi-stationary variance. It is well known 402
that smaller-scale convective clusters are generated within the active phase of the MJO (Zhang 403
2005). Thus we expect that strong MJO convective activity results in strong synoptic to 404
mesoscale convective precipitation. 405
Westward variance dominates the seasonal changes in the western and eastern Pacific Ocean 406
in Fig. 15. The contributions of the eastward and westward disturbances are almost the same 407
during the northern winter, but the westward disturbances of the northern summertime become 408
nearly double the wintertime values. There is a phase difference of precipitation seasonality 409
between the eastern and western Pacific Oceans. The strong westward signal remains until 410
December in the western Pacific Ocean, but it gradually weakens as the season changes in the 411
eastern Pacific Ocean. The dominance of westward_high variance in the Pacific Ocean implies 412
that convection in northern summer is largely influenced by westward IG waves. In contrast to 413
westward variances, eastward variances do not have strong seasonal variations in the Pacific 414
regions like in Africa. 415
Since westward_high variance dominates the seasonal variation, we further investigate 416
representation of westward_high variability in reanalyses. We find that seasonal enhancement of 417
20
westward_high variance in different regions in reanalyses generally match the TRMM results. 418
However, in the western Pacific, reanalyses do not reproduce the TRMM annual cycle. It seems 419
that the mechanisms for generation and maintenance of westward_high disturbances in the 420
western Pacific may be different from other regions, and that reanalyses do not represent these. 421
Further studies would be needed. 422
423
5. Summary and Conclusions 424
425
Using the space-time spectral analysis method, we evaluated submonthly scale variability and 426
CCEW activity of tropical precipitation in five reanalyses. Three-hourly TRMM observations 427
were used as a validation reference to compare reanalysis datasets (3-hourly for ERA, MERRA, 428
and CFSR; 6-hourly for NCEP1 and NCEP2). Besides the common bias among reanalyses, 429
which all show excessive tropical rainfall, the wavenumber-frequency spectrum reveals 430
deficiencies in resolving CCEWs and high-frequency variability. The mean precipitation values 431
and patterns in ERA and MERRA are very similar except in western Africa, and it appears that 432
their regional distributions are close to the distribution in TRMM if the bias is subtracted. The 433
mean of NCEP1 shows weaker rainfall along the ITCZ and more rainfall outside the ITCZ 434
compared to the TRMM patterns. NCEP2 has the largest amount of total precipitation with 435
intense rain along the ITCZ. CFSR produced strong precipitation along the eastern Pacific ITCZ. 436
The low-frequency CCEWs are relatively well represented in ERA, MERRA, and CFSR, 437
although they have a bias toward the westward direction. The pronounced wave dispersion 438
curves in the spectra of these reanalyses correspond to the TRMM results in the modes of Rossby, 439
21
MRG, and Kelvin waves. At higher frequencies, however, all the reanalyses have no clear 440
prominent lobes in the spectra, inferring no wave signals. The high-frequency variability in the 441
reanalyses except in CFSR is weaker than in TRMM. Although there is no apparent signal of the 442
convectively coupled IG waves in CFSR, the fraction of high-frequency variance is comparable 443
to TRMM. 444
CFSR includes many changes since the NCEP2 reanalysis. These include the use of the 445
atmosphere-ocean-land surface-sea ice coupled model with fine horizontal and vertical 446
resolutions, the assimilation of satellite radiances rather than retrievals, and the direct forcing of 447
land hydrology analysis with observed precipitation (Saha et al. 2010). In contrast to CFSR, 448
model-generated precipitation is used for the land forcing in other reanalyses, or pentad 449
precipitation observations are used to nudge soil moisture in NCEP2 (Kanamitsu et al. 2002; 450
Saha et al. 2010). The improvements in precipitation variability in CFSR are likely related to the 451
use of the coupled model with fine resolutions. In addition, improvements of the high-frequency 452
variability and diurnal cycle especially over land suggest that the land surface model changes 453
contribute to the better performance of CFSR. The assimilation of observed precipitation from 454
the daily Climate Prediction Center (CPC) gauge data and pentad CPC merged Analysis of 455
Precipitation (CMAP) datasets seems to have helped the land model performance to become 456
more realistic, and subsequently improved the precipitation product. (Note that the precipitation 457
product in CFSR is still model-derived (Wang et al. 2010b).) 458
Among five reanalyses, MERRA has the most persistent weak rainfall and very “red” 459
spectrum. Although MERRA’s representation of precipitation climatology has been improved 460
compared to ERA and CFSR (Rienecker et al. 2011), the use of the relaxed Arakawa-Schubert 461
scheme in the GEOS v.5.2.0 model for MERRA seems to result in significant lack of higher-462

22
frequency variability. Ruane and Roads (2007) have found that the NCEP seasonal forecast 463
model (SFM) reanalysis, which employs the relaxed Arakawa-Schubert convective 464
parameterization, is also strongly biased toward low-frequency precipitation variability. Indeed, 465
it is a general problem that climate and weather prediction models produce overly persistent light 466
rain, resulting in an over-reddened spectrum (Lin et al. 2006; Ruane and Roads 2007). A more 467
realistic persistence of equatorial precipitation may be achieved by improving subgrid-scale 468
model physics. In nature, convective and mesoscale downdrafts that occur with deep convective 469
updrafts dry the boundary layer and the lower troposphere (Brown and Zhang 1997; Houze and 470
Betts 1981; Lin et al. 2006). In consequence, the development and evolution of subsequent 471
convective events are suppressed. The insufficient representation of this self-suppression 472
mechanism in convective processes is considered one of the primary reasons for the persistent 473
weak tropical rainfall with low variance. Lin et al. (2008) have shown that the use of a stronger 474
convective trigger function also improves tropical precipitation variance. The low criterion for 475
triggering convection entails the initiation of convection easily and generates the drizzling type 476
of precipitation, which in turn contributes to the small variance and over-reddened spectrum. 477
In addition to the enhancement of the tropical precipitation variance, properly generating 478
spectral peaks associated with CCEWs is also important to simulate the tropical climate. Recent 479
studies have revealed that half of the analyzed GCMs have CCEW signals in the low-frequency 480
spectra but the GCM spectra show faster phase speeds than the observed value (Lin et al. 2006). 481
They concluded that effective static stability is not lowered enough by the diabatic heat released 482
by convection in current GCMs. In ERA, MERRA, and CFSR, the phase speeds of low-483
frequency waves including Rossby, MRG, and Kelvin waves are very close to the speeds 484
observed in TRMM measurements, but not for the high-frequency waves. It seems that ERA, 485

23
MERRA, and CFSR can reproduce a realistic signal in low-frequency precipitation with the help 486
of data assimilation of the observed state variables. Although precipitation in reanalyses is a 487
model product, the assimilated control variables such as atmospheric temperature, wind, and 488
humidity constrain the model to generate more realistic precipitation than the GCMs, which 489
entirely depend on the model. At the higher frequencies, precipitation would depend more on the 490
model than on observations due to lack of observations. Hence, the deficiency of high-frequency 491
variability and wave signals in reanalyses may be improved by finer-scale observations and 492
improvements in model physics. To properly resolve CCEWs in models, the rainfall type and its 493
resultant vertical heating profile should be properly represented. Studies have shown that climate 494
models underestimate the stratiform-type “top-heavy heating profile”, indicating condensational 495
heating above and evaporative cooling below the melting level (Kiladis et al. 2009; Lin et al. 496
2004). Misrepresentation of vertical heating profiles would result in inaccurate wave responses, 497
and triggered convection would not be realistic (Ryu et al. 2011). 498
It is worth of noting that NCEP2 uses a slightly modified version of the simplified Arakawa-499
Schubert convective parameterization scheme by Pan and Wu (1994) based on Grell (1993) used 500
in NCEP1, but NCEP2 and NCEP1 precipitation differs in many aspects. NCEP2 has enhanced 501
variability and CCEW signals compared to NCEP1, but the phase speeds do not match TRMM 502
presumably due to excessively strong TD-type wave activity in NCEP2. This suggests that the 503
new approach in NCEP2 over NCEP1 is encouraging with respect to resolving equatorial waves 504
and variability, but the model physics still needed to be improved. Unambiguous reasons for the 505
differences in these two reanalyses are not well understood, but it seems that the convective 506
parameterization is not the only important process for correct representation of CCEWs. There 507
have been many attempts to investigate the reasons for lack of CCEWs and precipitation 508

24
variability in climate models (Frierson et al. 2011; Lin et al. 2008; Lin et al. 2006; Straub et al. 509
2010; Suzuki et al. 2006). Most studies have concluded that the convective parameterization 510
scheme is the most important factor that determines the existence of CCEW signals in GCMs. 511
Our findings suggest that, along with the convective parameterization scheme, the choice for 512
other model physics such as cloud processes, moist processes in the boundary layer, and the 513
radiation scheme may also play important roles in CCEW activity. 514
Our understanding and forecasting skill for tropical precipitation processes have been greatly 515
improved due to global observations, advanced models, and growing computer power. This 516
study confirms that the latest reanalyses such as ERA-interim, MERRA, and CFSR have much 517
improved performance in resolving low-frequency CCEWs and precipitation variability over 518
NCEP1 or NCEP2. However, the improved performance in variability are not necessarily 519
accompany with improvements in other skills: CCEW activity and variability are much enhanced 520
in NCEP2 over NCEP1, but the phase speeds are spurious; CFSR shows the best performance in 521
representing diurnal cycle and high-frequency variability, but regional precipitation in the central 522
to eastern Pacific ITCZ is overestimated compared to the western Pacific. Furthermore, the new 523
reanalyses are still very different from observations with respect to variability and CCEW 524
characteristics at high frequencies, meaning deficiencies in short-range forecasts. Since much of 525
tropical precipitation is affected by waves, high-frequency waves should be better represented to 526
produce accurate short-range forecasts. It is hard to determine the relative importance of each 527
factor that interacts with convection in numerical simulations, but we hope that our findings may 528
give useful insights toward understanding the tropical precipitation system and toward improving 529
model physics. Generating realistic precipitation variability especially at high frequencies in 530

25
global climate models will also indirectly benefit climate prediction by exciting waves that 531
influence feedbacks with the stratosphere. 532
533
ACKNOWLEDGEMENTS 534
535
We would like to thank George Kiladis for his detailed and helpful comments on the draft. We 536
also thank Julio Bacmeister for his suggestion on the PDF comparison. Comments by two 537
anonymous reviewers greatly helped to improve the manuscript. This work was supported by 538
NASA Ames Research Center contract #NNA10DF70C as part of the Airborne Tropical 539
TRopopause Experiment (ATTREX) under the NASA Science Mission Directorate Earth 540
Venture Program. 541
542
543
544
545
546
547
548
549

26
REFERENCES 550
551
Alexander, M., and J. Holton, 1997: A model study of zonal forcing in the equatorial 552
stratosphere by convectively induced gravity waves. J. Atmos. Sci., 54, 408-419. 553
——, 2004: On the spectrum of vertically propagating gravity waves generated by a transient 554
heat source. Atmos. Chem. Phys., 4, 923-932. 555
Baldwin, M., and Coauthors, 2001: The quasi-biennial oscillation. Rev. Geophys., 39, 179-229. 556
Betts, A., M. Zhao, P. Dirmeyer, and A. Beljaars, 2006: Comparison of ERA40 and NCEP/DOE 557
near-surface data sets with other ISLSCP-II data sets. J. Geophys. Res., 111, D22S04, 558
doi:10.1029/2006JD007174. 559
Bosilovich, M., J. Chen, F. Robertson, and R. Adler, 2008: Evaluation of global precipitation in 560
reanalyses. J. Appl. Meteor. Climatol., 47, 2279-2299. 561
Brown, R., and C. Zhang, 1997: Variability of midtropospheric moisture and its effect on cloud-562
top height distribution during TOGA COARE. J. Atmos. Sci., 54, 2760-2774. 563
Cho, H., K. Bowman, and G. North, 2004: Equatorial waves including the Madden-Julian 564
oscillation in TRMM rainfall and OLR data. J. of Climate, 17, 4387-4406. 565
Dee, D., and Coauthors, 2011: The ERA-Interim reanalysis: configuration and performance of 566
the data assimilation system. Quart. J. Roy. Meteor. Soc., 137, 553-597. 567
Dickinson, M., and J. Molinari, 2002: Mixed Rossby-gravity waves and western Pacific tropical 568
cyclogenesis. Part I: Synoptic evolution. J. Atmos. Sci., 59, 2183-2196. 569

27
Forster, P., and K. Shine, 2002: Assessing the climate impact of trends in stratospheric water 570
vapor. Geophys. Res. Lett., 29, 1086, doi:10.1029/2001GL013909. 571
Frank, W., and P. Roundy, 2006: The role of tropical waves in tropical cyclogenesis. Mon. Wea. 572
Rev., 134, 2397-2417. 573
Frierson, D., D. Kim, I. Kang, M. Lee, and J. Lin, 2011: Structure of AGCM-Simulated 574
Convectively Coupled Kelvin Waves and Sensitivity to Convective Parameterization. J. 575
Atmos. Sci., 68, 26-45. 576
Hegglin, M., and T. Shepherd, 2009: Large climate-induced changes in ultraviolet index and 577
stratosphere-to-troposphere ozone flux. Nat. Geosci., 2, 687-691. 578
Hendon, H., and M. Wheeler, 2008: Some space-time spectral analyses of tropical convection 579
and planetary-scale waves. J. Atmos. Sci., 65, 2936-2948. 580
Holton, J., 1972: Waves in equatorial stratosphere generated by tropospheric heat sources. J. 581
Atmos. Sci., 29, 368-375. 582
Houze, R., and A. Betts, 1981: Covection in GATE. Rev. Geophys., 19, 541-576. 583
Huffman, G., and Coauthors, 2007: The TRMM multisatellite precipitation analysis (TMPA): 584
Quasi-global, multiyear, combined-sensor precipitation estimates at fine scales. J. 585
Hydrometeor., 8, 38-55. 586
Janowiak, J., A. Gruber, C. Kondragunta, R. Livezey, and G. Huffman, 1998: A comparison of 587
the NCEP-NCAR reanalysis precipitation and the GPCP rain gauge-satellite combined 588
dataset with observational error considerations. J. Climate, 11, 2960-2979. 589

28
Janowiak, J., P. Bauer, W. Wang, P. Arkin, and J. Gottschalck, 2010: An Evaluation of 590
Precipitation Forecasts from Operational Models and Reanalyses Including Precipitation 591
Variations Associated with MJO Activity. Mon. Wea. Rev., 138, 4542-4560. 592
Kalnay, E., and Coauthors, 1996: The NCEP/NCAR 40-year reanalysis project. Bull. Amer. 593
Meteor. Soc., 77, 437-471. 594
Kanamitsu, M., W. Ebisuzaki, J. Woollen, S. Yang, J. Hnilo, M. Fiorino, and G. Potter, 2002: 595
NCEP-DOE AMIP-II reanalysis (R-2). Bull. Amer. Meteor. Soc., 83, 1631-1643. 596
Kawatani, Y., K. Sato, T. Dunkerton, S. Watanabe, S. Miyahara, and M. Takahashi, 2010: The 597
Roles of Equatorial Trapped Waves and Internal Inertia-Gravity Waves in Driving the 598
Quasi-Biennial Oscillation. Part I: Zonal Mean Wave Forcing. J. Atmos. Sci., 67, 963-980. 599
Kiladis, G., C. Thorncroft, and N. Hall, 2006: Three-dimensional structure and dynamics of 600
African easterly waves. Part I: Observations. J. Atmos. Sci., 63, 2212-2230. 601
Kiladis, G., M. Wheeler, P. Haertel, K. Straub, and P. Roundy, 2009: Convectively coupled 602
equatorial waves. Rev. Geophys., 47, RG2003, doi:10.1029/2008RG000266. 603
Lin, J., B. Mapes, M. Zhang, and M. Newman, 2004: Stratiform precipitation, vertical heating 604
profiles, and the Madden-Julian oscillation. J. Atmos. Sci., 61, 296-309. 605
Lin, J., M. Lee, D. Kim, I. Kang, and D. Frierson, 2008: The impacts of convective 606
parameterization and moisture triggering on AGCM-simulated convectively coupled 607
equatorial waves. J. Climate, 21, 883-909. 608
Lin, J. L., and Coauthors, 2006: Tropical intraseasonal variability in 14 IPCC AR4 climate 609
models. Part I: Convective signals. J. Climate, 19, 2665-2690. 610

29
Lindzen, R., and J. Holton, 1968: A theory of quasi-biennial oscillation. J. Atmos. Sci., 25, 1095-611
1107. 612
Matsuno, T., 1966: Quasi-Geostrophic Motions in the Equatorial Area. J. Meteor. Soc. Japan, 44, 613
25-42. 614
Ricciardulli, L., and P. D. Sardeshmukh, 2002: Local time- and space scales of organized 615
tropical deep convection. J. Climate, 15, 2775-2789 616
Rienecker, M., and Coauthors, 2011: MERRA: NASA's Modern-Era Retrospective Analysis for 617
Research and Applications. J. Climate, 24, 3624-3648. 618
Roads, J., 2003: The NCEP-NCAR, NCEP-DOE, and TRMM tropical atmosphere hydrologic 619
cycles. J. Hydrometeor., 4, 826-840. 620
Ruane, A., and J. Roads, 2007: 6-hour to 1-year variance of five global precipitation sets. Earth 621
Interactions, 11(11), 1-29. 622
Ryu, J.-H., M. J. Alexander, and D. A. Ortland, 2011: Equatorial waves in the upper troposphere 623
and lower stratosphere forced by latent heating estimated from TRMM rain rates. J. 624
Atmos. Sci., 68, 2321-2342. 625
Saha, S., and Coauthors, 2010: The NCEP climate forecast system reanalysis. Bull. Amer. 626
Meteor. Soc., 91, 1015-1057. 627
Solomon, S., K. Rosenlof, R. Portmann, J. Daniel, S. Davis, T. Sanford, and G. Plattner, 2010: 628
Contributions of stratospheric water vapor to decadal changes in the rate of global 629
warming. Science, 327, 1219-1223. 630

30
Straub, K., P. Haertel, and G. Kiladis, 2010: An analysis of convectively coupled Kelvin waves 631
in 20 WCRP CMIP3 global coupled climate models. J. Climate, 23, 3031-3056. 632
Suzuki, T., Y. Takayabu, and S. Emori, 2006: Coupling mechanisms between equatorial waves 633
and cumulus convection in an AGCM. Dyn. Atmos. Oceans, 42, 81-106. 634
Takayabu, Y. N., and T. Nitta, 1993: 3-5 day-period disturbances coupled with convection over 635
the tropical Pacific Ocean. J. Meteorol. Soc. Jpn., 71, 221-246. 636
Tulich, S. N., G. N. Kiladis, and A. Suzuki-Parker, 2011: Convectively coupled Kelvin and 637
easterly waves in a regional climate simulation of the tropics. Clim. Dyn., 36, 185-203. 638
Tulich, S. N., and G. N. Kiladis, 2012: Squall lines and convectively coupled gravity waves in 639
the tropics: Why do most cloud systems propagate westward? J. Atmos. Sci., 640
doi:10.1175/JAS-D-11-0297.1, in press.Wallace, J., and V. Kousky, 1968: Observational 641
evidence of Kelvin waves in tropical stratosphere. J. Atmos. Sci., 25, 900-907. 642
Wang, J., W. Wang, X Fu, and K.-H. Seo, 2010: Tropical intraseasonal rainfall variability in the 643
CFSR. Clim. Dyn., doi:10.1007/s00382-011-1087-0. 644
Wang, W., P. Xie, S.-H. Yoo, Y. Xue, A. Kumar, X. Wu, 2010: An assessment of the surface 645
climate in the NCEP climate forecast system reanalysis. Clim. Dyn., doi:10.1007/s00382-646
010-0935-7 647
Wheeler, M., and G. Kiladis, 1999: Convectively coupled equatorial waves: Analysis of clouds 648
and temperature in the wavenumber-frequency domain. J. Atmos. Sci., 56, 374-399. 649
Yanai, M., and T. Maruyama, 1966: Stratospheric wave disturbances propagating over the 650
equatorial Pacific. J. Meteorol. Soc. Jpn., 44, 291-294. 651

31
Zhang, C., 2005: Madden-Julian oscillation. Rev. Geophys., 43, RG2003, 652
doi:10.1029/2004RG000158. 653
654
655
656
657
658
659
660
661
662
663
664
665
666
667
668
669

32
TABLES 670
671
TABLE 1. Information of five reanalyses analyzed in this study. 672
Model Resolution
Available Data Resolution
Model Convective Parameterization
Reference
ERA (interim)
T255(~79 km), L60
1.5o X 1.5
3-hourly
ECMWF Cy31r2 Tiedtke (1989) and revised by Gregory et al. (2000)
Dee et al. (2011)
MERRA 1/2o X 2/3o ,
L72 1/2o X 2/3o 1-hourly
Goddard Earth Observing System(GEOS v.5.2.0) atmospheric model and data assimilation system (DAS)
Modified version of the relaxed Arakawa– Schubert convective scheme described by Moorthi and Suarez (1992)
Rienecker et al. (2011)
NCEP1 (NCAR)
T62(~210 km), L28
1.875o X ~1.905o 6-hourly
NCEP Climate Data Assimilation System (CDAS) Simplified Arakawa-Schubert convective parameterization scheme developed by Pan and Wu (1994) based on Grell (1993)
Kalnay et al. (1996)
NCEP2 (DOE)
T62(~210 km), L28
1.875o X ~1.905o
6-hourly
NCEP Climate Data Assimilation System (CDAS) Minor tuning of the same convective parameterization as in NCEP1
Kanamitsu et al. (2002)
CFSR T382(~38 km), L64
0.313o X ~0.312o 1.875o X ~1.905o
1-hourly
6-hourly
Atmosphere (GFS) – ocean (MOM4, Noah) coupled model [GSI (atmosphere), GODAS with MOM4 (ocean and sea ice), and GLDAS and Noah model (land) were used for analyses.]
Simplified Arakawa-Schubert convection with momentum mixing
Saha et al. (2010)
673
674
675
676
677
678
679
680

33
FIGURE CAPTIONS 681
682
FIG. 1. Tropical mean precipitation (mm/hr) in 2005-2007 for (a) TRMM, (b) ERA, (c) MERRA, 683
(d) NCEP1, (e) NCEP2, and (f) CFSR. 684
FIG. 2. Averaged precipitation over the latitude of 15S-15N. Longitude ranges that are mostly 685
land with more than 70% of the total are marked with the black bars in the longitude axis. 686
The dots in the longitude axis represent land-ocean mixed regions, with 30%-70% land. 687
FIG. 3. Time series of monthly zonal mean precipitation (mm/hr). 688
FIG. 4. Longitude-time section of precipitation (mm/hr) at the latitude of 5N between June-689
September 2006. Land regions are denoted by black bars in the longitude axis. 690
FIG. 5. The probability density function (PDF) of precipitation between 15S-15N over 2005-691
2007. 692
FIG. 6. Averaged wavenumber-frequency power spectrum of precipitation between 15S-15N 693
over 2005-2007. Phase speed lines of -5, -10, -18, and 14 m/s are plotted with dotted lines. 694
FIG. 7. Averaged symmetric wavenumber-frequency power spectrum of precipitation between 695
15S-15N over 2005-2007. The curves correspond to theoretical dispersion relations of 696
equatorial shallow water equations with the equivalent depth of 20 m. Note that the 697
ranges of wavenumber and frequency are different from Fig. 6. 698
FIG. 8. Similar to Fig. 7, except for the anti-symmetric spectrum 699
FIG. 9. Integrated power spectrum of precipitation over wavenumbers. 700

34
FIG. 10. The ratio of the westward to the eastward power spectrum. 701
FIG. 11. Percentage of the power spectrum categorized into five groups: quasi-stationary 702
[eastward and westward with period > 30 days], westward_high [westward with 703
frequency > 1/3 CPD (period < 3 days)], westward_low [westward with frequency < 1/3 704
CPD (period > 3 days)], eastward_high [eastward with frequency > 1/3 CPD (period < 3 705
days)], and eastward_low [eastward with frequency < 1/3 CPD (period > 3 days)]. The 706
contribution of the diurnal cycle is included in the high-frequency category. The number 707
in the parenthesis is the percentage of the harmonics of the diurnal cycle, at the 708
frequencies of 1, 2, 3, and 4 CPD, relative to the total variance. 709
FIG. 12. Precipitation variance (mm2/hr
2) calculated from an integral of the inverse FFT of a 710
spectrum. 711
FIG. 13. Ratio of the high-frequency (periods < 3 days) variance to the low-frequency (periods > 712
3 days) variance. 713
FIG. 14. Normalized variance of the diurnal cycle and harmonics. 714
FIG. 15. Time series of TRMM regional precipitation variance (mm2/hr
2) categorized according 715
to propagation directions and frequency (westward_high: dark blue, westward_low: light 716
blue, quasi-stationary: green, eastward_low: orange, and eastward_high: red). 717
718
719
720
721
722

35
723
FIGURES 724
725
726
727
728
729
FIG. 1. Tropical mean precipitation (mm/hr) in 2005-2007 for (a) TRMM, (b) ERA, (c) MERRA, 730
(d) NCEP1, (e) NCEP2, and (f) CFSR. 731
732
733
734
735
736
36
737
FIG. 2. Averaged precipitation over the latitude of 15S-15N. Longitude ranges that are mostly 738 land with more than 70% of the total are marked with the black bars in the longitude axis. The 739
dots in the longitude axis represent land-ocean mixed regions, with 30%-70% land. 740
741
742
743
744
745
746
747

37
748
749
750
FIG. 3. Time series of monthly zonal mean precipitation (mm/hr). 751
752

38
753
754
755
756
FIG. 4. Longitude-time section of precipitation (mm/hr) at the latitude of 5N between June-757
September 2006. Land regions are denoted by black bars in the longitude axis. 758
759

39
760
761
FIG. 5. The probability density function (PDF) of precipitation between 15S-15N over 2005-762
2007. 763
764
765
766

40
767
768
769
FIG. 6. Averaged wavenumber-frequency power spectrum of precipitation between 15S-15N 770
over 2005-2007. Phase speed lines of -5, -10, -18, and 14 m/s are plotted with dotted lines. 771
772

41
773
774
775
FIG. 7. Averaged symmetric wavenumber-frequency power spectrum of precipitation between 776 15S-15N over 2005-2007. The curves correspond to theoretical dispersion relations of equatorial 777 shallow water equations with the equivalent depth of 20 m. Note that the ranges of wavenumber 778
and frequency are different from Fig. 6. 779
780
781

42
782
783
784
FIG. 8. Similar to Fig. 7, except for the anti-symmetric spectrum 785
786
787
788
789

43
790
FIG. 9. Integrated power spectrum of precipitation over wavenumbers. 791
792
793
794
795
796
797
798
799
800

44
801
FIG. 10. The ratio of the westward to the eastward power spectrum. 802
803
804
805
806
807
808
809

45
810
FIG. 11. Percentage of the power spectrum categorized into five groups: quasi-stationary 811 [eastward and westward with period > 30 days], westward_high [westward with frequency > 1/3 812
CPD (period < 3 days)], westward_low [westward with frequency < 1/3 CPD (period > 3 days)], 813 eastward_high [eastward with frequency > 1/3 CPD (period < 3 days)], and eastward_low 814
[eastward with frequency < 1/3 CPD (period > 3 days)]. The contribution of the diurnal cycle is 815
included in the high-frequency category. The number in the parenthesis is the percentage of the 816
harmonics of the diurnal cycle, at the frequencies of 1, 2, 3, and 4 CPD, relative to the total 817
variance. 818
819
820
821
822

46
823
824
825
826
FIG. 12. Precipitation variance (mm2/hr
2) calculated from an integral of the inverse FFT of a 827
spectrum. 828
829
830
831
832
833
834
835
836

47
837
838
839
840
FIG. 13. Ratio of the high-frequency (periods < 3 days) variance to the low-frequency (periods > 841
3 days) variance. 842
843
844
845
846
847
848
849
850
851
852

48
853
854
855
856
FIG. 14. Normalized variance of the diurnal cycle and harmonics. 857
858
859
860
861
862
863
864
865

49
866
867
868
869
FIG. 15. Time series of TRMM regional precipitation variance (mm2/hr
2) categorized according 870
to propagation directions and frequency (westward_high: dark blue, westward_low: light blue, 871
quasi-stationary: green, eastward_low: orange, and eastward_high: red). 872