Department of Applied Economics
21
Copyright © 2010 Center for Farm Financial Management, University of Minnesota Department of Applied Economics 800-234-1111 www.cffm.umn.edu
-
Upload
noah-richard -
Category
Documents
-
view
30 -
download
2
description
Department of Applied Economics. 800-234-1111 www.cffm.umn.edu. A comprehensive whole farm financial planning and analysis system. National Farm Financial Management and Benchmarking Program. www.finbin.umn.edu. Data providers: MNSCU Farm Business Management - PowerPoint PPT Presentation
Transcript of Department of Applied Economics
Copyright © 2010 Center for Farm Financial Management, University of Minnesota
Department of Applied Economics
800-234-1111 www.cffm.umn.edu

Copyright © 2010 Center for Farm Financial Management, University of Minnesota
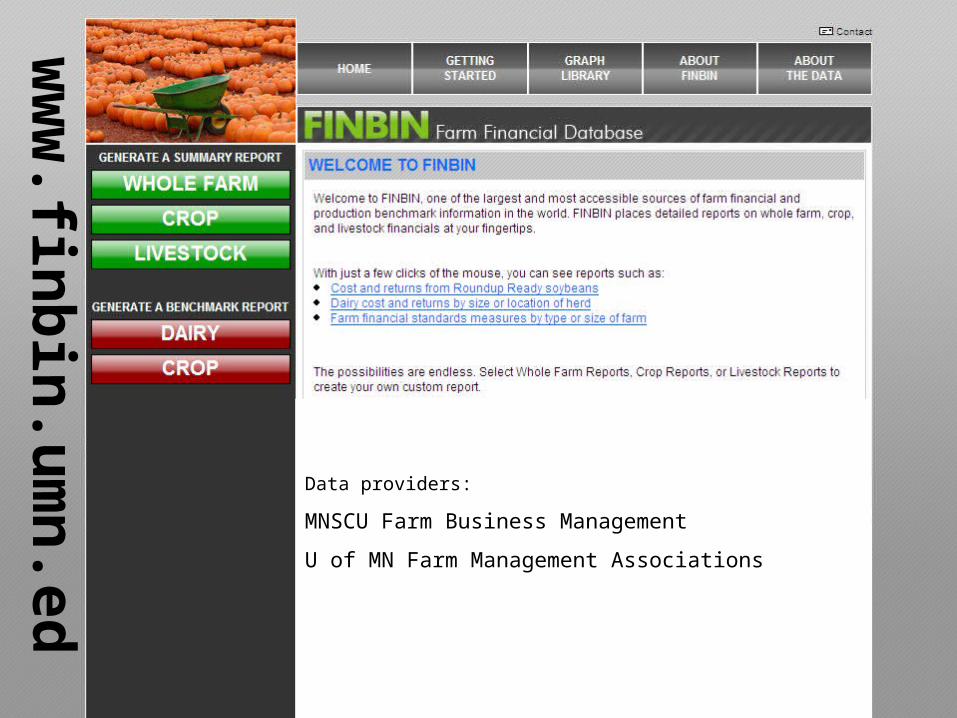
A comprehensive whole farm financial planning and analysis system

Copyright © 2010 Center for Farm Financial Management, University of Minnesota
National Farm Financial National Farm Financial Management and Management and
Benchmarking ProgramBenchmarking Program
Copyright © 2010 Center for Farm Financial Management, University of Minnesota
ww
w.fin
bin
.um
n.ed
u
Data providers:
MNSCU Farm Business Management
U of MN Farm Management Associations

Copyright © 2010 Center for Farm Financial Management, University of Minnesota
FINPACK: Benchmarking at Analysis Time

Copyright © 2010 Center for Farm Financial Management, University of Minnesota
RankEm: Benchmarking for the Local Program
Copyright © 2010 Center for Farm Financial Management, University of Minnesota
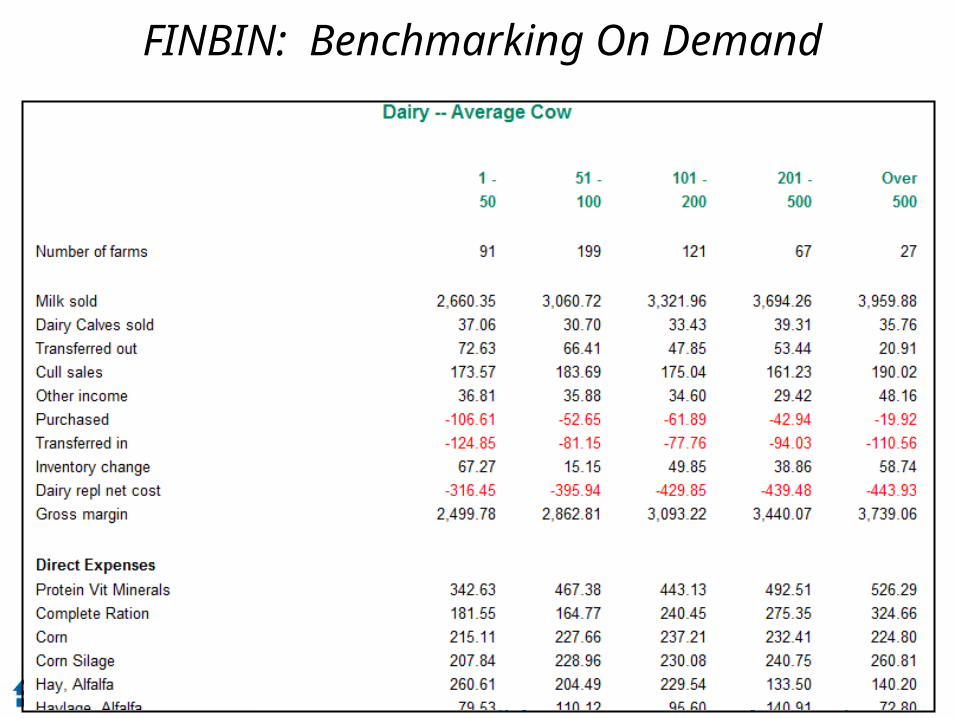
FINBIN: Benchmarking On Demand

Copyright © 2010 Center for Farm Financial Management, University of Minnesota
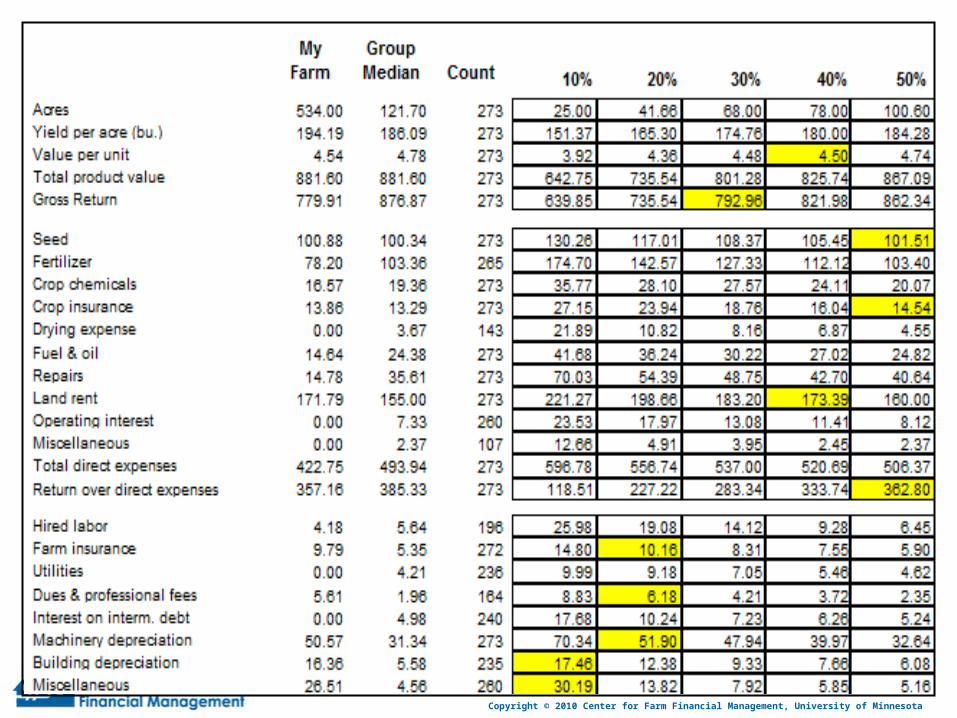
myFINBIN: Benchmarking Against My Peers

Copyright © 2010 Center for Farm Financial Management, University of Minnesota
Copyright © 2010 Center for Farm Financial Management, University of Minnesota
Copyright © 2010 Center for Farm Financial Management, University of Minnesota
Dairy Farm Financial Dairy Farm Financial BenchmarksBenchmarks
Copyright © 2010 Center for Farm Financial Management, University of Minnesota
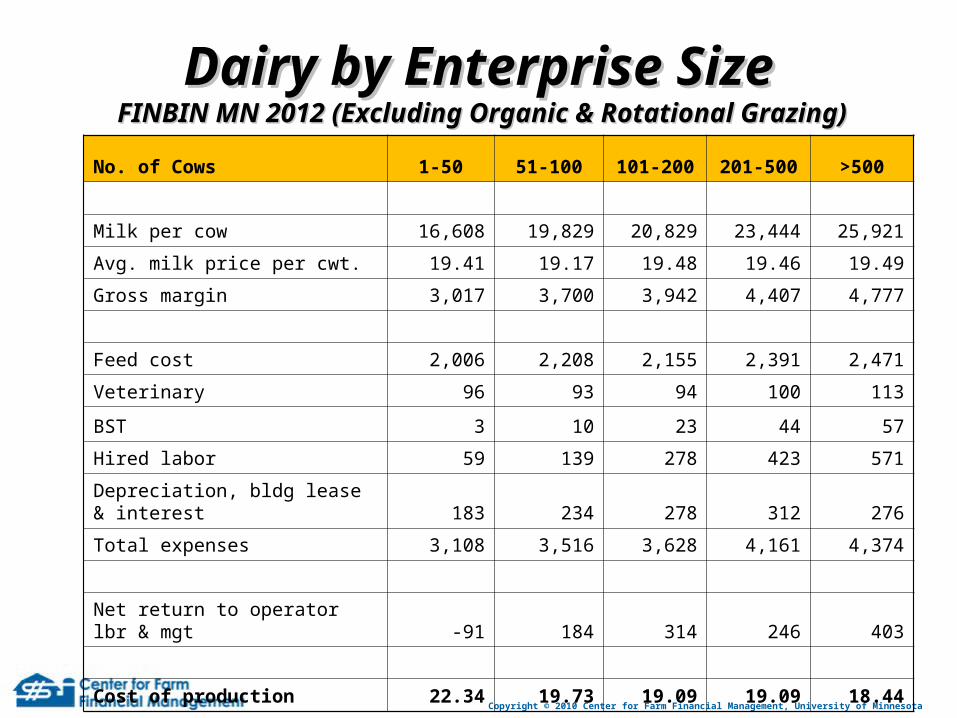
Dairy by Enterprise SizeDairy by Enterprise Size FINBIN MN 2012 (Excluding Organic & Rotational Grazing) FINBIN MN 2012 (Excluding Organic & Rotational Grazing)
No. of Cows 1-50 51-100 101-200 201-500 >500
Milk per cow 16,608 19,829 20,829 23,444 25,921
Avg. milk price per cwt. 19.41 19.17 19.48 19.46 19.49
Gross margin 3,017 3,700 3,942 4,407 4,777
Feed cost 2,006 2,208 2,155 2,391 2,471
Veterinary 96 93 94 100 113
BST 3 10 23 44 57
Hired labor 59 139 278 423 571
Depreciation, bldg lease & interest 183 234 278 312 276
Total expenses 3,108 3,516 3,628 4,161 4,374
Net return to operator lbr & mgt -91 184 314 246 403
Cost of production 22.34 19.73 19.09 19.09 18.44

Copyright © 2010 Center for Farm Financial Management, University of Minnesota
This all takes a lot of time…This all takes a lot of time…
Copyright © 2010 Center for Farm Financial Management, University of Minnesota
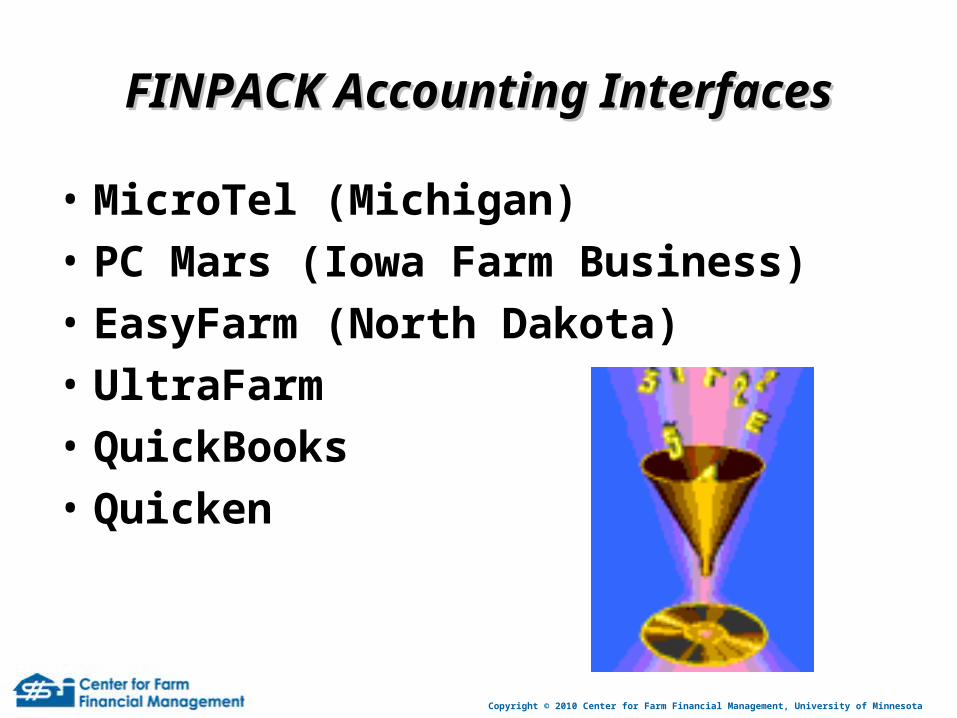
FINPACK Accounting InterfacesFINPACK Accounting Interfaces
• MicroTel (Michigan)
• PC Mars (Iowa Farm Business)
• EasyFarm (North Dakota)
• UltraFarm
• QuickBooks
• Quicken
Copyright © 2010 Center for Farm Financial Management, University of Minnesota

Copyright © 2010 Center for Farm Financial Management, University of Minnesota
Classes and TagsClasses and Tags
Copyright © 2010 Center for Farm Financial Management, University of Minnesota
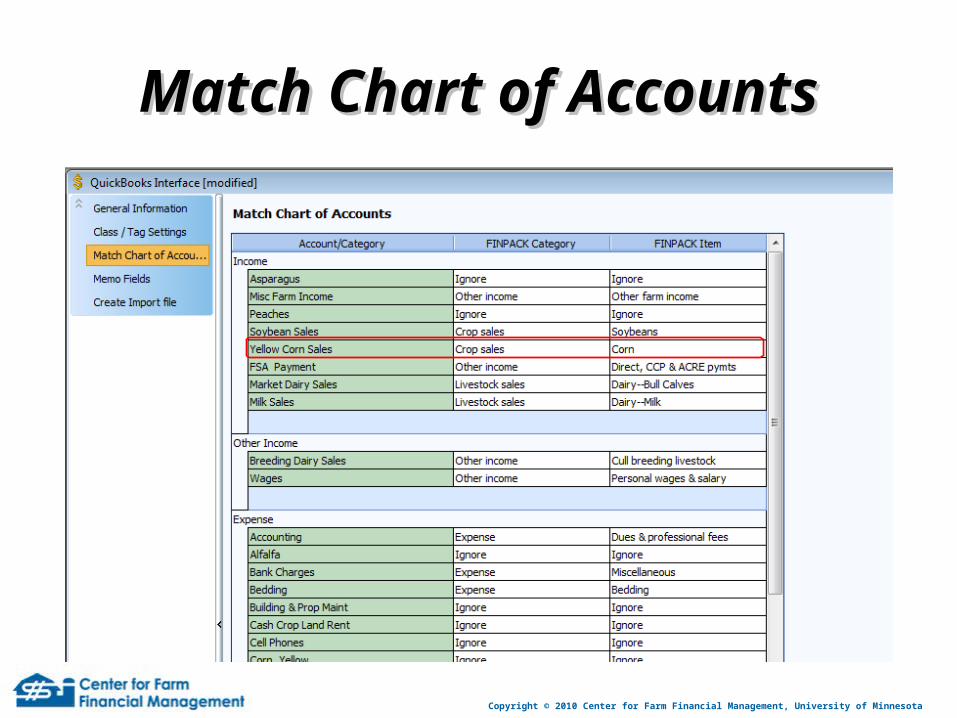
Match Chart of AccountsMatch Chart of Accounts

Copyright © 2010 Center for Farm Financial Management, University of Minnesota
Memo Field QuantitiesMemo Field Quantities
Copyright © 2010 Center for Farm Financial Management, University of Minnesota
Interface PricingInterface Pricing
Quickbooks Interface: $95
Quicken Interface: $45

Copyright © 2010 Center for Farm Financial Management, University of Minnesota
QuickBooks Online TrainingQuickBooks Online Traininghttp://www.cffm.umn.edu/http://www.cffm.umn.edu/

Copyright © 2010 Center for Farm Financial Management, University of Minnesota
AcknowledgmentsAcknowledgments
• Wynn Richardson, Software Development• Rann Loppnow, Software Development• Curtis Mahnken, Online Training• Jeff Reisdorfer, Online Training