
Department of Applied Econometrics Working...
22
Warsaw School of Economics Institute of Econometrics Department of Applied Econometrics Department of Applied Econometrics Working Papers Warsaw School of Economics Al. Niepodleglosci 164 02-554 Warszawa, Poland Working Paper No. 5-11 A microeconometric analysis of album sales success in the Polish music market Mateusz Myśliwski Warsaw School of Economics This paper is available at the Warsaw School of Economics Department of Applied Econometrics website at: http://www.sgh.waw.pl/instytuty/zes/wp/
Transcript of Department of Applied Econometrics Working...

Warsaw School of Economics Institute of Econometrics Department of Applied Econometrics
Department of Applied Econometrics Working Papers Warsaw School of Economics
Al. Niepodleglosci 164 02-554 Warszawa, Poland
Working Paper No. 5-11
A microeconometric analysis of album sales success in the Polish music market
Mateusz Myśliwski Warsaw School of Economics
This paper is available at the Warsaw School of Economics Department of Applied Econometrics website at: http://www.sgh.waw.pl/instytuty/zes/wp/
A microeconometric analysis of album salessuccess in the Polish music market∗
Mateusz Mysliwski†
Abstract
The aim of this paper is twofold. Firstly, we attempt to investigatethe challenges for the constantly changing music industry on the ex-ample of Poland, positing a conclusion that both artists and lablescould profit from a precisely determined set of factors influencing theultimate sales success. On the other hand, the article intends to fillthe gap between record industry analyses an econometric literature,as in the course of research, we found that the use of quantitativemethods is rarely encountered in such analyses.The study uses a self-compiled dataset, containing information on 619albums, which appeared on the Official Sales Chart (OLiS) between2008 and 2009. We propose three models for different quantitativevariables and summarize the obtained results, stating that the use ofmicroeconometric methods in this area of research seems promising.
Keywords: music industry, discrete choice models, partial proportionalodds modelJEL Classification: C25, C51, C52, L82
∗I would like to thank Agata G logowska-Miko lajczyk for language correction and prof.Marek Gruszczynski for useful remarks while writing the Polish version of the paper.†Warsaw School of Economics (SGH). E-mail: [email protected]. Dataset
available upon request. All the usual caveats apply.

A microeconometric analysis of album sales success in the Polish music market
1 Introduction
Realizing that or not, directly or indirectly, everyone takes part in shapingthe music industry. A wide array of possible activities includes some obvi-ous ones, like attending concerts or purchasing records from favourite artists.However, even expressing fondness for a particular tune might influence thesupply and demand mechanism.Among the existing market studies, descriptive ones tend to prevail, whereasthe use of mathematical and statistical tools is not as widespread as in othersectors. One could distinguish two major research directions – modellinggeneral changes in sales volume or using microdata on individual songs orrecords to explain why some of them outperform others in the market.Our analysis aims to fit into the second identified group, though it implicitlyincorporates some of the findings from papers with macro approach (see e.g.those of Liebowitz [2003], Oberholzer and Strumpf [2007], Ordanini [2006]).Given the fact that the collected data originates in a ranking list, we built ona methodology developed by Bradlow and Fader [2001] and Lee, Boatwright,and Kamakura [2003], whose paper was devoted to the problem of forecast-ing the prelaunch sales of recorded music. The first authors use the dataon songs that appeared on Billboard’s Hot 100 chart and prove that theirunique trajectories could be described by a set of five variables. Lee et al.[2003] base on Billboard’s Top 200 albums chart. Subsequently, they esti-mate a rather sophisticated hierarchical Bayesian model, which enables theprediction of approximate sales figures.To make the set of covariates in our models encompass as many charac-teristics as possible, we adopted some of the ideas presented by Harchaouiand Hamdad [2000], who construct a hedonic price model for classical musicrecords, taking into consideration, for instance, the fact whether the albumwas issued by a major label.Polish copyright collection societies and labels keep the exact numbers ofalbum sales undisclosed. Hence, by assuming direct unobservability, insteadof putting sales volume in the role of a dependent variable, quantitativevariables representing the propensity to achieve commercial success are ex-plained.The main purpose of the presented paper is to find a set of determinants ofalbum sales success. As music records are perceived to be almost infinitelyheterogeneous, empirical generalization was used. We thus try to developmodels, which could assist labels and their marketing departments by pro-viding forecasts of albums’ success (which in our case is expressed as receivinga sales certification award or reaching number one in weekly sales charts).The remaining part of this paper is divided in four following sections: sec-
Mateusz Mysliwski May 2011 2
A microeconometric analysis of album sales success in the Polish music market
tion 2 is devoted to the sole purpose of outlining the situation of the Polishmusic market. In the third section we provide more detail on the dataset,describe the variables as well as explain briefly the theoretical frameworkof the models used. The penultimate section contains the presentation ofempirical results. The conclusions and ideas for further research are to befound in the last part of the paper.
2 Current state of Polish music market
The phonographic industry, as a part of creative economy (Howkins [2001])is currently undergoing rapid changes, mainly as a result of the fact that In-ternet has become increasingly accessible to the wider public. Consequently,more and more listeners tend to migrate away from the CD format, whereasthe sales of digital music are grabbing a bigger market share. According tothe IFPI1 data, the sales of music in the form of digital files increased tenfoldbetween 2004 and 2008, reaching over 20% of the entire market. This sharpsurge partially makes up for the 24% fall in physical sales, though the overallworldwide trend remains down. Such a direction of development entails theproblem of illegal file sharing, which exposes the music industry to substan-tial losses and is considered to be the most severe obstacle for further growth(Hui and Png [2003]).
2.1 Key figures
By comparison with the majority of other countries, the Polish recordingindustry seems to have behaved differently in the recent years. While theglobal sales value declined from $23 billion in 2004 to $18.4 billion in 2004,the Polish market saw a leap of almost 20%. The domestic phonographicindustry is, however, very small in relation to the worldwide market andthus, even most unusual occurences in Poland do not affect global trends.Measured in sales dollars, Poland is the world’s 23rd market. In Europe itself,Polish sales amount to a mere 1.5% of the total value.Another striking characteristic of the industry is the fact, that it remainsdominated by physical media, whose sales make up 92% of labels’ income.The absence of worldwide leaders in digital music sales (iTunes and Amazon)in the market might be perceived as the factor responsible for relatively lowersales of computer music files.
1International Federation of the Phonographic Industry.
Mateusz Mysliwski May 2011 3
A microeconometric analysis of album sales success in the Polish music market
2.2 Collective rights management
The composers’ and performers’ copyrights are protected by organizationsacting on their behalf, which, apart from that, play a supervisory role inthe industry. In Poland there are four copyright collecting agencies: ZAiKS(Society of Stage Authors and Composers), SAWP (Association of Perform-ing Artists), STOART (Union of Performers) and ZPAV (Polish Society ofthe Phonographic Industry). The last organization mentioned is the PolishNational Group of the IFPI, which holds responsibility, among others, forconducting airplay surveys, compiling sales charts as well as bestowing gold,platinum and diamond record awards upon best-selling albums and singles.
2.3 Market structure and segmentation
The Polish music market is an oligopoly, dominated by four key players,which are referred to as major labels or simply majors. They are sub-sidiaries of multinational recorded music companies – EMI, Sony, Universaland Warner. Their influence on the market is unarguable, though in therecent years their market share measured with concentration ratio CR4 hasgradually fallen from 76.42% in 2005 to just 65% in 2009. This remains inaccordance with observations for the world market (Alexander [2002]). Inde-pendent record labels appear to keep winning a market share from majors,though their efforts are strenuous, since the ”Big Four” labels possess incom-parably greater financial resources. Thus they are by far less susceptible tooperational risk while allocating funds for promotion of a particular artist.Furthermore, smaller producers of phonograms are in a way dependent onmajors’ distribution channels. Alexander [1994] estimated the cost of verti-cal integration to acquire the distribution network in the United States at$100 million. Obviously, in Polish conditions, this number would be severaltimes smaller. Limited access to distribution channels, though moderatelyalleviated by the expansion of online shops, persists to be a vital barrier forpotential entrants. Possibly, this is one of the reasons why only six indepen-dent Polish labels have a market share greater than one percent.The market, according to IFPI’s recommendations, can be divided into fourfollowing segments: domestic repertoire, international repertoire, compila-tions and soundtracks, and classical music. The segment of domestic reper-toire is relatively the most competitive one, as the Herfindahl-HirschmannIndex amounted to 1602, which is below the threshold of 1800 set by theEuropean Commission, which, when exceeded, indicates high concentration.For the second and third segment, the HHI was equal to – respectively –2117 and 2351.1. It is worth mentioning, that as far as compliations and
Mateusz Mysliwski May 2011 4

A microeconometric analysis of album sales success in the Polish music market
soundtracks are concerned, this segment’s share amounted to 27% in 2009and was the highest amongst IFPI member countries.
2.4 Record pricing
Price is believed to be one of the key factors determining the demand for acertain product. We will hence examine, whether a music album can achievecommercial success just because it is substantially cheaper than other records.Mixon and Ressler [2000] conducted a study of price elasticity of demand forrecords, showing that the demand is inelastic as far as older albums areconcerned. The demand for newly issued releases is, in turn, more elastic,since in some cases, people who have the desire to listen to new music tendto choose cheaper alternatives.Even though the labels virtually have a monopolistic right to reproduce andpublish the recordings, first degree price discrimination does not occur inthe market. Instead, each record is assigned to a certain category on a pricelist called PPD (Published Prices to Dealers). Usually they are divided intodomestic and foreign repertoire and within these further into: full, mid andbudget prices. Which price range a record will belong to is determined by ahandful of factors, that include the label’s pricing strategy, estimated demandand sometimes, artist’s decisions. In addition to that, end-user prices includea double-digit retailers’ margin.
2.5 Sales certification
As mentioned in section 2.2, the Polish Society of the Phonographic Industryis responsible for certifying that a music recording has sold a certain numberof copies. With a tradition dating back to the 1950s, the awards have thesame names of gold, platinum and diamond record in almost all countrieswith IFPI National Groups.In Poland, the first gold records were awarded in the 1960s, when sales ofa long-playing record albums exceeded 160 thousand copies. In the 1990s,ZPAV was established and the hitherto monopolized market was freed fromthe shackles of central planning. A new set of thresholds was fixed at thattime (100 and 50 thousand copies sold of, respectively, domestic and interna-tional repertoire). With the demand for recorded music gradually dropping,the criteria were liberalized twice – in 2003 and 2006. Current requirementsare shown in table 1.Two issues seem to require further explanation. Firstly, there is a possi-bility of being awarded with multi-platinum certification if the sales exceedthe subsequent multiples of the platinum threshold. Secondly, the numbers
Mateusz Mysliwski May 2011 5

A microeconometric analysis of album sales success in the Polish music market
Table 1: Certification award levels in Poland.
Gold Platinum Diamond
Domestic repertoire 15 000 30 000 150 000International repertoire 10 000 20 000 100 000
Soundtracks 10 000 20 000 100 000Jazz/classical 5 000 10 000 50 000
Source: Polish Society of the Phonographic Industry.
are counted for each disc the release comprises, and not for the release asa whole. The fact that jazz or classical music generally does not belong tothe mainstream and the labels are not that willing to promote these musicgenres, underlies the slight diversity of the thresholds.One ought to be aware that sales certification does not only serve the artist,for whom such an award might be an honour, but also yields valuable infor-mation about the success of an album, since the absolute sales figures are notmade public. Chung and Cox [1994] use the number of gold record awardsreceived as a measure of superstardom in their model, proving that it reflectsthe scale of success in a very similar way sales profit does.
3 Description of the data and theoretical
framework
The following section gives details on the dataset and the data collectionprocess, as well as provides brief information on the models used.
3.1 Data collection
The models presented in the next section were estimated with the data col-lected from OLiS (Official Sales Chart)2. The chart is compiled on the ba-sis of reports received weekly from country’s major retailers and intendsto present a list of 50 countrywide best-selling albums each week. In ouranalysis, we take into consideration the period between January 2008 andDecember 2009 (102 weeks). A total of 663 different albums appeared onOLiS in the aforementioned time interval. However, we included only 619observations in the estimation sample, for which a complete set of charac-teristics was possible to be obtained (i.e. albums that entered and left thecharts in the analysed period)
2The charts can be accessed through ZPAV’s official website: http://www.zpav.pl/
index.php?lang=2
Mateusz Mysliwski May 2011 6

A microeconometric analysis of album sales success in the Polish music market
3.2 Variables
To present a wide range of approaches to the analysis of commercial success ofan album, we estimate three models, each for a different dependent variable.Two of them are examples of binomial regression and thus the followingdiscrete variables were modelled:
NUMB1 =
{1 if the album reached the peak of OLiS charts0 otherwise
GOLD =
{1 if the album got a gold record award0 otherwise
Following the binary response regressions, we propose an extension of thesecond model, where the dependent variable takes ordinal values, so that notonly gold records, but also the two remaining certification awards are takeninto consideration while predicting the probability of being awarded. Thedependent variable used in the third model is thus as follows:
AWARD =
3 diamond record2 platinum record1 gold record0 no award whatsoever
We have refrained from the idea of adding extra tiers to the variable, cor-responding to multi-platinum awards, as the newly created categories wouldbe too infrequently represented.
The covariates set can be divided into two groups – the first one is a battery offive variables capturing chart trajectories for each album (Bradlow and Fader[2001]). It comprises the following measures: DEBUT – album’s debut posi-tion (its rank at the time of the first appearance on the chart), WKS2PEAK– the number of weeks needed to reach the highest rank, PEAK – the topranking the recording attains, TOTWKS – the total number of weeks spenton the list, EXIT – album’s exit position (its rank during the last week ofpresence on the chart). To circumvent endogeneity and multicollinearity is-sues, we did not include all of these variables in the models and some of themwere not used at all. However, we intend to present histograms for these fivemeasures (see figure 1).
It can be observed that the histograms are somewhat similar in shape to thoseobtained by Bradlow and Fader [2001], even though they analysed songs, notalbums. The majority of albums debuted on the charts below 15th place.Approximately 80% of them attained their peaks after one or two weeks.
Mateusz Mysliwski May 2011 7

A microeconometric analysis of album sales success in the Polish music market
There are some outliers – albums that needed more than 20 weeks to reachtheir top spot. This occured to records that returned in glory after leavingthe charts and being absent for several weeks. Most albums exit the chartsfrom bottom positions, which can be attributed to the fact that the loss ofpopularity is gradual. As far as the total number of weeks spent on thecharts is concerned, over half of the albums did not survive for more thanfive weeks.The second group of covariates comprises individual characteristics of therecords. The rationale behind taking some of them into account has beenalready laid out in section 2. In this place we would only like to add thatapart from variables defining the segment of the market it belongs to, al-bum’s retail price and whether the album was released under a major label,we analyse the influence of seasonal demand. Strobl and Tucker [2000] pointout that its effect is likely to be significant and every year we observe thatalbums released on a special occasion (e.g. Christmas, various anniversaries,etc.) enjoy great popularity. Ultimately, we also consider the involvement ofinteractions (Cox [1984]). Table 2 summarizes this section.
Table 2: Explanatory variables.
Name Possible values Description
Variables regarding album’s performance on the chart
DEBUT {1;50} debut positionWKS2PEAK {1;∞) number of weeks needed to reach highest rank
PEAK {1;50} highest position attainedTOTWKS {1;∞) total number of weeks on the chart
EXIT {1;50} exit position
Other characteristics
PRICE continuous average retail price
MAJOR
{1 if the record was issued by a major label0 otherwise
PL
{1 if the album was recorded by a Polish artist0 otherwise
VA
{1 if the album is a compilation0 otherwise
OST
{1 if the album is a soundtrack or film score0 otherwise
CLASSJAZZ
{1 for jazz or classical music albums0 otherwise
SEASON
{1 if the album is a seasonal release0 otherwise
3.3 Variable selection
As mentioned above, we were forced to refrain from including all the variablesfrom table 2 in all the models because of endogeneity and multicollinearityissues. The first problem was avoided by analysing, to what extent adding
Mateusz Mysliwski May 2011 8

A microeconometric analysis of album sales success in the Polish music market
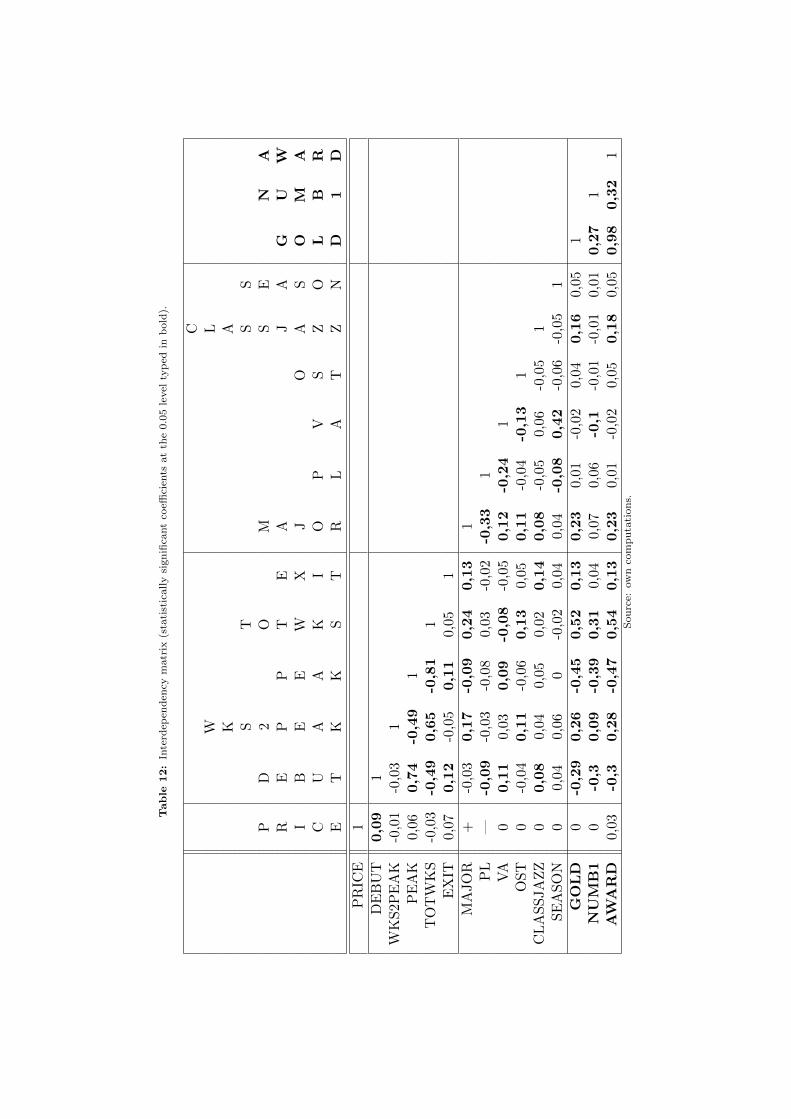
respective variables could be justified, in terms of sensible interpretation. Forinstance, using the PEAK covariate in the model for NUMB1 would not bejustified. To detect possible multicollinearity and evaluate the strength ofinterdependencies between the variables, we analyse measures of association.Instead of computing a simple correlation matrix, which, in the case of ordi-nal and binary variables would be incorrect, we present an interdependencymatrix (Gruszczynski [2002]). The idea of its construction is illustrated intable 3.
Table 3: The construction of an interdependency matrix.
Variable type Continuous Ordinal Binary
Continuous Pearson’s rho Spearman’s rank correlation coeff. t-test for difference in meanOrdinal S p e a r m a n’ s r a n k c o r r e l a t i o n c o e f f.Binary t-test for difference in mean Spearman’s rank correlation coeff. Yule’s coeff. of association
Obviously, all measures but the t-test3 show both the direction and the degreeof the relationship. See table 12 for the computed interdependency matrix.Basically, the selection of covariates for our models could be summarized inthree steps. Firstly, we check which variables yield good interpretation andinquire into measures of association to judge whether multicollinearity is anissue. Eventually, we estimate the models for the first time and either removestatistically insignificant covariates and reestimate the models, or leave someof the insignificant variables to prove our hypotheses right or wrong.
3.4 Theory underlying the models applied
The fact that each observation in our dataset corresponds to a micro-levelentity and dependent variables are qualitative, leads to a conclusion thatmicroeconometric methods are appropriate for this kind of analysis.The existing literature on this subject provides extensive information on dis-crete choice models (see e.g. Cameron and Trivedi [2005], Maddala [1994],Long [1997]), so we will not elaborate on that. It seems worth mentioningthat we estimated both logit and probit models in both cases and selectedthe better fitted one basing on information criteria. Treating the dependentvariable as the observable result of a latent inclination to, respectively, get agold record award or reach the peak of the charts, the probability of successgiven the set of covariates can be expressed as (1) assuming logistic distribu-tion of the error terms and (2) if we assume normal distribution as in probit
3To denote statistically significant differences we use ”+” (if the mean of the continuousvariable is higher when the binary variable equals one) and ”–” symbols. Otherwise, weput ”0” in the matrix.
Mateusz Mysliwski May 2011 9

A microeconometric analysis of album sales success in the Polish music market
model:
pi =exT
i β
1 + exTi β
(1)
pi =
∫ xTi β
−∞
1√2πe−
z2
2 dz (2)
For interpretation, we computed the effects of a discrete change for binaryand ordinal variables and marginal effects for continuous covariates. To as-sess the quality of the model a battery of measures similar to the usual R2
from the linear regression case is presented, though none of them yields anunequivocal interpetation in terms of percent of the explained variance. Longand Freese [2005] exhibit these goodness-of-fit measures in detail.The third model we present is more complicated, since the dependent vari-able can take more than just two values, which can be put on an ordinalscale. Hence a multinomial model for the ordered outcomes seems suitable.In the very basic ordered logit model, introduced initially by Snell [1964]and developed further to include more than one covariate by McKelvey andZavoina [1975], the coefficients are restricted not to vary across categories, sothat the number of the parameters estimated is relatively small4. However,the model does not fall short and odds ratios are interpretable only underthe rarely fulfilled proportional odds assumption. The cumulative probabilitythat variable y is lower or equal to m conditioned by the covariates vectorcan be conveyed by:
Pr(yi ≤ m|xi) =eτm−xT
i β
1 + eτm−xTi β
for m ∈ {1, ..., J − 1}. (3)
It can be easily observed, that the parameters vector β stays the same re-gardless of which category of the variable we consider. Theoretically, (3)could be split into J − 1 binary logistic regressions with different constantterms, so that their regression curves are parallel. If the assumption is vi-olated5, a different specification should be used. One of the solutions ofthis problem is estimation of a generalized ordered logit model, which allowscategory-varying parameters (Clogg and Shihadeh [1994]). Such model isoften overparametrized, since we need to compute k × (J − 1) coefficients.To find a golden mean between an overparametrized and uninterpretablemodel, we suggest the estimation of a partial proportional odds model, in-troduced by Peterson and Harrel [1990]. A parsimonious specification is
4To be exact, k parameters for covariates and J-1 threshold values are estimated.5A formal way of testing the proportional odds assumption has been proposed by Brant
[1990].
Mateusz Mysliwski May 2011 10
A microeconometric analysis of album sales success in the Polish music market
achieved by imposing equality restrictions on as many parameters as possi-ble, as long as the proportional odds assumption holds. Let Ti denote thepart of the covariates vector, which includes variables causing the violationof the assumption and γm the corresponding vector of parameter estimates.Then, similiarily to (3), cumulative probability can be expressed as:
Pr(yi ≤ m|xi) =e−αm−xT
i β−TTi γm
1 + e−αm−xTi β−TT
i γm
(4)
To estimate the parameters of the above equation we make use of Williams’[2005] algorithm gologit2. This model has also been recently described byGreene and Hensher [2011].
4 Results of the analysis
In the course of our research, many models were estimated. We arbitrarilychose to present three of them, which we consider to be the best ones, as faras goodness of fit and predictive power are concerned.
Logit model with GOLD as dependent variable
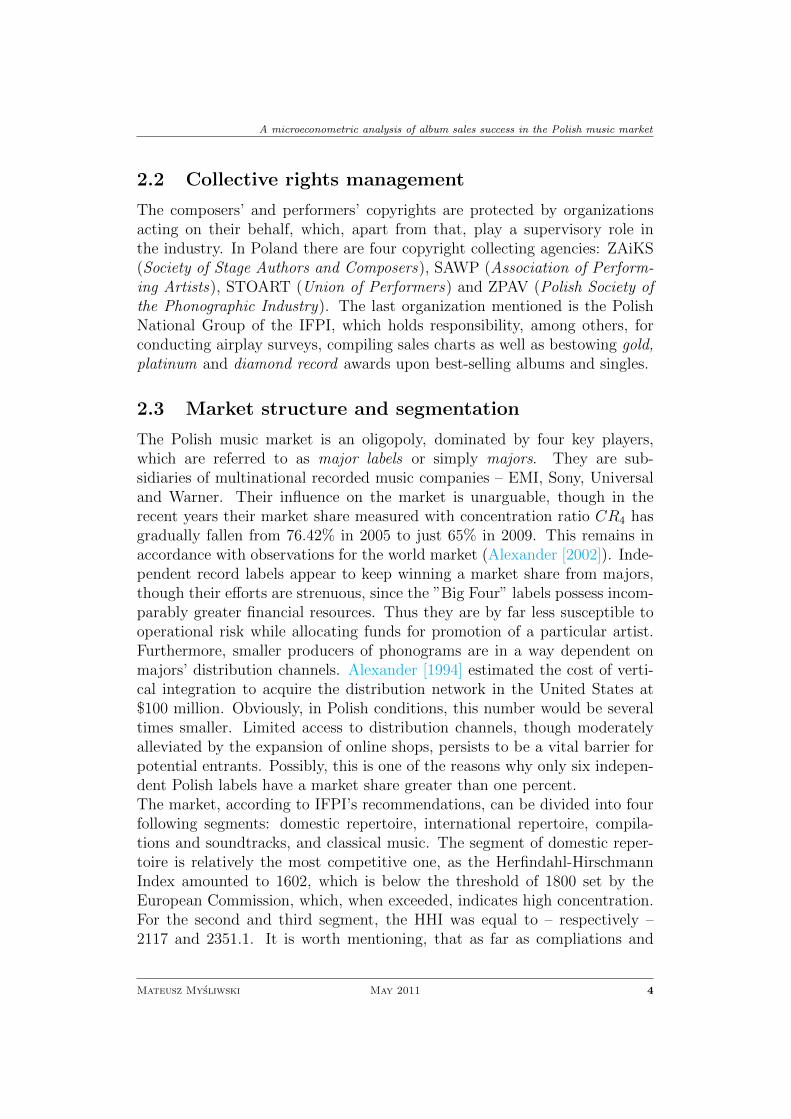
As one can observe in table 4, amongst the involved variables, only the priceof the album does not influence the fact of it being awarded with gold record.Though the R2 measures should be treated rather as benchmarks while com-
Table 4: Estimation results – logit model with GOLD as dependent variable.
Variable Coefficient Std. err. z -statistic p-value
Constant -3.795612 0.7173013 -5.29 0.000 ***TOTWKS 0.1863532 0.0252277 7.39 0.000 ***
DEBUT -0.0343961 0.009941 -3.46 0.001 ***MAJOR 1.920393 0.6935491 2.77 0.006 ***PRICE 0.0040271 0.0084563 0.48 0.634
CLASSJAZZ 1.779997 0.4071556 4.37 0.000 ***VA*SEASON 0.9477107 0.4089877 2.32 0.020 **
Number of observations: 619Log likelihood: -239.32
Pseudo-R2: 0.328McKelvey and Zavoina R2: 0.553
Count-R2: 0.801Adj. Count-R2: 0.369
Significance levels: *** 1% ** 5% * 10%
paring between different specifications, we can easily notice that their valuessignificantly differ from zero. McKelvey and Zavoina R2, which is said toresemble the usual coefficient of determination to the greatest extent, equals
Mateusz Mysliwski May 2011 11

A microeconometric analysis of album sales success in the Polish music market
0.553. Hence, we can infer that the model fits the data well. Since the coef-ficients of logistic regressions do not yield direct interpretation, odds ratioswere computed (see table 5).The obtained results are intuitive and easy to interpret. For instance, releas-ing the album under a major label increases the odds of it being awardedwith gold record by 582.4%. The estimate corresponding to the interactionvariable can be interpreted in a following manner: if the record is a seasonalcompilation, the odds that it will sell well enough to receive the award are2.5 times higher than in case of albums which are not seasonal compilations.
Table 5: Odds ratios.
Variable Odds ratio % change
TOTWKS 1.2048 20.5%DEBUT 0.9662 -3.4%MAJOR 6.8236 582.4%PRICE 1.0040 0.4%
CLASSJAZZ 5.9298 493.0%VA*SEASON 2.5798 158.0%
Eventually, we present several out-of-sample forecasts (see table 6), assum-ing different characteristics of the records. As for the in-sample predictivepower, the count-R2 shown in table 4 indicates that 80% of the forecasts areaccurate.
Table 6: Out-of-sample forecasts.
Popular music album issued by a major
TOTWKS DEBUT MAJOR PRICE CLASSJAZZ VA*SEASONaverage average 1 average 0 0P (GOLD = 1|x) 0.2054 95% confidence interval: [0.1618; 0.2489]P (GOLD = 0|x) 0.7946 [0.7511; 0.8382]
Popular music album issued by an independent label
TOTWKS DEBUT MAJOR PRICE CLASSJAZZ VA*SEASONaverage average 0 average 0 0P (GOLD = 1|x) 0.0365 95% confidence interval: [-0.0108; 0.0838]P (GOLD = 0|x) 0.9635 [0.9162; 1.0108]
Classical/jazz album issued by a major
TOTWKS DEBUT MAJOR PRICE CLASSJAZZ VA*SEASONaverage average 1 average 1 0P (GOLD = 1|x) 0.6051 95% confidence interval: [0.4280; 0.7822]P (GOLD = 0|x) 0.3949 [0.2178; 0.5720]Seasonal compilation issued by a major, which debuted on 1st place
TOTWKS DEBUT MAJOR PRICE CLASSJAZZ VA*SEASONaverage 1 1 average 0 1P (GOLD = 1|x) 0.6303 95% confidence interval: [0.4154; 0.8452]P (GOLD = 0|x) 0.3697 [0.1548; 0.5846]
Observe, for example, that it is unlikely for a popular music album releasedunder an independent label to get the gold record award (the probabilityof such an event is lower than 4%). The seemingly paradoxical fact thatclassical/jazz albums tend to be awarded relatively more frequently can be
Mateusz Mysliwski May 2011 12

A microeconometric analysis of album sales success in the Polish music market
attributed to two circumstances – firstly, the sales thresholds are lower forthem (see table 1) and secondly, only albums that were successful enoughto enter the charts were included in the sample. This hardly ever occurs tojazz or classical recordings, so those that even appeared on the charts weresuccessfully enough to receive the award as well.
Probit model with NUMB1 as dependent variable
The second model is supposed to explain the album’s inclination to reachnumber one position on the charts. By comparing information criteria forlogit and probit models, we came to a conclusion that the latter is better. All
Table 7: Estimation results – probit model with NUMB1 as dependent variable.
Variable Coefficient Std. err. z -statistic p-value
Constant -2.857557 0.3867971 -7.39 0.000 ***TOTWKS 0.0666732 0.0123736 5.39 0.000 ***
PRICE 0.0116655 0.0065275 1.79 0.074 *VA -0.5315397 0.2684878 -1.98 0.048 **
PL*MAJOR 0.3502568 0.2144441 1.63 0.100 *
Number of observations: 619Log likelihood: -93.68
Pseudo-R2: 0.234McKelvey and Zavoina R2: 0.288
Count-R2: 0.825Adj. Count-R2: 0.091
Significance levels: *** 1% ** 5% * 10%
the included variables are statistically significant, though the direction of therelationship between the price and dependent variable seems counterintuitiveand thus should not be interpreted. The quality of the model is satisfactory,though there is a high difference between count-R2 and the adjusted count-R2, which indicates that the predictive power is not particularly impressivedue to unbalancedness of the sample.Table 8 contains the estimates of marginal effects and discrete changes. Notethat every additional week spent on the charts increases ceteris paribus theprobability of reaching the peak by 0.0039. Furthermore, compliations areless likely to become number ones than albums including songs performed byjust one artist.
Table 8: Marginal effects in the second model.
Variable Min → Max 0 → 1 +/- 12
Marginal effect
TOTWKS 0,9698 0,0015 0,0039 0,0039PRICE 0,2061 0,0002 0,0007 0,0007
VA -0,0254 -0,0254 -0,0318 -0,0307PL*MAJOR 0,0243 0,0243 0,0205 0,0202
Mateusz Mysliwski May 2011 13
A microeconometric analysis of album sales success in the Polish music market
Several sample forecasts have been produced, for instance, the probabilitythat a Polish album issued by a major label which stays on the charts formore than 10 weeks reaches number one is equal to 18%. On the contrary– for a compilation containing international repertoire, the probability issmaller than one percent.
Partial proportional odds model for AWARD
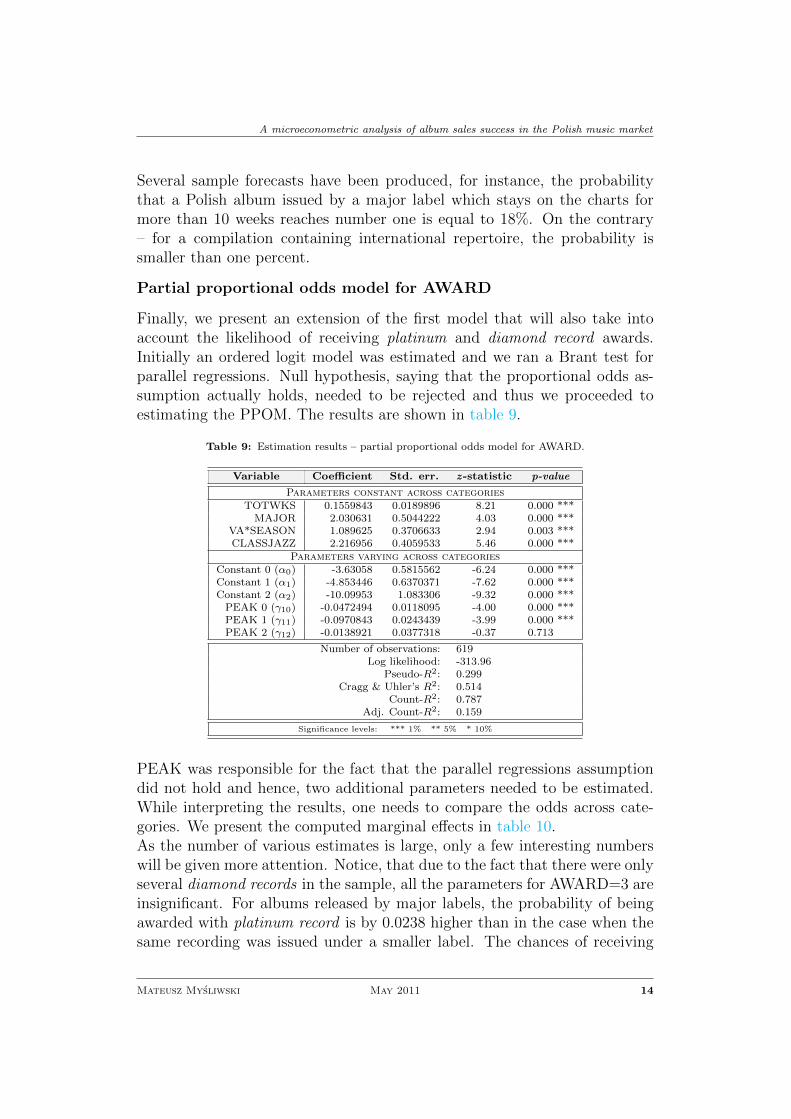
Finally, we present an extension of the first model that will also take intoaccount the likelihood of receiving platinum and diamond record awards.Initially an ordered logit model was estimated and we ran a Brant test forparallel regressions. Null hypothesis, saying that the proportional odds as-sumption actually holds, needed to be rejected and thus we proceeded toestimating the PPOM. The results are shown in table 9.
Table 9: Estimation results – partial proportional odds model for AWARD.
Variable Coefficient Std. err. z -statistic p-value
Parameters constant across categoriesTOTWKS 0.1559843 0.0189896 8.21 0.000 ***
MAJOR 2.030631 0.5044222 4.03 0.000 ***VA*SEASON 1.089625 0.3706633 2.94 0.003 ***CLASSJAZZ 2.216956 0.4059533 5.46 0.000 ***
Parameters varying across categoriesConstant 0 (α0) -3.63058 0.5815562 -6.24 0.000 ***Constant 1 (α1) -4.853446 0.6370371 -7.62 0.000 ***Constant 2 (α2) -10.09953 1.083306 -9.32 0.000 ***
PEAK 0 (γ10) -0.0472494 0.0118095 -4.00 0.000 ***PEAK 1 (γ11) -0.0970843 0.0243439 -3.99 0.000 ***PEAK 2 (γ12) -0.0138921 0.0377318 -0.37 0.713
Number of observations: 619Log likelihood: -313.96
Pseudo-R2: 0.299Cragg & Uhler’s R2: 0.514
Count-R2: 0.787Adj. Count-R2: 0.159
Significance levels: *** 1% ** 5% * 10%
PEAK was responsible for the fact that the parallel regressions assumptiondid not hold and hence, two additional parameters needed to be estimated.While interpreting the results, one needs to compare the odds across cate-gories. We present the computed marginal effects in table 10.As the number of various estimates is large, only a few interesting numberswill be given more attention. Notice, that due to the fact that there were onlyseveral diamond records in the sample, all the parameters for AWARD=3 areinsignificant. For albums released by major labels, the probability of beingawarded with platinum record is by 0.0238 higher than in the case when thesame recording was issued under a smaller label. The chances of receiving
Mateusz Mysliwski May 2011 14

A microeconometric analysis of album sales success in the Polish music market
the gold record certification are definitely higher – by almost 0.16. Every ad-ditional week spent on the chart leads to an increase in probability of gettinga gold record by 1.8 precentage points. For platinum records it is approxi-mately 0.3 pp. We have already observed in the first model that seasonalcompilations are by far more prone to get the golden record award. Now weare able to conclude, that they might have difficulties to reach the level ofplatinum record, as the estimate is on the verge of statistical significance.
Table 10: Marginal effects in the partial proportional odds model for AWARD.
Variable Marginal effect Std. err. z-statistic p-value
AWARD=0PEAK 0.0062413 0.001441 4.33 0.000 ***
TOTWKS -0.0206045 0.0032936 -6.26 0.000 ***MAJOR -0.1845772 0.0281564 -6.56 0.000 ***
VA*SEASON -0.1913487 0.0797698 -2.40 0.016 **CLASSJAZZ -0.4585632 0.0935471 5.46 0.000 ***
AWARD=1PEAK -0.0044454 0.0013159 -3.38 0.001 ***
TOTWKS 0.017719 0.0029884 5.93 0.000 ***MAJOR 0.159988 0.0260602 6.14 0.000 ***
VA*SEASON 0.158656 0.0640447 2.48 0.013 **CLASSJAZZ 0.3416474 0.0633728 5.39 0.000 ***
AWARD=2PEAK -0.0017879 0.0003924 -4.56 0.000 ***
TOTWKS 0.0027951 0.0010611 2.63 0.008 ***MAJOR 0.0238233 0.0088015 2.71 0.007 ***
VA*SEASON 0.0316378 0.01919 1.65 0.099 *CLASSJAZZ 0.1127974 0.0520206 2.17 0.030 **
AWARD=3PEAK -0.000008 0.0000206 -0.39 0.696
TOTWKS 0.0000904 0.000063 1.43 0.151MAJOR 0.0007659 0.0005585 1.37 0.170
VA*SEASON 0.0010548 0.0009237 1.14 0.253CLASSJAZZ 0.0041184 0.0032273 1.28 0.202
Eventually, we will examine the predictive power of the last model. In-sample forecasts are illustrated in figure 2. For diamond records there wereonly three cases, where the predicted probability exceeded 0.2. Interestinglyenough, we could be almost certain that some albums get the platinum recordaward, whereas for gold records, the situation seems slightly vague.Out-of-sample forecasts similar to those in table 6 shall be presented now(see table 11).
One can easily observe, that for the first two hypothetical albums, the prob-ability that they will not be successful enough to receive an award prevails.We have also computed the probabilities for some albums that actually didexist but were not in the estimation sample. For instance, for an internation-ally best-selling album by Nelly Furtado – ’Loose’, we produced a forecastsaying that it will with 98% certainty be awarded with a diamond record.This actually happened, which proves that the forecasts produced by themodel can be of some use.
Mateusz Mysliwski May 2011 15

A microeconometric analysis of album sales success in the Polish music market
Table 11: Out-of-sample forecasts in the partial proportional odds model.
Popular music album issued by a major, which peaked at number 1
PEAK TOTWKS MAJOR VA*SEASON CLASSJAZZ1 average 1 0 0
No award P (AWARD = 0|x) 0,6306 95% confidence interval: [0,5307; 0,7305]Gold record P (AWARD = 1|x) 0,2284 [0,1490; 0,3079]
Platinum record P (AWARD = 2|x) 0,1400 [0,0754; 0,2046]Diamond record P (AWARD = 3|x) 0,0009 [-0,0006; 0,0025]
Classical/jazz album issued by an independent label
PEAK TOTWKS MAJOR VA*SEASON CLASSJAZZaverage average 0 0 1
No award P (AWARD = 0|x) 0,7846 95% confidence interval: [0,5790; 0,9902]Gold record P (AWARD = 1|x) 0,1878 [0,0128; 0,3628]
Platinum record P (AWARD = 2|x) 0,0268 [-0,0088; 0,0623]Diamond record P (AWARD = 3|x) 0,0009 [-0,0007; 0,0024]Seasonal compilation issued by a major, which spent at least 10 weeks on the charts
PEAK TOTWKS MAJOR VA*SEASON CLASSJAZZaverage average above 10 1 1 0
No award P (AWARD = 0|x) 0,2151 95% confidence interval: [0,0744; 0,3558]Gold record P (AWARD = 1|x) 0,5108 [0,3717; 0,6499]
Platinum record P (AWARD = 2|x) 0,2628 [0,0615; 0,4641]Diamond record P (AWARD = 3|x) 0,0113 [-0,0054; 0,0279]
5 Conclusions
The conducted study served two purposes – firstly, we intended to find thedeterminants of album sales success in the Polish music market. Secondly, wetried to verify whether microeconometric models can be used in such analy-ses. The empirical evidence we provided, corroborates that both goals wereattained to a large extent.We found that the price is an irrelevant factor and does not influence album’ssuccess, which confirms Liebowitz’s [2003] findings. In accordance with ourinitial conjecture, major labels guarantee higher success probability. More-over, compilations are extraordinarily popular in Poland and even if thereare literally loads of them released every month, the chances that at least afraction of them will turn out to be successful, are still higher than for mostalbums containing songs by just one artist.The quality of the models presented is fairly good. One needs to be aware,that in case of microeconometric models, the goodness-of-fit assessment isnot an obvious issue. The fact that the measures we presented were signifi-cantly greater than zero, and in some cases they exceeded 0.5, should serveas sufficient evidence that discrete response and multinomial models can beapplied to such analyses.However, we are fully aware of the fact, that our study is not entirely bereftof weaknesses. The sample encompassed only albums which appeared on thecharts in a two-year period. Such an interval might seem too short to traceall the characteristics of the market. Furthermore, the covariates set we con-sider, can be questionned. On the one hand, it enables forecasting even fordebutants, though on the other hand, the fact that we did not include someimportant characteristics like, for instance, the number of previously received
Mateusz Mysliwski May 2011 16
A microeconometric analysis of album sales success in the Polish music market
awards or label’s marketing expenses, can be seen as a serious drawback ofthe analysis. Another question arises while considering, whether it makesany sense to analyse a market which, colloquially speaking, is doomed toextinction in a couple of years. The answer is not straightforward, though,even if physical media eventually cease to exist, forecasting the sales of digi-tal files will remain an issue.There is still a lot to be examined in the under-researched Polish and world-wide music industry. A similar study should be conducted for sales expressedin absolute values, as well as for other creative industries (e.g. book orfilm markets). An atheoretical analysis of albums’ trajectories on the Pol-ish charts is also worth considering. We hope that the conclusions derivedfrom this paper will be useful for other researchers and labels’ marketingmanagers.
ReferencesAlexander P.J. [1994], Entry barriers, release behavior, and multi-product firms in the music recordingindustry, Review of Industrial Organization, 9, pp. 85–98.
[2002], Market structure of the domestic music recording industry, 1890–1988,Historical methods , 35, pp. 129–132.
Bradlow E.T., Fader P.S. [2001], A Bayesian lifetime model for the Hot 100 Billboard songs, Journalof the American Statistical Association, 96, pp. 368–381.
Brant R. [1990], Assessing proportionality in the proportional odds model for ordinal logistic regression,Biometrics, 46(4), pp. 1171–1178.
Cameron A.C., Trivedi P.K. [2005], Microeconometrics: methods and applications, Cambridge Univer-sity Press, New York.
Clogg, C., Shihadeh E. [1994], Statistical models for ordinal variablepp. Advanced quantitative tech-niques in the social sciences series volume 4, Sage Publications, Thousand Oaks.
Cox D.R. [1984], Interaction, International Statistical Review, 52, pp. 1–31.
Chung K.H., Cox R.A.K. [1994], A stochastic model of superstardom: an application of the Yule distri-bution, The Review of Economics and Statistics, 76, pp. 771–775.
Dixon R.D. [1982], LP chart careers: Indices and predictors of ascent and descent in popularity, PopularMusic and Society, 8, pp. 19–44.
Greene W.H., Hensher D.A. [2010]: Modeling ordered choices. A primer, Cambridge University Press,New York.
Gruszczynski M. [2002], Modele i prognozy zmiennych jakosciowych w finansach i bankowosci, OficynaWydawnicza SGH, Warszawa.
Harchaoui T.M., Hamdad M. [2000], The prices of classical recorded music: a hedonic approach, Inter-national Journal of Industrial Organization, 18, pp. 497–514.
Howkins J. [2001], The Creative Economy: How People Make Money From Ideas, Penguin, London.
Hui K-L., Png I. [2003], Piracy and the legitimate demand for recorded music, Contributions to EconomicAnalysis & Policy , 2.
Lee J., Boatwright P., Kamakura W.A. [2003], A Bayesian model for prelaunch sales forecasting ofrecorded music, Management Science, 49, pp. 179–196.
Liebowitz S. [2003], Will MP3 downloads annihilate the record industry? The evidence so far, Universityof Texas, Dallas.
Long J.S. [1997]. Regression models for categorical and limited dependent variables, Sage Publications,Thousand Oaks.
Mateusz Mysliwski May 2011 17
A microeconometric analysis of album sales success in the Polish music market
Long J.S., Freese J. [2005]. Regression models for categorical dependent variables using Stata, StataPress, College Station.
Maddala G.S. [1994]. Limited-dependent and qualitative variables in econometrics, Cambridge Univer-sity Press, Cambridge.
McKelvey R.D., Zavoina W. [1975], A statistical model for the analysis of ordinal level dependent vari-ables, Journal of Mathematical Sociology, 4, pp. 103–120.
Mixon F., Ressler R. [2000], A Note on Elasticity and Price Dispersions in the Music Recording Indus-try, Review of Industrial Organization, 17, pp. 465–470.
Oberholzer F., Strumpf K. [2007], The effect of file sharing on record sales: an empirical analysis,Journal of Political Economy, 115, pp. 1–42.
Ordanini A. [2006], Selection models in the music industry: How a prior independent experience mayaffect chart success, Journal of Cultural Economics, 30, pp. 183–200.
Peterson B., Harrell F.E. [1990], Partial proportional odds models for ordinal response variables, Ap-plied Statistics , 39, pp. 205–217.
Recording Industry in Numbers 2009, International Federation of the Phonographic Industry, London.
Snell E.J. [1964], A scaling procedure for ordered categorical data, Biometrics, 20, pp. 592–607.
Strobl E., Tucker C. [2000], The dynamics of chart success in the U.K. pre-recorded popular musicindustry, Journal of Cultural Economics, 24, pp. 113–134.
Williams R. [2005], Generalized ordered logit/partial proportional odds models for ordinal dependent vari-ables, The Stata Journal , 6, pp. 58–82.
Mateusz Mysliwski May 2011 18
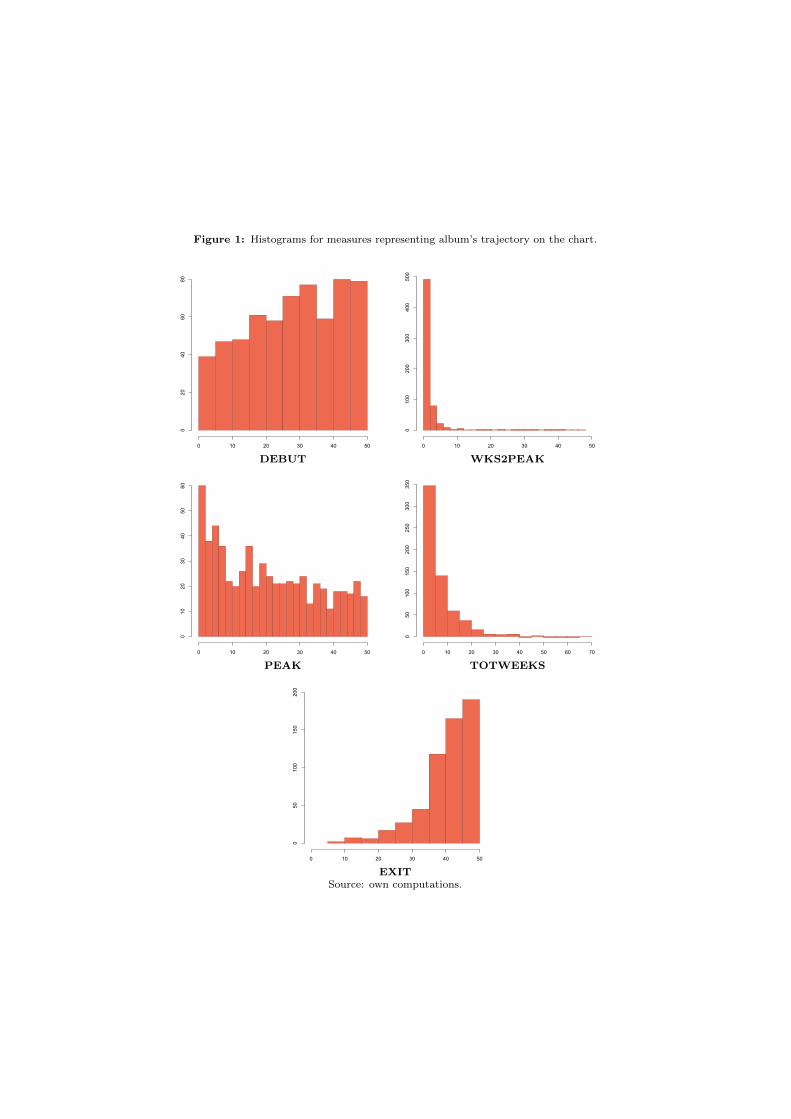
Figure 1: Histograms for measures representing album’s trajectory on the chart.
Pozycja debiutu
Licz
ba pły
t
0 10 20 30 40 50
020
4060
80
Tygodnie do osiągnięcia najwyższej pozycji
Licz
ba pły
t
0 10 20 30 40 50
0100
200
300
400
500
DEBUT WKS2PEAK
Najwyższa pozycja
Licz
ba pły
t
0 10 20 30 40 50
010
2030
4050
60
Liczba tygodni
Licz
ba pły
t
0 10 20 30 40 50 60 70
050
100
150
200
250
300
350
PEAK TOTWEEKS
Miejsce w ostatnim tygodniu na liście
Licz
ba pły
t
0 10 20 30 40 50
050
100
150
200
EXITSource: own computations.
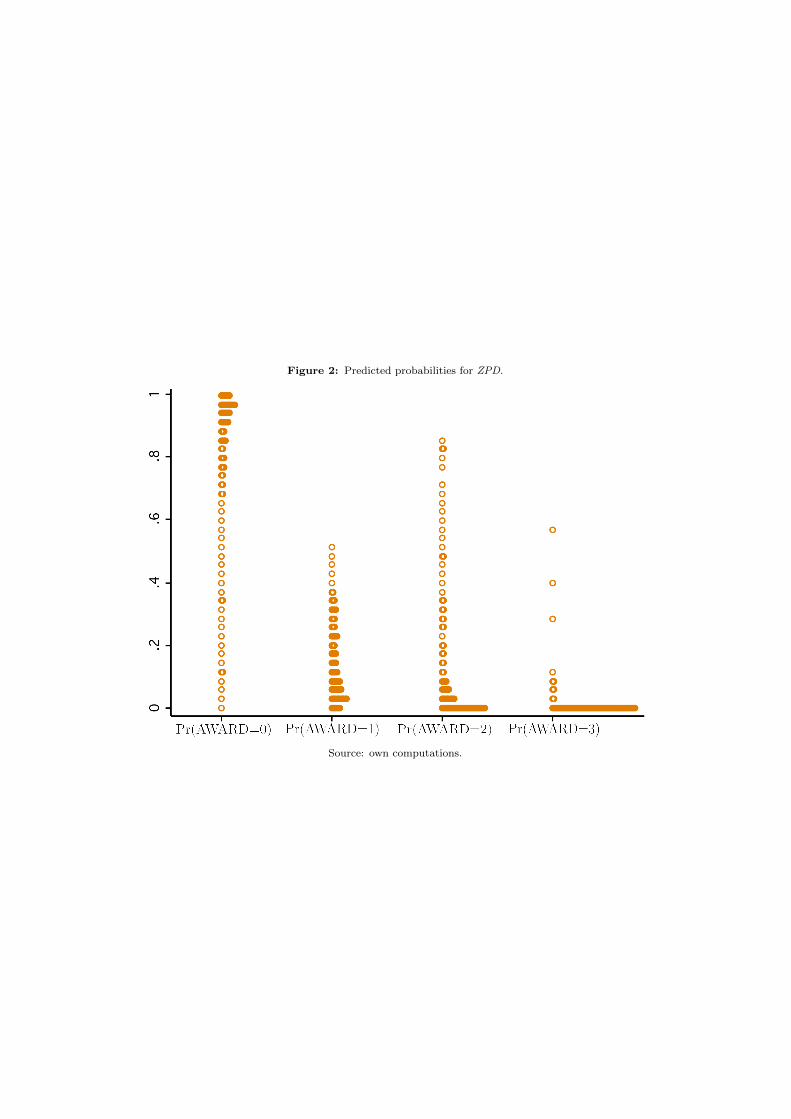
Figure 2: Predicted probabilities for ZPD.
Source: own computations.
Tab
le12:
Inte
rdep
end
ency
matr
ix(s
tati
stic
all
ysi
gn
ifica
nt
coeffi
cien
tsat
the
0.0
5le
vel
typ
edin
bold
).
CW
LK
AS
TS
SP
D2
OM
SE
NA
RE
PP
TE
AJ
AG
UW
IB
EE
WX
JO
AS
OM
AC
UA
AK
IO
PV
SZ
OL
BR
ET
KK
ST
RL
AT
ZN
D1
D
PR
ICE
1
DE
BU
T0,09
1W
KS
2P
EA
K-0
,01
-0,0
31
PE
AK
0,06
0,74
-0,49
1T
OT
WK
S-0
,03
-0,49
0,65
-0,81
1E
XIT
0,07
0,12
-0,0
50,11
0,05
1
MA
JO
R+
-0,0
30,17
-0,09
0,24
0,13
1P
L—
-0,09
-0,0
3-0
,08
0,03
-0,0
2-0,33
1V
A0
0,11
0,0
30,09
-0,08
-0,0
50,12
-0,24
1O
ST
0-0
,04
0,11
-0,0
60,13
0,05
0,11
-0,0
4-0,13
1C
LA
SS
JA
ZZ
00,08
0,0
40,0
50,
020,14
0,08
-0,0
50,0
6-0
,05
1S
EA
SO
N0
0,0
40,0
60
-0,0
20,
040,
04-0,08
0,42
-0,0
6-0
,05
1
GOLD
0-0,29
0,26
-0,45
0,52
0,13
0,23
0,01
-0,0
20,0
40,16
0,0
51
NUM
B1
0-0,3
0,09
-0,39
0,31
0,04
0,07
0,06
-0,1
-0,0
1-0
,01
0,01
0,27
1AW
ARD
0,03
-0,3
0,28
-0,47
0,54
0,13
0,23
0,01
-0,0
20,0
50,18
0,0
50,98
0,32
1S
ou
rce:
ow
nco
mp
uta
tion
s.


![Working Papers - Kolegiakolegia.sgh.waw.pl/pl/KAE/struktura/ISiD/publikacje/Documents/Working... · Working Papers – Institute of Statistics and Demography [Nr 37/2013] 7 regarded](https://static.fdocuments.us/doc/165x107/5e7f151bde76a3470f08bf9b/working-papers-working-papers-a-institute-of-statistics-and-demography-nr-372013.jpg)