Department of Agriculture's Consolidated Financial Statements for ...
318
United States Department of Agriculture Of fce of Inspector General
Transcript of Department of Agriculture's Consolidated Financial Statements for ...

United States Department of Agriculture
Office of Inspector General

What Were OIG’s
Objectives
Our objective was to determine, as required, whether USDA’s consolidated financial statements are fairly presented in accordance with generally accepted accounting principles. Our objective was also to review USDA’s internal controls over financial reporting and test compliance with applicable laws and regulations.
What OIG Reviewed
To assess whether information in the underlying accounting records and other sources is reliable and sufficient to serve as the basis of USDA’s financial statements, we attempted to perform tests at the financial offices of various USDA agencies and offices in Washington, D.C., at USDA’s National Finance Center in New Orleans, Louisiana, and at selected agencies’ field offices.
What OIG Recommends
We recommend that the Office of the Chief Financial Officer provide additional oversight to ensure that real property is accounted for properly. We also provided recommendations to improve controls over one financial system.
OIG was engaged to audit USDA’s consolidated financial statements for fiscal years 2015 and 2014, and also assessed internal controls over financial reporting and compliance with laws and regulations. What OIG Found The Office of Inspector General (OIG) was not able to obtain sufficient appropriate audit evidence to provide a basis for an audit opinion, and therefore did not express an opinion on U.S. Department of Agriculture’s (USDA) consolidated financial statements for fiscal year 2015. The report contains a disclaimer of opinion for fiscal year 2015.
OIG’s review of USDA’s internal controls over financial reporting identified four significant deficiencies, two of which are material weaknesses. Specifically, four of USDA’s component agencies need to make further improvements to their internal controls over financial reporting. Also, USDA needs to improve its information technology (IT) security and controls, as many long-standing weaknesses remain. Moreover, USDA needs to improve its controls over financial reporting, as our review again disclosed deficiencies related to obligations and abnormal year-end balances. Additionally, this finding discusses that real property costs were not always properly classified. The final significant deficiency we identified relates to deviations in IT controls over one financial system. Additionally, this report includes a finding related to USDA’s lack of substantial compliance with the Federal Financial Management Improvement Act of 1996, and a finding related to violations of the Anti-Deficiency Act.
The Department concurred with our findings and generally agrees with our recommendations. It states that it will develop corrective action plans with milestones to address the findings within 60 days.
Department of Agriculture’s
Consolidated Financial Statements for Fiscal Years 2015 and 2014
Audit Report 50401-0009-11


United States Department of Agriculture
Office of Inspector General
Washington, D.C. 20250
DATE: February 12, 2016
AUDIT NUMBER: 50401-0009-11 TO: Jon Holladay Chief Financial Officer Office of the Chief Financial Officer ATTN: Peggy Javery
FROM: Phyllis K. Fong Inspector General
SUBJECT: Department of Agriculture’s Consolidated Financial Statements for Fiscal Years 2015 and 2014
This report presents the results of our audits of the Department of Agriculture’s consolidated financial statements for the fiscal years ending September 30, 2015 and 2014. The report contains a disclaimer of opinion on the financial statements, as well as the results of our assessment of the Department’s internal control over financial reporting and compliance with laws and regulations. Your response is included in its entirety in Exhibit D.
In accordance with Departmental Regulation 1720-1, please furnish a reply within 60 days describing the corrective actions taken or planned, and timeframes for implementing the recommendations for which management decisions have not been reached. Please note that the regulation requires management decision to be reached on all recommendations within 6 months from report issuance, and final action to be taken within 1 year of each management decision to prevent being listed in the Department’s annual Agency Financial Report.
We appreciate the courtesies and cooperation extended to us by members of your staff during our audits. This report contains publicly available information and will be posted in its entirety to our website http://www.usda.gov/oig in the near future.


Table of Contents
Independent Auditor’s Report .............................................................................. 1
Report on the Financial Statements ............................................................. 1
Basis for Disclaimer of Opinion ................................................................... 2
Other Matters ................................................................................................. 2
Report on Internal Control Over Financial Reporting ............................. 3
Report on Compliance and Other Matters ................................................. 4
Purpose of the Report on Internal Control Over Financial Reporting and the Report on Compliance and Other Matters ................................... 6
Section 1: Material Weaknesses in Internal Control Over Financial Reporting ............................................................................................................... 7
Finding 1: Improvements are Needed in Overall Financial Management ................................................................................................... 7
Finding 2: Improvements are Needed in Overall Information Technology Security Program ...................................................................... 8
Section 2: Significant Deficiency in Internal Control Over Financial Reporting ............................................................................................................... 9
Finding 3: Controls Over Financial Reporting Can Be Strengthened .... 9
Recommendation 1 ................................................................................11
Finding 4: Information Technology Controls Can Be Strengthened in One Financial System ..................................................................................12
Recommendation 2: ...............................................................................14
Recommendation 3: ...............................................................................14
Recommendation 4: ...............................................................................14
Recommendation 5: ...............................................................................14
Section 3: Noncompliance with Laws and Regulations .................................15
Finding 5: Lack of Substantial Compliance with FFMIA Requirements .......................................................................................................................15
Finding 6: Antideficiency Act Violations .................................................16
Abbreviations ........................................................................................................18
Exhibit A: Summary of Open Recommendations from Prior Years .............19

Exhibit B: Status of Prior Year Material Weaknesses and Significant Deficiencies ............................................................................................................21
Exhibit C: Status of Prior Year Noncompliance Findings ..............................22
Exhibit D: Agency Response ...............................................................................23
Exhibit E: Agency Financial Report ..................................................................24
Independent Auditor’s Report
AUDIT REPORT 50401-0009-11 1
Jon M. Holladay Chief Financial Officer Office of the Chief Financial Officer
The U.S. Department of Agriculture’s (USDA) Office of Inspector General (OIG) was engaged to audit the consolidated financial statements of the Department for fiscal years 2015 and 2014. We also considered USDA’s internal control over financial reporting and tested USDA’s compliance with certain provisions of applicable laws, regulations, contracts, and grant agreements that could have a direct and material effect on these consolidated financial statements.
The “Findings and Recommendations” section presents the material weaknesses and significant deficiencies in internal control and instances of noncompliance with laws and regulations, as of and for the year ended September 30, 2015. Exhibit A summarizes the current year status of prior years’ open audit recommendations. Exhibit B shows the status of prior year internal control weaknesses. Exhibit C provides an update to previously reported instances of noncompliance with laws and regulations. USDA’s response is presented in its entirety in Exhibit D.
Report on the Financial Statements We were engaged to audit the accompanying consolidated financial statements of USDA, which comprise the consolidated balance sheets as of September 30, 2015 and 2014, and the related consolidated statements of net cost and changes in net position; and the combined statements of budgetary resources for the fiscal years then ended, and the related notes to the financial statements (hereinafter referred to as the “consolidated financial statements”).
Management’s Responsibility for the Financial Statements
Management is responsible for the preparation and fair presentation of these consolidated financial statements in accordance with accounting principles generally accepted in the United States of America (U.S.); and the design, implementation, and maintenance of internal control relevant to the preparation and fair presentation of consolidated financial statements that are free from material misstatement, whether due to fraud or error. Auditor’s Responsibility Our responsibility is to express an opinion on these financial statements based on conducting our audits in accordance with auditing standards generally accepted in the U.S.; the standards applicable to financial audits contained in government auditing standards, issued by the Comptroller General of the U.S.; and the Office of Management and Budget (OMB) Bulletin 15-02, Audit Requirements for Federal Financial Statements. As explained in the Basis for Disclaimer of Opinion paragraph, however, we were not able to obtain sufficient appropriate audit evidence to provide a basis for an audit opinion for fiscal year 2015. (For fiscal year 2014, we reported that, in our opinion, USDA’s consolidated financial statements were fairly presented in all material respects.)

Basis for Disclaimer of Opinion
USDA, specifically the Commodity Credit Corporation (CCC), was unable to provide adequate evidential matter in support of certain transactions and account balances, as presented in its consolidated financial statements as of and for the year ended September 30, 2015. The financial statement line items impacted by the lack of adequate evidential matter included, but were not limited to: recoveries of prior year unpaid obligations; spending authority; obligations incurred; direct loans and loan guarantees, net; other liabilities public and intragovernmental; and gross costs. As a result, we were unable to complete certain tests of transactions and balances that we considered necessary to complete the audit of the financial statements for fiscal year 2015. Disclaimer of Opinion
Because of the significance of the matter described in the Basis for Disclaimer of Opinion paragraph, we have not been able to obtain sufficient appropriate audit evidence to provide a basis for an audit opinion. Accordingly, we do not express an opinion on the financial statements for fiscal year 2015.
Other Matters
Required Supplementary Information
U.S. generally accepted accounting principles require that the information in the Management’s Discussion and Analysis (MD&A), Required Supplementary Information, and Required Supplementary Stewardship Information sections be presented to supplement the basic financial statements. Such information, although not a part of the basic financial statements, is required by the Federal Accounting Standards Advisory Board, which considers it to be an essential part of financial reporting for placing the basic financial statements in an appropriate operational, economic, or historical context. We were unable to apply certain limited procedures to the required supplementary information in accordance with auditing standards generally accepted in the U.S. because of the significance of the matter described in the Basis for Disclaimer of Opinion paragraph. We do not express an opinion or provide any assurance on the information.
Other Information
Our engagement was conducted for the purpose of forming an opinion on the basic financial statements as a whole. The “Message from the Secretary” and the “Other Information” sections are presented for purposes of additional analysis, and are not a required part of the financial statements or the required supplementary information. This information has not been subjected to the auditing procedures applied in our engagement and, accordingly, we express no opinion on it and provide no assurance on it.
2 AUDIT REPORT 50401-0009-11

Other Reporting Required by Government Auditing Standards
Report on Internal Control Over Financial Reporting
In connection with our engagement to audit the financial statements, we considered USDA’s internal control over financial reporting (internal control) to determine the audit procedures that are appropriate in the circumstances for the purpose of expressing our opinion on the financial statements, but not for the purpose of expressing an opinion on the effectiveness of USDA’s internal control or on management’s assertion on the internal control included in the MD&A. Accordingly, we do not express an opinion on the effectiveness of USDA’s internal control or on management’s assertion on internal control included in the MD&A. We did not test all internal controls relevant to operating objectives as broadly defined by the Federal Managers’ Financial Integrity Act of 1982 (FMFIA). Our consideration of the internal control was for the limited purposes described in the preceding paragraph and was not designed to identify all deficiencies in the internal control over financial reporting that might be significant deficiencies or material weaknesses and, therefore, material weaknesses or significant deficiencies may exist that were not identified.
A deficiency in internal control exists when the design or operation of a control does not allow management or employees, in the normal course of performing their assigned functions, to prevent, or detect and correct, misstatements on a timely basis. A material weakness is a deficiency or a combination of deficiencies, in internal control, such that there is a reasonable possibility that a material misstatement of USDA’s consolidated financial statements will not be prevented, or detected and corrected, on a timely basis. A significant deficiency is a deficiency, or combination of deficiencies, in internal control that is less severe than a material weakness, yet important enough to merit attention by those charged with governance. In our fiscal year 2015 engagement, we noted certain matters involving the internal control that we consider to be significant deficiencies. Specifically, we identified weaknesses in USDA’s:
· overall financial management, · information technology (IT) security program, · controls over financial reporting, and · IT controls in one financial system.
We determined that the first two deficiencies are also material weaknesses. These deficiencies are discussed in this report in the “Findings and Recommendations,” Sections 1 and 2. Also, as required by OMB Bulletin 15-02, we compared the material weaknesses identified in the audit with those material weaknesses included in USDA’s FMFIA Report on Management Control that relate to financial reporting. We noted no exceptions.
AUDIT REPORT 50401-0009-11 3

Additional deficiencies in internal control over financial reporting, potentially including additional material weaknesses and significant deficiencies might have been identified and reported had we been able to perform all procedures necessary to express an opinion on USDA’s consolidated financial statements.
Report on Compliance and Other Matters
As part of our engagement to audit USDA’s consolidated financial statements, we performed tests of USDA’s compliance with certain provisions of laws, regulations, contracts, grant agreements, and Governmentwide policy requirements, noncompliance with which could have a direct and material effect on the determination of the consolidated financial statement amounts. However, providing an opinion on compliance with those provisions was not an objective of our audit and, accordingly, we do not express such an opinion.
We also performed tests of USDA’s compliance with certain provisions referred to in Section 803(a) of the Federal Financial Management Improvement Act of 1996 (FFMIA). Our tests disclosed instances, described in more detail in Finding 5 in the “Findings and Recommendations,” Section 3, of this report, where USDA was not substantially compliant with Federal Financial Management System Requirements (FFMSR), applicable Federal Accounting Standards, and the U. S. Standard General Ledger (SGL) at the transaction level. Providing an opinion on FFMIA was not an objective of our engagement and, accordingly, we do not express such an opinion.
Also, as discussed in Finding 6 of the “Findings and Recommendations,” Section 3, of this report, our tests disclosed instances of noncompliances with the Anti-Deficiency Act (ADA); some of these ADA violations are still in the process of being reported to Congress and the President.
Additionally, during fiscal year 2015, we identified instances of noncompliance with the requirements of the Improper Payments Elimination and Recovery Act of 2010 (IPERA), and the Improper Payments Elimination and Recovery Improvement Act of 2012 (IPERIA), regarding the design of program internal controls related to reporting improper payments. A separate report will be issued with further details on the Department’s compliance with improper payment requirements.
4 AUDIT REPORT 50401-0009-11
1
Management’s Responsibility for Internal Control and Compliance
USDA’s management is responsible for (1) evaluating the effectiveness of internal control over financial reporting based on criteria established under FMFIA, (2) providing a statement of assurance on the overall effectiveness of internal control over financial reporting, (3) ensuring USDA’s financial management systems are in substantial compliance with FFMIA requirements, and (4) ensuring compliance with other applicable laws, regulations, contracts, and grant agreements.
1 IPERA and IPERIA amended the Improper Payments Information Act of 2002, Public Law 107-300. These three laws address improper payment requirements.

Auditor’s Responsibilities We are responsible for: (1) obtaining a sufficient understanding of internal control over financial reporting and compliance to plan the audit, (2) testing whether USDA’s financial management systems substantially comply with FFMIA requirements referred to above, and (3) testing compliance with certain provisions of laws, regulations, contracts, and grant agreements that have a direct and material effect on the financial statements and applicable laws.
We did not evaluate all internal controls relevant to operating objectives as broadly established by FMFIA, such as those controls relevant to preparing statistical reports and ensuring efficient operations. We limited our internal control testing to testing controls over financial reporting and compliance. Because of inherent limitations in internal control, misstatements due to error or fraud, losses, or noncompliance may nevertheless occur and not be detected. We also caution that projecting our audit results to future periods is subject to risk that controls may become inadequate because of changes in conditions or that the degree of compliance with controls may deteriorate. In addition, we caution that our internal control testing may not be sufficient for other purposes.
We did not test compliance with all laws, regulations, contracts, and grant agreements applicable to USDA. We limited our tests of compliance to certain provisions of laws, regulations, contracts, and grant agreements that have a direct and material effect on the financial statements that we deemed applicable to USDA’s consolidated financial statements for the fiscal year ended September 30, 2015. We caution that noncompliance may occur and not be detected by these tests and that such testing may not be sufficient for other purposes. Also, our work on FFMIA would not necessarily disclose all instances of noncompliance with FFMIA requirements.
Additional instances of noncompliance with certain provisions of laws, regulations, contracts, and grant agreements, might have been identified and reported herein had we been able to perform all procedures necessary to express an opinion on USDA’s consolidated financial statements. Management’s Response
Management’s response to the report is presented in Exhibit D. We did not audit USDA’s response and, accordingly, we express no opinion on it. Status of Prior Year’s Findings and Recommendations We reviewed the status of open recommendations from prior years, prior year internal control deficiencies, and prior year noncompliance issues. The status of these items is presented in Exhibits A, B, and C.
AUDIT REPORT 50401-0009-11 5

Purpose of the Report on Internal Control Over Financial Reporting and the Report on Compliance and Other Matters The purpose of the “Report on Internal Control Over Financial Reporting” and the “Report on Compliance and Other Matters” sections of this report is solely to describe the scope of our testing of internal control and compliance and the result of that testing, and not to provide an opinion on the effectiveness of USDA’s internal control or on compliance. Accordingly, these reports are not suitable for any other purpose.
6 AUDIT REPORT 50401-0009-11
Phyllis K. Fong Inspector General
Washington, D.C. February 11, 2016

Findings and Recommendations
Section 1: Material Weaknesses in Internal Control Over Financial Reporting
AUDIT REPORT 50401-0009-11 7
Finding 1: Improvements are Needed in Overall Financial Management
As described in the “Basis for Disclaimer” section of our preceding Independent Auditor’s Report, we disclaimed an opinion on USDA’s fiscal year 2015 financial statements because USDA was unable to provide adequate evidential matter in support of certain transactions and balances. In conducting our review, we noted the following areas where improvements are needed in overall financial management.
· Two components of USDA’s financial reporting (Commodity Credit Corporation (CCC) and Natural Resources Conservation Service (NRCS)) were unable to support certain transactions and balances.
· USDA needs to improve controls related to developing and documenting selected estimates relating to insurance loss claims and two loan programs.
· One component of USDA’s financial reporting, CCC, is unable to record obligations at the transaction level.
In its FMFIA Report on Management Control for fiscal year 2015, the Department reported a material weakness for overall financial management. Details follow.
· For NRCS, the Department plans to complete corrective actions during fiscal year 2016 to ensure that NRCS can provide sufficient evidential matter in support of certain transactions and balances.
· During fiscal year 2016 CCC will develop corrective action plans to address weaknesses in financial reporting, accounting for parent/child transactions, and accounting for budgetary transactions.
· Regarding estimates for insurance losses, during fiscal year 2016 USDA’s Risk Management Agency/Federal Crop Insurance Corporation will develop control procedures over program code to ensure that variables are input correctly and computing accurately.
· USDA’s Rural Development analyzed prepayments during fiscal year 2015 for one loan program. During fiscal year 2016, it plans to continue developing and documenting an econometric model for a second loan program, as well as perform an independent review of the model.
In its FMFIA Report on Management Control for 2015, the Department reported a system nonconformance for CCC’s reporting of obligations at the transaction level. CCC will continue to modernize and improve program and financial systems in order to record obligations at the transaction level. CCC plans to complete corrective actions during fiscal year 2017.
Because USDA has actions planned and in progress, we are making no further recommendations herein.

Finding 2: Improvements are Needed in Overall Information Technology Security Program
As required by the Federal Information Security Modernization Act of 2014 (FISMA), OIG reviewed USDA’s ongoing efforts to improve its IT security program and practices as of fiscal year 2015.
8 AUDIT REPORT 50401-0009-11
2
We found that, although USDA continued to improve the security posture of its IT infrastructure and associated data, many longstanding weaknesses remain. In fiscal years 2009 through 2014, OIG made 57 recommendations for improving the overall security of USDA’s systems, but agreed upon corrective actions have been implemented for only 31 of those recommendations. Security weaknesses still exist in 3 of the 31 closed recommendations. We noted the Office of the Chief Information Officer (OCIO) is taking positive steps to improve its security posture. For example, OCIO has improved its incident response and Risk Management Framework. However, the agencies included in this review have not implemented all of the requirements for security training, remote access management, and contingency planning. It is now critical that agencies create and implement agency-specific procedures to ensure compliance with USDA policy and improve its security posture in the future.
Again this year, we continue to report weaknesses in USDA’s IT security. The Department has not (1) performed an assessment of the skills, knowledge, and resources needed to effectively implement an Information Security Continuous Monitoring (ISCM) Strategic Plan; (2) defined or formally documented within the ISCM Strategic Plan the organization’s process for collecting and considering lessons learned to improve ISCM processes; and (3) developed policies and procedures for remote access and teleworking that comply with National Institute of Standards and Technology (NIST) guidance.
In its FMFIA Report on Management Control, the Department again reported an overall IT material weakness relating to deficiencies in the internal control design and operating effectiveness for logical access controls/personnel security and configuration management.
The Department continues to plan, as it did last year, to complete corrective actions in fiscal year 2016.3 Because of recommendations made in our FISMA audits, we are making no further recommendations in this report.
2 Federal Information Security Modernization Act (November 2015). 3 Last year, our report noted that the Department changed its planned completion of corrective actions from fiscal year 2014 to 2016.
Report 50501-0008-12, U.S. Department of Agriculture, Office of the Chief Information Officer, Fiscal Year 2015
Section 2: Significant Deficiency in Internal Control Over Financial Reporting
AUDIT REPORT 50401-0009-11 9
Finding 3: Controls Over Financial Reporting Can Be Strengthened
During our engagement, we noted that controls relating to certain financial management practices could be strengthened to operate more effectively throughout the fiscal year. Details follow.
· Last year, our report identified deficiencies with controls over inactive Unliquidated Obligations (ULO).4 This year, our review disclosed that additional improvements are needed for selected agencies. We statistically selected 100 ULOs from 14 agencies and offices for which no activity had occurred for over 1 year, as of March 31, 2015. We found that seven ULOs from two agencies5 were invalid because no future expenditures were expected or because there were adjustments that lacked support. We also found one ULO which was valid but should have been paid off in a prior fiscal year had it been properly monitored.
We nonstatistically selected three agencies and reviewed their obligation certifications submitted to the Department for the third quarter of fiscal year 2015. To assess the appropriateness of the ULO certifications, we then selected 10 obligation balances nonstatistically from each of the three certifications. We found that one agency (FAS) inappropriately certified to the validity of the ULO balances, i.e., 8 of the 10 selected balances were invalid.
The U.S. Department of the Treasury’s (Treasury) annual closing guidance (Treasury Bulletin 2015-07, 2015 Yearend Closing, dated July 31, 2015), requires an annual review of ULOs. Departmental Regulation (DR) 2230-1, Reviews of Unliquidated Obligations, dated October 15, 2014, further requires quarterly reviews and certifications as to the validity of ULO balances from agency Chief Financial Officers (CFO).
Ineffective monitoring and reviewing, as well as inappropriate certifying to the validity of obligation balances, resulted in invalid obligations remaining open. Invalid obligations improperly restrict the availability of funding authority. This also increases the risk of misstating obligations as of yearend.
· Last year, we determined that controls over financial reporting were not adequate to ensure FAS funds were spent for the purposes intended by Congress. On October 3, 2014, FAS informed OIG of a potential ADA violation relating to fiscal year 2009. Specifically, FAS had a negative fund balance with Treasury exceeding $3 million, which potentially indicated that FAS had exceeded authorized spending levels by the amount of the negative balance. FAS indicated it had been researching this situation, with the Office of the Chief Financial Officer (OCFO), for several months.
4 An obligation is a binding agreement that will result in outlays, immediately or in the future. Budgetary resources must be available before obligations can be incurred legally. 5 Foreign Agriculture Service (FAS) and Agricultural Research Service (ARS).

OIG reviewed FAS’ fund balances at the end of fiscal year 2014. In addition to the negative fund balance described above, we identified four other negative amounts for fund balance with Treasury. FAS could not provide sufficient information in a timely manner to explain how these negative balances occurred and if they also represented potential ADA violations. FAS indicated that it would provide more definitive information when it completed its research in December 2014.
At the end of fiscal year 2015, OIG reviewed the five FAS fund balance with Treasury accounts that were negative at fiscal yearend 2014. OIG noted that three of the accounts no longer reflected a negative balance. This year, our review disclosed additional improvements were needed for FAS’ controls of financial reporting. On November 4, 2015, FAS provided an update to OIG regarding a potential ADA violation relating to fiscal year 2009, with a negative fund balance with Treasury exceeding $3 million. FAS’ findings included three primary causes for the negative cash position: foreign exchange rate fluctuation; payments for goods and services previously posted to the incorrect account; and erroneous posting to the separation liability account. In addition to this negative fund balance, we identified one new negative amount for fund balance with Treasury, and one repeat negative amount for fund balance with Treasury. FAS could not provide a definitive answer to OMB and Treasury in a timely manner to explain how these two negative balances occurred and indicated research would continue.
The Department is still in the process of completing corrective actions on a prior recommendation regarding FAS issues; so no further recommendation is made herein.
· Our review again disclosed abnormal balances
10 AUDIT REPORT 50401-0009-11
6 in USDA’s fiscal year end trial balance that were not fully researched and corrected. For fiscal year 2015, we noted 23 abnormal balances with an absolute value of approximately $548 million. According to the Department, the existence of an abnormal balance indicates that transactions or adjustments may have been posted in error. In addition, abnormal balances increase the risk of material misstatement on the financial statements. The Department is still in the process of completing actions on a prior recommendation concerning abnormal balances; therefore, no further recommendation is made in this report. · Our review of real property balances and transactions disclosed that depreciation expenses were not always properly recorded and real property costs were not always properly classified. Details follow:
o Depreciation expenses were incorrectly and irregularly posted in the real property system during fiscal years 2014 and 2015. We noted that all 20 samples had more than 12 months of depreciation expenses posted in fiscal year 2015, and less than 12 months of depreciation expenses posted in fiscal year 2014. This occurred due to the inadvertent creation of duplicate files in the real property system.
6 A balance that deviates from the standard balance as defined by Treasury’s SGL.

o We determined that 52 value streams
AUDIT REPORT 50401-0009-11 11
7 belonging to one agency (Forest Service (FS)) had accumulated depreciation exceeding capitalized value. This occurred due to an error in system conversion.
o One agency (ARS) estimated that it improperly expensed about $30 million of major improvements to a capitalized asset that should have been capitalized according to the USDA Directive.8 ARS indicated that it posted in accordance with conflicting internal guidance which it was unable to provide during the course of the engagement.
As a result of the last item, ARS’ operating expenses were misstated by roughly $30 million over various fiscal years. OCFO took steps to correct the first two items.
Recommendation 1 Provide oversight to ensure that real property is accounted for appropriately, including its classification and depreciation expenses.
7 The property system accounts for an asset throughout its lifespan by using logical groupings of transactions referred to as value streams. 8 USDA DR 2200-002, Property, Plant and Equipment, dated April 2, 2013.

Finding 4: Information Technology Controls Can Be Strengthened in One Financial System
Last year, we reviewed application controls related to two financial systems, the Corporate Property Automated Information System (CPAIS) and the Financial Management Modernization Initiative (FMMI). Asset acquisition, depreciation, disposal, and other needed data elements are recorded in CPAIS; while FMMI is a web-based accounting and ledger system. OCFO is the owner of both systems. We noted that controls over the management of access accounts and corrective actions could be further strengthened in both systems. Additionally, we noted that changes were sometimes implemented to FMMI without first completing required testing. Our review this year disclosed that appropriate corrective actions had been completed. This year, we assessed additional application controls in FMMI. We found that controls over logged access authority (LAA),
12 AUDIT REPORT 50401-0009-11
9 passwords, and segregation of duties could be strengthened. Additionally, we noted inconsistencies in the inventory of FMMI interconnections and interfaces reflected in the System Security Plan (SSP) and Cyber Security Assessment and Management (CSAM) tool.
Our review disclosed that OCFO’s procedures for managing privileged access via logged access authority need improvements. The FMMI Process for Managing Temporary Logged Authority Access sets forth guidance on the approval process and requires monitors to review and approve the actions performed during a LAA session. We nonstatistically selected 30 LAA sessions for review.
· We found that access to perform all 30 sessions was authorized. However, the multistep approval process described in the procedures was not followed for six sessions where permanent LAA was used. We noted that the current procedures do not address the procedures that personnel should follow to invoke LAA sessions (permanent LAA). According to OCFO, The FMMI Process for Managing Temporary Logged Authority Access procedures were written to address the process for users who had not been authorized to invoke LAA sessions, but need to do so on a temporary basis (temporary LAA). Users with permanent LAA had been previously authorized to invoke LAA as part of their access roles, which are approved quarterly as part of the certification process; therefore, LAA sessions invoked by users with permanent LAA do not require approval prior to invoking the sessions.” In discussions with OCFO management, OCFO agreed to revise existing procedures to make a clear distinction between temporary and permanent LAA.
· The monitoring activities required by the procedures were not performed within a consistent timeframe. It took an average of 108 days for the monitoring to occur. Only 5 samples were approved by the monitor within 30 days of execution. An additional 9 samples were approved by the monitor within 90 days, 11 samples within 180 days, and 5 samples within 319 days.
We also noted that password settings in one FMMI production instance and system specific password procedures were not consistent with USDA DRs for password expiration and history. 9 Users occasionally require elevated access to perform tasks outside of their normal job duties. Within FMMI, this is referred to as LAA.
USDA DR 3505-003
AUDIT REPORT 50401-0009-11 13
10 requires agencies to ensure that password standards are consistent with the most current United States Government Configuration Baseline (USGCB) standard settings. USGCB standard settings for passwords require a minimum length of 12 characters, passwords must meet complexity requirements, the previous 24 passwords may not be reused, passwords must be changed every 60 days, and the minimum password age must be 1 day. However, we found that two of five password requirements were not set as stringently as the USDA requirement11 on one system. However this system cannot be accessed unless the user has already authenticated through another system that does enforce all five USDA password requirements. OCFO corrected the password settings in August 2015, and agreed to correct system procedures as well. Additionally, we found OCFO’s documentation for managing segregation of duty risks needs improvement. OCFO uses a risk analysis tool that contains a global rule set of segregation of duty violations for FMMI. The FMMI Concept of Operations12 requires security administrators to perform a risk analysis during the final stage of the role approval process and segregation of duty risks should be mitigated by the security administrator by applying a mitigating control. “Provisioning through Governance, Risk, and Compliance13 will not be complete without mitigation.” However, we found the risk analysis tool identified 24 users that appeared to have segregation of duty risks without mitigating controls applied. Based on subsequent discussions with OCFO, we determined that these risks were actually mitigated by system controls, change management controls, or detective manual controls, or are not applicable to the FMMI environment. OCFO did develop and implement a mitigating control for these risks in August 2015, but this mitigating control focused only on manual detective controls performed after the fact and not preventative controls or consideration of applicability of the risk in the FMMI environment.
We also noted that the “Interconnections” table reported in the System Security Plan (SSP) and CSAM tool reports a combination of system interconnections and interfaces; however, this inventory was inaccurate as it included one discontinued system interconnection (with the Office of the Chief Information Officer National Information Technology Center) and did not include interfaces with two systems. USDA DR14 and NIST guidance15 require system interconnections to be reported in the SSP and CSAM; additionally, NIST Special Publication (SP) 800-4716 recommends that the security plans include information regarding the system interconnection and other interconnections, if appropriate.
10 USDA DR3505-003, Access Control for Information and Information Systems, dated February 2015. 11 Password expiration was set at 90 days rather than 60 and password history at 6 rather than 24. 12 FMMI Concept of Operations, dated October 2014. 13 Centralization of Account Provisioning: Improving the Present and Planning for the Future, Ernestine Poling; SANS Institute, 2000, p.1, defines account provisioning as generation and maintenance of user accounts for platform and application access. 14 USDA DR 3540-003, Security Assessment and Authorization, dated September 12, 2014. 15 NIST SP 800-18, Guide for Developing Security Plans for Federal Information Systems, Revision 1, dated February 2006 and NIST SP 800-65, Integrating IT Security into the Capital Planning and Investment Control Process, Version 1, dated January 2005. 16 NIST SP 800-47, Security Guide for Interconnecting Information Technology Systems: Recommendations of the National Institute of Standards and Technology, dated August 2002.

These conditions occurred because OCFO technical staff distinguished between temporary and permanent LAA but documented procedures did not address both. Additionally, LAA procedures lacked timeframes for required monitoring activities. Furthermore, system specific password procedures had not been updated to reflect current USDA requirements. The production instance with inadequate password settings was built for OCFO by a contractor and OCFO accepted and implemented this instance into production without performing adequate checks of password configuration settings. OCFO’s global rule set of segregation of duty violations identified false positives and documentation such as mitigating controls did not exist to explain why the risks are not applicable to the FMMI environment. According to OCFO, “while agencies are permitted to enter other connections into the table only true interconnections are required.” As a result, FMMI faces increased risk of misuse that may not be detected in a timely manner. Additionally, the Department’s management of FISMA activities may be impaired due to CSAM inaccuracies.
Recommendation 2:
Revise logged access authority (LAA) procedures to address approvals for permanent LAA and to include timeframes and enforcement actions requiring the monitoring activities to be completed within a defined number of days. Recommendation 3:
Update system specific procedures to reflect current National Institute of Standards and Technology (NIST) and USDA requirements for password settings.
Recommendation 4:
Revise and/or develop mitigating controls that fully reflect applicability of the risks in the Financial Management Modernization Initiative (FMMI) environment, preventative mitigations associated with system and change management controls, and detective manual controls performed.
Recommendation 5:
Revise the System Security Plans (SSP) and Cyber Security Assessment and Management (CSAM) interconnections tables to accurately reflect current system interconnections and interfaces.
14 AUDIT REPORT 50401-0009-11

Section 3: Noncompliance with Laws and Regulations
AUDIT REPORT 50401-0009-11 15
Finding 5: Lack of Substantial Compliance with FFMIA Requirements
FFMIA requires agencies to annually assess whether their financial management systems comply substantially with (1) FFMSR, (2) applicable Federal accounting standards, and (3) SGL at the transaction level. In addition, FISMA requires each agency to report significant information security deficiencies, relating to financial management systems, as a lack of substantial compliance under FFMIA. FFMIA also requires auditors to report in their CFO Act financial statement audit reports whether financial management systems substantially comply with FFMIA’s system requirements.
During fiscal year 2015, USDA evaluated its financial management systems to assess compliance with FFMIA. The Department reported that it was not compliant with FFMSR, applicable accounting standards, the SGL at the transaction level, and FISMA requirements. As noted in its MD&A, USDA continues its work to meet the FFMIA and FISMA objectives.
Specifically, in its FFMIA and FMFIA reports, the Department reported internal control design and operating effectiveness deficiencies with logical access controls/personnel security and configuration management. Please see Finding 2 of this report for more details. Additionally, in its FFMIA report, the Department noted noncompliances for two of its component agencies relating to financial management, described below.
1. CCC was not compliant with applicable Federal accounting standards and SGL at the transaction level. CCC is working to implement programs into its fully integrated funds control system by September 30, 2017. CCC initially planned to have this completed by September 30, 2014. CCC intends to develop corrective action plans to address non compliances with Federal accounting standards and complete corrective actions by September 30, 2016.
2. NRCS was not compliant with applicable Federal accounting standards and SGL at the transaction level. Corrective actions are scheduled for completion by September 30, 2016. (NRCS previously planned to have this completed by November 30, 2013, but in last year’s FFMIA report revised the date to September 30, 2016).
Please see Finding 1 of this report for more details on the NRCS and CCC issues.
Because of planned actions, we are making no further recommendations in this report.
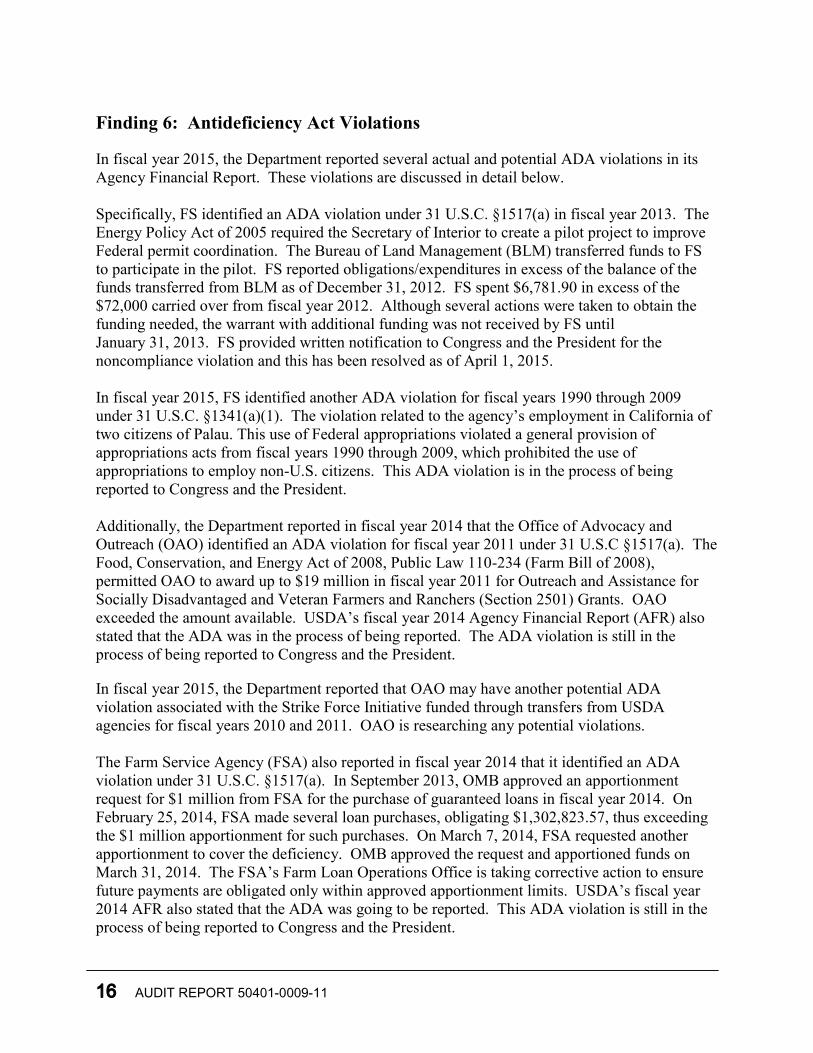
Finding 6: Antideficiency Act Violations
In fiscal year 2015, the Department reported several actual and potential ADA violations in its Agency Financial Report. These violations are discussed in detail below.
Specifically, FS identified an ADA violation under 31 U.S.C. §1517(a) in fiscal year 2013. The Energy Policy Act of 2005 required the Secretary of Interior to create a pilot project to improve Federal permit coordination. The Bureau of Land Management (BLM) transferred funds to FS to participate in the pilot. FS reported obligations/expenditures in excess of the balance of the funds transferred from BLM as of December 31, 2012. FS spent $6,781.90 in excess of the $72,000 carried over from fiscal year 2012. Although several actions were taken to obtain the funding needed, the warrant with additional funding was not received by FS until January 31, 2013. FS provided written notification to Congress and the President for the noncompliance violation and this has been resolved as of April 1, 2015.
In fiscal year 2015, FS identified another ADA violation for fiscal years 1990 through 2009 under 31 U.S.C. §1341(a)(1). The violation related to the agency’s employment in California of two citizens of Palau. This use of Federal appropriations violated a general provision of appropriations acts from fiscal years 1990 through 2009, which prohibited the use of appropriations to employ non-U.S. citizens. This ADA violation is in the process of being reported to Congress and the President.
Additionally, the Department reported in fiscal year 2014 that the Office of Advocacy and Outreach (OAO) identified an ADA violation for fiscal year 2011 under 31 U.S.C §1517(a). The Food, Conservation, and Energy Act of 2008, Public Law 110-234 (Farm Bill of 2008), permitted OAO to award up to $19 million in fiscal year 2011 for Outreach and Assistance for Socially Disadvantaged and Veteran Farmers and Ranchers (Section 2501) Grants. OAO exceeded the amount available. USDA’s fiscal year 2014 Agency Financial Report (AFR) also stated that the ADA was in the process of being reported. The ADA violation is still in the process of being reported to Congress and the President.
In fiscal year 2015, the Department reported that OAO may have another potential ADA violation associated with the Strike Force Initiative funded through transfers from USDA agencies for fiscal years 2010 and 2011. OAO is researching any potential violations.
The Farm Service Agency (FSA) also reported in fiscal year 2014 that it identified an ADA violation under 31 U.S.C. §1517(a). In September 2013, OMB approved an apportionment request for $1 million from FSA for the purchase of guaranteed loans in fiscal year 2014. On February 25, 2014, FSA made several loan purchases, obligating $1,302,823.57, thus exceeding the $1 million apportionment for such purchases. On March 7, 2014, FSA requested another apportionment to cover the deficiency. OMB approved the request and apportioned funds on March 31, 2014. The FSA’s Farm Loan Operations Office is taking corrective action to ensure future payments are obligated only within approved apportionment limits. USDA’s fiscal year 2014 AFR also stated that the ADA was going to be reported. This ADA violation is still in the process of being reported to Congress and the President.
16 AUDIT REPORT 50401-0009-11

FAS identified a violation of the ADA that may have occurred in its fiscal year 2009 appropriation. FAS has completed its analyses and identified the causes of this potential violation, and has requested a determination on the status of this potential ADA violation from the Office of the General Counsel.
Finally, the Department reported that OIG audited the Office of the Assistant Secretary for Civil Rights (OASCR) to determine whether (1) expenditures were properly supported by documentation; (2) unauthorized commitments were properly ratified by the Office of Procurement and Property Management; and there was (3) adherence to Federal legal authorities and DRs. The Department stated that OASCR will take appropriate action to make the determination of any potential ADA violations.
AUDIT REPORT 50401-0009-11 17

Abbreviations
18 AUDIT REPORT 50401-0009-11
ADA ............................ Anti-Deficiency Act AFR ............................. Agency Financial Report ARS ............................. Agricultural Research Service BLM ............................ Bureau of Land Management CCC............................. Commodity Credit Corporation CFO ............................. Chief Financial Officer CPAIS ......................... Corporate Property Automated Information System CSAM ......................... Cyber Security Assessment and Management DR ............................... Departmental Regulation FAS ............................. Foreign Agriculture Service FCIC ............................ Federal Crop Insurance Corporation FFMIA ........................ Federal Financial Management Improvement Act of 1996 FFMSR ........................ Federal Financial Management System Requirements FISMA ........................ Federal Information Security Modernization Act of 2014 FMFIA ........................ Federal Managers’ Financial Integrity Act of 1982 FMMI .......................... Financial Management Modernization Initiative FS ................................ Forest Service FSA ............................. Farm Service Agency ISCM ........................... Information Security Continuous Monitoring IPERA ......................... Improper Payments Elimination and Recovery Act of 2010 IPERIA ........................ Improper Payments Elimination and Recovery Improvement Act of 2012 IT ................................. information technology LAA ............................ logged access authority MD&A ........................ Management’s Discussion and Analysis NIST ............................ National Institute of Standards and Technology NRCS .......................... Natural Resources Conservation Service OAO ............................ Office of Advocacy and Outreach OASCR ....................... Office of the Assistant Secretary for Civil Rights OCFO .......................... Office of the Chief Financial Officer OIG ............................. Office of Inspector General OMB ........................... Office of Management and Budget RSI .............................. Required Supplementary Information SP ................................ Special Publication SGL ............................. Standard General Ledger SSP .............................. System Security Plans Treasury ...................... U.S. Department of the Treasury U.S. ............................. United States of America ULO ............................ Unliquidated Obligations USDA .......................... U.S. Department of Agriculture USGCB ....................... United States Government Configuration Baseline

Exhibit A: Summary of Open Recommendations from Prior Years
AUDIT REPORT 50401-0009-11 19
Report 50401-0007-11, Department of Agriculture’s Consolidated Financial Statements for Fiscal Years 2014 and 2013, dated December 18, 2014.
Finding 3: Controls Over Financial Reporting Can be Strengthened
Recommendation 1
Provide additional oversight to the Foreign Agricultural Service to ensure that controls over financial reporting are strengthened and maintained, including those over Unliquidated Obligations (ULOs) and transactions resulting in negative (abnormal) fund balances.
Departmental Status The estimated completion date is December 31, 2015. OIG Results
As discussed in Finding 3, this weakness continues to exist.

Exhibit A: Summary of Open Recommendations from Prior Years Report 50401-0003-11, Department of Agriculture’s Consolidated Financial Statements for Fiscal Years 2012 and 2011, dated November 14, 2012.
Finding 3: Controls Over Financial Reporting Can be Strengthened Recommendation 1 Continue to analyze the abnormal balances to identify and implement the actions needed to correct those balances, to include providing oversight to ensure reimbursable activities are timely billed for collection. Departmental Status
On March 6, 2013, OCFO issued OCFO Bulletin 13-01, Intra-Departmental Transactions Reconciliation, which updated policies and procedures for identifying, reconciling, and reporting intra-Departmental transactions to facilitate elimination of intra-Departmental balances and activity in the consolidated financial statements. During fiscal year 2013, OCFO reviewed staff offices’ billing and collection practices and made recommendations to ensure reimbursable activities are timely billed for collection. During fiscal year 2014, the Department continued providing guidance and training to staff offices. The original estimated completion date was June 30, 2013, and then revised to December 31, 2015. The recommendation remains open and a revised completion date has not been established.
OIG Results As discussed in Finding 3, this weakness continues to exist.
20 AUDIT REPORT 50401-0009-11

Exhibit B: Status of Prior Year Material Weaknesses and Significant Deficiencies
AUDIT REPORT 50401-0009-11 21
Control Deficiency 2014 Status 2015 Status Overall Financial
Management Material Weakness Material Weakness
Overall Information Technology Security Program Material Weakness Material Weakness
Financial Reporting Controls Significant Deficiency Significant Deficiency Information Technology
Controls17 Significant Deficiency Significant Deficiency
17 In fiscal year 2014, we reported weaknesses for two systems, FMMI and CPAIS. For fiscal year 2015, we are reporting weaknesses related to FMMI.

Exhibit C: Status of Prior Year Noncompliance Findings
22 AUDIT REPORT 50401-0009-11
Report 50401-0007-11, U.S. Department of Agriculture’s Consolidated Financial Statements for Fiscal Years 2014 and 2013, dated December 18, 2014.
Finding 5: Lack of Substantial Compliance with FFMIA Requirements
Reported Noncompliance
The Department reported a lack of substantial compliance with the FFMIA requirements. The Department reported that it was not compliant with FFMSR, applicable accounting standards, SGL at the transaction level, and FISMA requirements. Status
In fiscal year 2015, the Department continued to report substantial noncompliance with FFMSR, applicable accounting standards, SGL at the transaction level, and FISMA requirements, as discussed in Finding 5.
Finding 6: ADA Violation Reported Noncompliance In fiscal year 2014, the Department reported three ADA violations in its Agency Financial Report. Specifically, FS identified an ADA of $6,781.90 in excess of $72,000 carried over from fiscal year 2012. The ADA violation had been in the process of being reported to Congress and the President since fiscal year 2013. Additionally, FSA identified an ADA of $302,823.57 in excess of its $1 million apportionment for guaranteed loan purchases. OAO also identified an ADA that exceeded its $19 million outreach and assistance award. The FSA and OAO ADAs were in the process of being reported to Congress and the President.
Status
The FS ADA of $6,781.90 in excess of $72,000 carried over from fiscal year 2012 was reported to Congress and the President. The FSA and OAO ADAs are still in the process of being reported to Congress and the President. See Finding 6 of this report.

Exhibit D: Agency Response
AUDIT REPORT 50401-0009-11 23
USDA’S RESPONSE TO AUDIT REPORT


AN EQUAL OPPORTUNITY EMPLOYER
February 11, 2016
TO: Phyllis K. Fong
Inspector General Office of Inspector General
FROM: Jon M. Holladay /s/ Chief Financial Officer SUBJECT: Department of Agriculture’s Consolidated Financial Statements for
Fiscal Years 2015 and 2014
The Department is pleased to respond to your audit report on the Consolidated Financial Statements for fiscal years 2015 and 2014. We concur with the findings in the report. We generally agree with the recommendations in the report and will develop corrective action plans with milestones to address the findings within 60 days.
I would like to express my appreciation for the cooperation and professionalism displayed by your staff and your contract auditors during the course of your audit.
United States Department of Agriculture Office of the Chief Financial Officer 1400 Independence Avenue, SW
Washington, DC 20250


Exhibit E: Agency Financial Report
24 AUDIT REPORT 50401-0009-11
AGENCY FINANCIAL REPORT
FISCAL YEARS 2015 AND 2014 FINANCIAL STATEMENTS
PREPARED BY USDA SECTIONS 1 AND 3 ARE UNAUDITED


Blank Page
(Cover Back)

Non-Discrimination Statement
The U.S. Department of Agriculture (USDA) prohibits discrimination against its customers,
employees, and applicants for employment on the bases of race, color, national origin, age,
disability, sex, gender identity, religion, reprisal, and where applicable, political beliefs, marital
status, familial or parental status, sexual orientation; or whether all or part of an individual's
income is derived from any public assistance program; or protected genetic information in
employment or in any program or activity conducted or funded by the Department. (Not all
prohibited bases will apply to all programs and/or employment activities.)
To File an Employment Complaint If you wish to file an employment complaint, you must contact your agency's Equal Employment
Opportunity (EEO) Counselor within 45 days of the date of the alleged discriminatory act, event,
or in the case of a personnel action. Additional information can be found on the USDA Office of
the Assistant Secretary of Civil Rights website.
To File a Program Complaint To file a program discrimination complaint, please complete the USDA Program Discrimination
Complaint Form. You or your authorized representative must sign the complaint form. You are
not required to use the complaint form; you may write a letter instead. If you write a letter, it
must contain all of the information requested in the form and be signed by you or your
authorized representative. Incomplete information will delay the processing of your complaint.
Employment civil rights complaints will not be accepted through the email address below.
Persons with disabilities who require alternative means for communication of program
information (Braille, large print, audiotape, etc.) should contact USDA's TARGET Center at
(202) 720-2600 (voice and TDD).
Send your completed complaint form or letter to us by mail or fax, or email:
U.S. Department of Agriculture
Director, Office of Adjudication
1400 Independence Avenue, SW
Washington, DC 20250-9410
Fax
(202) 690-7442

About This Report
The purpose of the United States Department of Agriculture (USDA) Fiscal year (FY) 2015
Agency Financial Report (AFR) is to inform Congress, the President, and the American people
on how USDA has used Federal resources entrusted to the Department in 2015 in order to do the
following: expand economic opportunity through innovation; help rural America to thrive while
promoting agriculture production sustainability that better nourishes the population; and preserve
and conserve the Nation’s natural resources. USDA has demonstrated good stewardship of
financial resources by putting in place well controlled and managed business lines and financial
management systems and processes. USDA has chosen to produce both an AFR and an Annual
Performance Report (APR) for FY 2015. USDA will include its FY 2015 APR with its
Congressional Budget Justification and will post this AFR on the Department’s Web page.
This AFR provides high-level financial and highlighted performance results with assessments of
controls, a summary of challenges, and USDA stewardship information. The AFR enables the
President, Congress, and the public to assess USDA accomplishments and understand its
financial position. USDA’s end-of-fiscal-year financial position includes, but is not limited to,
financial statements, notes to the financial statements, and a report of the independent auditors.
The report satisfies the reporting requirements contained in the following laws and regulations:
Improper Payments Elimination and Recovery Act of 2010;
Improper Payments Elimination and Recovery Improvement Act of 2012 (IPERIA)
Government Performance and Results Act Modernization Act of 2010;
Improper Payments Information Act of 2002;
Reports Consolidation Act of 2000;
Government Management Reform Act of 1994;
Chief Financial Officers Act of 1990;
Federal Managers’ Financial Integrity Act of 1982;
Office of Management and Budget Circular A-123, Management’s Responsibility for
Internal Controls; and
Office of Management and Budget Circular A-136, Financial Reporting Requirements.
The APR is a detailed report on USDA’s progress toward achieving the goals and objectives
described in the Agency’s Strategic Plan and Annual Performance Plan, including progress on

the strategic objectives, performance goals, and Agency Priority Goals. The report will be
delivered to Congress with the annual budget submission.
This report is to be posted on these Web sites: Performance.gov and the USDA Performance
Improvement and Accountability at USDA Web page. Previous reports are posted as well.
Table of Contents
Message from Secretary Vilsack ......................................................................................................... i
Section I: Management’s Discussion and Analysis ............................................................................. 1
About USDA ............................................................................................................................... 1
USDA Mission Areas ................................................................................................................... 4
Strategic Plan and Program Performance .................................................................................. 6
Future Demands, Risks, Uncertainties, Events, Conditions, and Trends .................................. 14
Analysis of Financial Information and Highlights ..................................................................... 15
Statement of Assurance ........................................................................................................... 23
Federal Managers’ Financial Integrity Act Report on Management Control ........................... 25
Federal Financial Management Improvement Act Report on Financial Management Systems .............................................................................................. 37
Financial Management Systems Strategy ................................................................................ 40
Other Management Information, Initiatives, and Issues: ........................................................ 44
Section II: Financial Information ...................................................................................................... 47
Message from Chief Financial Officer ...................................................................................... 47
Independent Auditors Report .................................................................................................. 49
Agency Response to Auditors Report ...................................................................................... 50
Consolidated Financial Statements .......................................................................................... 51
Notes to the Consolidated Financial Statements ..................................................................... 56
Required Supplementary Stewardship Information .............................................................. 132
Required Supplementary Information ................................................................................... 143
Section III: Other Information ....................................................................................................... 151
Schedule of Spending............................................................................................................. 151
Response to Management Challenges ................................................................................... 153
Summary of Financial Statement Audit and Management Assurances ................................. 174
Improper Payments ............................................................................................................... 176
Discussion of Supplemental Measures .................................................................................. 191
Improper Payment Root Cause Categories ............................................................................ 193
Inspector General Act Amendments of 1988: Management’s Report on Audit Follow Up ... 235
Freeze the Footprint .............................................................................................................. 249
Civil Monetary Penalties ........................................................................................................ 250
Abbreviations—Acronyms ............................................................................................................. 265

F I S C A L Y E A R 2 0 1 5 A G E N C Y F I N A N C I A L R E P O R T
U . S . D E P A R T M E N T O F A G R I C U L T U R E i
Message from Secretary Vilsack
In fulfillment of our duty to the American people, the President, and
Congress, the U.S. Department of Agriculture (USDA) respectfully
submits the Fiscal year (FY) 2015 Agency Financial Report.
This year has marked another period of historic accomplishments at
USDA. We have innovated and collaborated with partners across the
Nation to support a strong American agricultural sector; bolstered
agricultural trade; safeguarded the Nation’s food supply; supported
record soil and water conservation; grown the biobased economy; and
expanded opportunity for farmers, ranchers, and rural communities
nationwide. Tools and resources in the 2014 Farm Bill have allowed
us to stretch the impact of our investments in rural America even further.
USDA has accomplished these results in a time of significant uncertainty. Since 2010, USDA's
budget has been reduced by 10 percent, while the Department has been charged with additional
responsibilities and more complex programs. Federal budget reductions have challenged USDA
leadership and employees alike to find new strategies for delivering modern, efficient service. In
FY 2015, USDA enhanced our modernization and streamlining efforts, consistent with our
Blueprint for Stronger Service. These proactive steps have given us the tools to carry out our
mission-critical work while ensuring that USDA's millions of customers across rural America
receive stronger service. USDA's efforts have saved taxpayers $1.4 billion in recent years.
The fact that we are able to continue accomplishing admirable results across all areas of the
Department is a testament to nearly 100,000 USDA employees stationed in Washington, D.C.,
across the Nation, and around the world. Often, Americans do not have a chance to work directly
with these dedicated public servants—but the impact of their work is felt from our smallest
towns to our biggest cities.
In 2015, USDA took a multitude of steps to provide innovative assistance for America’s farmers
and ranchers. For example, producers can now choose between the Agriculture Risk Coverage
(ARC) and Price Loss Coverage (PLC) programs. The new programs, established by the
2014 Farm Bill, trigger financial protections for agricultural producers when market forces cause
substantial drops in crop prices or revenues. More than 1.76 million farmers have elected ARC
or PLC. Previously, 1.7 million producers had enrolled to receive direct payments (the program
replaced with ARC and PLC by the 2014 Farm Bill). This means more farmers have elected
ARC or PLC than had previously enrolled under previously administered programs. Also in
2015, dairy producers could enroll in the Margin Protection Program for coverage in 2016. The
M E S S A G E F R O M T H E S E C R E T A R Y
i i C R E A T I N G A U S D A F O R T H E 2 1 S T C E N T U R Y
voluntary program, established by the 2014 Farm Bill, provides financial assistance to
participating dairy operations when the margin—the difference between the price of milk and
feed costs—falls below the coverage level selected by the farmer. More than half of the Nation's
dairy producers enrolled in the 2015 program, exceeding our expectations for the first year of
the program.
USDA has also supported a Federal crop insurance program that has matured into the Nation’s
primary farm safety net. For some farming and ranching families, crop insurance means the
difference between staying in business and going out of business after a natural disaster. When
farmers and ranchers suffer covered losses, indemnity payments can replace lost income, helping
local rural communities remain economically viable. USDA’s Risk Management Agency (RMA)
has worked to ensure that crop insurance is available and meets the needs of as many producers
as possible. For example, in 2015, USDA announced the availability of Whole-Farm Revenue
Protection insurance, which allows producers who have previously had limited access to a risk
management safety net to insure all of the commodities on their farm at once instead of one
commodity at a time. This insurance is available in every county in the Nation.
In FY 2015, USDA also continued our strong support for markets of products grown and made
in rural America. Thanks to the resilience of our farmers and ranchers, fiscal years 2009 to 2015
represent the strongest 7 years in history for U.S. agricultural trade, with U.S. agricultural
product exports totaling more than $911 billion since 2009. We expect that new trade
agreements, made possible thanks to Trade Promotion Authority legislation passed in 2015, will
allow American farmers and ranchers to better reach the 95 percent of consumers who live
outside of our borders and drive the continued strength of American agricultural exports. USDA
will continue to fight to get the best trade deals for farmers and ranchers to open new markets
and create new customers for their products. Expanded trade strengthens the agricultural
economy, supports more than 1 million good-paying American jobs, helps to preserve the rural
way of life, and helps to ensure a more food secure population.
Establishing global food security is important not only to hundreds of millions of hungry people
around the world, but also to the sustainable economic growth of developing nations and the
long-term economic prosperity of the United States. As we help countries become more food
secure and raise incomes, we also expand markets for American producers. For example,
between fiscal years 2010 and 2014, U.S. agricultural exports to developing countries grew by
44.3 percent, significantly outpacing the 33.4 percent growth rate for developed countries.
Exports to Southeast Asia grew by 56.5 percent.
In addition to trade, USDA continues to focus on supporting education, child development, and
food security in low-income, food-deficit countries around the globe. In 2015, for example,
USDA's McGovern-Dole International Food for Education and Child Nutrition Program
announced seven new McGovern-Dole projects that could benefit more than 2.5 million children
in Africa and Central America, in addition to 28 projects ongoing in 21 countries. Since the
program was established in 2002, it has benefited more than 30 million children in 38 countries.

F I S C A L Y E A R 2 0 1 5 A G E N C Y F I N A N C I A L R E P O R T
U . S . D E P A R T M E N T O F A G R I C U L T U R E i i i
USDA has also helped to expand new markets for agricultural products here at home. For
example, consumer demand for locally produced food is strong and growing, and farmers and
ranchers are positioning their businesses to meet that demand. Local food sales topped
$11.7 billion in 2014, according to industry estimates—underscoring the economic benefit that a
local food system can offer a community. USDA has invested more than $800 million in more
than 29,100 local and regional food businesses and infrastructure projects over the past 6 years.
In August 2015, we announced that USDA's National Farmers Market Directory now lists more
than 8,400 markets. In 2015, USDA continued to encourage farm businesses to fill three
additional Local Food Directories to help consumers connect with farmers markets, on-farm
markets, Community-Supported Agriculture (CSAs), and food hubs.
In FY 2015, USDA also continued supporting farmers’ conservation work through technical
assistance and conservation programs—applying the most effective programs in the best places
to achieve the best possible result. A record 400 million acres and 600,000 producers and
landowners are currently enrolled in USDA's conservation programs.
The 2014 Farm Bill consolidated 23 existing conservation programs into 13 programs while
strengthening tools to protect and conserve land, water, and wildlife. For example, over
98.2 percent of producers have met the 2014 Farm Bill requirement to certify conservation
compliance to qualify for crop insurance premium support payments. Implementing the
2014 Farm Bill provisions for conservation compliance is expected to extend conservation
provisions for an additional 1.5 million acres of highly erodible lands and 1.1 million acres of
wetlands, which will reduce soil erosion, enhance water quality, and create wildlife habitat. And
through the Conservation Reserve Program, another 2014 Farm Bill program, farmers and
ranchers have over the past 30 years prevented more than 8 billion tons of soil from eroding,
reduced nitrogen and phosphorous runoff relative to cropland by 95 and 85 percent respectively,
and even sequestered 43 million tons of greenhouse gases annually, equal to taking 8 million cars
off the road.
In 2015, USDA announced the first round of projects through the Regional Conservation
Partnership Program (RCPP), a way for private companies, tribes, local communities, and
non-government partners to collaborate and invest in cleaner water and air, healthier soil, and
enhanced wildlife habitat. USDA awarded $370 million in Federal funding to 115 high-impact
projects across all 50 states and the Commonwealth of Puerto Rico. These projects will leverage
an estimated $400 million more in partner contributions—for a total of nearly $800 million—to
improve the Nation's water quality, support wildlife habitat, and enhance the environment. More
than 600 pre-proposals were submitted for RCPP in 2014. With participating partners investing
along with the Department, USDA's $1.2 billion in funding over the life of the 5-year Farm Bill
program can leverage an additional $1.2 billion from partners for a total of $2.4 billion for
conservation.
Throughout 2015, USDA, through the Forest Service, remained focused on managing
193 million acres of public forests and grasslands. Public lands the Forest Service manages

M E S S A G E F R O M T H E S E C R E T A R Y
i v C R E A T I N G A U S D A F O R T H E 2 1 S T C E N T U R Y
contribute more than $13 billion to the economy each year through visitor spending alone. Those
same lands provide 20 percent of the Nation's clean water supply, a value estimated at
$7.2 billion per year. The agency has either a direct or indirect role in stewardship of about
80 percent of the 850 million forested acres within the United States, of which 100 million acres
are urban forests where most Americans live.
In 2015, the Nation experienced yet another devastating wildfire season, particularly in the
drought-ravaged West. Climate change, drought, fuel buildup, insects, and disease are increasing
the severity of unprecedented wildfire in America's forests and rangelands, which impacts the
safety of people, homes, and communities. Development close to forests has also increased the
threat to property, with more than 44 million homes in the United States, equivalent to one in
every three houses in the country, potentially at risk from wildfire. In 2015, 52 percent of the
Forest Service budget was set aside for fire suppression, up from 16 percent in 1995. By 2025,
the share of the agency’s budget devoted to wildfire is now predicted to exceed 67 percent.
By September 2015, the Forest Service had already exceeded the funding set aside for fire
suppression and was forced to borrow funds meant for other Forest Service activities.
Accordingly, throughout 2015, USDA continued to push for a new funding strategy based on the
recognition that catastrophic wildfires are like other disasters and should be funded accordingly.
A proposal in President Obama's Fiscal Year 2016 Budget, mirrored by the bipartisan Wildfire
Disaster Funding Act already introduced in the House and Senate, would provide a fiscally
responsible mechanism to treat wildfires more like other natural disasters, end "fire transfers,"
and partially replenish the ability to restore resilient forests and protect against future fire
outbreaks.
This year, USDA continued our multipronged, multiyear approach to protect producers from the
negative impacts of climate change and provide them with tools and techniques to protect their
bottom line and ensure the future food security of our Nation. In 2014, we established seven
regional Climate Hubs and three sub-hubs to serve as a source of regional data and information
for hazard and adaptation planning in the agriculture and forest sectors. Throughout 2015, each
Hub focused on building networks of regional land-grant institutions, the private sector, farm
groups and forestry organizations, USDA program staff, State governments, and conservation
and environmental groups.
In April 2015, USDA announced 10 building blocks for climate action, a comprehensive,
voluntary approach to partnering with agricultural producers to address the threat of climate
change. Building on the work of the Climate Hubs, the building blocks will utilize and leverage
our voluntary, incentive-based conservation, forestry, and energy programs to reduce greenhouse
gas emissions, increase carbon sequestration, and expand renewable energy production in the
agricultural and forestry sectors. Through these efforts, USDA expects to reduce net emissions
and enhance carbon sequestration by over 120 million metric tons of CO2 equivalent per year—
about 2 percent of economy-wide net greenhouse emissions—by 2025. That's the equivalent of
taking 25 million cars off the road, or the emissions produced by powering nearly 11 million

F I S C A L Y E A R 2 0 1 5 A G E N C Y F I N A N C I A L R E P O R T
U . S . D E P A R T M E N T O F A G R I C U L T U R E v
homes last year. The building blocks are part of the Administration’s climate change strategy and
will help the United States to meet the commitments outlined by President Obama last October
to reduce the United States’ greenhouse gas emissions by 26–28% below 2005 levels by 2025.
USDA continues to lead the way for renewable energy by supporting the infrastructure we will
need in a new energy economy. In FY 2015, more than 1,861 new awards under the Rural
Energy for America Program helped USDA to reach a milestone of more than 9,600 renewable
energy and energy efficiency projects nationwide since 2009. During this period, the Department
has provided more than $291 million in grants and $327 million in loan guarantees to
agricultural producers and rural small business owners. Meanwhile, we took new steps to support
biobased product manufacturing that in 2013 alone contributed 4 million jobs and $369 billion to
our economy—including the addition of new forest products in the BioPreferred program, along
with proposed changes to the former Biorefinery Assistance Program to assist in the
development of cutting-edge technologies for advanced biofuels, renewable chemicals, and
biobased product manufacturing.
This year, USDA continued its record level of investment in rural America by investing in
community facilities, providing loans for rural small business, helping rural families buy or
repair a home, and helping to ensure communities have access to critical infrastructure. Since
2009, for example, USDA has helped more than 89,000 rural small businesses grow through
grant and loan support, creating or saving more than 420,000 jobs. In addition, we have helped
more than 900,000 families achieve the dream of homeownership and invested in more than
6,600 critical community facilities projects, including 1,200 education facilities, 380 libraries,
780 health care facilities, and 2,800 public safety facilities.
USDA has also continued its delivery of critical nutrition assistance to millions of Americans
who are working hard but struggling to put food on the table, including nutritious meals to about
30 million children each school day. We continued to work with schools across the Nation to
successfully implement the healthier meals standards authorized under the Healthy, Hunger-Free
Kids Act of 2010 and to implement new steps to ensure that snack foods are healthier during the
school day—supporting the efforts of parents and teachers to improve children’s eating habits
and reduce obesity. We placed a special focus on expanding access to meals for low-income
children during the summer months when school meals are not widely available. In 2014, the
summer meal programs experienced a historic increase of 11 million more meals served
compared to the previous summer, serving a total of more than 187 million meals at over
50,000 summer meal sites throughout the country. This year, on the 40th anniversary of the
program, USDA challenged its partners to serve an additional 13 million meals to meet our
challenge of serving 200 million meals to children nationwide. Our preliminary data indicate that
we have met or exceeded that goal.
In 2015, the Supplemental Nutrition and Assistance Program (SNAP) continued to offer nutrition
assistance to millions of eligible low-income families in need. SNAP primarily serves children,
the elderly, people with disabilities, or people who are working but can’t quite make ends meet.

M E S S A G E F R O M T H E S E C R E T A R Y
v i C R E A T I N G A U S D A F O R T H E 2 1 S T C E N T U R Y
More than half of SNAP recipients are children and the elderly, and only 7 percent receive cash
welfare. More than 42 percent of recipients live in households where at least one person is
working. SNAP helps children and families who need it get access to healthy food, but
participation continues to decline as the economy recovers. Comparing June 2015 with
June 2013, SNAP participation has decreased by 4 percent.
In 2015, USDA continued to focus on helping SNAP participants find and keep good jobs to
transition recipients off SNAP assistance and ultimately reduce program costs. Earlier this year,
USDA awarded $200 million in competitive awards to fund and evaluate pilot projects in
10 states to explore and test innovative, cost-effective ways to help SNAP recipients find and
keep gainful employment in order to build a stronger future for their families.
This year, USDA’s support for critical agricultural research remained strong. USDA researchers
have partnered with others, including universities and private industry, across the country to
develop the next generation of solutions to some of America’s greatest scientific challenges.
USDA released a new report stating in FY 2014 alone, USDA received 83 patents, filed 119
patent applications, and disclosed 117 new inventions. In the past 6 years, research by USDA
scientists has resulted in 758 patent applications filed, 335 patents issued, and 953 new
inventions disclosures covering a wide range of topics and discoveries. In addition, since 2009,
USDA-funded grantees have applied for 295 patents, developed 43 new crop cultivars, and
identified 1,087 new inventions. Helping drive these innovations, USDA has executed 486 new
Cooperative Research and Development Agreements with outside investigators, which includes
universities and other organizations over the past 6 years. In FY 2014 alone, USDA had
267 active Cooperative Research and Development Agreements, including 102 with small
businesses.
USDA continues to ensure that America’s supply of meat, poultry, and processed eggs is safe to
eat and accurately labeled, and that the animals processed are treated humanely. In October
2014, the Government Accountability Office recognized USDA’s Food Safety and Inspection
Services’ “increasingly science-based, data-driven and risk-based approach” to protecting
Americans from illness, and that approach is working. FSIS’ goal is always to bring the number
of cases of foodborne illness to zero, and data show that the trend is headed in the right direction.
In 2014, cases of foodborne illness traced to the products these men and women regulate dropped
by 41,000, or 10 percent, compared to the year before. In 2015, FSIS continued work to
implement updates to our 60-year-old poultry safety system, as well as first-time ever pathogen
reduction standards for chicken parts. As yet another example of FSIS’ strategic, risk-based
approach, these new standards are expected to prevent 50,000 cases of food poisoning by
targeting items consumers frequently purchase.
The Department’s management team continues to oversee USDA’s assessment of internal
control over its programs, operations, financial systems, and financial reporting. The
Department’s work is consistent with the provisions of the Federal Managers’ Financial Integrity
Act (FMFIA) and the Federal Financial Management Improvement Act (FFMIA). USDA’s

F I S C A L Y E A R 2 0 1 5 A G E N C Y F I N A N C I A L R E P O R T
U . S . D E P A R T M E N T O F A G R I C U L T U R E v i i
continuous monitoring and remediation efforts allow us to provide taxpayers with reasonable
assurance that this report is based on sound, accurate data.
Nevertheless, continued improvement is needed to remediate USDA’s existing material
weakness and financial system noncompliance. To accomplish this goal, management continues
to implement corrective action plan activities. Therefore, I provide qualified assurance that,
except for the areas in need of improvement as described in the Management Assurances section
of this report, USDA’s internal control over operations, financial systems, and financial reporting
meets the objectives of FMFIA and FFMIA. The financial and performance information
presented herein is complete and accurate, and is in accordance with law and Office of
Management and Budget guidance.
While every year brings unique challenges and 2015 was no different, I am truly proud of USDA
employees across the Nation. They have stepped up to get the job done on behalf of Americans,
and in so doing they continue to grow our economy and create new jobs in rural communities.
I know that together, we can continue to deliver efficient service while finding more ways to
serve as efficient stewards of taxpayer dollars.
Thank you for your interest in the Department.
Thomas J. Vilsack
Secretary of Agriculture
February 12, 2016

F I S C A L Y E A R 2 0 1 5 A G E N C Y F I N A N C I A L R E P O R T
U . S . D E P A R T M E N T O F A G R I C U L T U R E 1
Section I: Management’s Discussion and Analysis
About USDA President Abraham Lincoln founded the U.S. Department of Agriculture (USDA) in 1862 with
the goal of providing effective leadership to the Nation on food, agriculture, natural resources,
and related issues. As Americans, you are part of the USDA story, with an over 150-year
tradition of excellence in public service.
Since 1862, the dedicated public servants at USDA help hundreds of millions of Americans
every day. As Agriculture Secretary Thomas J. Vilsack, using a phrase to describe USDA coined
by Abraham Lincoln, said, “We are the People’s Department.”
We would like you to learn more about USDA and the Agencies and Offices that touch every
American, every day. More information about the Department, our history, and our leaders can
be found here at www.usda.gov.
Mission Statement
We provide leadership on food, agriculture, natural resources, rural development, nutrition, and
related issues based on sound public policy, the best available science, and efficient
management.
Vision Statement
To expand economic opportunity through innovation, helping rural America to thrive; to
promote agriculture production sustainability that better nourishes Americans while also helping
feed others throughout the world; and to preserve and conserve our Nation’s natural resources
through restored forests, improved watersheds, and healthy private working lands.

S E C T I O N I | M A N A G E M E N T ’ S D I S C U S S I O N A N D A N A L Y S I S
2 C R E A T I N G A U S D A F O R T H E 2 1 S T C E N T U R Y
Core Values
Our success depends on the following:
Accountability—Ensuring that the performance of all employees is measured against the
achievement of the Department’s strategic goals.
Transparency—Making the Department’s management processes more open so that the
public can learn how USDA supports Americans every day, in every way.
Customer Focus—Serving USDA’s constituents by delivering programs that address their
diverse needs.
Collaboration—Working cooperatively at all governmental levels domestically and
internationally on policy matters affecting a broad audience.
Participation—Providing opportunities for USDA constituents to shape and improve
services provided by the Department.
Professionalism—Building and maintaining a highly skilled, diverse, and compassionate
workforce.
Results Oriented—Measuring performance and making management decisions to direct
resources to where they are used most effectively.

F I S C A L Y E A R 2 0 1 5 A G E N C Y F I N A N C I A L R E P O R T
U . S . D E P A R T M E N T O F A G R I C U L T U R E 3
USDA Organization Chart
Source: USDA’s Web site, October 22, 2014
This image displays the U.S. Department of Agriculture’s (USDA) Headquarters Organization,
including the Secretary, Chief Officers, Under Secretaries, and Assistant Secretaries for various
agencies within USDA. In addition to its Headquarters Organization, USDA has a network of offices,
facilities, and laboratories across the country and overseas.

S E C T I O N I | M A N A G E M E N T ’ S D I S C U S S I O N A N D A N A L Y S I S
4 C R E A T I N G A U S D A F O R T H E 2 1 S T C E N T U R Y
USDA Mission Areas The U.S. Department of Agriculture’s (USDA) work is organized by mission areas, which are
collections of agencies that work together to achieve USDA’s strategic goals. A brief description
of USDA’s seven mission areas follows and may be found here: USDA Mission Areas.
Farm and Foreign Agricultural Services (FFAS)
Farm and Foreign Agricultural Services helps to keep America's farmers and ranchers in
business as they face the uncertainties of weather and markets. They deliver commodity, credit,
conservation, disaster, and emergency assistance programs that help improve the stability and
strength of the agricultural economy. The agencies under FFAS are as follows:
Farm Service Agency (FSA)
Commodity Credit Corporation (CCC)
Foreign Agricultural Service (FAS)
Risk Management Agency (RMA)
Federal Crop Insurance Corporation (FCIC)
Food, Nutrition and Consumer Services (FNCS)
Food, Nutrition and Consumer Services works to harness the Nation's agricultural abundance to
end hunger and improve health in the United States. Its agencies administer federal domestic
nutrition assistance programs and the Center for Nutrition Policy and Promotion, which links
scientific research to the nutrition needs of consumers through science-based dietary guidance,
nutrition policy coordination, and nutrition education.
Center for Nutrition Policy and Promotion (CNPP)
Food and Nutrition Service (FNS)
Office of Food Safety
The Office of Food Safety ensures that the Nation's commercial supply of meat, poultry, and egg
products is safe, wholesome, and properly labeled and packaged. This mission area also plays a
key role in the President's Food Safety Working Group, a coordinated government-wide
initiative to ensure a safe food supply for the American people for the 21st century. USDA's
partners in the Working Group include the U.S. Department of Health and Human Services, the
U.S. Environmental Protection Agency, and a number of other government agencies.
Food Safety and Inspection Service (FSIS)

F I S C A L Y E A R 2 0 1 5 A G E N C Y F I N A N C I A L R E P O R T
U . S . D E P A R T M E N T O F A G R I C U L T U R E 5
Marketing and Regulatory Programs (MRP)
Marketing and Regulatory Programs facilitates domestic and international marketing of
U.S. agricultural products and ensures the health and care of animals and plants. MRP agencies
are active participants in setting national and international standards, and include as follows:
Agricultural Marketing Service (AMS)
Animal and Plant Health Inspection Service (APHIS)
Grain Inspection, Packers, and Stockyards Administration (GIPSA)
Natural Resources and Environment (NRE)
Natural Resources and Environment ensures the health of the land through sustainable
management. Its agencies work to prevent damage to natural resources and the environment,
restore the resource base, and promote good land management.
Forest Service (FS)
Natural Resources Conservation Service (NRCS)
Research, Education, and Economics (REE)
Research, Education, and Economics is dedicated to the creation of a safe, sustainable,
competitive U.S. food and fiber system, as well as strong communities, families, and youth
through integrated research, analysis, and education. These agencies include as follows:
Agricultural Research Service (ARS)
Economic Research Service (ERS)
National Agricultural Library (NAL)
National Agricultural Statistics Service (NASS)
National Institute of Food and Agriculture (NIFA)
Rural Development (RD)
Rural Development is committed to helping improve the economy and quality of life in all of
rural America by providing financial programs to support essential public facilities and services
such as water and sewer systems, housing, health clinics, emergency service facilities, and
electric and telephone service. Rural Development promotes economic development by
providing loans to businesses through banks and community-managed lending pools, while also
assisting communities to participate in community empowerment programs.
Rural Development

S E C T I O N I | M A N A G E M E N T ’ S D I S C U S S I O N A N D A N A L Y S I S
6 C R E A T I N G A U S D A F O R T H E 2 1 S T C E N T U R Y
Strategic Plan and Program Performance
USDA Performance, Goals and Results FY 2015
The U.S. Department of Agriculture’s (USDA) mission is to provide leadership on food,
agriculture, natural resources, rural development, nutrition, and related issues based on sound
public policy, the best available science, and efficient management. Through implementing our
mission, the Department aspires to achieve five strategic goals as reflected in USDA’s
2014–2018 Strategic Plan:
Assist rural communities to create prosperity so they are self-sustaining, re-populating, and
economically thriving;
Ensure our national forests and private working lands are conserved, restored, and made
more resilient to climate change, while enhancing our water resources;
Help America promote agricultural production and biotechnology exports as America
works to increase food security;
Ensure that all of America’s children have access to safe, nutritious, and balanced meals;
and
Create a USDA for the 21st century that is high-performing, efficient, and adaptable.
USDA has also established three Agency Priority Goals (APGs) for fiscal years (FY) 2014 and
2015 that identify near-term goals to help USDA progress toward meeting our longer term
strategic goals and objectives. USDA’s APGs are as follows:
Create new economic opportunities;
Improve soil health; and
Reduce foodborne illnesses.
More information and reports on the APGs and quarterly progress can be found at
http://www.performance.gov/agency/department-agriculture?view=public#apg and in the
FY 2014 Annual Performance Report.
For purposes of the AFR, a performance summary is provided using the Department’s key
performance indicators as a mechanism to gauge progress in achieving priorities, goals, and
strategic objectives. In FY 2015, USDA had 38 key performance indicators, as reflected in the
Department’s FY 2015 Annual Performance Plan
(http://www.obpa.usda.gov/budsum/FY15budsum.pdf).
The following tables and discussion provide a high-level description of key focus areas for the
Department that are being tracked and managed through USDA’s performance management
process, in alignment with the Department’s strategic goals and objectives. The tables provide

F I S C A L Y E A R 2 0 1 5 A G E N C Y F I N A N C I A L R E P O R T
U . S . D E P A R T M E N T O F A G R I C U L T U R E 7
key performance indicator historical results, and include projections for the year based on reports
as of the third quarter.
Final performance information and a detailed discussion of results for the Department’s FY 2015
performance goals, assessment methodologies, metrics, external reviews, and documentation of
performance data will be presented in the FY 2015 USDA Annual Performance Report. The
report is planned to be released with the President’s 2017 budget in February and will be
available on www.usda.gov/ourperformance.
Goal #1: Rural Prosperity
A vibrant American economy depends on a prosperous rural America. Our four primary pillars
of economic opportunity in agriculture are: (1) exports, (2) local food systems, (3) conservation
and outdoor recreation, and (4) enhancing the bio-based economy. USDA is making an impact
on persistent poverty, out-migration, and rural income through increases in the number of
homeownership opportunities provided in rural communities and the percentage of direct and
guaranteed lending to beginning farmers.
Exhibit 1: USDA Strategic Plan Goal #1: Rural Prosperity Key Performance Indicators
Fiscal Year 2011
Actual 2012
Actual 2013
Actual 2014
Actual 2015
Target 2015
Preliminary
Number of jobs created or saved through USDA financing of businesses
64,935 52,468 44,419 48,467 43,772 45,000
Homeownership opportunities provided
140,100 153,027 170,055 176,539 177,366 167,000
Health Facilities: Percentage of customers who are provided access to new and/or improved essential community facilities
5.2% 7.3% 5.4% 5.5% 4.5% 6%
Safety Facilities: Percentage of customers who are provided access to new and/or improved essential community facilities
4.3% 3.7% 3.4% 3.7% 3.7% 3.7%
Educational Facilities: Percentage of customers who are provided access to new and/or improved essential community facilities
3.8% 3.7% 3.4% 3.7% 4.5% 4.5%

S E C T I O N I | M A N A G E M E N T ’ S D I S C U S S I O N A N D A N A L Y S I S
8 C R E A T I N G A U S D A F O R T H E 2 1 S T C E N T U R Y
Fiscal Year 2011
Actual 2012
Actual 2013
Actual 2014
Actual 2015
Target 2015
Preliminary
Number of borrowers/subscribers receiving new and/or improved electric facilities (millions)
7.1 8.3 8.7 4.6 4.625 4.6
Number of borrowers/subscribers receiving new or improved telecommunications services (millions)
0.18 0.06 0.12 0.13 0.145 0.145
Number of population receiving new or improved service from agency-funded water facilities (millions)
2.9 2.5 1.8 2.3 2.2 2.2
Value of agricultural exports resulting from participation in foreign food and agricultural trade shows ($ billion)
$ 1.12 $ 1.26 $ 1.46 $ 1.50 $ 1.55 $ 1.52
Percentage of Direct and Guaranteed lending to Socially Disadvantaged Farmers (SDA)
13.10% 13.30% 13.60% 13.40% 13.50% 15%
Percentage of Direct and Guaranteed lending to Beginning Farmers (BF)
64.90% 68.80% 70% 70.50% 71% 85%
Normalized value of risk protection provided to agricultural producers through the Federal Crop Insurance Program ($ billion)
$56.30 $ 62.10 $ 66.00 $ 62.70 $ 63.00 $ 68.3
Value of trade preserved annually through USDA staff intervention leading to resolution of foreign market access issues such as U.S. export detainment, restrictive Sanitary/ Phytosanitary or Technical Barrier to Trade issues and trade regulations
( $ billion)
$ 4.10 $ 3.70 $ 3.80 $ 6.40 $ 3.90 $ 3.90

F I S C A L Y E A R 2 0 1 5 A G E N C Y F I N A N C I A L R E P O R T
U . S . D E P A R T M E N T O F A G R I C U L T U R E 9
Goal #2: Resource Conservation, Restoration, and Resiliency
A healthy and prosperous America relies on the health of our natural resources, and particularly
our forests and agricultural working lands. Forests and other lands absorb approximately
14 percent of U.S. carbon dioxide emissions. To help improve the health of our natural
resources, USDA has worked to increase the annual acres of public and private forest lands
restored or enhanced and to increase the percentage of national forests and grasslands in
compliance with a climate change adaption and mitigation strategy.
Exhibit 2: USDA Strategic Plan Goal #2: Resource Conservations, Restoration, and Resiliency Key Performance Indicators
Fiscal Year 2011
Actual 2012
Actual 2013
Actual 2014
Actual 2015
Target 2015
Preliminary
Conservation Reserve Program (CRP) restored wetland acreage (millions of acres)
2.23 2.29 2.09 2.05 1.9 1.9
Conservation Technical Assistance (CTA) land with conservation applied to improve water quality (millions of acres)
N/A N/A N/A 17.2 17.2 17.2
CTA cropland with conservation applied to improve soil quality (millions of acres)
N/A N/A N/A 6.8 6.8 6.8
CTA grazing and forest land with conservation applied to protect and improve the resource base (millions of acres)
N/A N/A N/A 12.8 12.8 12.8
Environmental Quality Incentives Program (EQIP) land with conservation applied to improve water quality (millions of acres)
N/A N/A N/A 10.5 10.5 10.5
EQIP cropland with conservation applied to improve soil quality (millions of acres)
N/A N/A N/A 3.4 3.4 3.4
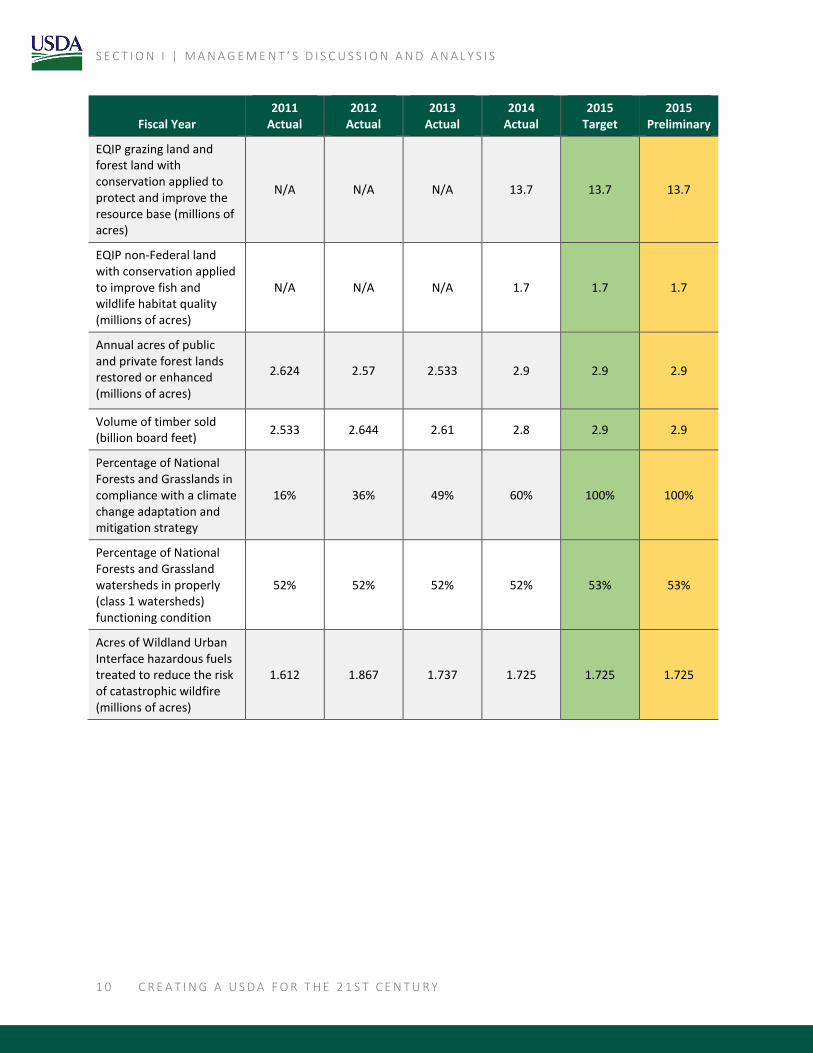
S E C T I O N I | M A N A G E M E N T ’ S D I S C U S S I O N A N D A N A L Y S I S
1 0 C R E A T I N G A U S D A F O R T H E 2 1 S T C E N T U R Y
Fiscal Year 2011
Actual 2012
Actual 2013
Actual 2014
Actual 2015
Target 2015
Preliminary
EQIP grazing land and forest land with conservation applied to protect and improve the resource base (millions of acres)
N/A N/A N/A 13.7 13.7 13.7
EQIP non-Federal land with conservation applied to improve fish and wildlife habitat quality (millions of acres)
N/A N/A N/A 1.7 1.7 1.7
Annual acres of public and private forest lands restored or enhanced (millions of acres)
2.624 2.57 2.533 2.9 2.9 2.9
Volume of timber sold (billion board feet)
2.533 2.644 2.61 2.8 2.9 2.9
Percentage of National Forests and Grasslands in compliance with a climate change adaptation and mitigation strategy
16% 36% 49% 60% 100% 100%
Percentage of National Forests and Grassland watersheds in properly (class 1 watersheds) functioning condition
52% 52% 52% 52% 53% 53%
Acres of Wildland Urban Interface hazardous fuels treated to reduce the risk of catastrophic wildfire (millions of acres)
1.612 1.867 1.737 1.725 1.725 1.725

F I S C A L Y E A R 2 0 1 5 A G E N C Y F I N A N C I A L R E P O R T
U . S . D E P A R T M E N T O F A G R I C U L T U R E 1 1
Goal #3: Increased Exports and Global Food Security
Working with other Federal partners, USDA is working toward reducing global food insecurity
and increasing agriculture-led economic growth in developing countries. The Department
continues to seek new trade opportunities for American agricultural producers and is also
striving to bring products with new and emerging technologies to the worldwide marketplace. In
addition, USDA is focused on improving efforts to reduce food insecurity across the world by
providing technical assistance to people in food-insecure countries.
Exhibit 3: USDA Strategic Plan Goal #3: Increased Exports and Global Food Security
Fiscal Year 2011
Actual 2012
Actual 2013
Actual 2014
Actual 2015
Target 2015
Preliminary
Cumulative number of biotechnology products deregulated by USDA based on scientific determinations that they do not pose a plant pest risk to agriculture
87 93 102 107 112 112
Goal #4: Safe and Nutritious Food
A plentiful supply of safe and nutritious food is essential to the healthy development of every
child in America and to the well-being and productivity of every family. In FY 2014, USDA saw
improvements in the reduction of foodborne Salmonella illnesses that are associated with
USDA’s Food Safety and Inspection Service-regulated products—meat, poultry, and processed
egg products. Over the past 3 years, USDA’s food assistance programs have contributed to a
steady decrease in the prevalence of food insecurity in households with children.
Exhibit 4: USDA Strategic Plan Goal #4: Safe and Nutritious Food
Fiscal Year 2011
Actual 2012
Actual 2013
Actual 2014
Actual 2015
Target 2015
Preliminary
Prevalence of food insecurity in households with children
20.6% 20% 19.7% 19.4% 19.4% 19.4%
Annual percentage of eligible people participating in SNAP
79% 79% 79% 79.2% 79.4% 79.4%
SNAP payment accuracy rate
96.2% 96.58% 96.52% 96.2% 96.3% 96.3%

S E C T I O N I | M A N A G E M E N T ’ S D I S C U S S I O N A N D A N A L Y S I S
1 2 C R E A T I N G A U S D A F O R T H E 2 1 S T C E N T U R Y
Fiscal Year 2011
Actual 2012
Actual 2013
Actual 2014
Actual 2015
Target 2015
Preliminary
SNAP benefits redeemed at farmers markets and direct marketing farmers annually (millions)
$ 11.70 $ 16.60 $ 21.20 $ 22.30 $ 23.50 $ 23.50
Annual percentage of eligible people participating in the National School Lunch Program
58% 57.6% 55.6% 56.4% 57.2% 57.2%
Annual percentage of children participating in the free/reduced price school lunch program that participate in summer feeding programs
15.5% 15.5% 16% 16.3% 16.6% 17%
Increase percentage of broiler plants passing the carcass Salmonella Verification Testing Standard
89% 90% 90% 92% 94% 94%
Percentage of establishments with a functional food defense plan (annual measure)
75% 77% 83% 84% 90% 90%
Total illnesses from all FSIS products
491,353 479,621 427,171 384,362 373,955 374,000

F I S C A L Y E A R 2 0 1 5 A G E N C Y F I N A N C I A L R E P O R T
U . S . D E P A R T M E N T O F A G R I C U L T U R E 1 3
Goal #5: Departmental Modernization
Through its Blueprint for Stronger Service, USDA is building and implementing a modern
workforce, and exercising good stewardship of the resources entrusted to the Department. During
FY 2014, USDA implemented policies to achieve a more efficient use of funds through
decreases in the amount of leased office and warehouse space controlled by USDA and to build a
more effective workforce through process improvements and increased use of telework.
Exhibit 5: USDA Strategic Plan Goal #5: Departmental Modernization
Fiscal Year 2011
Actual 2012
Actual 2013
Actual 2014
Actual 2015
Target 2015
Preliminary
Number of employees participating in core telework
8,756 7,926 13,937 16,123 18,982 18,982
Amount of leased office and warehouse space controlled by USDA (millions of square feet)
26.3 26 25.6 24.3 23.6 23.6

S E C T I O N I | M A N A G E M E N T ’ S D I S C U S S I O N A N D A N A L Y S I S
1 4 C R E A T I N G A U S D A F O R T H E 2 1 S T C E N T U R Y
Future Demands, Risks, Uncertainties, Events, Conditions, and Trends Farmers and ranchers operate in highly competitive markets, both domestically and
internationally. Rapid shifts in consumer demands associated with quality, convenience, taste,
and nutrition dictate that farming, ranching, and marketing infrastructures become more fluid and
responsive. National security is a significant, ongoing priority for the U.S. Department of
Agriculture (USDA). USDA is working with the U.S. Department of Homeland Security to help
protect agriculture from intentional and accidental acts that might impact America’s food supply
or natural resources.
External factors that challenge USDA’s ability to achieve its goals include the following:
Weather-related hardships, including disasters related to the increasing intensity and
duration of extreme weather and climate change, both domestically and internationally;
The risk of catastrophic fire, depending on weather, drought conditions, and the expanding
number of communities in the wildland-urban interface;
Non weather-related hardships and other uncontrollable events, both domestically and
internationally;
Domestic and international macroeconomic factors, including consumer purchasing power,
the strength of the U.S. dollar, and political changes abroad that could impact domestic and
global markets greatly at any time;
Sharp fluctuations in farm prices, interest rates, and unemployment that could impact the
ability of farmers, other rural residents, communities, and businesses to qualify for credit
and manage debt;
The impact of future economic conditions and actions by a variety of Federal, State, and
local Governments that could influence the sustainability of rural infrastructure;
The increased movement of people and goods, which provides the opportunity for crop and
animal pests and diseases to move quickly across domestic and international boundaries;
and
Potential exposure to hazardous substances, which may threaten human health and the
environment, and the ability of the public and private sectors to collaborate effectively on
food safety, security, and related emergency preparedness efforts.

F I S C A L Y E A R 2 0 1 5 A G E N C Y F I N A N C I A L R E P O R T
U . S . D E P A R T M E N T O F A G R I C U L T U R E 1 5
Analysis of Financial Information and Highlights
Financial Statement Highlights
BUDGETARY RESOURCES
The U.S. Department of Agriculture (USDA) receives most of its funding from appropriations
authorized by Congress and administered by the U.S. Department of the Treasury. Total
budgetary resources consist of the balance at the beginning of the year, appropriations received
during the year, spending authority from offsetting collections, and other budgetary resources.
The following exhibit presents fiscal year (FY) 2015 total budgetary resources by mission area.
Exhibit 6: Total Budgetary Resources by Mission Area ($ billions)
Total budgetary resources were $242 billion for FY 2015 compared to $235 billion in FY 2014,
an increase of $7 billion, or 3 percent.
58%16%
14%
7%
2%
2% 1%0%
Food Nutrition and Consumer Services - $140
Rural Development - $40
Farm and Foreign Agriculture Services - $34
Natural Resources and Environment - $17
Research, Education and Economics - $4
Marketing and Regulatory Programs - $4
Departmental Offices - $2
Food Safety - $1

S E C T I O N I | M A N A G E M E N T ’ S D I S C U S S I O N A N D A N A L Y S I S
1 6 C R E A T I N G A U S D A F O R T H E 2 1 S T C E N T U R Y
The following exhibit presents significant changes in total budgetary resources by mission area.
Exhibit 7: Significant Changes in Total Budgetary Resources by Mission Area ($ billions)
OBLIGATIONS INCURRED
Obligations incurred were $178 billion for FY 2015, compared to $180 billion in FY 2014, a
decrease of $2 billion, or -1 percent. The following exhibit presents significant changes in
obligations incurred.
Exhibit 8: Significant Changes in Obligations Incurred ($ billions)
-$8
-$6
-$4
-$2
$0
$2
$4
$6
Farm and ForeignAgriculture
Services
Marketing andRegulatoryPrograms
NaturalResources AndEnvironment
Food Nutritionand Consumer
ServicesRural
Development
-$7
$1 $1
$6 $6
-$6
-$5
-$4
-$3
-$2
-$1
$0
$1
$2
$3
CommodityCredit
Corporation
RiskManagement
Agency
Food andNutritionService
Animal andPlant HealthInspection
Service Forest ServiceRural
Development
-$6
-$2
$1 $1 $1
$3

F I S C A L Y E A R 2 0 1 5 A G E N C Y F I N A N C I A L R E P O R T
U . S . D E P A R T M E N T O F A G R I C U L T U R E 1 7
There were decreases at Commodity Credit Coporation (CCC) due to the repeal of the Direct and
Counter Cyclical and Average Crop Revenue Election, and at Risk Management Agency (RMA)
for Crop Insurance.There were increases at Food and Nutrition Service (FNS) for Supplemental
Nutrition Assistance (SNAP) and Women, Infants, and Children (WIC); at Animal and Plant
Health Inspection Service (APHIS) for the Highly Pathogenic Avian Influenza (HPAI) incident;
at Forest Service due to the severity of the fire season, and at Rural Development (RD) for Rural
Electric and Telecommunications, Rural Community Facility, and Guaranteed Rural Business.
NET OUTLAYS
Net Outlays were $138 billion for FY 2015, compared to $144 billion in FY 2014, a decrease of
$6 billion or -4 percent. The following exhibit presents significant changes in net outlays.
Exhibit 9: Significant Changes in Net Outlays ($ billions)
There were decreases at CCC due to the repeal of the Direct and Counter Cyclical and Average
Crop Revenue Election; at RD for Rural Electric and Telecommunications, and at RMA for Crop
Insurance.There were increases at APHIS for the HPAI incident, and at FNS for SNAP and WIC.
-$5
-$4
-$3
-$2
-$1
$0
$1
$2
CommodityCredit
CorporationRural
Development
RiskManagement
Agency
Animal andPlant HealthInspection
ServiceFood and
Nutrition Service
-$5
-$3
-$1
$1
$2

S E C T I O N I | M A N A G E M E N T ’ S D I S C U S S I O N A N D A N A L Y S I S
1 8 C R E A T I N G A U S D A F O R T H E 2 1 S T C E N T U R Y
Balance Sheet
TOTAL ASSETS
Total assets for FY 2015 were $217 billion, compared to $208 billion for FY 2014, an increase
of $9 billion, or 4 percent. The following exhibit presents FY 2015 total assets.
Exhibit 10: Total Assets ($ billions)
Direct Loan and Loan Guarantees, Net, is one of the largest assets on the USDA Balance Sheet.
RD offers both direct and guaranteed loan products for rural housing and rural business
infrastructure. These products represent 88 percent of the total Department loan programs. Loan
programs administered by FSA represent 9 percent of the total. FSA supports farmers who are
temporarily unable to obtain private, commercial credit. The remaining 3 percent represents
commodity loans and credit programs administered by the CCC. These loans are used to improve
economic stability and provide an adequate supply of agricultural commodities. CCC credit
programs provide international food assistance, expand international markets, and provide
domestic low cost financing to protect farm income and prices. The following exhibit presents
significant changes in total assets.
52%46%
1% 1%
Fund Balance with Treasury - $113
Direct Loan and Loan Guarantees, Net - $99
General Property, Plant and Equipment, Net - $3
Accounts Receivable, Net - $2

F I S C A L Y E A R 2 0 1 5 A G E N C Y F I N A N C I A L R E P O R T
U . S . D E P A R T M E N T O F A G R I C U L T U R E 1 9
71%
20%
4%3%
1%1%Debt $114
Other $33
Loan Guarantee Liability $6
Benefits Due and Payable $5
Accounts Payable $2
Federal Employee and Veteran $1Benefits
Exhibit 11: Significant Changes in Assets ($ billions)
Total Liabilities
Total liabilities for FY 2015 were $161 billion, compared to $159 billion for FY 2014, an
increase of $2 billion, or 1 percent. The following exhibit presents FY 2015 total liabilities.
Exhibit 12: Total Liabilities ($ billions)
Debt is the single largest liability on USDA’s balance sheet. It represents amounts owed
primarily to Treasury by CCC, FSA, and RD. For CCC, the debt primarily represents financing
for price support, export credit guarantees, disaster programs and loans related to farm storage
facilities. For FSA, the debt primarily represents financing to support direct and guaranteed loan
programs, with the majority supporting operating, ownership, and emergency loans. For RD, the
debt primarily represents financing to support electric and housing loan programs. The following
exhibit presents significant changes in total liabilities.
-2
0
2
4
6
8
10
12
Direct Loan and Loan Guarantees, Net Fund Balance with Treasury
-$2
$11

S E C T I O N I | M A N A G E M E N T ’ S D I S C U S S I O N A N D A N A L Y S I S
2 0 C R E A T I N G A U S D A F O R T H E 2 1 S T C E N T U R Y
14%
9%1%
75%
1%
Goal 1 - $20
Goal 2 - $12
Goal 3 - $2
Goal 4 - $107
Goal 5- $1
Exhibit 13: Significant Changes in Total Liabilities ($ billions)
Net Cost of Operations
Net cost of operations for FY 2015 was $143 billion, compared to $145 billion for FY 2014, a
decrease of $2 billion, or -2 percent. The following exhibit presents FY 2015 net cost of
operations by strategic goal.
Exhibit 14: Net Cost of Operations by Strategic Goals ($ billions)
$0
$1
$2
$3
$4
$5
$6
Other Liabilities Benefits Due and Payable
$1 $1

F I S C A L Y E A R 2 0 1 5 A G E N C Y F I N A N C I A L R E P O R T
U . S . D E P A R T M E N T O F A G R I C U L T U R E 2 1
Goal 1: Assist Rural Communities to Create Prosperity so They are Self-Sustaining,
Repopulating, and Economically Thriving.
Goal 2: Ensure Our National Forests and Private Working Lands are Conserved, Restored, and
Made More Resilient to Climate Change, While Enhancing Our Water Resources.
Goal 3: Help America Promote Agricultural Production and Biotechnology Exports as America
Works to Increase Food Security.
Goal 4: Ensure That All of America’s Children Have Access to Safe, Nutritious, and Balanced
Meals.
Goal 5: Create a USDA for the 21st Century That Is High Performing, Efficient, and Adaptable.
The following exhibit presents significant changes in net cost of operations.
Exhibit 15: Significant Changes in Net Cost of Operations ($ billions)
There was a decrease at CCC for Supplemental Agricultural Disaster Assistance. There were
increases at Forest Service due to the severity of the fire season and reauthorization of the Secure
Rural Schools Act, and at APHIS for the HPAI incident.
-$4
-$3
-$2
-$1
$0
$1
Commodity CreditCorporation Forest Service
Animal and Plant HealthInspection Service
-$4
$1 $1

S E C T I O N I | M A N A G E M E N T ’ S D I S C U S S I O N A N D A N A L Y S I S
2 2 C R E A T I N G A U S D A F O R T H E 2 1 S T C E N T U R Y
Stewardship Investments
Stewardship investments are substantial investments made by the Federal Government for the
benefit of the Nation but are not physical assets owned by the Federal Government. When
incurred, they are treated as expenses in determining the net cost of operations. However, these
items merit special treatment so that users of Federal financial reports know the extent of
investments that are made for long-term benefit. Such investments are measured in terms of
expenses incurred for non-Federal physical property, human capital, and research and
development. The following exhibit presents a comparison of stewardship investments.
Exhibit 16: Comparison of Stewardship Investments ($ millions)
$0
$500
$1,000
$1,500
$2,000
$2,500
Non-Federal PhysicalProperty Human Capital
Research andDevelopment
$55
$675
$2,260
$44
$612
$2,202
FY2015
FY2014

F I S C A L Y E A R 2 0 1 5 A G E N C Y F I N A N C I A L R E P O R T
U . S . D E P A R T M E N T O F A G R I C U L T U R E 2 3
Statement of Assurance The U.S. Department of Agriculture (USDA) is providing qualified
assurance that USDA’s systems of internal control comply with the Federal
Managers’ Financial Integrity Act (FMFIA) objectives. USDA’s systems of
internal control meet the objectives of the FMFIA and the Federal Financial
Management Improvement Act (FFMIA), with the exception of two material
weaknesses in internal control, one financial system nonconformance, and
noncompliance with two laws and regulations. Management is providing
reasonable assurance that the internal controls over operations are effective. The details of the
exceptions are provided in the FMFIA, FFMIA, and Summary of Financial Statement Audit and
Management Assurances sections of this report.
USDA assessed its financial management systems and internal controls over the effectiveness
and efficiency of operations and compliance with applicable laws and regulations as of
September 30, 2015, and financial reporting as of June 30, 2015. The assessment included the
safeguarding of assets and compliance with applicable laws and regulations, in accordance with
the requirements of Office of Management and Budget (OMB) Circular No. A-123,
Management’s Responsibility for Internal Control.
In fiscal year (FY) 2013, the Forest Service (FS) identified an Antideficiency Act (ADA)
violation under 31 U.S.C. §1517(a). The Energy Policy Act of 2005, Public Law 109-58,
required the Secretary of the Interior to create a pilot project to improve Federal permit
coordination. The Bureau of Land Management (BLM) transferred funds to FS to participate in
the pilot. FS reported obligations/expenditures in excess of the balance of the fund transferred
from the BLM as of December 31, 2012. FS spent $6,781.90 in excess of the $72,000.00 carried
over from FY 2012. FS provided written notification to Congress and the President for the
noncompliance violation, and this has been resolved as of April 1, 2015.
In FY 2015, FS identified an ADA violation for FY 1990 through FY 2009 under
31 U.S.C. §1341(a)(1). The violation related to the agency's employment in California of two
citizens of Palau. This use of Federal appropriations violated a general provision of
appropriations acts from FY 1990–2009, which prohibited the use of appropriations to employ
non-U.S. citizens. This ADA violation is in the process of being reported to Congress and
the President.
The Farm Service Agency (FSA) identified an ADA violation under 31 U.S.C. §1517(a).
In September 2013, OMB approved an apportionment request for $1,000,000 from FSA for the
purchase of guaranteed loans in FY 2014. On February 25, 2014, FSA made several loan
purchases, obligating $1,302,823.57, thus exceeding the apportionment for such purchases.
On March 7, 2014, FSA requested another apportionment to cover the deficiency. OMB
approved the request and apportioned funds on March 31, 2014. FSA’s Farm Loan Operations
Office is taking corrective actions to ensure future payments are obligated only within approved

S E C T I O N I | M A N A G E M E N T ’ S D I S C U S S I O N A N D A N A L Y S I S
2 4 C R E A T I N G A U S D A F O R T H E 2 1 S T C E N T U R Y
apportionment limits. The ADA violation is in the process of being reported to Congress and
the President.
The Office of Advocacy and Outreach (OAO) identified an ADA violation for FY 2011 under
31 U.S.C. §1517(a). The Food, Conservation, and Energy Act of 2008, Public Law 110-234
(Farm Bill of 2008) permitted OAO to award up to $19,000,000 in FY 2011 for Outreach and
Assistance for Socially Disadvantaged and Veteran Farmers and Ranchers (Section 2501)
Grants. OAO exceeded the amount available. The ADA violation is in the process of being
reported to Congress and the President.
In FY 2015, a potential ADA violation may have occurred within OAO associated with the
Strikeforce Initiative funded through transfers from USDA agencies for FY 2010 and 2011.
OAO is researching any potential violations.
The Foreign Agricultural Service (FAS) identified a potential violation of the ADA that may
have occurred in its FY 2009 appropriation. FAS has completed its analyses and identified the
causes of this potential violation, and has requested a determination on the status of this potential
ADA violation from the Office of the General Counsel.
Finally, USDA’s Office of Inspector General investigated the Office of the Assistant Secretary
for Civil Rights (OASCR) to determine whether (1) expenditures were properly supported by
documentation; (2) unauthorized commitments were properly ratified by the Office of
Procurement and Property Management; and (3) there was adherence to Federal legal authorities
and Departmental regulations. OASCR will take appropriate action to make the determination of
any potential ADA violations.
No other material weaknesses were found in the design or operation of the internal control over
(1) the effectiveness and efficiency of operations and compliance with applicable laws and
regulations as of September 30, 2015, and (2) financial reporting as of June 30, 2015.
Thomas J. Vilsack
Secretary of Agriculture
February 12, 2016

F I S C A L Y E A R 2 0 1 5 A G E N C Y F I N A N C I A L R E P O R T
U . S . D E P A R T M E N T O F A G R I C U L T U R E 2 5
Federal Managers’ Financial Integrity Act Report on Management Control
Background
The Federal Managers’ Financial Integrity Act (FMFIA) requires ongoing evaluations of internal
controls and financial management systems. These evaluations lead to an annual statement of
assurance that:
Obligations and costs comply with applicable laws and regulations;
Federal assets are safeguarded against fraud, waste, abuse, and mismanagement;
Transactions are accounted for and properly recorded; and
Financial management systems conform to standards, principles, and other requirements to
ensure that Federal managers have timely, relevant, and consistent financial information for
decision-making purposes.
The U.S. Department of Agriculture (USDA) annually evaluates its internal controls in
accordance with Office of Management and Budget (OMB) Circular No. A-123, Management’s
Responsibility for Internal Control.
The Department operates a comprehensive internal control program. This program ensures
compliance with the requirements of FMFIA and other laws, and OMB Circular No. A-123,
Appendices A through D. All USDA managers must ensure that their programs operate
efficiently and effectively, and comply with relevant laws. They must also ensure that financial
management systems conform to applicable laws, standards, principles, and related requirements.
In conjunction with the Office of Inspector General and the Government Accountability Office,
USDA’s management works decisively to determine the root causes of its material weaknesses
so that it can direct resources to focus on their remediation.
USDA remains committed to reducing and eliminating the risks associated with its deficiencies.
It also strives to efficiently and effectively operate its programs in compliance with FMFIA and
other applicable laws and regulations.

S E C T I O N I | M A N A G E M E N T ’ S D I S C U S S I O N A N D A N A L Y S I S
2 6 C R E A T I N G A U S D A F O R T H E 2 1 S T C E N T U R Y
Fiscal Year 2015 Results The Department has two existing material weaknesses in internal controls over financial
reporting; for Information Technology, and Financial Management. The material weakness for
Financial Management is comprised of Overall Financial Management (NRCS), Estimated
Losses on Insurance Claims Calculations (RMA/FCIC), Credit Reform Subsidy Model
Reestimates (RD), and Commodity Credit Corporation (CCC). USDA also has one existing
system nonconformance related to Funds Control Management within the CCC, which will be
resolved by the end of FY 2017.
The Food and Nutrition Service, FS, FSA, and NRCS are noncompliant with laws and
regulations related to the Improper Payments Information Act of 2002, as amended by the
Improper Payments Elimination and Recovery Act of 2010 and the Improper Payments
Elimination and Recovery Improvement Act of 2012.
The Secretary’s Statement of Assurance provides qualified assurance that USDA’s system of
internal control complies with FMFIA objectives. For additional details on the results reported in
USDA’s Consolidated Financial Statements Audit Report, see the Summary of Financial
Statement Audit and Management Assurances section of this report.
Summary of Outstanding Material Weaknesses
The following exhibit provides FY 2015 accomplishments and FY 2016 planned actions toward
resolving the outstanding material weaknesses.
Exhibit 17: Summary of Outstanding Material Weaknesses
1. USDA Information Technology (IT)
Material Weaknesses Existing
Pervasive internal control design and operating effectiveness deficiencies occurred in two areas: logical access control/personnel security and configuration management. These deficiencies represent an overall IT material weakness. (Department)
Overall Estimated Completion Date
FY 2016
FY 2015 Accomplishments: FY 2016 Planned Actions:
Office of the Chief Information Officer (OCIO):
Transitioned Web applications from eAuth 1.0 to eAuth 2.0:
Agencies created Plans of Actions and Milestones (POAMs) for each web application not migrated after September 26, 2014. All eAuth 1.0 applications were either migrated or decommissioned by June 15, 2015. The eAuth 1.0 platform was decommissioned on that date; and
OCIO will:
Continue to monitor POA&Ms identified as part of the IT Material Weakness. Track and report on progress weekly to USDA leadership, and ensure proper and full remediation of weaknesses across the USDA enterprise;
Continue to perform security assessments to analyze component agencies’ information architecture and related processes to develop a threat profile; and

F I S C A L Y E A R 2 0 1 5 A G E N C Y F I N A N C I A L R E P O R T
U . S . D E P A R T M E N T O F A G R I C U L T U R E 2 7
1. USDA Information Technology (IT)
Material Weaknesses Existing
Pervasive internal control design and operating effectiveness deficiencies occurred in two areas: logical access control/personnel security and configuration management. These deficiencies represent an overall IT material weakness. (Department)
Overall Estimated Completion Date
FY 2016
FY 2015 Accomplishments: FY 2016 Planned Actions:
Continued decommissioning effort of eAuth 1.0 as Web applications are migrated to the new environment;
Continued to monitor POA&Ms identified as part of the IT Material Weakness. Tracked and reported on progress weekly to USDA leadership, and ensured proper and full remediation of weaknesses across the USDA enterprise;
Continued to perform the Operational Security Assessment project to analyze component agencies’ information architecture and related processes to develop a threat profile;
Performed penetration testing of agencies that were assessed in FY 2013 to evaluate any changes in their security posture resulting from assessment findings and recommendations; and
Enforced mandatory use of PIV/HSPD12 credentials for logical access for privileged and non-privileged users by implementing technical mandatory controls. Met Presidential Cross-Agency Prioritization (CAP) goals of 85% PIV compliance for all users by Sept 30, 2015. As of September 30, 2015, USDA was at 85.06% compliant for non-privileged users and 88.9% for privileged users.
Continue to perform penetration testing: OCIO expects the the U.S. Department of Homeland Security (DHS) to continue their scans under the Binding Operational Directive, and the Agricultural Security Operation Center plans to continue integration with the Department of Homeland Security Continuous Diagnostics Mitigation program.
Continue to enhance centralized configuration management monitoring tools (currently Tivoli Endpoint Manager/BigFix) to monitor agency assets running specific operating systems;
Formalizing its internal monitoring processes into a Standard Operating Procedure;
Waiting on the finalization of the Department of Homeland Security’s Continuous Diagnostics and Monitoring (CDM) which will further enhance OCIO’s configuration management oversight function and timely coordination with sub-components to ensure policy compliance;
Continue to further enforce PIV/HSPD12 mandatory compliance for privileged and non-privileged users to meet published FY 16 CAP and FISMA goals; and
Develop additional implementation guidance for multi-factor authentication for network and application access.

S E C T I O N I | M A N A G E M E N T ’ S D I S C U S S I O N A N D A N A L Y S I S
2 8 C R E A T I N G A U S D A F O R T H E 2 1 S T C E N T U R Y
2. Financial Management — Overall Financial Management
Material Weakness Existing
NRCS was unable to provide sufficient evidential matter in support of certain transactions and account balances.
Overall Estimated Completion Date FY 2016
FY 2015 Accomplishments: FY 2016 Planned Actions:
Natural Resources Conservation Service (NRCS):
Worked with the centralized transaction processing teams to ensure that their procedures for entering accruals include referencing an obligation, where appropriate.
Developed a process to incorporate referenced accruals in the obligation balances.
Updated standard procedures and guidance on supporting documentation for journal entries and management’s review and approval of journal entries.
NRCS will:
Review the results of supporting obligation balances that include referenced accruals.
Develop and issue formal instruction for entering accruals that reference an obligation.
Reconcile feeder systems (financial assistance, contracts, travel, etc.) with the financial system.
Engage with an external firm to perform 100% review of all direct entry documents and any feeder system documents where reconciliation is not practical.
2. Financial Management — Estimated Losses on Insurance Claims Calculations
Material Weaknesses Existing
Although management conducted detailed reviews of the projected loss calculations for estimating losses on insurance claims, the reviews did not detect certain errors in the program code used to calculate the projection. As a result, FCIC/RMA’s financial statements were materially misstated and required adjustments.
(Risk Management Agency/Federal Crop Insurance Corporation, or RMA/FCIC)
Overall Estimated Completion Date FY 2016
FY 2015 Accomplishments: FY 2016 Planned Actions:
RMA/FCIC:
Implemented procedures to assess the key risks in the indemnity projection model and ensure the key areas were subsequently reviewed by FCIC/RMA management;
Retained documentation to provide a detailed audit trail of all relevant computations and related data files used; and
Performed additional risk assessments on the indemnity calculation aimed at the processes that have the greater risk of errors in the calculations.
RMA/FCIC will:
Develop control procedures over the program code used to develop significant year-end estimates to ensure that all variables are input correctly and calculating properly.

F I S C A L Y E A R 2 0 1 5 A G E N C Y F I N A N C I A L R E P O R T
U . S . D E P A R T M E N T O F A G R I C U L T U R E 2 9
2. Financial Management — Credit Reform Subsidy Model Reestimates
Material Weaknesses New
Rural Development needs to implement an econometric credit reform subsidy model for the Guaranteed Single Family Housing (GSFH) program and develop a formal review and evaluation process to assess the results of the credit reform subsidy model reestimates. Rural Development continues to work with OMB on completion of the GSFH econometric model and Rural Development will obtain OMB approval before implementing.
Overall Estimated Completion Date FY 2016
FY 2015 Accomplishments: FY 2016 Planned Actions:
RD:
Performed an analysis of the Liability for Loan Guarantee Account for the Guaranteed Single Family Housing Program. Recorded an accounting adjustment to more accurately reflect the account balance based on future portfolio performance.
Performed an analysis of the Prepayments on the Direct Water and Waste Program. Recorded an accounting adjustment to more accurately reflect the account balance based on future portfolio performance.
RD will:
Continue developing an econometric model for the GSFH program;
Continue writing model documentation and perform independent review of the model;
Execute the FY 2017 formulation estimate and submit results for OMB to review once economic assumptions are received from OMB; and
Submit documentation to OMB for review upon completion of documentation and review.
2. Financial Management – Commodity Credit Corporation
Material Weaknesses New CCC needs to address material weaknesses identified in the following areas: Financial Reporting, Accounting for Parent/Child Transactions, and Accounting for Budgetary Transactions.
Overall Estimated Completion Date FY 2016
FY 2015 Accomplishments: FY 2016 Planned Actions:
CCC will:
Develop corrective action plans to address the areas identified.

S E C T I O N I | M A N A G E M E N T ’ S D I S C U S S I O N A N D A N A L Y S I S
3 0 C R E A T I N G A U S D A F O R T H E 2 1 S T C E N T U R Y
Summary of Outstanding System Nonconformance
The funds control management nonconformance is also reported as a system noncompliance, and
included in the FFMIA Report on Financial Management Systems (Exhibit 21). The weakness
involves component agency-specific deficiencies for CCC.
The following exhibit provides FY 2015 accomplishments and FY 2016 planned actions toward
resolving the Department’s outstanding system nonconformances.
Exhibit 18: Summary of Outstanding System Nonconformance
1. Funds Control Management
System Nonconformance Existing
System improvements needed in recording obligations at the transactional level. (Commodity Credit Corporation, or CCC)
Noncompliance with Federal Financial Management Improvement Act of 1996. (CCC)
Overall Estimated Completion Date FY 2017
FY 2015 Accomplishments: FY 2016 Planned Actions:
To address the Material Weaknesses: Internal Controls Over Financial Reporting, Commodity Credit Corporation (CCC) has implemented several business process and system improvements to record, track, and report obligations at the detail transaction level.
1. Implemented the new Common Obligation Framework (COF) shared service and application, which is a major step towards mitigating CCC’s material weakness. A phased implementation has been in progress during FY 2015 to bring FSA Program and Financial Management applications into full compliance with OMB Circular, A-11, Preparation, Submission, & Execution of the Budget and OMB Circular A-123, Appendix D, Compliance with the Federal Financial Management Improvement Act of 1996. COF provides an automated real time funds control environment where funds availability is checked prior to obligation at the detail transaction level. The system will ensure obligations do not exceed apportioned amounts, allotments, sub-allotments, and other administrative subdivisions, and it will record obligations at the transaction level in accordance to the rules defined in the USSGL guidance.
2. Commodity Loan Processing System (CLPS) Phase 1 (all commodities except cotton, rice and peanuts) was deployed July 1, 2015. The CLPS is the
During FY2016, FSA will continue to modernize program and financial systems to eliminate the standing material weakness and become substantially compliant with the Funds Control/Obligation requirements related to obligations at the transactional level.
The following releases were scheduled and completed for deployment during FY 2016:
1. The new Agriculture Risk Coverage (ARC)/Price Loss Coverage (PLC) software that will be integrated with COF and obligate contracts at a transactional level and properly sequester funds—Released on October 23, 2015.
2. Remaining CLPS Phase to be implemented—Warehouse stored Rice and Peanuts—November 2015.
3. Direct Loan System (DLS)/Farm Storage Facility Loans (FSFL) Phase 2 replaces the CORE Budget Tables as a funds control mechanism and will integrate with COF—March 2016.
4. Margin Dairy Protection Program (MPP)—April 2016.
5. Move existing programs CRP, ECP, EFCRP and FSFL to COF at the transactional level, including sequester of funds in FY16.

F I S C A L Y E A R 2 0 1 5 A G E N C Y F I N A N C I A L R E P O R T
U . S . D E P A R T M E N T O F A G R I C U L T U R E 3 1
1. Funds Control Management
System Nonconformance Existing
System improvements needed in recording obligations at the transactional level. (Commodity Credit Corporation, or CCC)
Noncompliance with Federal Financial Management Improvement Act of 1996. (CCC)
Overall Estimated Completion Date FY 2017
FY 2015 Accomplishments: FY 2016 Planned Actions:
replacement for the legacy Automated Price Support System (APSS) which resides on the System 36/AS400 platform. CLPS uses the new Common Obligation Framework shared service that provides an automated real time funds control process where funds availability is checked prior to obligation at the detail transactional level. Warehouse and Farm stored cotton was placed into production for CPLS in September, 2015.
Compliance with Laws and Regulations
USDA worked diligently during FY 2015 to resolve a deficiency of noncompliance with laws
and regulations reported by the Forest Service (FS) on April 1, 2015. FS reported an ADA under
31 U.S.C. § 1571(a) and the ADA violation has been reported to Congress and the President.
In FY 2014, the FS reported an ADA violation under 31 U.S.C. §1517(a) identified in FY 2013.
The violation related to obligations/expenditures in excess of the balance of the fund transferred
to FS from the Bureau of Land Management. Reports indicated that FS spent $6,781.90 in excess
of the $72,000 carried over from FY 2012. FS provided written notification to Congress and the
President for the noncompliance violation and the violation was resolved as of April 1, 2015.
In FY 2015, FS identified an ADA violation for FY 1990 through FY 2009 under 31 U.S.C.
§1341(a)(1). The violation occurred in California and was related to the agency's employment in
California of two citizens of Palau. This use of Federal appropriations violated a general
provision of appropriations acts from FY 1990–2009, which prohibited the use of appropriations
to employ non-U.S. citizens. Violation of the general prohibition meant a violation of 31 U.S.C.
§ 1341. In FY 2010, Congress added the following language to the general provision: “Provided
further, That this section shall not apply to any person who is an officer or employee of the
Government of the United States on the date of enactment of this Act.” This proviso applies to
the Forest Service employees referenced in the reported violation. It has been included in all
subsequent appropriations acts, including the current act for FY 2015. Therefore, payment of the
employees with appropriated funds has not violated the general provision since FY 2010. In

S E C T I O N I | M A N A G E M E N T ’ S D I S C U S S I O N A N D A N A L Y S I S
3 2 C R E A T I N G A U S D A F O R T H E 2 1 S T C E N T U R Y
addition, since FY 2010, the general provision has allowed for the Federal employment of "a
person who is lawfully admitted for permanent residence and is seeking citizenship as outlined in
8 U.S.C. 1324b(a)(3)(B)." The ADA violation is in the process of being reported to Congress and
the President.
The Farm Service Agency (FSA) identified an ADA violation under 31 U.S.C. §1517(a). In
September 2013, the OMB approved an apportionment request for $1,000,000.00 from FSA for
the purchase of guaranteed loans in FY 2014. On February 25, 2014, FSA made several loan
purchases, obligating $1,302,823.57, thus exceeding the apportionment for such purchases. On
March 7, 2014, FSA requested another apportionment to cover the deficiency. OMB approved
the request and apportioned funds on March 31, 2014. FSA’s Farm Loan Operations Office is
taking corrective action to ensure future payments are obligated only within approved
apportionment limits. This ADA violation is in the process of being reported to Congress and the
President.
The Office of Advocacy and Outreach (OAO) identified an ADA violation for FY 2011 under
31 U.S.C. §1517(a). The Food, Conservation, and Energy Act of 2008, Public Law 110-234
(Farm Bill of 2008) permitted OAO to award up to $19,000,000.00 in FY 2011 for Outreach and
Assistance for Socially Disadvantaged and Veteran Farmers and Ranchers (Section 2501)
Grants. OAO exceeded the amount available. This ADA violation is in the process of being
reported to Congress and the President. OAO could potentially have another ADA violation
resulting from the Strikeforce Initiative, which is currently under review.
The Foreign Agricultural Service (FAS) identified a potential violation of the ADA that may
have occurred in its FY 2009 appropriation. FAS has completed its analyses and identified the
causes of this potential violation, and has requested the Office of the General Counsel for a
determination on the status of this potential ADA violation.
USDA’s Office of Inspector General investigated the Office of the Assistant Secretary for Civil
Rights (OASCR) to determine whether (1) expenditures were properly supported by
documentation; (2) unauthorized commitments were properly ratified by the Office of
Procurement and Property Management; and (3) there was adherence to Federal legal authorities
and Departmental regulations. OASCR will take appropriate action to make the determination of
any potential ADA violations.
The following exhibit provides a summary of agency programs not compliant with the Improper
Payments Act.

F I S C A L Y E A R 2 0 1 5 A G E N C Y F I N A N C I A L R E P O R T
U . S . D E P A R T M E N T O F A G R I C U L T U R E 3 3
Exhibit 19: Outstanding Initiative to Achieve Compliance
Initiative Section of Noncompliance Agency/Program Target
Completion Date
Imp
rop
er
Pay
me
nts
Elim
inat
ion
an
d R
eco
very
Act
of
20
10
(IP
ERA
)
Publish improper payment estimates for all high-risk programs and activities
Food and Nutrition Service (FNS)/Child and Adult Care Food Program
12/2020
Publish and meet annual reduction targets for each program assessed to be at risk and measured for improper payments
Farm Service Agency (FSA)/ Livestock Forage Disaster Program
11/15/2016
Natural Resources Conservation Service (NRCS)/ Farm Security and Rural Investment Act Programs
06/2016
FNS/ National School Lunch Program 11/15/2016
FNS/ Supplemental Nutrition Assistance Program
11/15/2016
FNS/ Special Supplemental Nutrition Program for Women, Infants, and Children (WIC)
09/2016
Forest Service/ Hurricane Sandy—Capital Improvement and Maintenance
11/15/2016
FSA/ Supplemental Revenue Assistance Program
11/15/2016
FSA/ Non-insured Crop Disaster Assistance Program
11/15/2016
Report a gross improper payment rate of less than 10 percent for each program and activity for which an improper payment estimate was obtained and published in the Performance and Accountability Report (PAR) or Agency Financial Report (AFR)
FNS/ National School Lunch Program and School Breakfast Program
12/2020
NRCS/ Farm Security and Rural Investment Act Programs
06/2016

S E C T I O N I | M A N A G E M E N T ’ S D I S C U S S I O N A N D A N A L Y S I S
3 4 C R E A T I N G A U S D A F O R T H E 2 1 S T C E N T U R Y
The following exhibit provides information on the status of corrective actions already completed
and FY 2016 planned corrective actions related to the deficiency.
Exhibit 20: Summary of Corrective Actions/Noncompliance with Laws And Regulations
Summary of Corrective Actions for Noncompliance with Laws and Regulations
Improper Payments Elimination and Recovery Act of 2010 (IPERA)
IPERA noncompliance issues (Food and Nutrition Service [FNS], Farm Service Agency [FSA], Natural Resources Conservation Service [NRCS], and Forest Service [FS]).
Overall Estimated Completion Date FY 2021
FY 2015 Accomplishments: FY 2016 Planned Actions:
FNS has:
Improved the application process for free and reduced-price meals in the National School Lunch Program and School Breakfast Program by making it easier to complete and process the application. Simplifying the process should reduce errors made by both the applicants and reviewers.
Addressed certification error in the National School Lunch Program and School Breakfast Program by increasing the number of SFAs and schools participating in the Community Eligibility Provision to expand direct certification. Direct certification reduces certification error in the application process by eliminating individual applications from the process.
Developed and implemented training programs and established professional certification standards for school food service workers in an effort to reduce meal claiming errors.
Held a series of seven regional webinars in FY 2014, which provided training and technical assistance on the Income Eligibility Guidance and addressed specific questions and circumstances raised by WIC State agencies.
FNS will:
Publish the School Nutrition and Meal Cost Study, an examination of the relationships between school environment and school food service operations, nutritional quality of meals offered and served in school meal programs, plate waste, costs to produce reimbursable meals, student participation, participant characteristics, satisfaction and related attitudes toward the school lunch and breakfast programs. Primary data collection occurred in school year 2014–2015. A final report is due in early 2017.
Publish a proposed rule by March 31, 2016, which will strength program compliance by prohibiting any school, institution, or individual that is terminated from one of the Child Nutrition Programs and on a list of disqualified institutions and individuals from participating in, or administering any of the Child Nutrition Programs.
Issue Certification Guidance by September 30, 2016 that will provide clarification of policy related to income, identity and residency requirements in a single document. This will provide easy reference for State and local agency use.
Publish a proposed rule “Providing Child Nutrition Program Integrity” by March 31, 2016. This rule will provide additional CACFP audit funding, making additional monies available to State agencies for program improvement.

F I S C A L Y E A R 2 0 1 5 A G E N C Y F I N A N C I A L R E P O R T
U . S . D E P A R T M E N T O F A G R I C U L T U R E 3 5
FY 2015 Accomplishments: FY 2016 Planned Actions:
FSA has: FSA will:
Issued a notice in September 2015 to field offices for the Livestock Forage Disaster Program to reinforce policies on acceptable evidence that grazing land is owned or leased by a producer, and to emphasize that documentation must be filed before the application is approved.
Sent a directive to all State and county offices reminding employees of the importance of second party reviews and verification of data, prior to finalizing any carry over payment activity. In addition to second party reviews conducted by the county office, all carry over payment activity will require the District Director’s initials prior to payment, thus holding them accountable for accurate payments. This action was completed in September 2015 for SURE program.
Rewritten the Noninsured Crop Disaster Assistance Program (NAP) handbook to clarify policy and procedure, and to include new provisions authorized by the 2014 Farm Bill. Handbook 1-NAP, Revision 2, was issued to field offices on February 20, 2015.
Conduct Acreage Reporting Target Reviews to mitigate improper payments caused by errors related to county office acreage reporting activities by December 31, 2015 for NAP.
Revise the NAP Basic Provisions by December 31, 2015. This provides producers with the terms and conditions for program participation and payment eligibility as well as clarifies producer responsibilities.
Develop a customer training package to educate producers on NAP recordkeeping requirements and introduce them to a NAP tool to collect data for production reporting by December 31, 2015.

S E C T I O N I | M A N A G E M E N T ’ S D I S C U S S I O N A N D A N A L Y S I S
3 6 C R E A T I N G A U S D A F O R T H E 2 1 S T C E N T U R Y
FY 2015 Accomplishments: FY 2016 Planned Actions:
NRCS has: NRCS will:
Issued National Instruction (NI) 120-354, on July 18, 2014, that provided States with guidance on how to verify compliance with the Data Universal Numbering System/System for Award Management (Sam.gov) requirements, as originally outlined in NI 120-329 issued January, 2011. In particular, NI 120-354 identified that NRCS will verify that the entity type has fully complied with these requirements prior to awarding a conservation program contract or agreement, and that failure to comply with these requirements will be cause for NRCS to use that determination as a basis for making an award to another eligible applicant. Additionally, for these applications, the records were checked, and the registration status confirmed for each payment thereafter.
Implemented the Enhanced Internal Controls Group nationwide in January 2015. The group was formed primarily to address improper payments, specifically, easement value, landowner eligibility, agreement validity, easement obligation, and payment documentation. As a new process was implemented nationally, EPD initiated bi-weekly question and answer sessions to discuss the enhanced internal controls process, checklists, review timing, and National Easement Staging Tool functions.
Enhanced Protracts in August, 2015 to check SAM.gov registrations automatically at obligation and payment.
NRCS will aggressively test for improper payments to determine the effectiveness of the corrective actions.
FY 2015 Accomplishments: FY 2016 Planned Actions:
FS has:
Recommended an adjustment to move the expenditure charged on the Hurricane Sandy Fund CMDF to the proper fund for Trails Maintenance CMTL. An adjustment was completed by the agency for the $8,278.00 expenditure originally billed to the Hurricane Sandy job code. Completed on June 30, 2015.
FS will:
Washington Office Acquisition Management released a letter reminding Grants and Agreements Specialists of their responsibility to properly review invoices. To be completed by December 31, 2015.
Audit and Assurance will conduct a training by February 29, 2016 to reiterate the roles and responsibilities of the FS for grants and agreement management and recipients.

F I S C A L Y E A R 2 0 1 5 A G E N C Y F I N A N C I A L R E P O R T
U . S . D E P A R T M E N T O F A G R I C U L T U R E 3 7
Federal Financial Management Improvement Act Report on Financial Management Systems
Background
The Federal Financial Management Improvement Act (FFMIA) is designed to improve financial
and program managers’ accountability, provide better information for decision making, and
improve the efficiency and effectiveness of Federal programs. FFMIA requires that financial
management systems provide reliable, consistent disclosure of financial data in accordance with
generally accepted accounting principles and standards. These systems must also comply
substantially with (1) Federal Financial Management System (FFMS) requirements;
(2) applicable Federal accounting standards; and (3) the U.S. Standard General Ledger (USSGL)
at the transaction level.
Additionally, the Federal Information Security Management Act (FISMA) requires that there be
no significant weaknesses in information security policies, procedures, or practices to be
substantially compliant with FFMIA. The information technology noncompliance is also
reported as a material weakness and is included in the Federal Managers’ Financial Integrity Act
(FMFIA) Report on Management Control (Exhibit 17). This weakness is comprised of two major
issues: logical access controls/personnel security and configuration management. More detailed
information on the status of corrective actions planned and to be completed to comply with
FISMA is also provided in the Response to Management Challenges section of this report,
Challenge 3: Information Technology Security Needs Continuing Improvement.
The following exhibit contains the outstanding initiatives to achieve compliance.
Exhibit 21: Initiatives to Be Completed
Outstanding Initiatives to Achieve FFMIA Compliance
Initiative Section of Noncompliance Agency Target
Completion Date
Information Technology
Federal Financial Management System (FFMS) requirements, and information security policies, procedures, and/or practices.
Multiple 9/30/2016
Financial Management
Federal accounting standards, and U.S. Standard General Ledger (USSGL) at the transaction level.
NRCS 9/30/2016
Federal accounting standards. CCC 9/30/2016
USSGL at the transaction level. CCC 9/30/2017

S E C T I O N I | M A N A G E M E N T ’ S D I S C U S S I O N A N D A N A L Y S I S
3 8 C R E A T I N G A U S D A F O R T H E 2 1 S T C E N T U R Y
Fiscal Year 2015 Results
During FY 2015, USDA evaluated its financial management systems to assess substantial
compliance with FFMIA. In assessing FFMIA compliance, the Department considered auditors’
opinions on component agencies’ financial statements, and progress made in addressing the
material weaknesses identified in the Fiscal Year 2014 Agency Financial Report. Due to the
CCC’s inability to record obligations at the transactional level in various program feeder systems
and comply with certain Federal accounting standards, and NRCS’ beginning balances, current
activity, and accounting for obligations and revenue, the Department is not compliant with
Federal accounting standards and the USSGL at the transaction level. Additionally, as reported
in the FMFIA section of this report, USDA continues to have weaknesses in information
technology controls and Federal Financial Management Systems requirement that result in
noncompliance with the FISMA requirement. As part of its financial systems strategy, USDA
agencies continue working to meet FFMIA and FISMA objectives.
COMMODITY CREDIT CORPORATION (CCC)
The Commodity Credit Corporation (CCC) operates a stand-alone program and core financial
system infrastructure that is not integrated with the Department’s financial system (FMMI). The
CCC Core Accounting System (CORE) general ledger provides summary financial data to the
Department, and maintains detail financial transactions in legacy program and core financial
systems. CCC has a Material Weakness because of the inability to perform an automated and
real-time funds control for certain contracts at the time they are fully executed. To address the
Material Weakness, CCC has implemented several business process and system improvements to
record, track, and report obligations at the detail transaction level, which is a major step towards
mitigating CCC’s material weakness. A phased implementation has been in progress during
FY 2015 to bring Program and Financial Management applications into full compliance with the
Federal Financial Management Improvement Act (FFMIA) of 1996. Complete implementation
for full funds controls is targeted for completion in FY 2017.
In addition, FSA/CCC has successfully moved two of the three financially significant
applications off the IBM AS400/S36 platform hosting county office applications, addressing
CCC’s deficiencies for having antiquated hardware and expired system maintenance plans.
Automated Price Support System (APSS) 2014 crop year loans remain on the AS400, with a
target date of closing out by April 2016.
Noncompliance with Federal accounting standards was noted for inability to adequately track
obligations for Agriculture Risk Coverage (ARC) and Price Loss Coverage (PLC) programs;
deobligate undelivered orders for remaining balances at the time payments are made, which
requires management to subsequently analyze the account balance to identify deobligations,
which is subject to human error; and adequately account for grant transactions arising through
parent/child relationships.

F I S C A L Y E A R 2 0 1 5 A G E N C Y F I N A N C I A L R E P O R T
U . S . D E P A R T M E N T O F A G R I C U L T U R E 3 9
NATURAL RESOURCES CONSERVATION SERVICE (NRCS)
NRCS is not in substantial compliance with FFMIA as it relates to applicable Federal accounting
standards and USSGL at the transaction level. NRCS does not record transactions in the proper
periods.
NRCS continues working to mitigate auditor-identified deficiencies and substantially comply
with FFMIA. The following deficiencies in applicable Federal accounting standards were found:
Compliance for beginning net position balances and current year activity; obligations incurred,
including accrued expenses and undelivered orders, recoveries of prior year unpaid obligations,
and advances to others.
USSGL appropriate posting models were not used for recoveries of prior year obligations paid
and unpaid, and nonproduction costs.

S E C T I O N I | M A N A G E M E N T ’ S D I S C U S S I O N A N D A N A L Y S I S
4 0 C R E A T I N G A U S D A F O R T H E 2 1 S T C E N T U R Y
Financial Management Systems Strategy On May 2, 2014, the Office of Management and Budget (OMB) and the U.S. Department of the
Treasury designated USDA National Finance Center (NFC) as a Federal Shared Service
Provider (FSSP).
USDA is supporting OMB Memorandum M-13-08 Improving Financials through Shared
Services, which directs agencies to do the following:
Move from agency-specific financial systems to FSSP;
Consolidate financial management systems; and
Use existing FSSP operations and maintenance teams to support systems and
infrastructures.
The designation allows USDA to provide financial management services to Federal agencies.
In 2015, the USDA Office of the Chief Financial Officer (OCFO) separated NFC resources that
were supporting the financial management systems and services into a new business center,
called Financial Management Services (FMS), to provide an integrated solution and better
customer service.
Financial Management Lines of Business
In 2015, USDA partnered with the General Services Administration (GSA) to shift GSA’s
financial system and services offering to its portfolio. This transition was effective March 21,
2015. As a result, USDA is positioned to offer either SAP or Momentum to customers looking
for a FSSP that can meet their needs.
USDA has two separate lines of business to support existing and future customers. The SAP
offering is housed in the FMS Division. Momentum is part of the Pegasys Financial Systems
(PFS) Division. This organizational structure allows each line of business to focus on their
specific customers, services, and systems.
Mission
USDA’s mission as an FSSP is to provide reliable, cost-effective, employee-centric systems and
services to Federal organizations, thus allowing our customers to focus on serving this great
Nation through their mission delivery. FMS’ goal is to provide the necessary activities for
executing the Financial Management Line of Business vision. The three key components of this
vision are communication, governance, and operations. By executing these components, USDA
will deliver a successful shared service offering.

F I S C A L Y E A R 2 0 1 5 A G E N C Y F I N A N C I A L R E P O R T
U . S . D E P A R T M E N T O F A G R I C U L T U R E 4 1
USDA’s activities are focused on financial management services. The list of financial
management services includes as follows:
Budget execution;
General ledger accounting;
Financial reporting;
Audit support;
Payroll accounting;
Investment accounting;
Commercial vendor payments;
Temporary duty travel payments;
Permanent change of station employee relocation payments;
Grant payments;
Purchase card payments;
Lease accounting;
Intra-governmental payments;
Intra-governmental collections;
Receivable management; and
Property accounting.
By offering a solution that is proven and operating, and which meets all compliance
requirements, a customer is jump-started in coming online with a state-of-the-art, fully
financially configured Enterprise Resource Planning (ERP) solution. USDA’s primary objectives
for this shared services effort are to provide the following:
An enterprise financial management service that allows customers to reap the benefits in
increased service quality, including faster, less expensive, and less risk as compared to
starting with a new Enterprise Resource Planning or financial management
implementation;
Integration with NFC payroll processing services;
A complete audit compliant financial solution with full documentation meeting financial
requirements;
Continuous process, operational, and organizational improvements for those shared
services retained in the future state portfolio;
More powerful and flexible financial management and reporting;

S E C T I O N I | M A N A G E M E N T ’ S D I S C U S S I O N A N D A N A L Y S I S
4 2 C R E A T I N G A U S D A F O R T H E 2 1 S T C E N T U R Y
Administrative payments, collections, and certifications;
Editing/auditing capabilities that are 100-percent computerized; and
The best possible customer-focused service and support.
Provider Status
As an FSSP, USDA FMS continues to work with the Office of Financial Innovation and
Transformation (FIT) to ensure our FMS-based services adhere to the required guidelines with
respect to services, pricing, governance and service level metrics. The FSSP certification
required to obtain new financial system customers is currently only in place for the Systems,
Applications and Products (SAP) offering. USDA PFS is allowed to service existing customers
transferred from GSA; USDA PFS is expected to apply for the Pegasys certification in late 2015.
Successes
During FY 2015, USDA succeeded in the following ways:
Brought the former GSA Shared Services organization and its Momentum product under
the USDA umbrella.
Continued to enhance the SAP Grants solution with the Foreign Agricultural Service being
the first agency to adopt the solution.
Brought the Federal Government’s largest grants program, the Food and Nutrition
Service’s Supplemental Nutrition Assistance Program, into the USDA SAP Grants
solution. USDA also brought grants programs from NRCS and AMS into the USDA
solution.
Opened discussions with Rural Development about bringing loans into the USDA SAP
corporate solution.
Opened discussions with the U.S. Department of Homeland Security to bring four DHS
component agencies into the SAP FSSP offering.
Future Roadmap
USDA goals for the future include as follows:
Providing Financial Systems and Services to Federal agencies outside USDA, using both
the SAP and Momentum products;
Rolling the SAP Grants solution out to all USDA agencies and to agencies outside USDA;
and
Beginning the integration of loan programs into the SAP solution within USDA.

F I S C A L Y E A R 2 0 1 5 A G E N C Y F I N A N C I A L R E P O R T
U . S . D E P A R T M E N T O F A G R I C U L T U R E 4 3
Projected FY 2015 and FY 2016 planned releases and upgrades include the following:
SAP software release;
General Financial Management Modernization Initiative enhancements;
Grants.gov integration;
High-Performance Analytic Appliance (HANA) business warehouse; and
Financial Statement Data Warehouse (FSDW) migration.
PFS Roadmap
USDA worked with GSA and completed an upgrade to Pegasys Momentum version 7.1.2 from
the previous 6.5 version on April 15, 2015. USDA is working to complete the final phase of the
Billing and Accounts Receivable Module (BAAR) project, and the final Wave 3.4 will be
implemented in February 2016.
Momentum 7.1.2 incorporates more than 160 new features and enhancements designed to meet
current legislative and Government-mandated Federal financial management requirements and
recommendations, including the Government-wide Treasury Account Symbol Adjusted Trial
Balance System (GTAS), Do Not Pay (DNP), the System for Award Management (SAM), and
Payment Application Modernization (PAM).
USDA intends to apply to offer Momentum as a Federal Shared Service Provider to other
Federal agencies in 2015.

S E C T I O N I | M A N A G E M E N T ’ S D I S C U S S I O N A N D A N A L Y S I S
4 4 C R E A T I N G A U S D A F O R T H E 2 1 S T C E N T U R Y
Other Management Information, Initiatives, and Issues:
Eliminating Improper Payments
In fiscal year (FY) 2015, the U.S. Department of Agriculture (USDA) improper payment rate
was 5.69 percent, an increase from the 5.52 percent improper payment rate reported for FY 2014.
Ten USDA high-risk programs appear to be fully compliant with the Improper Payments
Elimination and Recovery Act of 2010 in FY 2015.
USDA took significant actions during FY 2015 to address improper payments as follows:
Determined that the Wildland Fire Suppression Management, Milk Income Loss Contract
Program, and Direct and Counter-Cyclical Payments have consistently reduced their
improper payments to the point that they are no longer at high risk for making improper
payments. With concurrence from the Office of Inspector General (OIG) and Office of
Management and Budget (OMB), USDA has removed them from the improper payments
high-risk list of programs at high-risk of improper payments.
Implemented a statistically valid methodology to accurately test and report improper
payment results for the Federal Crop Insurance Corporation Program Fund, administered
by USDA’s Risk Management Agency (RMA). OMB approved RMA’s plan to change its
statistical sampling approach.
Implemented the Do Not Pay Portal with the U.S. Department of the Treasury. The
implementation of this portal allows checks on all USDA post payments against the public
Death Master File, commercially known as the Social Security Death Index, and the private
System for Award Management (SAM) Exclusion lists to verify payments.
Executed an expansion of the supplier credit audit to include commodity payments made
through the Web-Based Supply Chain Management system.
Recovered approximately $384 million in improper payments.
Detailed improper payment results and corrective actions are provided in Section III, Other
Information.
Digital Accountability and Transparency Act (DATA Act)
The DATA Act was enacted on May 9, 2014. This Act amends the Federal Financial
Accountability and Transparency Act of 2006 (FFATA) and requires reporting of Federal
financial assistance and procurement transaction to a public Website by May 2017. FFATA
requires reporting of obligations and award-related information for all Federal financial
assistance and procurement awards. The DATA Act expands upon FFATA by adding
account-level reporting; this includes reporting all Treasury Symbols that fund each award or

F I S C A L Y E A R 2 0 1 5 A G E N C Y F I N A N C I A L R E P O R T
U . S . D E P A R T M E N T O F A G R I C U L T U R E 4 5
contract transaction, budget authority, outlays, and budget object classes, among other data
elements. The DATA Act also requires the Federal Government to collectively standardize the
data elements that will be reportable under the Act. The Office of Management and Budget
(OMB) and the U.S. Department of the Treasury (Treasury) will conduct a pilot to reduce
reporting burdens on recipients of awards and contracts.
OMB and Treasury are developing guidance for implementation. The first round of guidance was
issued in May 2015 in OMB Memorandum 15-121. Treasury issued a draft of the DATA Act
data schema2 in July 2015. OMB has issued data standards for 57 data elements as of
August 2015. USDA participates in the development of the standards and is a government leader
in the workgroups charged with the DATA Act implementation government-wide.
The Office of the Chief Financial Officer (OCFO) leads the DATA Act implementation for
USDA. OCFO is developing technical and functional requirements for the data elements that will
need to be reported and is establishing the account-level reports needed to be compliant. As new
information, guidance, and standards emerge for the government-wide workgroups, OCFO is
assimilating the information into its implementation plan and communicating these changes to
the USDA DATA Act implementation team. OCFO is developing a data warehouse for the
Department to collect all DATA Act elements. The warehouse will be connected to
USAspending.gov and will report the data using Treasury’s data broker.
USDA’s Senior Accountable Official, the Deputy Chief Financial Officer, established a USDA
DATA Act implementation team, which is led by OCFO. This group works on inventorying
DATA Act elements in the USDA agency source systems and is preparing for any needed
system changes to become compliant. USDA has three main general ledgers and multiple awards
systems where data resides. By May 2017, at least four USDA agencies will be using the
Department’s grants system, which will improve reporting capabilities and will provide
standardization for many grants programs. More agencies are exploring migration to the
Department’s grants solution potentially yielding even more efficiencies and standardization.
OCFO is also working with the Office of Procurement and Property Management (OPPM) to
ensure that procurement reporting will adhere to DATA Act requirements. Together, OCFO and
OPPM are reviewing procurement reporting policies and procedures to ensure that data is
reported and certified by the agencies to be both timely and accurate in the Department’s
Integrated Acquisition System as well as other procurement systems used by FS and FSA.
1 https://www.whitehouse.gov/sites/default/files/omb/memoranda/2015/m-15-12.pdf
2 http://fedspendingtransparency.github.io/data-exchange-standard/

S E C T I O N I | M A N A G E M E N T ’ S D I S C U S S I O N A N D A N A L Y S I S
4 6 C R E A T I N G A U S D A F O R T H E 2 1 S T C E N T U R Y
Limitations of Financial Statements
The principal financial statements have been prepared to report the financial position and results
of operations of the entity, pursuant to the requirements of 31 U.S.C. 3515(b). While the
statements have been prepared from the books and records of the entity in accordance with
generally accepted accounting principles for Federal entities and the formats prescribed by
OMB, the statements are in addition to the financial reports used to monitor and control
budgetary resources, which are prepared from the same books and records.
The statements should be read with the realization that they are for a component of the
U.S. Government, a sovereign entity.
F I S C A L Y E A R 2 0 1 5 A G E N C Y F I N A N C I A L R E P O R T
U . S . D E P A R T M E N T O F A G R I C U L T U R E 4 7
Section II: Financial Information
Message from Chief Financial Officer The U.S. Department of Agriculture (USDA) is leading the charge in providing a safe, nutritious
and efficient food supply with a concentrated investment in the economic growth of rural
America. With over $200 billion in assets, $143 billion in annual spending, and over $100 billion
in loans to America’s farmers and ranchers, responsible financial controls are a necessity that we
embrace. Our mission includes feeding upwards of 46 million families a day and would not be
possible without reliable controls. USDA’s focus on responsible financial stewardship is a vital
component in supporting program delivery of the very tangible work of the Department.
My goal as the Chief Financial Officer is to ensure USDA financial management practices are
constantly evolving in order to meet the needs of a 21st Century Federal agency. The FY 2015
Agency Financial Report shows USDA’s commitment to honor the fiduciary duties entrusted to
us by the American taxpayers. It is a valuable summary of USDA’s use of resources, operating
performance, financial stewardship and internal controls. Furthermore, it is a tribute to the
excellent work of our employees who exercise financial stewardship and practice sound financial
management in their daily responsibilities.
USDA has strived to maintain financial integrity in a year marred by the unexpected. As a
Department, we have had to combat a highly pathogenic strain of the Avian Influenza (bird flu)
that has been detected in over 48 million birds in 2015 alone. The California drought coupled
with an unprecedented surge in wildfires has placed an undue burden on the Department’s
personnel, property and financial resources, costing us 7 lives lost in the line of duty and
expenditures upwards of $150 million per week on fire suppression activities.
More positively, USDA successfully entered into its first year as a Federal Shared Service
Provider (FSSP) collaborating with the General Services Administration (GSA) to transition
293 financial management employees to USDA. The USDA FSSP model will service other
federal trading partners with our host financial systems and expert staff. It will also strengthen
transactional and program activity with a heightened monitoring of internal controls to enhance
accountability and identify concerns.
NRCS continued to make financial management improvements, streamline processes, and create
efficiencies in financial processing. A robust internal control review process was implemented
while integrating audit remediation efforts with the internal control review and daily operations.
Specifically, significant improvements were made in the areas of obligations and advance
balances, unfilled customer orders, and the financial reporting. In addition, NRCS continued its

S E C T I O N I I | F I N A N C I A L I N F O R M A T I O N
4 8 C R E A T I N G A U S D A F O R T H E 2 1 S T C E N T U R Y
transformation of administrative services by launching the accounts payable and travel teams,
transitioning to a new travel system, and establishing local support teams in each state office.
Even still, there is more work to do, particularly related to management challenges. We
recognize the importance of continuous process improvement over our internal controls
including any areas of weakness identified by our independent auditors. The Office of Inspector
General (OIG) has made assessments of our management challenges and we are committed to
expediting the resolution of any deficiencies reported and will continue to build upon
experiences gained through our annual financial statement audit.
We, at every level, are committed to being a proactive, cost-effective organization that is
transparent and accountable for the programs we deliver.
Jon M. Holladay
Chief Financial Officer
February 12, 2016

F I S C A L Y E A R 2 0 1 5 A G E N C Y F I N A N C I A L R E P O R T
U . S . D E P A R T M E N T O F A G R I C U L T U R E 4 9
Independent Auditors Report
Awaiting Section

S E C T I O N I I | F I N A N C I A L I N F O R M A T I O N
5 0 C R E A T I N G A U S D A F O R T H E 2 1 S T C E N T U R Y
Agency Response to Auditors Report
Awaiting Section

F I S C A L Y E A R 2 0 1 5 A G E N C Y F I N A N C I A L R E P O R T
U . S . D E P A R T M E N T O F A G R I C U L T U R E 5 1
Consolidated Financial Statements
Consolidated Balance Sheet As of September 30, 2015 and 2014 (In Millions)
2015 2014
Assets (Note 2):Intragovernmental:
Fund Balance with Treasury (Note 3) 113,316$ 101,717$ Investments (Note 5) 188 150 Accounts Receivable, Net (Note 6) 93 107 Other (Note 11) 3 3
Total Intragovernmental 113,600 101,977
Cash and Other Monetary Assets (Note 4) 234 173 Investments (Note 5) 3 3 Accounts Receivable, Net (Note 6) 1,574 1,377 Direct Loan and Loan Guarantees, Net (Note 7) 98,894 101,243 Inventory and Related Property, Net (Note 8) 55 38 General Property, Plant, and Equipment, Net (Note 9) 2,667 2,841 Other (Note 11) 228 189
Total Assets 217,255 207,841
Stewardship PP&E (Note 10)
Liabilities (Note 12):Intragovernmental:
Accounts Payable 3 4 Debt (Note 13) 114,232 114,102 Other (Note 15) 11,966 12,394
Total Intragovernmental 126,201 126,500
Accounts Payable 1,832 2,277 Loan Guarantee Liability (Note 7) 5,590 5,373 Federal Employee and Veteran Benefits 893 955 Environmental and Disposal Liabilities (Note 14) 193 196 Benefits Due and Payable 4,835 4,362 Other (Notes 15 & 16) 21,314 19,672 Total Liabilities 160,858 159,335
Commitments and Contingencies (Note 17)
Net Position:Unexpended Appropriations - Funds From Dedicated Collections (Note 18) 131 120 Unexpended Appropriations - All Other Funds 48,041 43,232 Cumulative Results of Operations - Funds From Dedicated Collections(Note 18) 1,920 2,315 Cumulative Results of Operations - All Other Funds 6,305 2,839
Total Net Position - Funds From Dedicated Collections 2,051 2,435 Total Net Position - All Other Funds 54,346 46,071
Total Net Position 56,397 48,506
Total Liabilities and Net Position 217,255 207,841
The accompanying notes are an integral part of these statements.

S E C T I O N I I | F I N A N C I A L I N F O R M A T I O N
5 2 C R E A T I N G A U S D A F O R T H E 2 1 S T C E N T U R Y
Consolidated Statement of Net Cost For the Years Ended September 30, 2015 and 2014 (In Millions)
2015 2014
Assist Rural Communities to Create Prosperity so They AreSelf-Sustaining, Repopulating, and Economically Thriving:
Gross Costs 27,910$ 31,969$ Less: Earned Revenue 8,016 8,284
Net Costs 19,894 23,685
Ensure Our National Forests and Private Working Lands AreConserved, Restored, and Made More Resilient to Climate Change,While Enhancing Our Water Resources:
Gross Costs 13,135 12,311 Less: Earned Revenue 941 912
Net Costs 12,194 11,399
Help America Promote Agricultural Production and Biotechnology Exports as America Works to Increase Food Security:
Gross Costs 2,302 2,494 Less: Earned Revenue 198 197
Net Costs 2,104 2,297
Ensure that All of America's Children Have Accessto Safe, Nutritious, and Balanced Meals:
Gross Costs 108,202 107,417 Less: Earned Revenue 993 993
Net Costs 107,209 106,424
Create a USDA for the 21st Century That is High Performing,Efficient, and Adaptable:
Gross Costs 1,289 1,265 Less: Earned Revenues 183 177
Net Costs 1,106 1,088
Total Gross Costs 152,838 155,456 Less: Total Earned Revenue 10,331 10,563
Net Cost of Operations (Note 19) 142,507$ 144,893$
The accompanying notes are an integral part of these statements.

F I S C A L Y E A R 2 0 1 5 A G E N C Y F I N A N C I A L R E P O R T
U . S . D E P A R T M E N T O F A G R I C U L T U R E 5 3
Consolidated Statement of Changes in Net Position For The Year Ended September 30, 2015 (In Millions)
Funds FromDedicatedCollections All Other Consolidated(Note 18) Funds Eliminations Total
Cumulative Results of Operations:Beginning Balances 2,315$ 2,839$ -$ 5,154$
Budgetary Financing Sources:Other Adjustments (recissions, etc.) - (496) - (496) Appropriations Used - 136,168 - 136,168 Non-exchange Revenue - 12 - 12 Donations and Forfeitures of Cash and Equivalents 1 - - 1 Transfers In (Out) without Reimbursement (19) 9,535 981 10,497
Other Financing Sources (Non-Exchange):Transfers In (Out) without Reimbursement (119) 982 (981) (118) Imputed Financing 48 3,552 (2,620) 980 Other 301 (1,767) - (1,466)
Total Financing Sources 212 147,986 (2,620) 145,578
Net Cost of Operations (607) (144,520) 2,620 (142,507)
Net Change (395) 3,466 - 3,071
Cumulative Results of Operations 1,920 6,305 - 8,225
Unexpended Appropriations:Beginning Balances 120 43,232 - 43,352
Budgetary Financing Sources: Appropriations Received 11 147,312 - 147,323 Appropriations Transferred In (Out) - - - - Other Adjustments - (6,335) - (6,335) Appropriations Used - (136,168) - (136,168)
Total Budgetary Financing Sources 11 4,809 - 4,820
Unexpended Appropriations 131 48,041 - 48,172
Net Position 2,051$ 54,346$ -$ 56,397$
The accompanying notes are an integral part of these statements.

S E C T I O N I I | F I N A N C I A L I N F O R M A T I O N
5 4 C R E A T I N G A U S D A F O R T H E 2 1 S T C E N T U R Y
Consolidated Statement of Changes in Net Position For The Year Ended September 30, 2014 (In Millions)
The accompanying notes are an integral part of these statements.
Funds FromDedicated
Collections All Other Consolidated
(Note 18) Funds Eliminations Total
Cumulative Results of Operations:
Beginning Balances 1,575$ 6,877$ -$ 8,452$
Budgetary Financing Sources:
Other Adjustments (recissions, etc.) (1) (479) - (480)
Appropriations Used (1) 133,351 - 133,350
Non-exchange Revenue - 9 - 9
Donations and Forfeitures of Cash and Equivalents 1 - - 1
Transfers In (Out) without Reimbursement 901 8,506 233 9,640
Other Financing Sources (Non-Exchange):
Transfers In (Out) without Reimbursement (64) 231 (233) (66)
Imputed Financing 48 3,260 (2,457) 851 Other 90 (1,800) - (1,710)
Total Financing Sources 974 143,078 (2,457) 141,595
Net Cost of Operations (234) (147,116) 2,457 (144,893)
Net Change 740 (4,038) - (3,298)
Cumulative Results of Operations 2,315 2,839 - 5,154
Unexpended Appropriations:
Beginning Balances 107 33,738 - 33,845
Budgetary Financing Sources:
Appropriations Received 12 150,627 - 150,639
Appropriations Transferred In (Out) - 4 - 4
Other Adjustments - (7,786) - (7,786)
Appropriations Used 1 (133,351) - (133,350)
Total Budgetary Financing Sources 13 9,494 - 9,507
Unexpended Appropriations 120 43,232 - 43,352
Net Position 2,435$ 46,071$ -$ 48,506$

F I S C A L Y E A R 2 0 1 5 A G E N C Y F I N A N C I A L R E P O R T
U . S . D E P A R T M E N T O F A G R I C U L T U R E 5 5
Combined Statement of Budgetary Resources For The Years Ended September 30, 2015 and 2014 (In Millions)
2015 2014Non-Budgetary Non-BudgetaryCredit Reform Credit Reform
Financing FinancingBudgetary Accounts Budgetary Accounts
Budgetary Resources:Unobligated balance, brought forward, October 1: 44,934$ 9,621$ 33,731$ 8,758$ Recoveries of prior year unpaid obligations 5,558 2,919 2,655 1,266 Other changes in unobligated balance (+ or -) (1,895) (5,486) (2,520) (4,812) Unobligated balance from prior year budget authority, net 48,597 7,054 33,866 5,212 Appropriations (discretionary and mandatory) 144,795 2 151,153 21 Borrowing authority (discretionary and mandatory) 6,794 12,468 14,648 10,704 Spending authority from offsetting collections (discretionary and mandatory) 9,570 12,424 10,501 8,490 Total budgetary resources 209,756 31,948 210,168 24,427
Status of Budgetary Resources:Obligations Incurred (Note 23) 160,080 18,152 165,234 14,806 Unobligated balance, end of year:Apportioned 13,701 9,882 19,966 5,522 Exempt from apportionment 167 3 195 8 Unapportioned 35,808 3,911 24,773 4,091 Total unobligated balance, end of year 49,676 13,796 44,934 9,621 Total budgetary resources 209,756 31,948 210,168 24,427
Change in Obligated Balance:Unpaid obligations:Unpaid obligations, brought forward, October 1 37,406 23,065 36,260 25,009 Obligations incurred 160,080 18,152 165,234 14,806 Outlays (gross) (-) (158,840) (17,409) (161,433) (15,484) Recoveries of prior year unpaid obligations (-) (5,558) (2,919) (2,655) (1,266) Unpaid obligations, end of year 33,088 20,889 37,406 23,065 Uncollected payments:Uncollected customer payments from Federal sources, brought forward, October 1 (-) (2,139) (655) (2,167) (912) Change in uncollected customer payments from Federal sources (+ or -) 61 82 28 257 Uncollected payments, Federal sources, end of year (-) (2,078) (573) (2,139) (655) Memorandum (non-add) entries:Obligated balance, start of year (+ or -) 35,267 22,410 34,093 24,097 Obligated balance, end of year (+ or -) 31,010 20,316 35,267 22,410
Budget Authority and Outlays, Net:Budget authority, gross (discretionary and mandatory) 161,159 24,894 176,302 19,215 Actual offsetting collections (discretionary and mandatory) (-) (16,914) (18,804) (17,079) (13,142) Change in uncollected customer payments from Federal sources 61 82 28 257 (discretionary and mandatory)(+ or -) - - - - Anticipated offsetting collections (discretionary and mandatory) (+ or -) - - - - Budget authority, net (discretionary and mandatory) 144,306 6,172 159,251 6,330
Outlays, gross (discretionary and mandatory) 158,840 17,409 161,433 15,484 Actual offsetting collections (discretionary and mandatory) (-) (16,914) (18,804) (17,079) (13,142) Outlays, net (discretionary and mandatory) 141,926 (1,395) 144,354 2,342 Distributed offsetting receipts (-) (948) (1,886) (911) (1,622) Agency outlays, net (discretionary and mandatory) 140,978$ (3,281)$ 143,443$ 720$
The accompanying notes are an integral part of these statements.

S E C T I O N I I | F I N A N C I A L I N F O R M A T I O N
5 6 C R E A T I N G A U S D A F O R T H E 2 1 S T C E N T U R Y
Notes to the Consolidated Financial Statements As of September 30, 2015 and 2014 (In Millions)
Note 1: Significant Accounting Policies
ORGANIZATION
USDA provides a wide variety of services in the United States and around the world. USDA is
organized into seven distinct mission areas and their agencies that execute these missions.
Listed below are the missions and the agencies within each mission including three Government
corporations:
FARM AND FOREIGN AGRICULTURAL SERVICES (FFAS)
Farm Service Agency (FSA)
o Commodity Credit Corporation (CCC)
Foreign Agricultural Service (FAS)
Risk Management Agency (RMA)
o Federal Crop Insurance Corporation (FCIC)
FOOD, NUTRITION, AND CONSUMER SERVICES (FNCS)
Food and Nutrition Service (FNS)
FOOD SAFETY
Food Safety and Inspection Service (FSIS)
MARKETING AND REGULATORY PROGRAMS (MRP)
Agricultural Marketing Service (AMS)
Animal and Plant Health Inspection Service (APHIS)
Grain Inspection, Packers and Stockyards Administration (GIPSA)

F I S C A L Y E A R 2 0 1 5 A G E N C Y F I N A N C I A L R E P O R T
U . S . D E P A R T M E N T O F A G R I C U L T U R E 5 7
NATURAL RESOURCES AND ENVIRONMENT (NRE)
Forest Service (FS)
Natural Resources Conservation Service (NRCS)
RESEARCH, EDUCATION, AND ECONOMICS (REE)
Agricultural Research Service (ARS)
National Institute of Food and Agriculture (NIFA)
Economic Research Service (ERS)
National Agricultural Statistics Service (NASS)
RURAL DEVELOPMENT
Rural Development (RD)
o Alternative Agricultural Research and Commercialization Corporation (AARC)
CONSOLIDATION
The financial statements consolidate all the agencies’ results. The effects of intradepartmental
activity and balances are eliminated, except for the Statement of Budgetary Resources that is
presented on a combined basis. The financial statements are prepared in accordance with
generally accepted accounting principles for the Federal Government.
RECLASSIFICATIONS
In FY 2014, The Statement of Net Cost, Note 19, and Schedule of Spending were reclassified to
align with the strategic goals presented in the USDA Strategic Plan for FY 2014–2018. A new
goal was added to create a USDA for the 21st century that is high performing, efficient, and
adaptable.
Interest related to technical reestimates was reclassified from interest rate reestimates in
Note 7—Table 2, Table 3, Table 7, and Table 8. Foreclosed property and loans acquired and
claim payments to lenders were reclassified from other adjustments in Note 7—Table 7.
Note 15 was reclassified to align with the USSGL crosswalk for other liabilities and to move the
non-current portion of unfunded FECA liability and underwriting gains on crop insurance from
current.

S E C T I O N I I | F I N A N C I A L I N F O R M A T I O N
5 8 C R E A T I N G A U S D A F O R T H E 2 1 S T C E N T U R Y
USE OF ESTIMATES
The preparation of financial statements requires management to make estimates and assumptions
that affect the amounts reported in the financial statements and accompanying notes. Actual
results could differ from those estimates.
REVENUE AND OTHER FINANCING SOURCES
Revenue from exchange transactions is recognized when persuasive evidence of an arrangement
exists, delivery has occurred or services have been rendered, sales price is fixed or determinable,
and collection is reasonably assured. In certain cases, the prices charged by the Department are
set by law or regulation, which for program and other reasons may not represent full cost. Prices
set for products and services offered through the Department’s working capital funds are
intended to recover the full costs incurred by these activities. Revenue from non-exchange
transactions is recognized when a specifically identifiable, legally enforceable claim to resources
arises, to the extent that collection is probable and the amount is reasonably estimable.
Appropriations are recognized as a financing source when used. An imputed financing source is
recognized for costs subsidized by other Government entities.
INVESTMENTS
The Department is authorized to invest certain funds in excess of its immediate needs in
Treasury securities. Investments in non-marketable par value Treasury securities are classified as
held to maturity and are carried at cost. Investments in market-based Treasury securities are
classified as held to maturity and are carried at amortized cost. The amortized cost of securities is
based on the purchase price adjusted for amortization of premiums and accretion of discounts
using the straight-line method over the term of the securities.
ACCOUNTS RECEIVABLE
Accounts receivable are reduced to net realizable value by an allowance for uncollectible
accounts. The adequacy of the allowance is determined based on past experience and age of
outstanding balances.
DIRECT LOANS AND LOAN GUARANTEES
Direct loans obligated and loan guarantees committed after fiscal 1991 are reported based on the
present value of the net cash-flows estimated over the life of the loan or guarantee. The
difference between the outstanding principal of the loans and the present value of their net cash
inflows is recognized as a subsidy cost allowance; the present value of estimated net cash
outflows of the loan guarantees is recognized as a liability for loan guarantees. The subsidy
expense for direct or guaranteed loans disbursed during the year is the present value of estimated
net cash outflows for those loans or guarantees. A subsidy expense also is recognized for
modifications made during the year to loans and guarantees outstanding and for reestimates

F I S C A L Y E A R 2 0 1 5 A G E N C Y F I N A N C I A L R E P O R T
U . S . D E P A R T M E N T O F A G R I C U L T U R E 5 9
made as of the end of the year to the subsidy allowances or loan guarantee liability for loans and
guarantees outstanding.
Direct loans obligated and loan guarantees committed before fiscal 1992 are valued using either
the present-value or net realizable methods. Under the present-value method, the outstanding
principal of direct loans is reduced by an allowance equal to the difference between the
outstanding principal and the present value of the expected net cash flows. The liability for loan
guarantees is the present value of expected net cash outflows due to the loan guarantees. Under
the net realizable value method, the average rate of the last five years of write-offs is used.
INVENTORIES AND RELATED PROPERTY
Inventories to be consumed in the production of goods for sale or in the provision of services for
a fee are valued on the basis of historical cost using a first-in, first-out method. Commodities are
valued at the lower of cost or net realizable value using a weighted average method. Barter
Delivery Obligations (BDO) are valued at the net sales proceeds. BDO are exchanged for food
products to be utilized in domestic and export food programs.
PROPERTY, PLANT AND EQUIPMENT
Property, Plant and Equipment (PP&E) are stated at cost less accumulated depreciation.
Depreciation is determined using the straight-line method over the estimated useful lives of the
assets. Useful lives for PP&E are disclosed in Note 9. Capitalization thresholds for personal
property and real property are $25,000 and $100,000 for internal use software. There are no
restrictions on the use or convertibility of PP&E.
PENSION AND OTHER RETIREMENT BENEFITS
Pension and other retirement benefits (primarily retirement health care benefits) expense is
recognized at the time the employees’ services are rendered. The expense is equal to the actuarial
present value of benefits attributed by the pension plan’s benefit formula, less the amount
contributed by the employees. An imputed cost is recognized for the difference between the
expense and contributions made by and for employees.
OTHER POST-EMPLOYMENT BENEFITS
Other post-employment benefits expense for former or inactive (but not retired) employees is
recognized when a future outflow or other sacrifice of resources is probable and measurable on
the basis of events occurring on or before the reporting date. The liability for long-term other
post-employment benefits is the present value of future payments.

S E C T I O N I I | F I N A N C I A L I N F O R M A T I O N
6 0 C R E A T I N G A U S D A F O R T H E 2 1 S T C E N T U R Y
FUNDS FROM DEDICATED COLLECTIONS
In accordance with Statement of Federal Financial Accounting Standards (SFFAS) 43, Funds
from Dedicated Collections, USDA has reported the funds from dedicated collections for which
it has program management responsibility when the following three criteria are met: (1) a statute
committing the Federal Government to use specifically identified revenues and/or other
financing sources that are originally provided to the Federal Government by a non-Federal
source only for designated activities, benefits or purposes; (2) explicit authority for the fund to
retain revenues and/or other financing sources not used in the current period for future use to
finance the designated activities, benefits, or purposes; and (3) a requirement to account for and
report on the receipt, use, and retention of the revenues and/or other financing sources that
distinguishes the fund from the Federal Government’s general revenues.
CONTINGENCIES
Contingent liabilities are recognized when a past event or exchange transaction has occurred, a
future outflow or other sacrifice of resources is probable, and the future outflow or sacrifice of
resources is measurable.
ALLOCATION TRANSFERS
USDA is a party to allocation transfers with other federal agencies as both a transferring (parent)
entity and/or a receiving (child) entity. Allocation transfers are legal delegations by one
department of its authority to obligate budget authority and outlay funds to another department.
A separate fund account (allocation account) is created in the U.S. Treasury as a subset of the
parent fund account for tracking and reporting purposes. All allocation transfers of balances are
credited to this account, and subsequent obligations and outlays incurred by the child entity are
charged to this allocation account as they execute the delegated activity on behalf of the parent
entity.
USDA allocates funds, as the parent, to a number of U.S. Government agencies including:
Department of the Interior, Department of Defense, Department of Housing and Urban
Development, Agency for International Development, and the Small Business Administration.
USDA receives allocation transfers, as the child, from the Department of Labor, Department of
Transportation, Department of the Interior, Economic Development Administration, Appalachian
Regional Commission, and the Delta Regional Authority.
INTER-ENTITY COSTS
Each entity’s full cost should incorporate the full cost of goods and services that it receives from
other entities. The entity providing the goods or services has the responsibility to provide the
receiving entity with information on the full cost of such goods or services either through billing
or other advice.

F I S C A L Y E A R 2 0 1 5 A G E N C Y F I N A N C I A L R E P O R T
U . S . D E P A R T M E N T O F A G R I C U L T U R E 6 1
Recognition of inter-entity costs that are not fully reimbursed is limited to material items that:
(1) are significant to the receiving entity, (2) form an integral or necessary part of the receiving
entity’s output, and (3) can be identified or matched to the receiving entity with reasonable
precision. Broad and general support services provided by an entity to all or most other entities
should not be recognized unless such services form a vital and integral part of the operations or
output of the receiving entity.
FIDUCIARY ACTIVITIES
Fiduciary activities are the collection or receipt, and the management, protection, accounting,
investment, and disposition by the Federal Government of cash or other assets in which
non-Federal individuals or entities have an ownership interest that the Federal Government must
uphold. Fiduciary assets are not assets of the Federal Government and are not recognized on the
balance sheet.
ASBESTOS-RELATED CLEANUP COSTS
Effective October 1, 2012, Technical Bulletin (TB) 2006-1, Recognition and Measurement of
Asbestos-Related Cleanup Costs, as amended, requires an estimate of both friable and
non-friable asbestos-related cleanup costs; recognition of a liability and related expense for those
costs that are both probable and reasonably estimable; and disclosure of information related to
friable and non-friable asbestos-related cleanup costs that are probable but not reasonably
estimable in a note to the financial statements.
DEFERRED MAINTENANCE AND REPAIRS
Deferred maintenance and repairs are suchthat were not performed when they should have been
or were scheduled to be and which are put off or delayed for a future period. Maintenance and
repairs are activities directed toward keeping fixed assets in an acceptable condition. Activities
include preventive maintenance; replacement of parts, systems, or components; and other
activities needed to preserve or maintain the asset. Maintenance and repairs, as distinguished
from capital improvements, exclude activities directed towards expanding the capacity of an
asset or otherwise upgrading it to serve needs different from, or significantly greater than, its
current use. SFFAS 42, Deferred Maintenance and Repairs: Amending Statements of Federal
Financial Accounting Standards 6, 14, 29 and 32, became effective October 1, 2014. Estimates
for deferred maintenance and repairs are disclosed in required supplementary information.

S E C T I O N I I | F I N A N C I A L I N F O R M A T I O N
6 2 C R E A T I N G A U S D A F O R T H E 2 1 S T C E N T U R Y
Note 2: Non-Entity Assets
Non-entity assets include proceeds from the sale of timber payable to the U.S. Treasury, timber
contract performance bonds, employer contributions and payroll taxes withheld for agencies
serviced by the National Finance Center, rural housing escrow, interest, fines, and penalties.
FY 2015 FY 2014
Intragovernmental:
Fund balance with Treasury 250$ 190$
Accounts Receivable 236 546
Subtotal Intragovernmental 486 736
With the Public:
Accounts receivable 121 123
Subtotal With the Public 121 123
Total non-entity assets 607 859
Total entity assets 216,648 206,982
Total Assets 217,255$ 207,841$

F I S C A L Y E A R 2 0 1 5 A G E N C Y F I N A N C I A L R E P O R T
U . S . D E P A R T M E N T O F A G R I C U L T U R E 6 3
Note 3: Fund Balance with Treasury
Other Fund Types include deposit and clearing accounts. Borrowing Authority not yet Converted
to Fund Balance represents un-obligated and obligated amounts recorded at year-end that will be
funded by future borrowings. Non-Budgetary Fund Balance with Treasury includes special fund
receipt accounts, and clearing and suspense account balances awaiting disposition or
reclassification.
FY 2015 FY 2014
Fund Balances:
Trust Funds 393$ 796$
Special Funds 22,383 21,075
Revolving Funds 24,490 20,066
General Funds 65,852 59,608
Other Fund Types 198 172
Total 113,316 101,717
Status of Fund Balance with Treasury:
Unobligated Balance:
Available 23,753 25,691
Unavailable 39,736 28,870
Obligated Balance not yet Disbursed 51,132 57,527
Borrowing Authority not yet Converted to Fund Balance (23,040) (30,279)
Non-Budgetary Fund Balance with Treasury 21,735 19,908
Total 113,316$ 101,717$
Note 4: Cash and Other Monetary Assets
For FY 2015 and FY 2014, cash mostly consists of Federal crop insurance escrow amounts of
$192 million and $148 million and deposits in transit of $42 million and $24 million,
respectively.
FY 2015 FY 2014
Cash 234$ 173$

S E C T I O N I I | F I N A N C I A L I N F O R M A T I O N
6 4 C R E A T I N G A U S D A F O R T H E 2 1 S T C E N T U R Y
Note 5: Investments
FY 2015 Amortized Market
Amortization (Premium) Interest Investments, Value
Method Cost Discount Receivable Net Disclosure
Intragovernmental:
Non-marketable
Par value -$ -$ -$ -$ -$
Market-based Straight Line 189 (2) 1 188 188
Total 189$ (2)$ 1$ 188$ 188$
With the Public:
AARC 3$ -$ -$ 3$ 3$
Total 3$ -$ -$ 3$ 3$
FY 2014 Amortized Market
Amortization (Premium) Interest Investments, Value
Method Cost Discount Receivable Net Disclosure
Intragovernmental:
Non-marketable
Par value -$ -$ -$ -$ -$
Market-based Straight Line 150 (1) 1 150 150
Total 150$ (1)$ 1$ 150$ 150$
With the Public:
AARC 3$ -$ -$ 3$ 3$
Total 3$ -$ -$ 3$ 3$
Note 6: Accounts Receivable, Net
FY 2015Accounts
Receivable,
Gross
Allowance for
Uncollectible
Accounts
Accounts
Receivable,
NetIntragovernmental 93$ -$ 93$ With the Public 1,629 (55) 1,574
Total 1,722$ (55)$ 1,667$
FY 2014Accounts
Receivable,
Gross
Allowance for
Uncollectible
Accounts
Accounts
Receivable,
NetIntragovernmental 107$ -$ 107$ With the Public 1,438 (61) 1,377
Total 1,545$ (61)$ 1,484$

F I S C A L Y E A R 2 0 1 5 A G E N C Y F I N A N C I A L R E P O R T
U . S . D E P A R T M E N T O F A G R I C U L T U R E 6 5
Note 7: Direct Loans and Guarantees, Non-Federal Borrowers
DIRECT LOANS
Direct loan obligations or loan guarantee commitments made pre-1992 and the resulting direct
loans or loan guarantees are reported at either net present value or net realizable value.
Direct loan obligations or loan guarantee commitments made post-1991, and the Federal Credit
Reform Act of 1990 as amended governs the resulting direct loan or loan guarantees. The Act
requires agencies to estimate the cost of direct loans and loan guarantees at present value for the
budget. Additionally, the present value of the subsidy costs (i.e. interest rate differentials, interest
subsidies, delinquencies and defaults, fee offsets, and other cash flows) associated with direct
loans and loan guarantees are recognized as a cost in the year the loan or loan guarantee is
disbursed. The net present value of loans or defaulted guaranteed loans receivable at any point in
time is the amount of the gross loan or defaulted guaranteed loans receivable less the present
value of the subsidy at that time.
The net present value of Direct Loan and Loan Guarantees, Net is not necessarily representative
of the proceeds that might be expected if these loans were sold on the open market.
Direct Loan and Loan Guarantees, Net at the end of FY 2015 was $98,894 million compared to
$101,243 million at the end of FY 2014. Loans exempt from the Federal Credit Reform Act of
1990 represent $386 million of the total compared to $208 million in FY 2014. Table 1 illustrates
the overall composition of the Department’s credit program balance sheet portfolio by mission
area and credit program for FY 2015 and FY 2014.
Beginning in FY 2012, advance payments surpassed the loans receivable balance in the Rural
Utilities Liquidating Fund. This was due to an increased volume in advance payments and a
normal reduction to the Liquidating Portfolio. The Omnibus Budget Act of 1987, section 313,
authorized the accumulation of Cushion of Credit (CoC) in the Revolving Fund. Borrowers may
make advance payments up to their liquidating and financing total Rural Utilities Service debt.
To accurately represent the value of Electric and Telecommunication assets, RD reports the CoC
amounts as a separate line item in Table 1.
During the fiscal year, the gross outstanding balance of the direct loans obligated post-1991 is
adjusted by the value of the subsidy cost allowance held against those loans. Current year
subsidy expense, modifications and reestimates all contribute to the change of the subsidy cost
allowance throughout the year. The subsidy cost allowance moved from $6,461 million to
$6,425 million during FY 2015, a decrease of $36 million. Table 2 shows the reconciliation of
subsidy cost allowance balances from FY 2014 to FY 2015.
Total direct loan subsidy expense is a combination of subsidy expense for new direct loans
disbursed in the current year, modifications to existing loans, and interest rate and technical
reestimates to existing loans. Total direct loan subsidy expense in FY 2015 was $204 million

S E C T I O N I I | F I N A N C I A L I N F O R M A T I O N
6 6 C R E A T I N G A U S D A F O R T H E 2 1 S T C E N T U R Y
compared to $224 million in FY 2014. Table 3 illustrates the breakdown of total subsidy expense
for FY 2015 and FY 2014 by program.
Direct loan volume increased from $8,956 million in FY 2014 to $9,533 million in FY 2015.
Volume distribution between mission area and program is shown in Table 4.
GUARANTEED LOANS
Guaranteed loans are administered in coordination with conventional agricultural lenders for up
to 95 percent of the principal loan amount. Under the guaranteed loan programs, the lender is
responsible for servicing the borrower’s account for the life of the loan. The Department,
however, is responsible for ensuring borrowers meet certain qualifying criteria to be eligible and
monitoring the lender’s servicing activities. Borrowers interested in guaranteed loans must apply
to a conventional lender, which then arranges for the guarantee with a Department agency.
Estimated losses on loan and foreign credit guarantees are reported at net present value as Loan
Guarantee Liability. Defaulted guaranteed loans are reported at net present value as Loans
Receivable and Related Foreclosed Property, Net.
Guaranteed loans outstanding at the end of FY 2015 were $136,487 million in outstanding
principal and $122,104 million in outstanding principal guaranteed, compared to
$126,400 million and $113,086 million, respectively, at the end of FY 2014. Table 5 shows the
outstanding balances by credit program.
During the fiscal year, the value of the guaranteed loans is adjusted by the value of the loan
guarantee liability held against those loans. Current year subsidy expense, modification, and
reestimates all contribute to the change of the loan guarantee liability through the year. The loan
guarantee liability is a combination of the liability for losses on pre-1992 guarantees and
post-1991 guarantees. Table 6 shows that total liability moved from $5,373 million to
$5,590 million during FY 2015, an increase of $217 million. Table 7 shows the reconciliation of
total loan guarantee liability.
Total guaranteed loan subsidy expense is a combination of subsidy expense for new guaranteed
loans disbursed in the current year, modifications to existing loans, and interest rate and technical
reestimates to existing loans. Total guaranteed loan subsidy expense in FY 2015 was
$859 million compared to $561 million in FY 2014. Table 8 illustrates the breakdown of total
subsidy expense for FY 2015 and FY 2014 by program.
Guaranteed loan volume increased from $24,806 million in FY 2014 to $26,031 million in
FY 2015. Volume distribution between mission area and program is shown in Table 9.
ADMINISTRATIVE EXPENSES
Consistent with the Federal Credit Reform Act of 1990, as amended, subsidy cash flows exclude
direct Federal administrative expenses. Administrative expenses for FY 2015 and FY 2014 are
shown in Table 10.

F I S C A L Y E A R 2 0 1 5 A G E N C Y F I N A N C I A L R E P O R T
U . S . D E P A R T M E N T O F A G R I C U L T U R E 6 7
SUBSIDY RATES
Subsidy rates are used to compute each year’s subsidy expenses. The subsidy rates disclosed in
Table 11 and Table 12 pertain only to the FY 2015 cohorts. These rates cannot be applied to the
direct and guaranteed loans disbursed during the current reporting year to yield the subsidy
expense. The subsidy expense for new loans reported in the current year could result from
disbursements of loans from both current year cohorts and prior-year cohorts. The subsidy
expense reported in the current year also includes reestimates.
CREDIT PROGRAM DISCUSSION AND DESCRIPTIONS
The Department offers direct and guaranteed loans through credit programs in the FFAS mission
area through the FSA and the CCC, and in the RD mission area.
FARM AND FOREIGN AGRICULTURAL SERVICES (FFAS) MISSION AREA
The FFAS mission area helps keep America’s farmers and ranchers in business as they face the
uncertainties of weather and markets. FFAS delivers commodity, credit, conservation, disaster,
and emergency assistance programs that help strengthen and stabilize the agricultural economy.
FFAS contributes to the vitality of the farm sector with programs that encourage the expansion
of export markets for U.S. agriculture.
FSA offers direct and guaranteed loans to farmers who are temporarily unable to obtain private,
commercial credit, and nonprofit entities that are engaged in the improvement of the nation’s
agricultural community. Often, FSA borrowers are beginning farmers who cannot qualify for
conventional loans due to insufficient financial resources. Additionally, the agency helps
established farmers who have suffered financial setbacks from natural disasters, or have limited
resources to maintain profitable farming operations. FSA officials also provide borrowers with
supervision and credit counseling.
FSA’s mission is to provide supervised credit. FSA works with each borrower to identify
specific strengths and weaknesses in farm production and management, and provides alternatives
to address weaknesses. FSA is able to provide certain loan servicing options to assist borrowers
whose accounts are distressed or delinquent. These options include reamortization, restructuring,
loan deferral, lowering interest rates, acceptance of easements, and debt write-downs. The
eventual goal of FSA’s farm credit programs is to graduate its borrowers to commercial credit.
CCC’s foreign programs provide economic stimulus to both the U.S. and foreign markets, while
giving humanitarian assistance to the most-needy people throughout the world. CCC offers both
credit guarantee and direct credit programs for buyers of U.S. exports, suppliers, and sovereign
countries in need of food assistance.
CCC permits debtor nations to reschedule debt under the aegis of the Paris Club. The Paris Club
is an informal group of official creditors whose role is to facilitate debt treatments based on an
internationally recognized set of rules and principles, facilitated by the senior officials of the
French Treasury. Its sole purpose is to assess, on a case-by-case basis, liquidity problems faced

S E C T I O N I I | F I N A N C I A L I N F O R M A T I O N
6 8 C R E A T I N G A U S D A F O R T H E 2 1 S T C E N T U R Y
by economically disadvantaged countries. The general premise of Paris Club is to provide
disadvantaged nations short-term liquidity relief to enable them to re-establish their credit
worthiness. The U.S. Departments of State and Treasury lead the U.S. Delegation and
negotiations for all U.S. Agencies.
CCC also provides loans for Farm and Sugar Storage Facilities (FSFL). FSFL provides
low-interest financing for producers to build or upgrade farm storage and handling facilities. The
2008 Farm Bill added hay and renewable biomass as eligible FSFL commodities, extended the
maximum loan term to 12 years, and increased the maximum loan amount to $500,000.
FARM AND FOREIGN AGRICULTURAL SERVICE LIST OF PROGRAMS
Farm Service Agency Commodity Credit Corporation
Direct Farm Ownership
Direct Farm Operating
Direct Emergency Loans
Direct Indian Land Acquisition
Direct Boll Weevil Eradication
Direct Seed Loans to Producers
Direct Conservation
Guaranteed Farm Operating Subsidized/Unsubsidized
Guaranteed Farm Ownership Unsubsidized
Guaranteed Conservation
American Recovery and Reinvestment Fund
General Sales Manager Export Credit Guarantee Program
Facility Program Guarantee
P.L. 480 Title 1 Program
Direct Farm Storage Facility
Direct Sugar Storage Facilities
RURAL DEVELOPMENT (RD) MISSION AREA
Each year, RD programs create or preserve tens of thousands of rural jobs and provide or
improve the quality of rural housing. To leverage the impact of its programs, RD works with
State, local and Indian Tribal governments, as well as private and not-for-profit organizations
and user-owned cooperatives.
Through its rural housing loan and grant programs, RD provides affordable housing and essential
community facilities to rural communities. Rural housing programs help finance new or
improved housing for moderate, low, and very low-income families each year. The programs
also help rural communities finance, construct, enlarge, or improve fire stations, libraries,
hospitals and medical clinics, industrial parks, and other community facilities.
The Rural Business Program goal is to promote a dynamic business environment in rural
America. RD partners with the private sector and community-based organizations to provide
financial assistance and business planning. It also provides technical assistance to rural

F I S C A L Y E A R 2 0 1 5 A G E N C Y F I N A N C I A L R E P O R T
U . S . D E P A R T M E N T O F A G R I C U L T U R E 6 9
businesses and cooperatives, conducts research into rural economic issues, and provides
cooperative educational materials to the public.
The Rural Utilities Program helps to improve the quality of life in rural America through a
variety of loan programs for electric energy, telecommunications, and water and environmental
projects. This program leverages scarce Federal funds with private capital for investing in rural
infrastructure, technology, and development of human resources.
RD programs provide certain loan servicing options to borrowers whose accounts are distressed
or delinquent. These options include re-amortization, restructuring, loan deferral, lowering
interest rate, acceptance of easements, and debt write-downs. The choice of servicing options
depends on the loan program and the individual borrower.
RURAL DEVELOPMENT LIST OF PROGRAMS
Rural Housing Program Rural Business Program Rural Utilities Program
Single Family Housing Direct Loans
Single Family Housing Guaranteed Loans
Self Help Housing Direct Loans
Single Family Housing Credit Sales
Farm Labor Housing Direct Loans
Multi-Family Housing Direct Loans
Multi-Family Housing Guaranteed Loans
Multi-Family Housing-Credit Sales
Multi-Family Housing Relending Program
Multi-Family Housing Revitalization Program
Community Facilities Direct Loans
Community Facilities Guaranteed Loans
Business and Industry Direct Loans
Business and Industry Guaranteed Loans
Intermediary Relending Program Direct Loans
Rural Economic Development Direct Loans
Biorefinery Guaranteed Loans
Rural Energy for America Guaranteed Loans
Rural Microenterprise Investment Direct Loans
Water and Environmental Direct Loans
Water and Environmental Guaranteed Loans
Electric Direct Loans
Electric Guaranteed Loans
Telecommunications Direct Loans
Federal Financing Bank-Electric
Federal Financing Bank-Telephone
Distance Learning and Telemedicine Direct
Broadband Telecommunications Services

S E C T I O N I I | F I N A N C I A L I N F O R M A T I O N
7 0 C R E A T I N G A U S D A F O R T H E 2 1 S T C E N T U R Y
EVENTS AND CHANGES HAVING A SIGNIFICANT AND MEASURABLE EFFECT ON SUBSIDY RATES, SUBSIDY EXPENSE, AND SUBSIDY RE-ESTIMATES
The Federal Credit Reform Act of 1990, as amended, governs the proprietary and budgetary
accounting treatment of direct and guaranteed loans. The long-term cost to the Government for
direct loans or loan guarantees is referred to as “subsidy cost.” Under the act, subsidy costs for
loans obligated beginning in FY 1992 are recognized at the net present value of projected
lifetime costs in the year the loan is disbursed. Subsidy costs are revalued annually. Components
of subsidy include interest subsidies, defaults, fee offsets, and other cash flows.
The annual reestimate process updates the budget assumptions with actual portfolio performance,
interest rates, and updated estimates for future loan performance. The FY 2015 reestimate
process resulted in a $194 million increase in the post-1991 estimated cost of the direct loan
portfolio and a $880 million increase in the post-1991 estimated cost of the guaranteed loan
portfolio, primarily comprised of the following programs.
Direct Loans
The “farm” category of loans is comprised of direct loans under the Agricultural Credit
Insurance Fund (ACIF), along with four categories of direct loans under Commodity Credit
Corporation—Farm Storage, Sugar Storage, Emergency Boll Weevil, and Apple loans. The farm
category had a total reestimate of $209 million. ACIF comprised $187 million of the total
reestimate. CCC loans comprised the remaining $22 million. The total consisted of $312 million
in upward reestimates and $103 million in downward reestimates. The majority of the reestimate
was in the farm ownership and farm operating programs, comprising $254 million of the upward
reestimate.
Direct ownership had an upward reestimate of $161 million and direct operating had an upward
reestimate of $93 million. The upward reestimates are largely due to three items in particular.
The first was a major change in the direct farm loan cash flow model that revised the
amortization methodology, resulting in accelerated timing of scheduled principal in each
program. This change also reduced the amount of scheduled interest over the life of the cohort,
magnified by the change in the interest rate that was used to project scheduled interest payments.
And finally, the single effective rate (SER) for the 2014 cohort was recalculated during the
FY 2015 reestimates, which resulted in an increased SER and a significant upward reestimate.
The direct farm operating program had an upward reestimate of $93 million. The upward
reestimate can also be attributed to the revised amortization methodology, which resulted in a
substantial decrease in scheduled interest. Direct operating also had a large downward reestimate
of $39 million. The downward reestimate is largely due to the econometric update which reduced
total principal write down rates, thus decreasing default subsidy.
It is also important to note that the financing account interest adjustment (FAIA) component of
the reestimate across all direct farm loan programs had a significant impact on the reestimates.
The net number for FAIA in direct operating was $10 million, consisting of $51 million upward

F I S C A L Y E A R 2 0 1 5 A G E N C Y F I N A N C I A L R E P O R T
U . S . D E P A R T M E N T O F A G R I C U L T U R E 7 1
and $41 million downward in various cohorts. The net amount of FAIA for direct ownership was
$34 million, which consisted of $41 million upward and $6 million downward.
The Direct Broadband Treasury Rate Program had an upward reestimate of $165 million in
FY 2015 and $119 million in FY 2014 due to increased delinquencies, write-offs, and lower
recoveries The Direct Electric Programs had an overall downward reestimate of $199 million
comprised primarily of a $210 million downward reestimate in the Federal Financing Bank
(FFB) Program and a $62 million upward reestimate in the FFB Underwriting Program. The FFB
Program reestimate was due primarily to lower discount rates in the newest cohorts. The upward
reestimate to the FFB Underwriting Program was caused principally by lower expected borrower
interest rates for this variable rate program. The Direct Electric Programs had a $75 million
upward reestimate in FY 2014 due to changes in borrower rates and discount rates across the
newest cohorts
The Water and Environmental Program had a downward reestimate of $133 million as compared
to a $27 million downward reestimate in FY 2014. The agency incorporated adjustments to the
prepayment assumption in FY 2014 to account for higher than expected prepayments in the
historical average data. These adjustments were not made in FY 2015.
Guaranteed Loans
The Guaranteed Single Family Housing Program had a net upward reestimate of $1 billion due
to substantially higher loss settlement payments following the housing crisis. The agency
incorporated adjustments directly into its loss settlement payment assumptions for the
2009–2013 cohorts in FY 2014 to counteract the effect of the elevated loss settlement payments
following the housing crisis. In FY 2015, the agency calculated an initial upward reestimate of
$3 billion without any adjustments to the model assumptions and performed independent
estimates of the liability for loan guarantees for the 2010–2015 cohorts that were believed to be
more reasonably representative of the expected future performance of the program. The
adjustment recorded to counteract the effect of the increased projected loss settlement payments
in FY 2015 was $2 billion
The Guaranteed Single Family Housing Program recorded a net upward adjustment of
$726 million in FY 2014 due primarily to increased actual and projected loss settlement
payments following the housing crisis. The 2012–2014 cohorts had a downward adjustment of
$200 million to reflect lower than average expected losses as a result of higher credit
requirements in those years.
The Guaranteed Business and Industry Programs had downward reestimates of $102 million in
FY 2015 and $122 million in FY 2014 due to lower claims and higher recoveries.
Loan Modifications
A modification is any Government action different from the baseline assumptions that affect the
subsidy cost, such as a change in the terms of the loan contract. The cost of a modification is the
difference between the present value of the cash flows before and after the modification.

S E C T I O N I I | F I N A N C I A L I N F O R M A T I O N
7 2 C R E A T I N G A U S D A F O R T H E 2 1 S T C E N T U R Y
Multi-Family Housing direct loan modifications related to the revitalization program, which
began in FY 2006, continued through FY 2015. In this program, Rural Development provides
restructured loans and grants to development owners to revitalize multi-family housing
development projects in order to extend the affordable use without displacing tenants due to the
increased rent.
In FY 2014, two Electric borrowers were granted loan term extension modifications, and in 2015
an additional Electric borrower was modified. No other terms of the original notes changed other
than the final maturity dates.
The Debt Reduction Fund is used to account for CCC’s “modified debt.” Debt is considered to
be modified if the original debt has been reduced or the interest rate of the agreement changed. In
contrast, when debt is "rescheduled," only the date of payment is changed. Rescheduled debt is
carried in the original fund until paid. With one exception, all outstanding CCC modified debt is
carried in the Debt Reduction Fund and is governed by the Federal Credit Reform Act of 1990,
as amended.
Foreclosed Property
Property is acquired largely through foreclosure and voluntary conveyance. Acquired properties
associated with loans are reported at their market value at the time of acquisition. The projected
future cash flows associated with acquired properties are used in determining the related
allowance (at present value).
For FY’s 2015 and 2014, rural housing program properties consist primarily of 1,607 and 1,667
rural single-family dwellings, respectively. The average holding period for single family housing
properties in inventory for FY’s 2015 and 2014 was 16 and 15 months, respectively. As of
September 30, 2015 and 2014, FSA-Farm Loan Program properties consist primarily of 90 and
87 farms, respectively. The average holding period for these properties in inventory for FY 2015
and FY 2014 was 56 and 46 months, respectively. Certain properties can be leased to eligible
individuals.
Other Information
Non-performing loans are defined as receivables that are in arrears by 90 or more days, or are on
rescheduling agreements until such time two consecutive payments have been made following
the rescheduling. When RD, FSA and CCC calculate loan interest income, however, the
recognition of revenue is deferred. Late interest is accrued on arrears.
Approximately $16,500 million and $17,100 million of RHS unpaid loan principal as of
September 30, 2015 and 2014 were receiving interest credit, respectively. If those loans
receiving interest credit had accrued interest at the full-unreduced rate, interest income would
have been approximately $816 million and $854 million higher for FY 2015 and FY 2014,
respectively.
At the end of FY’s 2015 and 2014, the Rural Development housing portfolio contained
approximately 62,400 and 64,300 restructured loans with an outstanding unpaid principal

F I S C A L Y E A R 2 0 1 5 A G E N C Y F I N A N C I A L R E P O R T
U . S . D E P A R T M E N T O F A G R I C U L T U R E 7 3
balance of $2,900 million and $2,800 million as of September 30, 2015 and 2014, respectively.
At the end of FY 2015 and FY 2014, the farm loan portfolio contained approximately 16,778 and
17,368 restructured loans with an outstanding unpaid principal balance of $1,051 million and
$1,074 million, respectively. Direct credit and credit guarantee principal receivables in the food
aid and export programs under rescheduling agreements as of September 30, 2015 and 2014
were $1,554 million and $1,742 million, respectively.
Reclassifications
In FY2014, interest related to technical reestimates was reclassified from interest rate reestimates
in Table 2, Table 3, Table 7, and Table 8. Foreclosed property and loans acquired and claim
payments to lenders were reclassified from other adjustments in Table 7.

S E C T I O N I I | F I N A N C I A L I N F O R M A T I O N
7 4 C R E A T I N G A U S D A F O R T H E 2 1 S T C E N T U R Y
Table 1: Direct Loan and Loan Guarantees, Net
FY 2015 Loans Present Value of AssetsDirect Loans Receivable, Interest Foreclosed Value Related to
Gross Receivable Property Allowance LoansObligated Pre-1992
Farm 378$ 23$ 5$ (19)$ 387$ Export - - - - - Food Aid 2,397 912 - (2,145) 1,164 Housing 7,445 127 17 (17) 7,572 Electric 2,677 5 - (1,338) 1,344 Telecommunications 194 - - - 194 Water and Environmental 479 4 - (1) 482 Business and Industry - - - - - Economic Development 14 - - - 14
Pre-1992 Total 13,584 1,071 22 (3,520) 11,157
Obligated Post-1991Farm 9,288 151 8 (434) 9,013 Export - - - - - Food Aid 921 47 - (377) 591 Housing 23,598 119 76 (2,705) 21,088 Electric 45,199 23 - (676) 44,546 Telecommunications 4,351 1 - (137) 4,215 Water and Environmental 12,082 87 - (305) 11,864 Business and Industry 39 - - 10 49 Economic Development 577 2 - (126) 453
Post-1991 Total 96,055 430 84 (4,750) 91,819
Cushion of Credit (5,070) - - - (5,070)
Total Direct Loan Program Receivables 104,569 1,501 106 (8,270) 97,906
Defaulted Guarantee LoansPre-1992
Farm - - - - - Export 83 217 - (270) 30 Food Aid - - - - - Housing - - - - - Electric - - - - - Telecommunications - - - - - Water and Environmental - - - - - Business and Industry - - - - - Economic Development - - - - -
Pre-1992 Total 83 217 - (270) 30
Post-1991Farm 136 1 - (134) 3 Export 599 38 - (361) 276 Food Aid - - - - - Housing 1,178 1 - (1,130) 49 Electric - - - - - Telecommunications - - - - - Water and Environmental - - - - - Business and Industry 295 2 - (53) 244 Economic Development - - - - -
Post-1991 Total 2,208 42 - (1,678) 572 Total Defaulted Guarantee Loans 2,291 259 - (1,948) 602
Loans Exempt from Credit Reform Act:Commodity Loans 397 2 - (13) 386 Other Foreign Receivables - - - - -
Total Loans Exempt 397 2 - (13) 386
Total Direct Loan and Loan Guarantees, Net 98,894$

F I S C A L Y E A R 2 0 1 5 A G E N C Y F I N A N C I A L R E P O R T
U . S . D E P A R T M E N T O F A G R I C U L T U R E 7 5
Table 1: Direct Loan and Loan Guarantees, Net (cont’d)
FY 2014 Loans Present Value of AssetsDirect Loans Receivable, Interest Foreclosed Value Related to
Gross Receivable Property Allowance LoansObligated Pre-1992
Farm 450$ 30$ 5$ (30)$ 455$ Export - - - - - Food Aid 2,644 880 - (2,362) 1,162 Housing 7,799 57 24 (19) 7,861 Electric 3,065 5 - (1,230) 1,840 Telecommunications 253 - - - 253 Water and Environmental 616 5 - (1) 620 Business and Industry 17 - - - 17 Economic Development - - - - -
Pre-1992 Total 14,844 977 29 (3,642) 12,208
Obligated Post-1991Farm 8,590 143 10 (231) 8,512 Export - - - - - Food Aid 999 46 - (394) 651 Housing 23,142 148 78 (2,890) 20,478 Electric 48,140 24 - (1,016) 47,148 Telecommunications 4,285 1 - 55 4,341 Water and Environmental 11,952 94 - (410) 11,636 Business and Industry 35 - - 26 61 Economic Development 564 2 - (128) 438
Post-1991 Total 97,707 458 88 (4,988) 93,265
Cushion of Credit (5,069) - - - (5,069)
Total Direct Loan Program Receivables 107,482 1,435 117 (8,630) 100,404
Defaulted Guarantee LoansPre-1992
Farm - - - - - Export 92 214 - (268) 38 Food Aid - - - - - Housing - - - - - Electric - - - - - Telecommunications - - - - - Water and Environmental - - - - - Business and Industry - - - - - Economic Development - - - - -
Pre-1992 Total 92 214 - (268) 38
Post-1991Farm 127 1 - (125) 3 Export 638 19 - (349) 308 Food Aid - - - - - Housing 1,006 2 - (958) 50 Electric - - - - - Telecommunications - - - - - Water and Environmental - - - - - Business and Industry 273 2 - (43) 232 Economic Development - - - - -
Post-1991 Total 2,044 24 - (1,475) 593 Total Defaulted Guarantee Loans 2,136 238 - (1,743) 631
Loans Exempt from Credit Reform Act:Commodity Loans 210 1 - (3) 208 Other Foreign Receivables - - - - -
Total Loans Exempt 210 1 - (3) 208
Total Direct Loan and Loan Guarantees, Net 101,243$

S E C T I O N I I | F I N A N C I A L I N F O R M A T I O N
7 6 C R E A T I N G A U S D A F O R T H E 2 1 S T C E N T U R Y
Table 2: Schedule for Reconciling Subsidy Cost Allowance Balances (Post-1991) Direct Loans
FY 2015 FY 2014
Beginning balance of the subsidy cost allowance 6,461$ 6,477$ Add: Subsidy expense for direct loans disbursed during the year by component
Interest rate differential costs (64) (4) Default costs (net of recoveries) 169 161 Fees and other collections (29) (13) Other subsidy costs (69) (78)
Total subsidy expense prior to adjustments and reestimates 7 66
AdjustmentsLoan modifications 3 (23) Fees received 68 66 Loans written off 146 (683) Subsidy allowance amortization 184 (179) Other (638) 556
Total subsidy cost allowance before reestimates 6,231 6,280
Add or subtract subsidy reestimates by componentInterest rate reestimate 90 65 Technical/default reestimate 104 116
Total reestimates 194 181
Ending balance of the subsidy cost allowance 6,425$ 6,461$

F I S C A L Y E A R 2 0 1 5 A G E N C Y F I N A N C I A L R E P O R T
U . S . D E P A R T M E N T O F A G R I C U L T U R E 7 7
Table 3: Subsidy Expense for Direct Loans by Program and Component
FY 2015Interest Fees and Other Subtotal Total Interest Rate Technical Total Total Subsidy
Differential Defaults Collections Other Subsidy Modifications Reestimates Reestimates Reestimates ExpenseDirect Loan Programs
Farm (23)$ 84$ (1)$ (2)$ 58$ -$ 51$ 161$ 212$ 270$ Export - - - - - - - - - - Food Aid - - - - - - - 15 15 15 Housing (1) 52 - (3) 48 4 17 40 57 109 Electric (134) 13 (28) (42) (191) (1) 41 (241) (200) (392) Telecommunications (1) 18 - (9) 8 - (33) 256 223 231 Water and Environmental 83 2 - (13) 72 - 15 (148) (133) (61) Business and Industry 1 - - - 1 - 18 18 19 Economic Development 11 - - - 11 - (1) 3 2 13
Total Direct Loan Subsidy Expense (64)$ 169$ (29)$ (69)$ 7$ 3$ 90$ 104$ 194$ 204$
FY 2014Interest Fees and Other Subtotal Total Interest Rate Technical Total Total Subsidy
Differential Defaults Collections Other Subsidy Modifications Reestimates Reestimates Reestimates Expense
Direct Loan Programs
Farm (8)$ 91$ -$ (19)$ 64$ -$ (21)$ (260)$ (281)$ (217)$
Export - - - - - - - - - -
Food Aid - - - - - - - 2 2 2
Housing (1) 43 - (1) 41 1 165 22 187 229
Electric (100) 13 (13) (42) (142) (24) (60) 135 75 (91)
Telecommunications (1) 12 - (5) 6 - 7 162 169 175
Water and Environmental 93 2 - (11) 84 - (20) 48 28 112
Business and Industry 7 - - - 7 - (4) 8 4 11
Economic Development 6 - - - 6 - (2) (1) (3) 3
Total Direct Loan Subsidy Expense (4)$ 161$ (13)$ (78)$ 66$ (23)$ 65$ 116$ 181$ 224$

S E C T I O N I I | F I N A N C I A L I N F O R M A T I O N
7 8 C R E A T I N G A U S D A F O R T H E 2 1 S T C E N T U R Y
Table 4: Total Amount of Direct Loans Disbursed (Post-1991)
FY 2015 FY 2014Direct Loan Programs
Farm 2,306$ 2,120$ Export - - Food Aid - - Housing 1,821 1,518 Electric 3,853 3,869 Telecommunications 573 431 Water and Environmental 899 938 Business and Industry 7 5 Economic Development 74 75
Total Direct Loans Disbursed 9,533$ 8,956$

F I S C A L Y E A R 2 0 1 5 A G E N C Y F I N A N C I A L R E P O R T
U . S . D E P A R T M E N T O F A G R I C U L T U R E 7 9
Table 5: Guaranteed Loans Outstanding
Pre - 1992 Post - 1991 Total Pre - 1992 Post - 1991 Total
FY 2015Outstanding
Principal,
Outstanding
Principal,
Outstanding
Principal,
Outstanding
Principal,
Outstanding
Principal,
Outstanding
Principal,
Face Value Face Value Face Value Guaranteed Guaranteed GuaranteedLoan Guarantee Programs
Farm $ 5 $ 13,856 $ 13,861 $ 4 $ 12,487 $ 12,491 Export - 2,929 2,929 - 2,871 2,871 Food Aid - - - - - - Housing 2 113,247 113,249 2 101,900 101,902 Electric 38 178 216 38 178 216 Telecommunications - - - - - - Water and Environmental - 112 112 - 100 100 Business and Industry 5 6,115 6,120 4 4,520 4,524 Economic Development - - - - - -
Total Guarantees Disbursed $ 50 $ 136,437 $ 136,487 $ 48 $ 122,056 $ 122,104
Pre - 1992 Post - 1991 Total Pre - 1992 Post - 1991 Total
FY 2014Outstanding
Principal,
Outstanding
Principal,
Outstanding
Principal,
Outstanding
Principal,
Outstanding
Principal,
Outstanding
Principal,
Face Value Face Value Face Value Guaranteed Guaranteed Guaranteed
Loan Guarantee Programs
Farm $ 7 $ 13,202 $ 13,209 $ 6 $ 11,894 $ 11,900
Export - 3,658 3,658 - 3,585 3,585
Food Aid - - - - - -
Housing 2 102,865 102,867 2 92,560 92,562
Electric 65 183 248 65 183 248
Telecommunications - - - - - -
Water and Environmental - 96 96 - 85 85
Business and Industry 9 6,313 6,322 8 4,698 4,706
Economic Development - - - - - -
Total Guarantees Disbursed $ 83 $ 126,317 $ 126,400 $ 81 $ 113,005 $ 113,086

S E C T I O N I I | F I N A N C I A L I N F O R M A T I O N
8 0 C R E A T I N G A U S D A F O R T H E 2 1 S T C E N T U R Y
Table 6: Liability for Loan Guarantees (Present Value Method for Pre-1992 Guarantees)
FY 2015
Liabilities for
Losses on Pre-
1992
Guarantees
Present Value
Liabilities for Loan
Guarantees on Post-
1991 Guarantees
Present Value
Total Liabilities for
Loan Guarantees
Loan Guarantee ProgramsFarm -$ 189$ 189$ Export - 11 11 Food Aid - - - Housing - 4,832 4,832 Electric - - - Telecommunications - - - Water and Environmental - 1 1 Business and Industry - 557 557 Economic Development - - -
Total Liability for Loan Guarantees -$ 5,590$ 5,590$
FY 2014
Liabilities for
Losses on Pre-
1992
Guarantees
Present Value
Liabilities for Loan
Guarantees on
Post-1991
Guarantees
Present Value
Total Liabilities for
Loan Guarantees
Loan Guarantee Programs
Farm -$ 172$ 172$
Export - 25 25
Food Aid - - -
Housing - 4,513 4,513
Electric - - -
Telecommunications - - -
Water and Environmental - 1 1
Business and Industry - 662 662
Economic Development - - -
Total Liability for Loan Guarantees -$ 5,373$ 5,373$

F I S C A L Y E A R 2 0 1 5 A G E N C Y F I N A N C I A L R E P O R T
U . S . D E P A R T M E N T O F A G R I C U L T U R E 8 1
Table 7: Schedule for Reconciling Loan Guarantee Liability
FY 2015 FY 2014Beginning balance of the loan guarantee liability 5,373$ 4,866$ Add:Subsidy expense for guaranteed loans disbursed during the year by component
Interest supplement costs 1 1 Default costs (net of recoveries) 1,082 982 Fees and other collections (1,090) (935) Other subsidy costs (14) -
Total of the above subsidy expense components (21) 48
AdjustmentsLoan guarantee modifications - - Fees received 670 611 Interest supplements paid (14) (18) Foreclosed property and loans acquired (277) (21) Claim payments to lenders (1,345) (632) Interest accumulation on the liability balance 95 95 Other 229 (89)
Ending balance of the subsidy cost allowance before reestimates 4,710 4,860
Add or subtract subsidy reestimates by component:Interest rate reestimate (13) 36 Technical/default reestimate 893 477
Total of the above reestimate components 880 513
Ending balance of the loan guarantee liability 5,590$ 5,373$
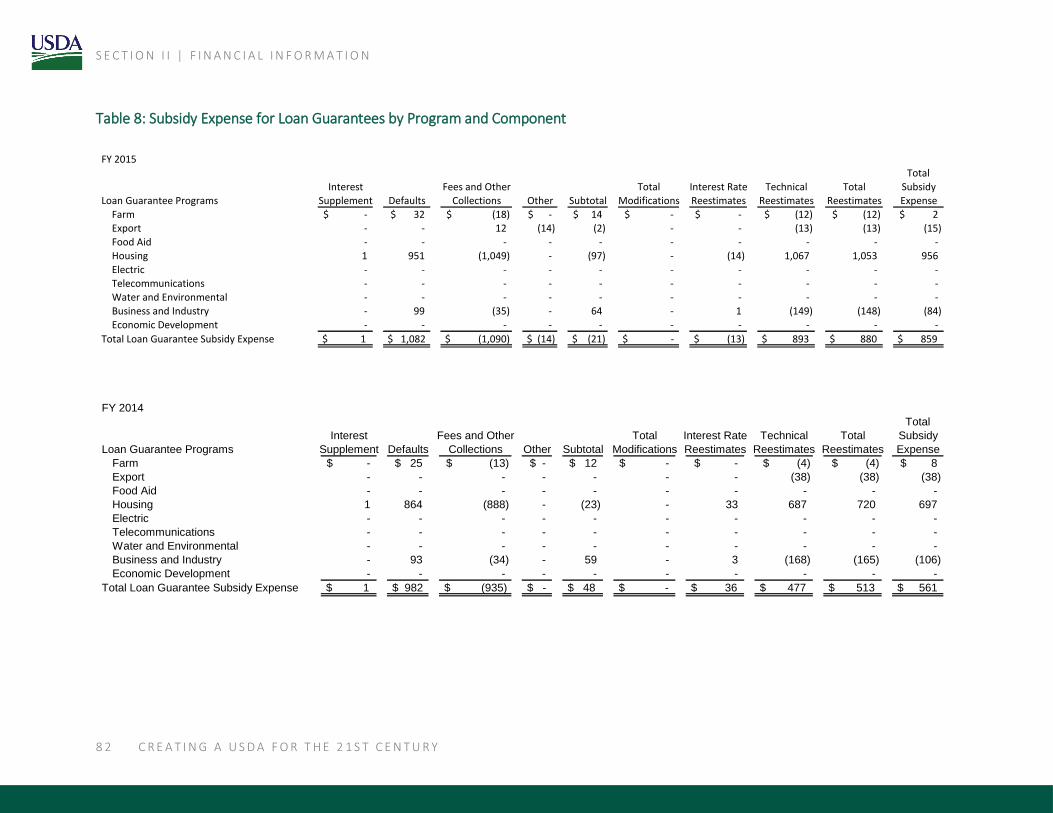
S E C T I O N I I | F I N A N C I A L I N F O R M A T I O N
8 2 C R E A T I N G A U S D A F O R T H E 2 1 S T C E N T U R Y
Table 8: Subsidy Expense for Loan Guarantees by Program and Component
FY 2015Total
Interest Fees and Other Total Interest Rate Technical Total SubsidyLoan Guarantee Programs Supplement Defaults Collections Other Subtotal Modifications Reestimates Reestimates Reestimates Expense
Farm -$ 32$ (18)$ -$ 14$ -$ -$ (12)$ (12)$ 2$ Export - - 12 (14) (2) - - (13) (13) (15) Food Aid - - - - - - - - - - Housing 1 951 (1,049) - (97) - (14) 1,067 1,053 956 Electric - - - - - - - - - - Telecommunications - - - - - - - - - - Water and Environmental - - - - - - - - - - Business and Industry - 99 (35) - 64 - 1 (149) (148) (84) Economic Development - - - - - - - - - -
Total Loan Guarantee Subsidy Expense $ 1 $ 1,082 $ (1,090) $ (14) $ (21) $ - $ (13) $ 893 $ 880 $ 859
FY 2014
Total
Interest Fees and Other Total Interest Rate Technical Total Subsidy
Loan Guarantee Programs Supplement Defaults Collections Other Subtotal Modifications Reestimates Reestimates Reestimates Expense
Farm -$ 25$ (13)$ -$ 12$ -$ -$ (4)$ (4)$ 8$
Export - - - - - - - (38) (38) (38)
Food Aid - - - - - - - - - -
Housing 1 864 (888) - (23) - 33 687 720 697
Electric - - - - - - - - - -
Telecommunications - - - - - - - - - -
Water and Environmental - - - - - - - - - -
Business and Industry - 93 (34) - 59 - 3 (168) (165) (106)
Economic Development - - - - - - - - - -
Total Loan Guarantee Subsidy Expense $ 1 $ 982 $ (935) $ - $ 48 $ - $ 36 $ 477 $ 513 $ 561

F I S C A L Y E A R 2 0 1 5 A G E N C Y F I N A N C I A L R E P O R T
U . S . D E P A R T M E N T O F A G R I C U L T U R E 8 3
Table 9: Guaranteed Loans Disbursed
Principal, Face
Value Disbursed
Principal,
Guaranteed
Disbursed
Principal,
Face Value
Disbursed
Principal,
Guaranteed
DisbursedLoan Guarantee Programs
Farm 3,250$ 2,929$ 2,662$ 2,398$ Export 2,020 1,982 2,204 2,160 Food Aid - - - - Housing 19,862 17,874 19,088 17,177 Electric - - - - Telecommunications - - - - Water and Environmental 22 19 22 19 Business and Industry 877 679 830 643 Economic Development - - - -
Total Guaranteed Loans Disbursed 26,031$ 23,483$ 24,806$ 22,397$
FY 2015 FY 2014
Table 10: Administrative Expenses
FY 2015 FY 2014Direct Loan Programs 441$ 472$ Guaranteed Loan Programs 476 379
Total Administrative Expenses 917$ 851$

S E C T I O N I I | F I N A N C I A L I N F O R M A T I O N
8 4 C R E A T I N G A U S D A F O R T H E 2 1 S T C E N T U R Y
Table 11: Subsidy Rates for Direct Loans (percentage)
FY 2015 Interest
Differential Defaults
Fees and
Other
Collections Other TotalDirect Loan Programs
Farm Ownership (2.36) 2.49 - (1.49) (1.36) Farm Operating (1.52) 6.46 - 0.10 5.04 Emergency Disaster (7.22) 9.10 - 0.59 2.47 Indian Tribe Land Acquisition (17.80) - - - (17.80) Boll Weevil Eradication (2.46) - - (0.54) (3.00) Indian Highly Fractionated Land (5.76) 6.58 - (0.91) (0.09) Farm Storage Facility Loan Program (2.50) 0.01 (0.27) (0.24) (3.00) Sugar Storage Facility Loan Program (2.67) 0.02 - (0.36) (3.01) Multi-Family Housing Relending Demo 35.41 - - (0.01) 35.40 Multi-Family Housing Revitalization Seconds 60.45 0.33 - (0.06) 60.72 Multi-Family Housing Revitalization Zero 56.18 0.25 - (0.20) 56.23 Community Facility Loans (14.80) 2.46 - (0.07) (12.41) Section 502 Single-Family Housing 3.79 4.22 - (0.63) 7.38 Section 515 Multi-Family Housing (11.62) 0.50 - 45.63 34.51 Section 504 Housing Repair 18.72 (0.06) - (4.63) 14.03 Section 514 Farm Labor Housing 33.06 0.07 - (0.93) 32.20 Section 523 Self-Help Housing (2.53) - - 0.05 (2.48) Section 524 Site Development (5.65) - - 0.83 (4.82) Single-Family Housing Credit Sales (11.17) 2.15 - 2.61 (6.41) Rural Microenterprise Direct Loans 9.49 3.32 - - 12.81 Intermediary Relending Program 32.02 0.56 - (1.78) 30.80 Rural Economic Development Loans 12.80 0.01 - (0.04) 12.77 Water and Waste Disposal Loans 3.08 0.10 - (3.79) (0.61) FFB Electric Loans (4.64) 0.07 - (1.07) (5.64) Treasury Telecommunication Loans 0.21 0.26 - (1.65) (1.18) FFB Telecommunications Loans 0.73 0.10 - (4.32) (3.49) Broadband Treasury Loans 0.19 21.49 - (3.00) 18.68

F I S C A L Y E A R 2 0 1 5 A G E N C Y F I N A N C I A L R E P O R T
U . S . D E P A R T M E N T O F A G R I C U L T U R E 8 5
Table 12: Subsidy Rates for Loan Guarantees (percentage)
FY 2015 Interest
Differential Defaults
Fees and
Other
Collections Other TotalGuaranteed Loan Programs
Farm Ownership—Unsubsidized - 1.19 (1.30) - (0.11) Farm Operating—Unsubsidized - 2.39 (1.33) - 1.06 Conservation—Guaranteed - 0.99 (1.30) - (0.31) GSM 102 - 0.21 (1.26) - (1.05) Export Guarantee Program—Facilities - 0.38 (4.78) - (4.40) Community Facility Loan Guarantees - 5.66 (0.88) - 4.78 Guaranteed 538 Multi-Family Housing - 6.51 (7.78) - (1.27) Guaranteed 502 Single-Family Housing - 4.87 (5.47) - (0.60) Business and Industry Loan Guarantees - 9.18 (4.07) - 5.11 Rural Business Investment Program - 17.19 (6.99) - 10.20 Renewable Energy Loan Guarantees - 11.82 (1.24) - 10.58 Section 9003 Loan Guarantees - 42.43 (4.41) 2.30 40.32 Water and Waste Disposal Loans - 1.45 (0.86) - 0.59

S E C T I O N I I | F I N A N C I A L I N F O R M A T I O N
8 6 C R E A T I N G A U S D A F O R T H E 2 1 S T C E N T U R Y
Note 8: Inventory and Related Property, Net
Commodity inventory is restricted for the purpose of alleviating distress caused by natural disasters, providing emergency food
assistance in developing countries and providing price support and stabilization.
Commodities: Unit of Measure Quantity Value Quantity Value Quantity Value Quantity Value Quantity Value Quantity ValueCorn Meal Pounds - -$ 53 11$ - -$ (53) (11)$ - -$ - -$ Blended Foods Pounds 18 7 125 38 - - (130) (42) - - 13 3 Dry Edible Beans Cwt. - - - 2 - - - (2) - - - - Dry Whole Peas Cwt. - 2 2 40 - - (2) (40) - - - 2 Emergency Food Ration Bars Pounds - - 16 24 - - (14) (21) - - 2 3 Grain Sorghum Bushels - - 18 108 - - (18) (108) - - - - Lentils Dry Cwt. - 2 1 19 - - (1) (19) - - - 2 Nonfat Dry Milk Pounds - - - - - - - - - - - - Rice Products Cwt., Pounds - 3 1 20 - - (1) (23) - - - - Meat Pounds - - - - - - - - - - - - Vegetable Oil Pounds 32 20 183 91 - - (192) (99) - - 23 12 Wheat Products Bushels, Pounds - - 54 89 - - (52) (89) - - 2 - Other Various - 3 - 21 - - - (44) - 50 - 30 Total Commodities XXXX 37$ XXXX 463$ XXXX -$ XXXX (498)$ XXXX 50$ XXXX 52$ Allowance for losses (1) Barter Delivery Obligations (BDO) 4 Total Inventory and Related Property, Net 55$
Beginning Inventory Acquisitions Collateral Acquired Donations Other Ending Inventory
FY 2015 FY 2015
Commodities: Unit of Measure Quantity Value Quantity Value Quantity Value Quantity Value Quantity Value Quantity ValueCorn Meal Pounds - -$ 73 14$ - -$ (73) (14)$ - -$ - -$ Blended Foods Pounds 25 8 95 30 - - (101) (31) - - 18 7 Dry Edible Beans Cwt. - - - 8 - - - (8) - - - - Dry Whole Peas Cwt. - 4 2 43 - - (2) (45) - - - 2 Emergency Food Ration Bars Pounds 1 1 6 9 - - (6) (10) - - - - Grain Sorghum Bushels - 1 16 98 - - (16) (99) - - - - Lentils Dry Cwt. - 4 - 9 - - - (11) - - - 2 Nonfat Dry Milk Pounds - - - - - - - - - - - - Rice Products Cwt., Pounds - 2 2 41 - - (2) (40) - - - 3 Meat Pounds - - - - - - - - - - - - Vegetable Oil Pounds 23 15 176 105 - - (167) (100) - - 32 20 Wheat Products Bushels, Pounds 6 1 73 136 - - (80) (137) - - - - Other Various - 35 - 48 - 154 - (81) - (153) - 3 Total Commodities XXXX 71$ XXXX 541$ XXXX 154$ XXXX (576)$ XXXX (153)$ XXXX 37$ Allowance for losses (2) Barter Delivery Obligations (BDO) 3 Total Inventory and Related Property, Net 38$
Beginning Inventory Acquisitions Collateral Acquired Donations Other Ending Inventory
FY 2014 FY 2014

F I S C A L Y E A R 2 0 1 5 A G E N C Y F I N A N C I A L R E P O R T
U . S . D E P A R T M E N T O F A G R I C U L T U R E 8 7
Note 9: General Property, Plant, and Equipment (PP&E), Net
FY 2015 Useful NetLife Accumulated Book
Category (Years) Cost Depreciation Value
Land and Land Rights 74$ -$ 74$ Improvements to Land 10 - 50 755 (713) 42 Construction-in-Progress 132 - 132 Buildings, Improvements and Renovations 15 - 30 2,909 (1,730) 1,179 Other Structures and Facilities 15 - 50 1,834 (1,566) 268 Equipment 5 - 20 1,670 (1,242) 428 Assets Under Capital Lease 3 - 20 49 (38) 11 Leasehold Improvements 10 77 (71) 6 Internal-Use Software 5 - 8 983 (658) 325 Internal-Use Software in Development 202 - 202
Total 8,685$ (6,018)$ 2,667$
FY 2014 Useful NetLife Accumulated Book
Category (Years) Cost Depreciation Value
Land and Land Rights 75$ -$ 75$ Improvements to Land 10 - 50 755 (697) 58 Construction-in-Progress 130 - 130 Buildings, Improvements and Renovations 15 - 30 2,966 (1,687) 1,279 Other Structures and Facilities 15 - 50 1,841 (1,530) 311 Equipment 5 - 20 1,601 (1,209) 392 Assets Under Capital Lease 3 - 20 58 (43) 15 Leasehold Improvements 10 77 (67) 10 Internal-Use Software 5 - 8 682 (563) 119 Internal-Use Software in Development 452 - 452
Total 8,637$ (5,796)$ 2,841$

S E C T I O N I I | F I N A N C I A L I N F O R M A T I O N
8 8 C R E A T I N G A U S D A F O R T H E 2 1 S T C E N T U R Y
Note 10. Stewardship PP&E
Stewardship PP&E consist of assets whose physical properties resemble those of general PP&E
that are traditionally capitalized in the financial statements. Due to the nature of these assets,
valuation would be difficult and matching costs with specific periods would not be meaningful.
Stewardship PP&E include heritage assets and stewardship land.
HERITAGE ASSETS
Heritage assets are unique and are generally expected to be preserved indefinitely. Heritage
assets may be unique because they have historical or natural significance, are of cultural,
educational or artistic importance, or have significant architectural characteristics. The assets are
reported in terms of physical units rather than cost, fair value, or other monetary values. No
amounts are shown on the balance sheet for heritage assets, except for multi-use heritage assets
in which the predominant use of the asset is in general government operations. The costs of
acquisition, betterment, or reconstruction of multi-use heritage assets is capitalized as general
PP&E and depreciated. The costs of acquiring, constructing, improving, reconstructing, or
renovating heritage assets, other than multi-use is considered an expense in the period incurred
when determining the net cost of operations. Heritage assets consist of collection type, such as
objects gathered and maintained for exhibition, for example library collections; and
non-collection-type, such as memorials, monuments and buildings.
National Forests, National Grasslands and Other Sites
FS manages its heritage assets by site. Sites include national forests, national grasslands, other
FS-managed sites, and non FS- managed sites such as museums and university laboratories. The
mission of the FS is to sustain the health, diversity, and productivity of the Nation’s forests and
grasslands to meet the needs of present and future generations. The FS strives to achieve quality
land management under the sustainable multiple-use management concept, to deliver the
necessary products and services that are essential for enhancing natural resource stewardship,
and to meet the diverse needs of people.
Heritage Asset categories can include the following:
Priority Heritage Assets (PHA): Heritage assets of distinct public value that are, or should be,
actively maintained, and meet one or more of the following criteria:
The property is recognized through an official designation, such as a listing on the National
Register of Historic Places, State register, etc.
The property is recognized through prior investment in preservation, interpretation, and use.
Any improvement to a PHA that meets real property designation criteria is considered real
property.

F I S C A L Y E A R 2 0 1 5 A G E N C Y F I N A N C I A L R E P O R T
U . S . D E P A R T M E N T O F A G R I C U L T U R E 8 9
The property is recognized in an agency-approved management plan.
The property exhibits critical deferred maintenance needs, and those needs have been
documented.
Other Heritage Assets: Assets that may have potential important historical or cultural
significance but lack formal listing and the demonstrated need for active maintenance.
Assemblage Assets: Any grouping of artifacts or archival materials aggregated through donation,
agency events, site-specific or other field collection, other acquisition method, or combination
therein.
Research Centers
Agricultural Research Service (ARS) conducts research at centers nationwide to develop and
transfer solutions to agricultural problems of high national priority. ARS provides information
access and dissemination to ensure high-quality, safe food and other agricultural products; assess
the nutritional needs of Americans; sustain a competitive agricultural economy; enhance the
natural resource base and the environment; and provide economic opportunities for rural citizens,
communities, and society as a whole. NRCS owns one heritage asset, the Tucson Plant Materials
Center (TPMC) which is included in general PP&E as a multi-use asset. It was listed in the
National Register of Historic Places (NRHP) on July 2, 1997. The TPMC develops and evaluates
native plants and addresses an array of resource issues in the areas of rangeland, mined land,
urban lands, cropland riparian areas, and desert lands. The TPMC provides technical assistance
to NRCS field offices, Resource Conservation and Development (RC&D) groups, conservation
districts, Federal, State, and Tribal agencies, and private landowners through the greater
Southwest. Research centers are considered heritage assets because one or more buildings or
structures at these centers is on the National Register of Historic Places or have been identified
as eligible for inclusion on the National Register.
Library Collections
The National Agricultural Library (NAL) comprises one of the largest collections of materials
devoted to agriculture in the world. The collections are in constant use to support the research
activities of USDA, assist policymakers, and answer inquiries from citizens such as writers,
editors, historians, filmmakers, and university researchers. NAL houses and provides access
to millions of books and periodicals. The majority of these items were published more than 25
years ago and almost all of them are out-of-print. By statute, NAL is the primary depository of
publications and information concerning the research and other activities of USDA. Included in
the collection are government documents and many items that are unique and irreplaceable. NAL
collects, preserves and provides access to manuscripts, rare books, photographs, posters, oral
histories, agricultural objects and tools, and other unique materials. Collection concentrations
include the fields of agriculture, forestry, horticulture, entomology, poultry science, animal
science, nutrition, botany, natural history, and agricultural history. Although focused primarily
on American agriculture and related sciences, NAL holds numerous items of international origin.

S E C T I O N I I | F I N A N C I A L I N F O R M A T I O N
9 0 C R E A T I N G A U S D A F O R T H E 2 1 S T C E N T U R Y
Acquisition and Withdrawal of Heritage Assets
The FS generally does not construct heritage assets, although in some circumstances important
site-structural components may be rehabilitated or reconstructed into viable historic properties to
provide forest visitors with use and interpretation. Heritage assets may be acquired through the
procurement process, but this rarely occurs. Normally, heritage assets are part of the land
acquisition and inventory process. Withdrawal occurs through land exchange or natural disasters.
Most additions occur through inventory activities where previously undocumented sites are
discovered and added to the total.
STEWARDSHIP LAND
Stewardship land is land and land rights not acquired for or in connection with items of general
PP&E. Land is defined as the solid surface of the earth, excluding natural resources. Stewardship
land is valued for its environmental resources, recreational and scenic value, cultural and
paleontological resources, vast open spaces, and resource commodities and revenue provided to
the Federal Government, states, and counties. These assets are reported in terms of physical units
rather than cost, fair value, or other monetary values. No asset amount is shown on the balance
sheet for stewardship land. The acquisition cost of stewardship land is considered an expense in
the period acquired when determining the net cost of operations. Stewardship land consists
primarily of the national forests and grasslands owned by the FS and conservation easements
purchased by NRCS.
National Forests
National forests are formally established and permanently set aside and reserved for national
forest purposes, including National Wilderness, National Primitive, National Wild and Scenic
River, National Recreation, National Scenic Research, National Game Refuges and Wildlife
Preserve, and National Monument areas.
National Grasslands
National grasslands are designated by the Secretary of Agriculture and permanently held by the
USDA under Title III of the Bankhead-Jones Farm Tenant Act.
Research and Experimental Areas
Research and experimental areas are reserved and dedicated by the Secretary of Agriculture for
forest and range research experimentation. Areas reported are located outside the exterior
boundaries of a national forest or national grassland.
National Preserves and Other Areas
National preserves are units established to protect and preserve scientific, scenic, geologic,
watershed, fish, wildlife, historic, cultural and recreational values; and to provide for multiple
use and sustained yield of renewable resources. Other areas include areas administered by the FS
that are not included in one of the above groups.

F I S C A L Y E A R 2 0 1 5 A G E N C Y F I N A N C I A L R E P O R T
U . S . D E P A R T M E N T O F A G R I C U L T U R E 9 1
Conservation Easements
NRCS’s mission objectives in administering the conservation easement programs are to provide
landowners with financial and technical assistance in return for maintaining and improving high
quality productive soils, clean and abundant water, healthy plant and animal communities, clean
air, an adequate energy supply, and working farm and ranch land.
NRCS’s objectives in managing, monitoring and enforcing the terms and conditions of easement
deeds are to ensure that: (1) taxpayer investments are properly used in accordance with the intent
of the program; (2) the agency is a good steward of the land; and (3) the land is properly
maintained.
Stewardship resources involve substantial investment in order to gain long-term benefits for the
American public and help the Agency satisfy its mission. The purpose of purchasing easements
is to restore or enhance wetlands, protect farmland, restore and protect grassland, restore and
protect forest ecosystems, and restore, protect, maintain, and enhance the functions of
floodplains.
NRCS, on behalf of USDA, administers and owns conservation easements on private lands.
Landowners are not allowed to withdraw from the program; however termination or expiration
may occur. For the purpose of stewardship asset reporting, all easements where NRCS is the
grantee of the easement are included as stewardship land. Also included are easements that are
administered by NRCS on behalf of other USDA agencies.
Acquisition and Withdrawal of Stewardship Lands
The Land and Water Conservation Fund (L&WCF) Land Acquisition Program acquires land for
the FS National Forest System (NFS). The program coordinates with a variety of partners,
including State, local, and Tribal governments, and private landowners through statewide
planning for development of a land-adjustment strategy.
The Land Acquisition Program preserves, develops, and maintains access to NFS lands and
waters for the public and provides permanent access to public lands for recreation, commodity
production, resource management, public safety, and community economic viability.
The L&WCF statutory authority specifically defines the purpose to also include protecting the
quality of scientific, scenic, historical, ecological, environmental, air and atmospheric, water
resource, archeological values, as well as food and habitat for fish and wildlife, and managing
the public lands for minerals, food, timber, and fiber.
From these several allowable uses of program funding, the program concentrates on protecting
habitat for priority species identified in the national forest and grassland’s Land Management
Plans and enhancing recreational opportunities for areas with high demand for recreation. The
program focuses acquisitions on inholdings and areas adjacent to existing NFS lands.

S E C T I O N I I | F I N A N C I A L I N F O R M A T I O N
9 2 C R E A T I N G A U S D A F O R T H E 2 1 S T C E N T U R Y
FY 2015 Additions Withdrawals FY 2014Heritage Assets
National Forests 154 - - 154National Grasslands 20 - - 20Other Sites 175 10 (2) 167Research Centers 34 - - 34Library Collections 1 - - 1
Total 384 10 (2) 376
Stewardship LandNational Forests 154 - - 154National Grasslands 20 - - 20Research and Experimental Areas 3 - - 3National Preserves and Other Areas 2 - (1) 3Conservation Easements 17,318 267 - 17,051
Total 17,497 267 (1) 17,231
FY 2014 Additions Withdrawals FY 2013Heritage Assets
National Forests 154 - - 154National Grasslands 20 - - 20Other Sites 167 2 (3) 168Research Centers 34 - - 34Library Collections 1 - - 1
Total 376 2 (3) 377
Stewardship LandNational Forests 154 - - 154National Grasslands 20 - - 20Research and Experimental Areas 3 - - 3National Preserves and Other Areas 3 - - 3Conservation Easements 17,051 798 - 16,253
Total 17,231 798 - 16,433
Note 11: Other Assets
In FY 2015 and FY 2014, other assets included investments in trust for loan asset sales of
$37 million.
FY 2015 FY 2014Intragovernmental:
Advances to Others 3$ 3$ Subtotal Intragovernmental 3 3
With the Public:Advances to Others 191 152 Other Assets 37 37
Total Other Assets 231$ 192$

F I S C A L Y E A R 2 0 1 5 A G E N C Y F I N A N C I A L R E P O R T
U . S . D E P A R T M E N T O F A G R I C U L T U R E 9 3
Note 12: Liabilities Not Covered By Budgetary Resources
In FY 2015 and FY 2014, other intragovernmental liabilities not covered by budgetary resources
included accruals for Federal Employee Compensation Act (FECA) of $157 million and
$161 million, contract disputes claims payable to Treasury’s Judgment Fund of $24 million and
$25 million, unemployment compensation of $18 million and $23 million, and custodial of
$3 million and $3 million, respectively.
In FY 2015, other liabilities with the public not covered by budgetary resources included future
funded indemnity costs of $5,699 million, Agricultural Risk Coverage and Price Loss Coverage
of $4,594 million, estimated underwriting gain on crop insurance of $1,529 million, unfunded
leave of $610 million, contingent liabilities of $509 million, Payments to States of $303 million,
clearing accounts of $44 million, credit programs of $7 million and custodial of $2 million.
In FY 2014, other liabilities with the public not covered by budgetary resources included future
funded indemnity costs of $4,749 million, estimated underwriting gain on crop insurance of
$1,955 million, unfunded leave of $602 million, Brazilian Cotton Producers of $300 million,
Payments to States of $78 million, contingent liabilities of $66 million, Tobacco Transition
Payment Program of $50 million, disaster assistance of $15 million, credit programs of
$9 million, clearing accounts of $6 million, and custodial of $3 million.
FY 2015 FY 2014
Intragovernmental:
Other 203$ 212$
Subtotal Intragovernmental 203 212
With the Public:
Accounts Payable - -
Federal employee and veterans' benefits 893 955
Environmental and disposal liabilities 193 196
Other 13,299 7,832
Subtotal With the Public 14,385 8,983
Total liabilities not covered by budgetary resources 14,588 9,195
Total liabilities covered by budgetary resources 146,270 150,140
Total Liabilities 160,858$ 159,335$

S E C T I O N I I | F I N A N C I A L I N F O R M A T I O N
9 4 C R E A T I N G A U S D A F O R T H E 2 1 S T C E N T U R Y
Note 13: Debt
FY 2015Beginning
Balance Net BorrowingEnding Balance
IntragovernmentalDebt to the Treasury 71,354$ 1,177$ 72,531$ Debt to the Federal Financing Bank 42,748 (1,047) 41,701
Total Intragovernmental 114,102 130 114,232
Agency Debt:Held by the Public - - -
Total Debt 114,102$ 130$ 114,232$
FY 2014Beginning
Balance Net BorrowingEnding Balance
IntragovernmentalDebt to the Treasury 64,380$ 6,974$ 71,354$ Debt to the Federal Financing Bank 40,660 2,088 42,748
Total Intragovernmental 105,040 9,062 114,102
Agency Debt:Held by the Public - - -
Total Debt 105,040$ 9,062$ 114,102$

F I S C A L Y E A R 2 0 1 5 A G E N C Y F I N A N C I A L R E P O R T
U . S . D E P A R T M E N T O F A G R I C U L T U R E 9 5
Note 14: Environmental and Disposal Liabilities
USDA is subject to the Comprehensive Environmental Response, Compensation, and Liability
Act, the Clean Water Act, and the Resource Conservation and Recovery Act for cleanup of
hazardous waste. In FY 2015 and FY 2014, FS estimates the liability for total cleanup costs for
sites known to contain hazardous waste to be $2 million, based on actual cleanup costs at similar
sites. In FY 2015 and FY 2014, CCC estimates the liability for total cleanup costs for sites
known to contain hazardous waste to be $8 million based on actual cleanup costs at similar sites.
CCC estimates the range of potential future losses due to remedial actions to be between
$13 million and $141 million. These estimates will change as new sites are discovered, remedy
standards change, and new technology is introduced.
In FY 2015 and FY 2014, ARS estimated the liability for cleanup of the Beltsville Agricultural
Research Center (BARC) to be $19 million and $20 million, respectively. ARS is evaluating and
remediating areas of concern on BARC that are contaminated or threaten to contaminate ground
and surface water with pesticides, solvents, metals, and other hazardous substances.
USDA is also subject to Asbestos National Emissions Standards for Hazardous Air Pollutants. In
FY 2015 and FY 2014, the Department estimated its liability for asbestos-related cleanup of real
property to be $164 and $166 million, respectively. The liability is calculated using total square
footage of real property expected to contain asbestos times a cost factor based on historical
actual cleanup costs, adjusted for inflation, including any other identifiable costs, e.g. survey
cost. As additional information becomes available, key assumptions will be reevaluated, cost
estimates will be revised, and necessary adjustments will be made to the liability recognition.
Note 15. Other Liabilities
In FY 2015, other liabilities with related budgetary obligations with the public include Grants,
Subsidies, and Contributions of $2,799 million, Conservation Reserve Program of
$1,510 million, estimated underwriting gains on crop insurance of $1,034 million, indemnity
payments not yet disbursed of $191 million, and other accrued liabilities of $979 million.
In FY 2015, other liabilities without related budgetary obligations with the public include
Agricultural Risk Coverage and Price Loss Coverage of $4,594 million, estimated underwriting
gains on crop insurance of $1,529 million, Payments to States of $303 million, and other accrued
liabilities of $49 million.
In FY 2014, other liabilities with related budgetary obligations with the public include Disaster
Assistance Program of $3,365 million, Grants, Subsidies, and Contributions of $3,280 million,
Conservation Reserve Program of $1,684 million, estimated underwriting gains on crop
insurance of $639 million, Cotton Transition Program of $342 million, indemnity payments not
yet disbursed of $148 million, Direct and Counter Cyclical Program of $143 million, and other
accrued liabilities of $798 million.

S E C T I O N I I | F I N A N C I A L I N F O R M A T I O N
9 6 C R E A T I N G A U S D A F O R T H E 2 1 S T C E N T U R Y
In FY 2014, other liabilities without related budgetary obligations with the public include
estimated underwriting gains on crop insurance of $1,955 million, Brazilian Cotton Industry of
$300 million, Payments to States of $78 million, Tobacco Transition Payment Program of
$50 million, and other accrued liabilities of $41 million.
In FY 2014, the presentation of note 15 was reclassified to align with the USSGL crosswalk for
other liabilities and to move the non-current portion of unfunded FECA liability and
underwriting gains on crop insurance from current.
FY 2015 Non-Current Current TotalIntragovernmental:
Other Liabilities With Related Budgetary Obligations - 10 10 Employer Contributions and Payroll Taxes - 59 59 Unfunded FECA Liability 87 71 158 Other Unfunded Employment Related Liability - 18 18 Liability for Advances and Prepayments - 10 10 Liability for Clearing Accounts - (58) (58) Custodial Liability - 95 95
Liability for Non-entity Assets Not Reported on the Statement of Custodial
Activities- 11,650 11,650
Other Liabilities Without Related Budgetary Obligations 24 - 24 Subtotal Intragovernmental 111 11,855 11,966
With the Public:Other Liabilities With Related Budgetary Obligations - 6,513 6,513 Accrued Funded Payroll and Leave - 244 244 Unfunded Leave - 610 610 Liability for Advances and Prepayments - 163 163 Other Deferred Credits - 713 713 Liability for Nonfiduciary Deposit Funds and Undeposited Collections - 272 272 Liability for Clearing Accounts - 94 94 Actuarial Liability for Federal Insurance and Guarantee Programs - 5,700 5,700 Contingent Liabilities - 509 509 Capital Lease Liability 8 3 11 Custodial Liability - 10 10 Other Liabilities Without Related Budgetary Obligations 1,553 4,922 6,475
Subtotal With the Public 1,561 19,753 21,314
Total Other Liabilities 1,672$ 31,608$ 33,280$

F I S C A L Y E A R 2 0 1 5 A G E N C Y F I N A N C I A L R E P O R T
U . S . D E P A R T M E N T O F A G R I C U L T U R E 9 7
FY 2014 Non-Current Current TotalIntragovernmental:
Other Liabilities With Related Budgetary Obligations -$ 4$ 4$ Employer Contributions and Payroll Taxes - 51 51 Unfunded FECA Liability 89 72 161 Other Unfunded Employment Related Liability - 23 23 Liability for Advances and Prepayments - 17 17 Liability for Clearing Accounts - (36) (36) Custodial Liability - 83 83
Liability for Non-entity Assets Not Reported on the Statement of Custodial
Activities- 12,066 12,066
Other Liabilities Without Related Budgetary Obligations 25 - 25 Subtotal Intragovernmental 114 12,280 12,394
With the Public:Other Liabilities With Related Budgetary Obligations - 10,400 10,400 Accrued Funded Payroll and Leave - 237 237 Unfunded Leave - 603 603 Liability for Advances and Prepayments - 157 157 Other Deferred Credits - 719 719 Liability for Nonfiduciary Deposit Funds and Undeposited Collections - 159 159 Liability for Clearing Accounts - 134 134 Actuarial Liability for Federal Insurance and Guarantee Programs - 4,749 4,749 Contingent Liabilities - 65 65 Capital Lease Liability 11 4 15 Custodial Liability - 10 10 Other Liabilities Without Related Budgetary Obligations 1,978 446 2,424
Subtotal With the Public 1,989 17,683 19,672
Total Other Liabilities 2,103$ 29,963$ 32,066$

S E C T I O N I I | F I N A N C I A L I N F O R M A T I O N
9 8 C R E A T I N G A U S D A F O R T H E 2 1 S T C E N T U R Y
Note 16: Leases
USDA activities based in the Washington D.C. area are located in General Services
Administration (GSA) leased facilities and USDA owned buildings. The USDA Headquarters
complex (Whitten Building and South Building) is a government owned facility, which is part of
the GSA Federal Buildings Inventory. As the result of a 1998 agreement between GSA and
USDA, a moratorium was placed on the rental billings for the Headquarters complex beginning
in FY 1999.
At current market rate, the estimated yearly rental payment for the above mentioned space would
be $60 million. This agreement is still in effect and as a result, USDA activities located in the
Headquarters complex are not billed for rental costs.
FY 2015Capital Leases:
Summary of Assets Under Capital LeasesLand and Building 49$ Machinery and Equipment - Accumulated Amortization (38)
Future Payments Due:
Land & BuildingsMachinery &
EquipmentOther Totals
Fiscal Year2016 7 - - 7 2017 6 - - 6 2018 5 - - 5 2019 4 - - 4 2020 4 - - 4 After 5 Years 9 - - 9
Total Future Lease Payments 35 - - 35 Less: Imputed Interest 17 - - 17 Less: Executory Costs 7 - - 7 Less: Lease Renewal Options - - - -
Net Capital Lease Liability 11 - -$ 11
Lease liabilities covered by budgetary resources 11
Operating Leases:Future Payments Due:
Fiscal YearLand & Buildings
Machinery &
EquipmentOther Totals
2016 98 - - 98 2017 86 - 1 87 2018 71 - 1 72 2019 61 - - 61 2020 51 - - 51 After 5 Years 143 - - 143
Total Future Lease Payments 510$ -$ 2$ 512$

F I S C A L Y E A R 2 0 1 5 A G E N C Y F I N A N C I A L R E P O R T
U . S . D E P A R T M E N T O F A G R I C U L T U R E 9 9
FY 2014Capital Leases:
Summary of Assets Under Capital LeasesLand and Building 58$ Machinery and Equipment - Accumulated Amortization (43)
Future Payments Due:
Land & BuildingsMachinery &
EquipmentOther Totals
Fiscal Year2015 9 - - 9 2016 8 - - 8 2017 6 - - 6 2018 6 - - 6 2019 4 - - 4 After 5 Years 12 - - 12
Total Future Lease Payments 45 - - 45 Less: Imputed Interest 21 - - 21 Less: Executory Costs 9 - - 9 Less: Lease Renewal Options - - - -
Net Capital Lease Liability 15 - -$ 15
Lease liabilities covered by budgetary resources 15
Operating Leases:Future Payments Due:
Fiscal YearLand & Buildings
Machinery &
EquipmentOther Totals
2015 130 - - 130 2016 119 - - 119 2017 107 - - 107 2018 96 - - 96 2019 82 - - 82 After 5 Years 303 - - 303
Total Future Lease Payments 837$ -$ -$ 837$
Note 17: Commitments and Contingencies
The Department is subject to various claims and contingencies related to lawsuits as well as
commitments under contractual and other commercial obligations.
For cases in which payment has been deemed probable and for which the amount of potential
liability has been estimated, $509 million and $65 million has been accrued in the financial
statements as of September 30, 2015 and 2014, respectively.
No amounts have been accrued in the financial statements for claims where the amount is
uncertain or where the probability of judgment against USDA is remote. The Department’s
potential liability for claims where a judgment against the Department is reasonably possible
ranges from $51 million to $158 million as of September 30, 2015, compared to $725 million to
$1,511 million as of September 30, 2014.
Through the Conservation Reserve Program (CRP), eligible participants sign 10 to 15 year
contracts to remove land from production in exchange for an annual rental payment. The
participants also receive cost-share assistance for establishing conservation practices on the
reserve acreage and additional incentive payments for adopting high-priority conservation
measures. CCC estimates that the maximum amount of future outlays for all existing CRP rental

S E C T I O N I I | F I N A N C I A L I N F O R M A T I O N
1 0 0 C R E A T I N G A U S D A F O R T H E 2 1 S T C E N T U R Y
contracts over the contract terms, subject to funds availability and contract compliance, is
approximately $11 billion.
Commitments to extend loan guarantees are estimated to be $4,951 million and $5,846 million in
FY 2015 and FY 2014, respectively.
Note 18: Funds from Dedicated Collections
Funds from dedicated collections are financed by specifically identified revenues, often
supplemented by other financing sources, which remain available over time. These specifically
identified revenues and other financing sources are required by statute to be used for designated
activities or purposes and must be accounted for separately from the Government’s general
revenues.
Financial information for all significant funds from dedicated collections follows the descriptions
of each fund’s purpose shown below.
AGRICULTURAL MARKETING SERVICE (AMS)
Funds for Strengthening Markets, Income, and Supply
This fund is used to purchase commodities for schools and elderly feeding programs, to provide
goods and other necessities in emergencies and disasters, and to purchase agricultural
commodities to stabilize markets. The fund is permanently financed by statutory transfer of an
amount equal to 30 percent of customs receipts collected during each calendar year and is
automatically appropriated for expanding outlets for perishable, non-price supported
commodities. An amount equal to 30 percent of receipts collected on fishery products is
transferred to the Food and Nutrition Service and is used to purchase commodities under section
6 of the National School Lunch Act and other authorities specified in the child nutrition
appropriation. Funds are available under section 32 of the Act of August 24, 1935, as amended
(7 U.S.C. 612c).
Expenses and Refunds, Inspection and Grading of Farm Products
The commodity grading programs provide grading, examination, and certification services for a
wide variety of fresh and processed food commodities using federally approved grade standards
and purchase specifications. This fund is financed by the collection of fees charged to producers
of various food commodities who request, on a voluntary basis, inspection and grading of
agricultural food commodities. This program is authorized by the Agricultural Marketing Act of
1946 (7 U.S.C. 1621-1627).

F I S C A L Y E A R 2 0 1 5 A G E N C Y F I N A N C I A L R E P O R T
U . S . D E P A R T M E N T O F A G R I C U L T U R E 1 0 1
ANIMAL PLANT HEALTH INSPECTION SERVICE (APHIS)
Agricultural Quarantine Inspection User Fee Account
This fund is used to record and report expenditures and revenue associated with operating
Agricultural Quarantine Inspection (AQI) activities at ports of entry. The Farm Bill of 1990, as
amended by the Federal Agriculture Improvement and Reform Act of 1996, gave the Animal and
Plant Health Inspection Service (APHIS) the authority to charge user fees for AQI services and
to use the revenue to fund AQI activities. In March of 2003, a portion of the AQI program was
transferred to the Department of Homeland Security (DHS); however, APHIS retained the
authority to collect AQI revenue. APHIS transfers a portion of the revenue to DHS periodically
throughout the year to fund their expenditures. The revenue in the fund is collected from airlines,
air passengers, vessels, trucks, and railroad cars that are subject to AQI inspection at ports of
entry. These user fees are an inflow of revenue from the public that is used to fund AQI
inspections that are required by APHIS and DHS. The authority is codified in 21 U.S.C. 136(a).
FOREST SERVICE (FS)
Cooperative Work
Cooperative contributions are deposited for disbursement in compliance with the terms and
provisions of the agreement between the cooperator and the FS. Cooperators include timber
purchasers, not-for-profit organizations, and local hunting and fishing clubs. The governing
authorities are the Cooperative Funds Act of July 31, 1914 (16 U.S.C. 498) and the
Knutson-Vandenberg Act.
Land Acquisition
Each fiscal year this fund receives a transfer of recreation user fees from the Department of the
Interior’s Land and Water Conservation Fund, to be used for the acquisition of land or waters, or
interest therein, including administrative expenses, to carry out the provisions of the Land and
Water Conservation Fund Act of 1965, as amended (16 U.S.C. 460l-4-11), pertaining to the
preservation of watersheds. The Land Acquisition program is authorized by the Interior and
Related Agencies Appropriations Act of December 30, 1982 (96 Stat. 1983, Public Law 97-394).
Payments to States, National Forest Fund
The Act of May 23, 1908, as amended (16 U.S.C. 500), commonly known as “Payments to
States”, requires with a few exceptions, that 25 percent of all monies received from the national
forests and deposited into the National Forest Fund during a fiscal year from timber, grazing,
special-use permits, power and mineral leases, and admission and user fees be paid to the States
in which the national forests are located, for public schools and public roads in the county or
counties in which the national forests are situated.

S E C T I O N I I | F I N A N C I A L I N F O R M A T I O N
1 0 2 C R E A T I N G A U S D A F O R T H E 2 1 S T C E N T U R Y
State, Private, and International Forestry, Land and Water Conservation Fund
The Fiscal Year 2004 Department of the Interior and Related Agencies Appropriation Act
(Public Law 108-108) authorizes the Forest Service to receive a transfer of receipts from the
Department of the Interior’s Land and Water Conservation Fund to finance the existing Forest
Legacy Program, funded previously by State and Private Forestry general appropriation. To
accommodate the new financing arrangement and at OMB’s request, the U.S. Department the of
Treasury established a new special fund, “State, Private and International Forestry, Land and
Water Conservation Fund”. The program expenditures include grants and an occasional land
purchase, but no real property will be procured or constructed.
Recreation Fee Demonstration Program
The Recreation Fee Demonstration Program fund receives deposits of recreation fees collected
from projects that are part of the Recreation Fee Demonstration Program. These monies are
retained and used for backlog repair and maintenance of recreation areas, sites or projects. These
funds are also used for interpretation, signage, habitat or facility enhancement, resource
preservation, annual operation, maintenance, and law enforcement related to public use of
recreation areas and sites. The Recreation Fee Demonstration Program is authorized by
16 U.S.C. 4601-6(a).
National Forest Fund Receipts
The Act of May 23, 1908, as amended (16 U.S.C. 500), requires (with a few exceptions) that all
receipts from national forest activities be aggregated each fiscal year in order to calculate the
portion which is paid to the States in which the national forests are located. The payments must
be used for public schools and roads in the county or counties in which the national forests are
situated. Originally, the States’ portion of receipts was 25% but past statutory amendments have
changed the calculation factors from time to time. Receipts include revenues from the sale of
timber and other forest products; fees for grazing, special-use permits, power and mineral leases;
and recreation user fees.
Restoration of Forest Lands and Improvements
The Restoration of Forest Lands and Improvements Acts (16 U.S.C. 579(c)) states any monies
received by the United States with respect to lands under the administration of the Forest Service
(a) as a result of the forfeiture of a bond or deposit by a permittee or timber purchaser for failure
to complete performance of improvement, protection, or rehabilitation work required under the
permit or timber sale contract or (b) as a result of a judgment, compromise, or settlement of any
claim, involving present or potential damage to lands or improvements, shall be deposited into
the United States Treasury and are appropriated and made available until expended to cover the
cost to the United States of any improvement, protection, or rehabilitation work on lands under
the administration of the Forest Service rendered necessary by the action which led to the
forfeiture, judgment, compromise, or settlement: Provided, that any portion of the monies
received in excess of the amount expended in performing the work necessitated by the action
which led to their receipt shall be transferred to miscellaneous receipts.

F I S C A L Y E A R 2 0 1 5 A G E N C Y F I N A N C I A L R E P O R T
U . S . D E P A R T M E N T O F A G R I C U L T U R E 1 0 3
Payments to Counties, National Grasslands
Payments to Counties, Title III, Bankhead-Jones Farm Tenant Act (Act) authorizes national
grassland or land utilization project receipts to be shared through grants with local governments
for the purposes stated in the Act. At the end of each calendar year, 25 percent of the net
revenues from each national grassland or land utilization project are paid to the counties in which
such lands are located. These payments are not in lieu of taxes. Receipts from the Act designated
as either national grasslands or land utilization projects are to be credited to a special account.
Acquisition of Lands to Complete Land Exchanges
As authorized by 7 statutes, this program is funded annually by congressional appropriation
action, with forest revenues generated by the occupancy of public land or from the sale of natural
resources other than minerals. All funds appropriated that remain unobligated at the end of the
fiscal year are returned to the receipts of the affected national forests. These funds are used to
purchase land and for related expenditures such as title search, escrow, recording, and personnel
costs when the purchase is considered necessary to minimize soil erosion and flood damage. This
appropriation is available for land acquisition within the exterior boundaries of the national
forests.
NATIONAL INSTITUTE OF FOOD AND AGRICULTURE (NIFA)
Native American Institutions Endowment Fund
The Native American Institutions Endowment Fund was authorized by Public Law 103-382, and
provided an initial installment to establish an endowment to benefit the 1994 land grant
institutions. The public law states that “This program will enhance educational opportunities for
Native Americans by building educational capacity at these institutions in the areas of student
recruitment and retention, curricula development, faculty preparation, instruction delivery
systems, and scientific instrumentation for teaching.” While the principal (corpus) of the fund
cannot be used, the interest that is earned on the endowment fund investments in Treasury
instruments can be used for the purposes described above. After the close of a fiscal year, the
income is distributed after making adjustments for the cost of administering the fund.

S E C T I O N I I | F I N A N C I A L I N F O R M A T I O N
1 0 4 C R E A T I N G A U S D A F O R T H E 2 1 S T C E N T U R Y
OTHER
Financial information is summarized for all other funds from dedicated collections with total
assets less than $50 million listed below.
Agricultural Marketing Service
Perishable Agricultural Commodities Act
Wool Research, Development and Promotion Trust Fund
Animal Plant Health Inspection Service
Miscellaneous Contributed Funds
Forest Service
Roads and Trails for States, National Forest Fund
Reforestation Trust Fund
Timber Sales Pipeline Restoration Fund
Operation and Maintenance of Forest Service Quarters
Timber Roads, Purchaser Elections
Timber Salvage Sales
Expenses, Brush Disposal
Range Betterment Fund
Acquisition of Lands for National Forests, Special Acts
Construction of Facilities or Land Acquisition
Payment to Minnesota (Cook, Lake and Saint Louis Counties)
Licensee Program
Resource Management Timber Receipts
Quinault Special Management Area
MNP Rental Fee Account
Land Between the Lakes Management Fund
Administration of Rights-of-Way and Other Land Uses Fund
Valles Caldera Fund
Hardwood Technology Transfer and Applied Research Fund
Stewardship Contracting Product Sales
Gifts, Donations and Bequests for Forest and Rangeland Research

F I S C A L Y E A R 2 0 1 5 A G E N C Y F I N A N C I A L R E P O R T
U . S . D E P A R T M E N T O F A G R I C U L T U R E 1 0 5
Land Between the Lakes Trust Fund
Gifts and Bequests
Natural Resources Conservation Service
Miscellaneous Contributed Funds
Agricultural Research Service
Concessions Fees and Volunteer Services
Gifts and Bequests
Miscellaneous Contributed Funds
Rural Development
Alternative Agricultural Research and Commercialization Revolving Fund
Foreign Agricultural Service
Miscellaneous Contributed Funds
Gifts and Bequests
Foreign Service National Separation Liability Trust Fund
Grain Inspection, Packers and Stockyards Administration
Inspection and Weighing Services
Food Safety and Inspection Service
Expenses and Refunds, Inspection of Farm Products
Office of the Inspector General
Inspector General Assets Forfeiture, Department of Justice
Inspector General Assets Forfeiture, Department of Treasury
National Agricultural Statistics Service
Miscellaneous Contributed Funds
Economic Research Service
Miscellaneous Contributed Funds
Departmental Offices
Gifts and Bequests

S E C T I O N I I | F I N A N C I A L I N F O R M A T I O N
1 0 6 C R E A T I N G A U S D A F O R T H E 2 1 S T C E N T U R Y
AMS AMS APHIS FS FS FS FS
Balance Sheet As of September 30, 2015
Funds for
Strengthening
Markets, Income, and
Supply
Expenses and
Refunds,
Inspection and
Grading of Farm
Products
Agricultural
Quarantine
Inspection User Fee
Account Cooperative Work Land Acquisition
Payments to States,
National Forests
Fund
State, Private, and
International
Forestry, Land and
Water
Conservation Fund12X5209 12X8015 12X5161 12X8028 12X5004 12X5201 12X5367
Fund Balance with Treasury 595$ 98$ 200$ 176$ 29$ 60$ 140$ Investments - - - - - - - Other Assets 12 26 149 14 45 1 4 Total Assets 607 124 349 190 74 61 144
Other Liabilities 49 54 93 82 - 271 - Total Liabilities 49 54 93 82 - 271 -
Unexpended Appropriations - (1) - - - - - Cumulative Results of Operations 558 71 256 108 74 (210) 144
Total Liabilities and Net Position 607 124 349 190 74 61 144
Statement of Net Cost For the PeriodEnded September 30, 2015Gross program costs 735 190 194 100 27 340 (6) Less Earned Revenue 4 148 595 112 - 77 - Net Cost of Operations 731 42 (401) (12) 27 263 (6)
Statement of Changes in Net PositionFor the period Ended September 30, 2015Net Position Beginning of Period 435 64 280 293 70 53 102
Other Financing Sources 854 48 (425) (197) 31 - 36 Net Cost of Operations (731) (42) 401 12 (27) (263) 6
Change in Net Position 123 6 (24) (185) 4 (263) 42
Net Position End of Period 558$ 70$ 256$ 108$ 74$ (210)$ 144$

F I S C A L Y E A R 2 0 1 5 A G E N C Y F I N A N C I A L R E P O R T
U . S . D E P A R T M E N T O F A G R I C U L T U R E 1 0 7
FS FS FS FS FS NIFA
Balance Sheet As of September 30, 2015
Recreation Fee
Demonstration
Program
National Forest
Fund Receipts
Restoration of
Forest Lands and
Improvements
Payments to
Counties, National
Grasslands
Acquisition of
Lands to Complete
Land Exchanges
Native American
Institutions
Endowment Fund Other Total12X5268 125008 12X5215 125896 12X5216 12X5205
Fund Balance with Treasury 57$ 150$ 239$ 126$ 17$ 22$ 260$ 2,169$ Investments - - - - - 183 8 191 Other Assets 5 10 3 - 49 - 37 355 Total Assets 62 160 242 126 66 205 305 2,715
Other Liabilities 2 - 1 24 1 - 87 664 Total Liabilities 2 - 1 24 1 - 87 664
Unexpended Appropriations - - - - - 131 1 131 Cumulative Results of Operations 60 161 241 102 65 74 216 1,920
Total Liabilities and Net Position 62 161 242 126 66 205 304 2,715
Statement of Net Cost For the PeriodEnded September 30, 2015Gross program costs 66 - 31 36 9 3 256 1,981 Less Earned Revenue 79 100 12 8 5 4 230 1,374 Net Cost of Operations (13) (100) 19 28 4 (1) 26 607
Statement of Changes in Net PositionFor the period Ended September 30, 2015Net Position Beginning of Period 75 89 240 99 82 192 361 2,435
Other Financing Sources (28) (28) 20 31 (13) 12 (118) 223 Net Cost of Operations 13 100 (19) (28) (4) 1 (26) (607)
Change in Net Position (15) 72 1 3 (17) 13 (144) (384)
Net Position End of Period 60$ 161$ 241$ 102$ 65$ 205$ 217$ 2,051$

S E C T I O N I I | F I N A N C I A L I N F O R M A T I O N
1 0 8 C R E A T I N G A U S D A F O R T H E 2 1 S T C E N T U R Y
AMS AMS APHIS FS FS FS FS FS FS
Balance Sheet As of September 30, 2014
Funds for
Strengthening
Markets, Income, and
Supply
Expenses and
Refunds,
Inspection and
Grading of Farm
Products
Agricultural
Quarantine
Inspection User Fee
Account Cooperative Work Land Acquisition
Payments to States,
National Forests
Fund
Timber Salvage
Sales
Expenses, Brush
Disposal
State, Private, and
International
Forestry, Land and
Water
Conservation Fund12X5209 12X8015 12X5161 12X8028 12X5004 12X5201 12X5204 12X5206 12X5367
Fund Balance with Treasury 481$ 100$ 228$ 363$ 24$ 107$ 69$ 51$ 145$ Investments - - - - - - - - - Other Assets 23 20 143 15 46 2 1 - 1 Total Assets 504 120 371 378 70 109 70 51 146
Other Liabilities 69 56 91 85 - 56 - - 44 Total Liabilities 69 56 91 85 - 56 - - 44
Unexpended Appropriations - - - - - - - - - Cumulative Results of Operations 435 64 280 293 70 53 70 51 102
Total Liabilities and Net Position 504 120 371 378 70 109 70 51 146
Statement of Net Cost For the PeriodEnded September 30, 2014Gross program costs 750 178 195 103 51 (124) 20 7 37 Less Earned Revenue 3 141 603 72 - 122 32 7 - Net Cost of Operations 747 37 (408) 31 51 (246) (12) - 37
Statement of Changes in Net PositionFor the period Ended September 30, 2014Net Position Beginning of Period 539 52 218 121 66 (193) 53 21 83
Other Financing Sources 643 49 (346) 203 55 - 5 30 56 Net Cost of Operations (747) (37) 408 (31) (51) 246 12 - (37)
Change in Net Position (104) 12 62 172 4 246 17 30 19
Net Position End of Period 435$ 64$ 280$ 293$ 70$ 53$ 70$ 51$ 102$

F I S C A L Y E A R 2 0 1 5 A G E N C Y F I N A N C I A L R E P O R T
U . S . D E P A R T M E N T O F A G R I C U L T U R E 1 0 9
FS FS FS FS FS NIFA
Balance Sheet As of September 30, 2014
Recreation Fee
Demonstration
Program
National Forest
Fund Receipts
Restoration of
Forest Lands and
Improvements
Payments to
Counties, National
Grasslands
Acquisition of
Lands to Complete
Land Exchanges
Native American
Institutions
Endowment Fund Other Total12X5268 125008 12X5215 125896 12X5216 12X5205
Fund Balance with Treasury 74$ 79$ 238$ 115$ 37$ 47$ 302$ 2,460$ Investments - - - - - 144 8 152 Other Assets 5 10 3 1 45 1 34 350 Total Assets 79 89 241 116 82 192 344 2,962
Other Liabilities 4 - 1 17 - - 104 527 Total Liabilities 4 - 1 17 - - 104 527
Unexpended Appropriations - - - - - 119 1 120 Cumulative Results of Operations 75 89 240 99 82 73 239 2,315
Total Liabilities and Net Position 79 89 241 116 82 192 344 2,962
Statement of Net Cost For the PeriodEnded September 30, 2014Gross program costs 68 - 20 22 5 5 210 1,547 Less Earned Revenue 70 10 3 30 11 5 204 1,313 Net Cost of Operations (2) (10) 17 (8) (6) - 6 234
Statement of Changes in Net PositionFor the period Ended September 30, 2014Net Position Beginning of Period 73 79 74 65 76 180 175 1,682
Other Financing Sources - - 183 26 - 12 71 987 Net Cost of Operations 2 10 (17) 8 6 - (6) (234)
Change in Net Position 2 10 166 34 6 12 65 753
Net Position End of Period 75$ 89$ 240$ 99$ 82$ 192$ 240$ 2,435$

S E C T I O N I I | F I N A N C I A L I N F O R M A T I O N
1 1 0 C R E A T I N G A U S D A F O R T H E 2 1 S T C E N T U R Y
Note 19: Sub-Organization Program Costs/Program Costs by Segment
FY 2015
Intragovernmental With the Public Intragovernmental With the Public Intragovernmental With the Public
Assist Rural Communities to Create Prosperity so They AreSelf-Sustaining, Repopulating, and Economically Thriving:Gross Costs 1,014$ 1,040$ 1,154$ 4,394$ 127$ 208$ Less: Earned Revenue 169 197 7 146 77 - Net Costs 845 843 1,147 4,248 50 208
Ensure Our National Forests and Private Working Lands AreConserved, Restored, and Made More Resilient to Climate Change,While Enhancing Our Water Resources:Gross Costs 237 243 356 1,528 - - Less: Earned Revenue 40 46 34 1 - - Net Costs 197 197 322 1,527 - -
Help America Promote Agricultural Production and Biotechnology Exports as America Works to Increase Food Security:Gross Costs - - 85 1,748 34 56 Less: Earned Revenue - - 57 108 21 - Net Costs - - 28 1,640 13 56
Ensure that All of America's Children Have Accessto Safe, Nutritious, and Balanced Meals:Gross Costs - - - - - - Less: Earned Revenue - - - - - - Net Costs - - - - - -
Create a USDA for the 21st Century That is High Performing,
Efficient, and Adaptable:Gross Costs - - - - - - Less: Earned Revenue - - - - - - Net Costs - - - - - -
Total Gross Costs 1,251 1,283 1,595 7,670 161 264 Less: Total Earned Revenue 209 243 98 255 98 - Net Cost of Operations 1,042$ 1,040$ 1,497$ 7,415$ 63$ 264$
FASFSA CCC

F I S C A L Y E A R 2 0 1 5 A G E N C Y F I N A N C I A L R E P O R T
U . S . D E P A R T M E N T O F A G R I C U L T U R E 1 1 1
FY 2015
Intragovernmental With the Public Intragovernmental With the Public Intragovernmental With the Public
Assist Rural Communities to Create Prosperity so They AreSelf-Sustaining, Repopulating, and Economically Thriving:Gross Costs 79$ 11,166$ -$ -$ -$ -$ Less: Earned Revenue - 3,066 - - - - Net Costs 79 8,100 - - - -
Ensure Our National Forests and Private Working Lands AreConserved, Restored, and Made More Resilient to Climate Change,While Enhancing Our Water Resources:Gross Costs - - - - - - Less: Earned Revenue - - - - - - Net Costs - - - - - -
Help America Promote Agricultural Production and Biotechnology Exports as America Works to Increase Food Security:Gross Costs - - - - - - Less: Earned Revenue - - - - - - Net Costs - - - - - -
Ensure that All of America's Children Have Accessto Safe, Nutritious, and Balanced Meals:Gross Costs - - 981 103,990 395 897 Less: Earned Revenue - - - 73 1 213 Net Costs - - 981 103,917 394 684
Create a USDA for the 21st Century That is High Performing,
Efficient, and Adaptable:Gross Costs - - - - - - Less: Earned Revenue - - - - - - Net Costs - - - - - -
Total Gross Costs 79 11,166 981 103,990 395 897 Less: Total Earned Revenue - 3,066 - 73 1 213 Net Cost of Operations 79$ 8,100$ 981$ 103,917$ 394$ 684$
FSISRMA FNS

S E C T I O N I I | F I N A N C I A L I N F O R M A T I O N
1 1 2 C R E A T I N G A U S D A F O R T H E 2 1 S T C E N T U R Y
FY 2015
Intragovernmental With the Public Intragovernmental With the Public Intragovernmental With the Public
Assist Rural Communities to Create Prosperity so They AreSelf-Sustaining, Repopulating, and Economically Thriving:Gross Costs 95$ 474$ 56$ 263$ 36$ 63$ Less: Earned Revenue 6 100 8 114 1 58 Net Costs 89 374 48 149 35 5
Ensure Our National Forests and Private Working Lands AreConserved, Restored, and Made More Resilient to Climate Change,While Enhancing Our Water Resources:Gross Costs - - 24 112 - - Less: Earned Revenue - - 3 49 - - Net Costs - - 21 63 - -
Help America Promote Agricultural Production and Biotechnology Exports as America Works to Increase Food Security:Gross Costs - - 22 106 - - Less: Earned Revenue - - 3 46 - - Net Costs - - 19 60 - -
Ensure that All of America's Children Have Accessto Safe, Nutritious, and Balanced Meals:Gross Costs 94 471 254 1,189 - - Less: Earned Revenue 6 99 34 518 - - Net Costs 88 372 220 671 - -
Create a USDA for the 21st Century That is High Performing,
Efficient, and Adaptable:Gross Costs - - - - - - Less: Earned Revenue - - - - - - Net Costs - - - - - -
Total Gross Costs 189 945 356 1,670 36 63 Less: Total Earned Revenue 12 199 48 727 1 58 Net Cost of Operations 177$ 746$ 308$ 943$ 35$ 5$
AMS APHIS GIPSA

F I S C A L Y E A R 2 0 1 5 A G E N C Y F I N A N C I A L R E P O R T
U . S . D E P A R T M E N T O F A G R I C U L T U R E 1 1 3
FY 2015
Intragovernmental With the Public Intragovernmental With the Public Intragovernmental With the Public
Assist Rural Communities to Create Prosperity so They AreSelf-Sustaining, Repopulating, and Economically Thriving:Gross Costs -$ -$ -$ -$ 80$ 305$ Less: Earned Revenue - - - - 33 28 Net Costs - - - - 47 277
Ensure Our National Forests and Private Working Lands AreConserved, Restored, and Made More Resilient to Climate Change,While Enhancing Our Water Resources:Gross Costs 1,410 5,890 664 3,163 51 196 Less: Earned Revenue 153 603 43 12 21 18 Net Costs 1,257 5,287 621 3,151 30 178
Help America Promote Agricultural Production and Biotechnology Exports as America Works to Increase Food Security:Gross Costs - - - - 38 147 Less: Earned Revenue - - - - 16 15 Net Costs - - - - 22 132
Ensure that All of America's Children Have Accessto Safe, Nutritious, and Balanced Meals:Gross Costs - - - - 123 468 Less: Earned Revenue - - - - 50 43 Net Costs - - - - 73 425
Create a USDA for the 21st Century That is High Performing,
Efficient, and Adaptable:Gross Costs - - - - - - Less: Earned Revenue - - - - - - Net Costs - - - - - -
Total Gross Costs 1,410 5,890 664 3,163 292 1,116 Less: Total Earned Revenue 153 603 43 12 120 104 Net Cost of Operations 1,257$ 5,287$ 621$ 3,151$ 172$ 1,012$
NRCSFS ARS

S E C T I O N I I | F I N A N C I A L I N F O R M A T I O N
1 1 4 C R E A T I N G A U S D A F O R T H E 2 1 S T C E N T U R Y
FY 2015
Intragovernmental With the Public Intragovernmental With the Public Intragovernmental With the Public
Assist Rural Communities to Create Prosperity so They AreSelf-Sustaining, Repopulating, and Economically Thriving:Gross Costs 25$ 666$ 14$ 20$ 61$ 145$ Less: Earned Revenue 23 - 2 - 32 5 Net Costs 2 666 12 20 29 140
Ensure Our National Forests and Private Working Lands AreConserved, Restored, and Made More Resilient to Climate Change,While Enhancing Our Water Resources:Gross Costs 7 180 5 7 - 1 Less: Earned Revenue 6 - 1 - - - Net Costs 1 180 4 7 - 1
Help America Promote Agricultural Production and Biotechnology Exports as America Works to Increase Food Security:Gross Costs 4 100 9 13 - - Less: Earned Revenue 3 - 1 - - - Net Costs 1 100 8 13 - -
Ensure that All of America's Children Have Accessto Safe, Nutritious, and Balanced Meals:Gross Costs 15 384 9 13 3 6 Less: Earned Revenue 13 - 1 - 1 - Net Costs 2 384 8 13 2 6
Create a USDA for the 21st Century That is High Performing,
Efficient, and Adaptable:Gross Costs - - - - - - Less: Earned Revenue - - - - - - Net Costs - - - - - -
Total Gross Costs 51 1,330 37 53 64 152 Less: Total Earned Revenue 45 - 5 - 33 5 Net Cost of Operations 6$ 1,330$ 32$ 53$ 31$ 147$
NIFA NASSERS
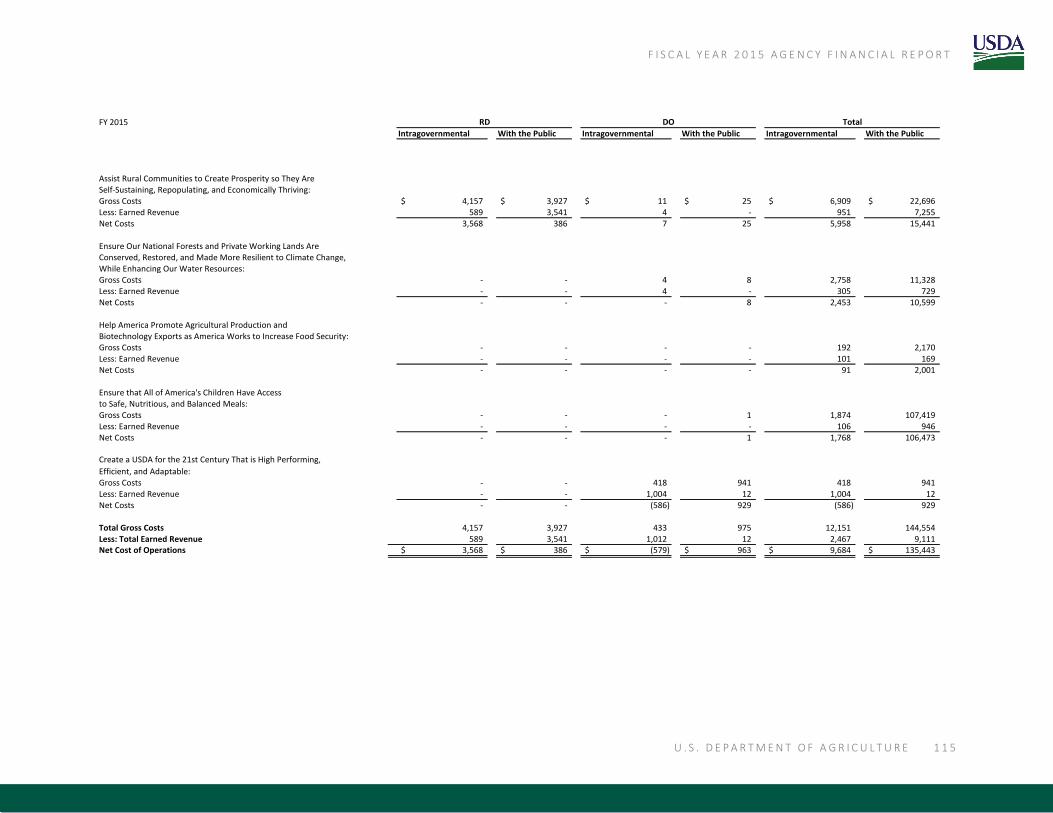
F I S C A L Y E A R 2 0 1 5 A G E N C Y F I N A N C I A L R E P O R T
U . S . D E P A R T M E N T O F A G R I C U L T U R E 1 1 5
FY 2015
Intragovernmental With the Public Intragovernmental With the Public Intragovernmental With the Public
Assist Rural Communities to Create Prosperity so They AreSelf-Sustaining, Repopulating, and Economically Thriving:Gross Costs 4,157$ 3,927$ 11$ 25$ 6,909$ 22,696$ Less: Earned Revenue 589 3,541 4 - 951 7,255 Net Costs 3,568 386 7 25 5,958 15,441
Ensure Our National Forests and Private Working Lands AreConserved, Restored, and Made More Resilient to Climate Change,While Enhancing Our Water Resources:Gross Costs - - 4 8 2,758 11,328 Less: Earned Revenue - - 4 - 305 729 Net Costs - - - 8 2,453 10,599
Help America Promote Agricultural Production and Biotechnology Exports as America Works to Increase Food Security:Gross Costs - - - - 192 2,170 Less: Earned Revenue - - - - 101 169 Net Costs - - - - 91 2,001
Ensure that All of America's Children Have Accessto Safe, Nutritious, and Balanced Meals:Gross Costs - - - 1 1,874 107,419 Less: Earned Revenue - - - - 106 946 Net Costs - - - 1 1,768 106,473
Create a USDA for the 21st Century That is High Performing,
Efficient, and Adaptable:Gross Costs - - 418 941 418 941 Less: Earned Revenue - - 1,004 12 1,004 12 Net Costs - - (586) 929 (586) 929
Total Gross Costs 4,157 3,927 433 975 12,151 144,554 Less: Total Earned Revenue 589 3,541 1,012 12 2,467 9,111 Net Cost of Operations 3,568$ 386$ (579)$ 963$ 9,684$ 135,443$
RD DO Total
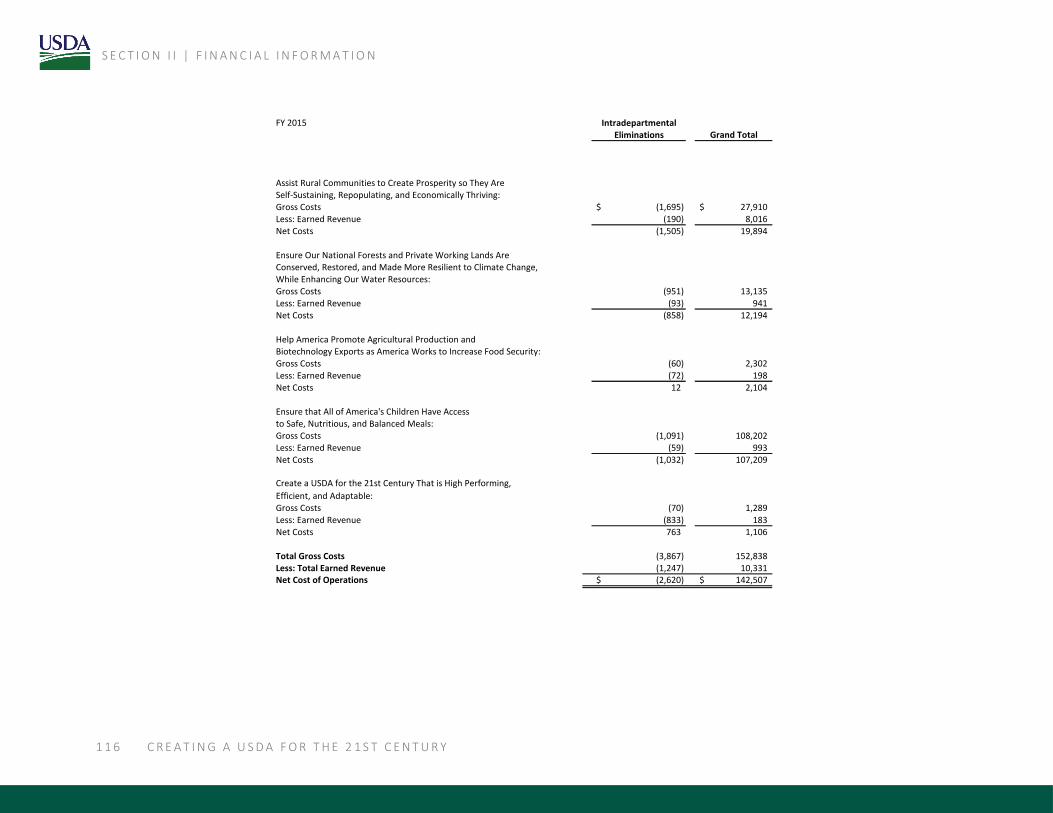
S E C T I O N I I | F I N A N C I A L I N F O R M A T I O N
1 1 6 C R E A T I N G A U S D A F O R T H E 2 1 S T C E N T U R Y
FY 2015 IntradepartmentalEliminations Grand Total
Assist Rural Communities to Create Prosperity so They AreSelf-Sustaining, Repopulating, and Economically Thriving:Gross Costs (1,695)$ 27,910$ Less: Earned Revenue (190) 8,016 Net Costs (1,505) 19,894
Ensure Our National Forests and Private Working Lands AreConserved, Restored, and Made More Resilient to Climate Change,While Enhancing Our Water Resources:Gross Costs (951) 13,135 Less: Earned Revenue (93) 941 Net Costs (858) 12,194
Help America Promote Agricultural Production and Biotechnology Exports as America Works to Increase Food Security:Gross Costs (60) 2,302 Less: Earned Revenue (72) 198 Net Costs 12 2,104
Ensure that All of America's Children Have Accessto Safe, Nutritious, and Balanced Meals:Gross Costs (1,091) 108,202 Less: Earned Revenue (59) 993 Net Costs (1,032) 107,209
Create a USDA for the 21st Century That is High Performing,
Efficient, and Adaptable:Gross Costs (70) 1,289 Less: Earned Revenue (833) 183 Net Costs 763 1,106
Total Gross Costs (3,867) 152,838 Less: Total Earned Revenue (1,247) 10,331 Net Cost of Operations (2,620)$ 142,507$

F I S C A L Y E A R 2 0 1 5 A G E N C Y F I N A N C I A L R E P O R T
U . S . D E P A R T M E N T O F A G R I C U L T U R E 1 1 7
FY 2014
Intragovernmental With the Public Intragovernmental With the Public Intragovernmental With the Public
Assist Rural Communities to Create Prosperity so They AreSelf-Sustaining, Repopulating, and Economically Thriving:Gross Costs 764$ 641$ 881$ 8,325$ 159$ 214$ Less: Earned Revenue 107 179 7 27 126 - Net Costs 657 462 874 8,298 33 214
Ensure Our National Forests and Private Working Lands AreConserved, Restored, and Made More Resilient to Climate Change,While Enhancing Our Water Resources:Gross Costs 173 145 386 1,928 - - Less: Earned Revenue 24 41 45 2 - - Net Costs 149 104 341 1,926 - -
Help America Promote Agricultural Production and Biotechnology Exports as America Works to Increase Food Security:Gross Costs - - 96 1,748 45 61 Less: Earned Revenue - - 76 122 36 - Net Costs - - 20 1,626 9 61
Ensure that All of America's Children Have Accessto Safe, Nutritious, and Balanced Meals:Gross Costs - - - - - - Less: Earned Revenue - - - - - - Net Costs - - - - - -
Create a USDA for the 21st Century That is High Performing,
Efficient, and Adaptable:Gross Costs - - - - - - Less: Earned Revenue - - - - - - Net Costs - - - - - -
Total Gross Costs 937 786 1,363 12,001 204 275 Less: Total Earned Revenue 131 220 128 151 162 - Net Cost of Operations 806$ 566$ 1,235$ 11,850$ 42$ 275$
FASFSA CCC

S E C T I O N I I | F I N A N C I A L I N F O R M A T I O N
1 1 8 C R E A T I N G A U S D A F O R T H E 2 1 S T C E N T U R Y
FY 2014
Intragovernmental With the Public Intragovernmental With the Public Intragovernmental With the Public
Assist Rural Communities to Create Prosperity so They AreSelf-Sustaining, Repopulating, and Economically Thriving:Gross Costs 64$ 12,010$ -$ -$ -$ -$ Less: Earned Revenue - 3,415 - - - - Net Costs 64 8,595 - - - -
Ensure Our National Forests and Private Working Lands AreConserved, Restored, and Made More Resilient to Climate Change,While Enhancing Our Water Resources:Gross Costs - - - - - - Less: Earned Revenue - - - - - - Net Costs - - - - - -
Help America Promote Agricultural Production and Biotechnology Exports as America Works to Increase Food Security:Gross Costs - - - - - - Less: Earned Revenue - - - - - - Net Costs - - - - - -
Ensure that All of America's Children Have Accessto Safe, Nutritious, and Balanced Meals:Gross Costs - - 1,051 103,815 373 894 Less: Earned Revenue - - 1 64 1 204 Net Costs - - 1,050 103,751 372 690
Create a USDA for the 21st Century That is High Performing,
Efficient, and Adaptable:Gross Costs - - - - - - Less: Earned Revenue - - - - - - Net Costs - - - - - -
Total Gross Costs 64 12,010 1,051 103,815 373 894 Less: Total Earned Revenue - 3,415 1 64 1 204 Net Cost of Operations 64$ 8,595$ 1,050$ 103,751$ 372$ 690$
RMA FNS FSIS

F I S C A L Y E A R 2 0 1 5 A G E N C Y F I N A N C I A L R E P O R T
U . S . D E P A R T M E N T O F A G R I C U L T U R E 1 1 9
FY 2014
Intragovernmental With the Public Intragovernmental With the Public Intragovernmental With the Public
Assist Rural Communities to Create Prosperity so They AreSelf-Sustaining, Repopulating, and Economically Thriving:Gross Costs 68$ 437$ 52$ 148$ 35$ 63$ Less: Earned Revenue 2 90 14 103 1 54 Net Costs 66 347 38 45 34 9
Ensure Our National Forests and Private Working Lands AreConserved, Restored, and Made More Resilient to Climate Change,While Enhancing Our Water Resources:Gross Costs - - 23 64 - - Less: Earned Revenue - - 6 45 - - Net Costs - - 17 19 - -
Help America Promote Agricultural Production and Biotechnology Exports as America Works to Increase Food Security:Gross Costs - - 21 57 - - Less: Earned Revenue - - 5 40 - - Net Costs - - 16 17 - -
Ensure that All of America's Children Have Accessto Safe, Nutritious, and Balanced Meals:Gross Costs 81 524 256 732 - - Less: Earned Revenue 2 108 69 511 - - Net Costs 79 416 187 221 - -
Create a USDA for the 21st Century That is High Performing,
Efficient, and Adaptable:Gross Costs - - - - - - Less: Earned Revenue - - - - - - Net Costs - - - - - -
Total Gross Costs 149 961 352 1,001 35 63 Less: Total Earned Revenue 4 198 94 699 1 54 Net Cost of Operations 145$ 763$ 258$ 302$ 34$ 9$
GIPSAAMS APHIS

S E C T I O N I I | F I N A N C I A L I N F O R M A T I O N
1 2 0 C R E A T I N G A U S D A F O R T H E 2 1 S T C E N T U R Y
FY 2014
Intragovernmental With the Public Intragovernmental With the Public Intragovernmental With the Public
Assist Rural Communities to Create Prosperity so They AreSelf-Sustaining, Repopulating, and Economically Thriving:Gross Costs -$ -$ -$ -$ 78$ 285$ Less: Earned Revenue - - - - 28 21 Net Costs - - - - 50 264
Ensure Our National Forests and Private Working Lands AreConserved, Restored, and Made More Resilient to Climate Change,While Enhancing Our Water Resources:Gross Costs 1,380 4,628 628 3,445 52 188 Less: Earned Revenue 135 597 69 5 19 14 Net Costs 1,245 4,031 559 3,440 33 174
Help America Promote Agricultural Production and Biotechnology Exports as America Works to Increase Food Security:Gross Costs - - - - 39 140 Less: Earned Revenue - - - - 14 10 Net Costs - - - - 25 130
Ensure that All of America's Children Have Accessto Safe, Nutritious, and Balanced Meals:Gross Costs - - - - 122 446 Less: Earned Revenue - - - - 44 32 Net Costs - - - - 78 414
Create a USDA for the 21st Century That is High Performing,
Efficient, and Adaptable:Gross Costs - - - - - - Less: Earned Revenue - - - - - - Net Costs - - - - - -
Total Gross Costs 1,380 4,628 628 3,445 291 1,059 Less: Total Earned Revenue 135 597 69 5 105 77 Net Cost of Operations 1,245$ 4,031$ 559$ 3,440$ 186$ 982$
ARSNRCSFS

F I S C A L Y E A R 2 0 1 5 A G E N C Y F I N A N C I A L R E P O R T
U . S . D E P A R T M E N T O F A G R I C U L T U R E 1 2 1
FY 2014
Intragovernmental With the Public Intragovernmental With the Public Intragovernmental With the Public
Assist Rural Communities to Create Prosperity so They AreSelf-Sustaining, Repopulating, and Economically Thriving:Gross Costs 32$ 668$ 15$ 19$ 66$ 125$ Less: Earned Revenue 45 - 1 - 18 1 Net Costs (13) 668 14 19 48 124
Ensure Our National Forests and Private Working Lands AreConserved, Restored, and Made More Resilient to Climate Change,While Enhancing Our Water Resources:Gross Costs 8 176 6 7 2 4 Less: Earned Revenue 12 - - - 1 - Net Costs (4) 176 6 7 1 4
Help America Promote Agricultural Production and Biotechnology Exports as America Works to Increase Food Security:Gross Costs 16 339 10 13 - - Less: Earned Revenue 23 - 1 - - - Net Costs (7) 339 9 13 - -
Ensure that All of America's Children Have Accessto Safe, Nutritious, and Balanced Meals:Gross Costs 8 158 10 12 3 5 Less: Earned Revenue 11 - 1 - 1 - Net Costs (3) 158 9 12 2 5
Create a USDA for the 21st Century That is High Performing,
Efficient, and Adaptable:Gross Costs - - - - - - Less: Earned Revenue - - - - - - Net Costs - - - - - -
Total Gross Costs 64 1,341 41 51 71 134 Less: Total Earned Revenue 91 - 3 - 20 1 Net Cost of Operations (27)$ 1,341$ 38$ 51$ 51$ 133$
NIFA NASSERS

S E C T I O N I I | F I N A N C I A L I N F O R M A T I O N
1 2 2 C R E A T I N G A U S D A F O R T H E 2 1 S T C E N T U R Y
FY 2014
Intragovernmental With the Public Intragovernmental With the Public Intragovernmental With the Public
Assist Rural Communities to Create Prosperity so They AreSelf-Sustaining, Repopulating, and Economically Thriving:Gross Costs 4,153$ 4,047$ 3$ 5$ 6,370$ 26,987$ Less: Earned Revenue 549 3,647 2 - 900 7,537 Net Costs 3,604 400 1 5 5,470 19,450
Ensure Our National Forests and Private Working Lands AreConserved, Restored, and Made More Resilient to Climate Change,While Enhancing Our Water Resources:Gross Costs - - 2 6 2,660 10,591 Less: Earned Revenue - - 1 (1) 312 703 Net Costs - - 1 7 2,348 9,888
Help America Promote Agricultural Production and Biotechnology Exports as America Works to Increase Food Security:Gross Costs - - - - 227 2,358 Less: Earned Revenue - - - - 155 172 Net Costs - - - - 72 2,186
Ensure that All of America's Children Have Accessto Safe, Nutritious, and Balanced Meals:Gross Costs - - 4 6 1,908 106,592 Less: Earned Revenue - - - - 130 919 Net Costs - - 4 6 1,778 105,673
Create a USDA for the 21st Century That is High Performing,
Efficient, and Adaptable:Gross Costs - - 493 840 493 840 Less: Earned Revenue - - 838 10 838 10 Net Costs - - (345) 830 (345) 830
Total Gross Costs 4,153 4,047 502 857 11,658 147,368 Less: Total Earned Revenue 549 3,647 841 9 2,335 9,341 Net Cost of Operations 3,604$ 400$ (339)$ 848$ 9,323$ 138,027$
DO TotalRD

F I S C A L Y E A R 2 0 1 5 A G E N C Y F I N A N C I A L R E P O R T
U . S . D E P A R T M E N T O F A G R I C U L T U R E 1 2 3
FY 2014 IntradepartmentalEliminations Grand Total
Assist Rural Communities to Create Prosperity so They AreSelf-Sustaining, Repopulating, and Economically Thriving:Gross Costs (1,388)$ 31,969$ Less: Earned Revenue (153) 8,284 Net Costs (1,235) 23,685
Ensure Our National Forests and Private Working Lands AreConserved, Restored, and Made More Resilient to Climate Change,While Enhancing Our Water Resources:Gross Costs (940) 12,311 Less: Earned Revenue (103) 912 Net Costs (837) 11,399
Help America Promote Agricultural Production and Biotechnology Exports as America Works to Increase Food Security:Gross Costs (91) 2,494 Less: Earned Revenue (130) 197 Net Costs 39 2,297
Ensure that All of America's Children Have Accessto Safe, Nutritious, and Balanced Meals:Gross Costs (1,083) 107,417 Less: Earned Revenue (56) 993 Net Costs (1,027) 106,424
Create a USDA for the 21st Century That is High Performing,
Efficient, and Adaptable:Gross Costs (68) 1,265 Less: Earned Revenue (671) 177 Net Costs 603 1,088
Total Gross Costs (3,570) 155,456 Less: Total Earned Revenue (1,113) 10,563 Net Cost of Operations (2,457)$ 144,893$

S E C T I O N I I | F I N A N C I A L I N F O R M A T I O N
1 2 4 C R E A T I N G A U S D A F O R T H E 2 1 S T C E N T U R Y
Note 20: Cost of Stewardship PP&E
The acquisition cost of stewardship land in FY 2015 and FY 2014 was $214 million and
$358 million, respectively.
Note 21: Terms of Borrowing Authority Used
The Secretary of Agriculture has the authority to make and issue notes to the Secretary of the
Treasury for the purpose of discharging obligations for RD’s insurance funds and CCC’s
nonreimbursed realized losses and debt related to foreign assistance programs. The permanent
indefinite borrowing authority includes both interest bearing and non-interest bearing notes.
These notes are drawn upon daily when disbursements exceed deposits. Notes payable under the
permanent indefinite borrowing authority have a term of one year. On January 1 of each year,
USDA refinances its outstanding borrowings, including accrued interest, at the January
borrowing rate.
In addition, USDA has permanent indefinite borrowing authority for the foreign assistance and
export credit programs to finance disbursements on post-credit reform, direct credit obligations,
and credit guarantees. In accordance with the Federal Credit Reform Act of 1990, as amended,
USDA borrows from Treasury on October 1, for the entire fiscal year, based on annual estimates
of the difference between the amount appropriated (subsidy) and the amount to be disbursed to
the borrower. Repayment under this agreement may be, in whole or in part, prior to maturity by
paying the principal amount of the borrowings plus accrued interest to the date of repayment.
Interest is paid on these borrowings based on weighted average interest rates for the cohort, to
which the borrowings are associated. Interest is earned on the daily balance of uninvested funds
in the credit reform financing funds maintained at Treasury. The interest income is used to
reduce interest expense on the underlying borrowings.
USDA has authority to borrow from the Federal Financing Bank (FFB) in the form of
Certificates of Beneficial Ownership (CBO) or loans executed directly between the borrower and
FFB with an unconditional USDA repayment guarantee. CBO’s outstanding with FFB are
generally secured by unpaid loan principal balances. CBO’s outstanding are related to pre-credit
reform loans and no longer are used for program financing.
FFB’s CBO’s are repaid as they mature and are not related to any particular group of loans.
Borrowings made to finance loans directly between the borrower and FFB mature and are repaid
as the related group of loans become due. Interest rates on the related group of loans are equal to
interest rates on FFB borrowings, except in those situations where a FFB funded loan is
restructured and the terms of the loan are modified.
Prepayments can be made on Treasury borrowings without a penalty; however, they cannot be
made on FFB CBO’s, without a penalty.
Funds may also be borrowed from private lending agencies and others. USDA reserves a
sufficient amount of its borrowing authority to purchase, at any time, all notes and other

F I S C A L Y E A R 2 0 1 5 A G E N C Y F I N A N C I A L R E P O R T
U . S . D E P A R T M E N T O F A G R I C U L T U R E 1 2 5
obligations evidencing loans made by agencies and others. All bonds, notes, debentures, and
similar obligations issued by the Department are subject to approval by the Secretary of the
Treasury. Reservation of borrowing authority for these purposes has not been required for many
years.
Note 22: Available Borrowing Authority, End of Period
Available borrowing authority at September 30, 2015 and 2014 was $23,056 million and
$30,215 million, respectively.
Note 23: Apportionment Categories of Obligations Incurred: Direct vs. Reimbursable Obligations
FY 2015Direct Reimbursable Total
Apportionment by Fiscal Quarter 40,321$ 2,322$ 42,643$
Apportionment for Special Activities 123,882 10,874 134,756
Exempt from Apportionment 829 4 833
Total Obligations Incurred 165,032$ 13,200$ 178,232$
FY 2014
Direct Reimbursable Total
Apportionment by Fiscal Quarter 38,951$ 2,229$ 41,180$
Apportionment for Special Activities 121,734 16,339 138,073
Exempt from Apportionment 786 1 787
Total Obligations Incurred 161,471$ 18,569$ 180,040$
Note 24: Undelivered Orders at the End of the Period
Budgetary resources obligated for undelivered orders as of September 30, 2015 and 2014 was
$40,687 million and $43,574 million, respectively.
Note 25: Permanent Indefinite Appropriations
USDA has permanent indefinite appropriations available to fund (1) subsidy costs incurred under
credit reform programs, (2) certain costs of the crop insurance program, (3) certain commodity
program costs, and (4) certain costs associated with FS programs.
The permanent indefinite appropriations for credit reform are mainly available to finance any
disbursements incurred under the liquidating accounts. These appropriations become available
pursuant to standing provisions of law without further action by Congress after transmittal of the
budget for the year involved. They are treated as permanent the first year they become available, as
well as in succeeding years. However, they are not stated as specific amounts but are determined
S E C T I O N I I | F I N A N C I A L I N F O R M A T I O N
1 2 6 C R E A T I N G A U S D A F O R T H E 2 1 S T C E N T U R Y
by specified variable factors, such as cash needs for liquidating accounts, and information about
the actual performance of a cohort or estimated changes in future cash flows of the cohort in the
program accounts.
The permanent indefinite appropriation for the crop insurance program is used to cover premium
subsidy, delivery expenses, losses in excess of premiums, and research and delivery costs.
The permanent indefinite appropriation for commodity program costs is used to encourage the
exportation of agricultural commodities and products, to encourage domestic consumption of
agricultural products by diverting them, and to reestablish farmers’ purchasing power by making
payments in connection with the normal production of any agricultural commodity for domestic
consumption.
The permanent indefinite appropriation for FS programs is used to fund Recreation Fee Collection
Costs, Brush Disposal, License programs, Smokey Bear and Woodsy Owl, Restoration of Forest
Lands and Improvements, Roads and Trails for States, National Forest Fund, Timber Roads,
Purchaser Elections, Timber Salvage Sales and Operations, and Maintenance of Quarters. Each of
these permanent indefinite appropriations is funded by receipts made available by law, and is
available until expended.
Note 26: Legal Arrangements Affecting Use of Unobligated Balances
Unobligated budget authority is the difference between the obligated balance and the total
unexpended balance. It represents that portion of the unexpended balance unencumbered by
recorded obligations. Appropriations are provided on an annual, multi-year, and no-year basis.
An appropriation expires on the last day of its period of availability and is no longer available for
new obligations. Unobligated balances retain their fiscal-year identity in an expired account for
an additional five fiscal years. The unobligated balance remains available to make legitimate
obligation adjustments, i.e., to record previously unrecorded obligations and to make upward
adjustments in previously underestimated obligations for five years. At the end of the fifth year,
the authority is canceled. Thereafter, the authority is not available for any purpose.
Any information about legal arrangements affecting the use of the unobligated balance of budget
authority is specifically stated by program and fiscal year in the appropriation language or in the
alternative provisions section at the end of the appropriations act.

F I S C A L Y E A R 2 0 1 5 A G E N C Y F I N A N C I A L R E P O R T
U . S . D E P A R T M E N T O F A G R I C U L T U R E 1 2 7
Note 27: Explanation of Differences Between the SBR and the Budget of the U.S. Government
The differences between the FY 2014 Statement of Budgetary Resources (SBR) and the FY 2014
actual numbers presented in the FY 2016 Budget of the United States Government (Budget) are
summarized below.
The Budget excludes expired accounts that are no longer available for new obligations.
Adjustments were made prior to the Budget submission as follows:
CCC reduced USAID obligations.
FNS recorded a permanent reduction and commodity purchases for the Child Nutrition
Program.
The Budget includes the Milk Market Orders Assessment Fund since employees of the
Milk Market Administrators participate in the Federal retirement system, though these
funds are not available for use by the Department.
FY 2014
Budgetary
Resources
Obligations
Incurred
Distributed
Offsetting
Receipts Net Outlays
Combined Statement of Budgetary Resources $ 234,595 $ 180,040 $ 2,533 146,696$
Reconciling items:
Expired Accounts (18,092) (435) - -
USAID Adjustments, CCC (144) - - (23)
Permanent Reduction/Timing Difference, FNS 25 - - 11
Milk Market Orders Fund 55 55 - -
Other (2) (1) - (3)
Budget of the United States Government 216,437$ 179,659$ 2,533$ 146,681$
A comparison between the FY 2015 SBR and the FY 2015 actual numbers presented in the
FY 2017 Budget cannot be performed as the FY 2017 Budget is not yet available. The FY 2017
Budget is expected to be published in February 2016 and will be available from the
U.S.Government Publishing Office.

S E C T I O N I I | F I N A N C I A L I N F O R M A T I O N
1 2 8 C R E A T I N G A U S D A F O R T H E 2 1 S T C E N T U R Y
Note 28: Incidental Custodial Collections
Custodial collections represent collections on land leases for resource extraction, National Forest
Fund receipts from the sale of timber and other forest products, miscellaneous general fund
receipts such as collections on accounts receivable related to canceled year appropriations, civil
monetary penalties and interest, and commercial fines and penalties. Custodial collection
activities are considered immaterial and incidental to the mission of the Department.
Revenue Activity: FY 2015 FY 2014
Sources of Collections:
Miscellaneous 134$ 87$
Total Cash Collections 134 87
Accrual Adjustments (1) -
Total Custodial Revenue 133 87
Disposition of Collections:
Transferred to Others:
Treasury (122) (76)
States and Counties - -
( Increase )/Decrease in Amounts Yet to be Transferred (11) (11)
Net Custodial Activity -$ -$

F I S C A L Y E A R 2 0 1 5 A G E N C Y F I N A N C I A L R E P O R T
U . S . D E P A R T M E N T O F A G R I C U L T U R E 1 2 9
Note 29: Fiduciary Activities
Rural Housing Insurance Fund (RHIF) was established by Public Law 89-117 pursuant to section
517 of title V of the Housing Act of 1949, which authorized RD to collect escrow payments on
behalf of new and existing Single Family Housing borrowers. Other fiduciary activities by RD
include but are not limited to collections from borrowers, interest paid on escrow accounts,
payments to insurance agencies and taxing authorities.
Rural Housing Rural Housing
Insurance Insurance
Fund Fund
2015 2014
Fiduciary net assets, beginning of year 105$ 101$
Fiduciary revenues - -
Contributions 438 411
Investment earnings - -
Gain (Loss) on disposition of investments, net - -
Administrative and other expenses - -
Disbursements to and on behalf of beneficiaries (436) (407)
Increases/(Decrease) in fiduciary net assets 2 4
Fiduciary net assets, end of year 107$ 105$
Schedule of Fiduciary Activity
For the Years Ended September 30, 2015 and 2014
Rural Housing Rural Housing
Insurance Insurance
Fund Fund
2015 2014
Fiduciary Assets
Cash and cash equivalents 2$ 11$
Investments 105 94
Other assets - -
Fiduciary Liabilities
Less: Liabilities - -
Total Fiduciary Net Assets 107$ 105$
Fiduciary Net Assets
As of September 30, 2015 and 2014

S E C T I O N I I | F I N A N C I A L I N F O R M A T I O N
1 3 0 C R E A T I N G A U S D A F O R T H E 2 1 S T C E N T U R Y
Note 30: Reconciliation of Budgetary Resources Obligated to Net Cost of Operations
Budgetary and proprietary accounting information are inherently different because of the types
of information and the timing of their recognition. The reconciliation of budgetary resources
obligated and the net cost of operations provides a link between budgetary and proprietary
accounting information. It serves not only to explain how information on net obligations relates
to the net cost of operations, but also to assure integrity between budgetary and proprietary
accounting.
Net obligations and the net cost of operations are different because (1) the net cost of operations
may be financed by non-budgetary resources (e.g. imputed financing); (2) the budgetary and
non-budgetary resources used may finance activities which are not components of the net cost of
operations; and (3) the net cost of operations may contain components which do not use or
generate resources in the current period.

F I S C A L Y E A R 2 0 1 5 A G E N C Y F I N A N C I A L R E P O R T
U . S . D E P A R T M E N T O F A G R I C U L T U R E 1 3 1
2015 2014
Resources Used to Finance Activities:Budgetary Resources Obligated -
Obligations Incurred 178,232$ 180,040$ Less: Spending authority from offsetting collections and recoveries 44,052 33,857 Obligations net of offsetting collections and recoveries 134,180 146,183 Less: Distributed Offsetting receipts 2,834 2,533 Net Obligations 131,346 143,650
Other Resources -Donations and forfeitures of property - - Transfers in(out) without reimbursement (118) (66) Imputed financing from costs absorbed by others 980 851 Other (1,466) (1,710) Net other resources used to finance activities (604) (925)
Total resources used to finance activities 130,742 142,725
Resources Used to Finance Items not Part of the Net Cost of Operations:Change in undelivered orders 2,884 2,844 Resources that fund expenses recognized in prior periods 663 (5,107) Budgetary offsetting collections and receipts that do not affect net cost of operations -
Credit program collections which increase liabilities for loan guarantees or allowances for subsidy 21,910 17,097 Change in Unfilled Customer Orders (334) (444) Decrease in exchange revenue receivable from public 3,584 2,080 Other 2,840 1,965
Resources that finance the acquisition of assets (23,268) (20,089) Other resources or adjustments to net obligated resources that do not affect net cost of operations (1,526) (82)
Total resources used to finance items not part of the net cost of operations 6,753 (1,736)
Total resources used to finance the net cost of operations 137,495 140,989
Components of the Net Cost of Operations that will not Require or GenerateResources in the Current Period:Components Requiring or Generating Resources in Future Periods -
Increase in annual leave liability 8 6 Increase in environmental and disposal liability - 20 Upward/Downward reestimates of credit subsidy expense 2,059 2,055 Increase in exchange revenue receivable from the public - - Other 998 377 Total components of Net Cost of Operations that will require or generate resources in future periods 3,065 2,458
Components not Requiring or Generating Resources -Depreciation and amortization 365 266 Revaluation of assets or liabilities 2 22 Other Components not Requiring or Generating Resources:
Bad Debt Expense (124) 59 Cost of Goods Sold 21 120
Other 1,683 979 Total components of Net Cost of Operations that will not require or generate resources 1,947 1,446
Total components of Net Cost of Operations that will not require or generate resources in the current period 5,012 3,904
Net Cost of Operations 142,507$ 144,893$
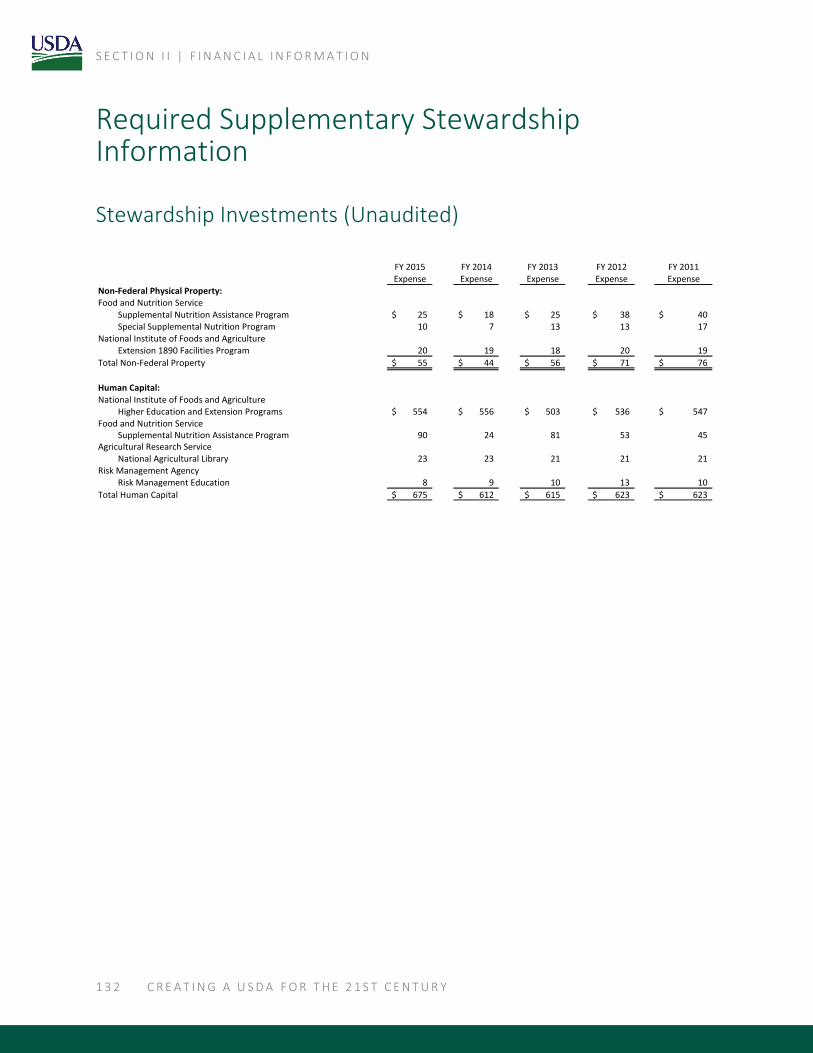
S E C T I O N I I | F I N A N C I A L I N F O R M A T I O N
1 3 2 C R E A T I N G A U S D A F O R T H E 2 1 S T C E N T U R Y
Required Supplementary Stewardship Information
Stewardship Investments (Unaudited)
FY 2015 FY 2014 FY 2013 FY 2012 FY 2011Expense Expense Expense Expense Expense
Non-Federal Physical Property:Food and Nutrition Service
Supplemental Nutrition Assistance Program 25$ 18$ 25$ 38$ 40$ Special Supplemental Nutrition Program 10 7 13 13 17
National Institute of Foods and AgricultureExtension 1890 Facilities Program 20 19 18 20 19
Total Non-Federal Property 55$ 44$ 56$ 71$ 76$
Human Capital:National Institute of Foods and Agriculture
Higher Education and Extension Programs 554$ 556$ 503$ 536$ 547$ Food and Nutrition Service
Supplemental Nutrition Assistance Program 90 24 81 53 45 Agricultural Research Service
National Agricultural Library 23 23 21 21 21 Risk Management Agency
Risk Management Education 8 9 10 13 10
Total Human Capital 675$ 612$ 615$ 623$ 623$

F I S C A L Y E A R 2 0 1 5 A G E N C Y F I N A N C I A L R E P O R T
U . S . D E P A R T M E N T O F A G R I C U L T U R E 1 3 3
FY 2015 FY 2014 FY 2013 FY 2012 FY 2011Expense Expense Expense Expense Expense
Research and Development:
Basic Research: Agricultural Research Service
Human Nutrition 43$ 43$ 39$ 43$ 43$ Collaborative Research Program - - - - - Product Quality/Value Added 51 49 47 50 52 Livestock Production 43 43 35 37 41 Crop Production 108 108 106 114 116 Food Safety 56 56 49 53 53 Livestock Protection 46 44 35 38 40 Crop Protection 96 95 89 97 102 Environmental Stewardship 101 101 88 94 101
National Institute of Foods and AgricultureLand-grant University System 274 268 232 249 274
Forest Service 92 78 77 80 91 Economic Research Service
Economic and Social Science - 7 7 7 8 National Agricultural Statistics Service
Statistical - - 3 3 3
Total Basic Research 910$ 892$ 807$ 865$ 924$
Applied Research:
Agricultural Research Service
Human Nutrition 34$ 34$ 32$ 34$ 34$
Collaborative Research Program - - - - -
Product Quality/Value Added 40 40 37 40 42
Livestock Production 35 35 28 30 33
Crop Production 86 86 84 91 93
Food Safety 45 45 39 42 43
Livestock Protection 36 36 28 31 32
Crop Protection 77 76 72 77 81
Environmental Stewardship 81 80 70 75 80
National Institute of Foods and Agriculture
Land-grant University System 465 454 393 424 467
Forest Service 238 204 192 207 220
Economic Research Service
Economic and Social Science 85 72 64 71 74
National Agricultural Statistics Service
Statistical 5 5 4 4 4
Total Applied Research 1,227$ 1,167$ 1,043$ 1,126$ 1,203$
Development:
Agricultural Research Service
Human Nutrition 9$ 9$ 8$ 8$ 9$
Product Quality/Value Added 10 10 9 10 11
Livestock Production 9 9 7 8 8
Crop Production 22 22 21 23 23
Food Safety 11 11 10 11 11
Livestock Protection 9 9 7 7 7
Crop Protection 19 18 18 19 20
Environmental Stewardship 20 20 17 19 20
Forest Service 10 31 40 32 16
National Agricultural Statistics Service
Statistical 4 4 - - -
Total Development 123$ 143$ 137$ 137$ 125$
Total Research and Development 2,260$ 2,202$ 1,987$ 2,128$ 2,252$

S E C T I O N I I | F I N A N C I A L I N F O R M A T I O N
1 3 4 C R E A T I N G A U S D A F O R T H E 2 1 S T C E N T U R Y
Non-Federal Physical Property
FOOD AND NUTRITION SERVICE
FNS’ non-Federal physical property consists of computer systems and other equipment obtained
by State and local governments for the purpose of administering the SNAP. The total SNAP
expense for ADP Equipment & Systems has been reported as of the date of FNS’ financial
statements. FNS’ non-Federal physical property also consists of computer systems and other
equipment obtained by the State and local governments for the purpose of administering the
Special Supplemental Nutrition Program for Women, Infants, and Children.
NATIONAL INSTITUTE OF FOOD AND AGRICULTURE
The Extension 1890 facilities program supports the renovation of existing buildings and the
construction of new facilities as well as computers and equipment purchases that permit faculty,
students, and communities to benefit fully from the partnership between USDA and the 1890
Land-Grant Universities.
Human Capital
NATIONAL INSTITUTE OF FOOD AND AGRICULTURE (NIFA)
The higher education programs include graduate fellowship grants, competitive challenge grants,
Secondary/2-year Postsecondary grants, Hispanic serving institutions education grants, a
multicultural scholars program, a Native American institutions program, a Native American
institutions endowment fund, an Alaska Native-Serving and Native Hawaiian-Serving
institutions program, a resident instruction grants and distance education grants for insular areas,
and a capacity building program at the 1890 institutions. These programs enable universities to
broaden their curricula, increase faculty development and student research projects, and increase
the number of new scholars recruited in the food and agriculture sciences. NIFA also supports
extension-related work at 1862 and 1890 land-grant institutions throughout the country through
formula and competitive programs.
FOOD AND NUTRITION SERVICE (FNS)
FNS’ human capital consists of employment and training (E&T) for SNAP. The E&T program
requires recipients of SNAP benefits to participate in an employment and training program as a
condition to SNAP eligibility.
Outcome data for the E&T program is only available through the third quarter. As of this period,
FNS’ E&T program has placed 513,475 work registrants subject to the 3-month SNAP
participant limit and 1,135,113 work registrants not subject to the limit in either job-search,
job-training, job-workfare, education, or work experience.

F I S C A L Y E A R 2 0 1 5 A G E N C Y F I N A N C I A L R E P O R T
U . S . D E P A R T M E N T O F A G R I C U L T U R E 1 3 5
AGRICULTURAL RESEARCH SERVICE (ARS)
As the Nation’s primary source for agricultural information, the National Agricultural Library
(NAL) has a mission to increase the availability and utilization of agricultural information for
researchers, educators, policymakers, consumers of agricultural products, and the public. The
NAL is one of the world’s largest and most accessible agricultural research libraries and plays a
vital role in supporting research, education, and applied agriculture.
The NAL was created as the departmental library for USDA in 1862 and became a national
library in 1990. One of four national libraries of the U.S. (with the Library of Congress, the
National Library of Medicine, and the National Library of Education), it is also the coordinator
for a national network of State land-grant and USDA field libraries. In its international role, the
NAL serves as the U.S. center for the international agricultural information system, coordinating
and sharing resources and enhancing global access to agricultural data. The NAL collection of
over 8 million items and its leadership role in information services and technology applications
combine to make it the foremost agricultural library in the world.
RISK MANAGEMENT AGENCY (RMA)
Federal Crop Insurance Corporation (FCIC) has formed partnerships with NIFA, the Commodity
Futures Trading Commission, the USDA National Office of Outreach, the Economic Research
Service (ERS), and private industry to leverage the Federal Government’s funding of its Risk
Management Education (RME) program by using both public and private organizations to help
educate their members in agricultural risk management. RME expanded State and Regional
education partnerships; encouraged the development of information and technology-based
decision aids; facilitated local crop insurance education and risk management training workshops
throughout the Nation through Cooperative Agreements with educational institutions and
community-based outreach organizations.
During fiscal years 2015 and 2014, the RME program worked toward its goals by funding risk
management sessions, most of which directly target producers. The number of producers reached
through these sessions is approximately 49,000 in fiscal year 2015, and 92,453 in fiscal year
2014. In addition to reaching producers, some training sessions helped those who work with
producers (such as lenders, agricultural educators, and other agricultural professionals) to better
understand those areas of risk management with which they may be unfamiliar. Total RME
obligations incurred by FCIC were approximately $8 million and $9 million in fiscal years 2015
and 2014, respectively.

S E C T I O N I I | F I N A N C I A L I N F O R M A T I O N
1 3 6 C R E A T I N G A U S D A F O R T H E 2 1 S T C E N T U R Y
Research and Development
AGRICULTURAL RESEARCH SERVICE (ARS)
ARS’ mission is to conduct research to develop and transfer solutions to agricultural problems of
high national priority and provide information access and dissemination to: ensure high quality,
safe food, and other agricultural products; assess the nutritional needs of Americans; sustain a
competitive agricultural economy; enhance the natural resource base and the environment; and
provide economic opportunities for rural citizens, communities, and society as a whole. ARS’
programs are aligned under the Department’s priorities as follows:
USDA Strategic Goal 1: Assist Rural Communities to Create Prosperity So They Are
Self-Sustaining, Repopulating, and Economically Thriving
New Products/Product Quality/Value Added
ARS has active research programs directed toward: improving the efficiency and reducing the
cost for the conversion of agricultural products into biobased products and biofuels; developing
new and improved products for domestic and foreign markets; and providing higher quality,
healthy foods that satisfy consumer needs in the United States and abroad. Note: Some of ARS’
Livestock and Crop Production research is carried out under this Strategic Goal and Strategic
Goal 3.
National Agricultural Library (NAL)
NAL, among the world’s largest libraries serving agriculture, delivered about 53 million page
views and almost 1 million searches in FY 2015.
Buildings and Facilities
ARS has approximately 95 laboratory locations, primarily located throughout the United States.
ARS’ facilities programs are designed to meet the needs of its scientists and support personnel to
accomplish the agency’s mission.
USDA Strategic Goal 2: Ensure Our National Forests and Private Working Lands Are
Conserved, Restored, and Made More Resilient to Climate Change, While Enhancing Our Water
Resources
Environmental Stewardship
ARS’ research program emphasis is in developing technologies and systems that support
sustainable production and enhance the Nation’s vast renewable natural resource base. The
agency is currently developing the scientific knowledge and technologies needed to meet the
challenges and opportunities facing U.S. agriculture in managing water resource quality and
quantity under different climatic regimes, production systems, and environmental conditions.
ARS’ research also focuses on developing measurement, prediction, and control technologies for
emissions of greenhouse gases, particulate matter, ammonia, hydrogen sulfide, and volatile

F I S C A L Y E A R 2 0 1 5 A G E N C Y F I N A N C I A L R E P O R T
U . S . D E P A R T M E N T O F A G R I C U L T U R E 1 3 7
organic compounds affecting air quality and land-surface climate interactions. The agency is a
leader in developing measurement and modeling techniques for characterizing gaseous and
particulate matter emissions from agriculture. In addition, ARS is evaluating strategies for
enhancing the health and productivity of soils, including developing predictive tools to assess the
sustainability of alternative land management practices. Finding mechanisms to aid agriculture in
adapting to changes in atmospheric composition and climatic variations is also an important
component of this program.
ARS’ range and grazing land research objectives include the conservation and restoration of the
Nation’s range land and pasture ecosystems and agroecosystems through improved management
of fire, invasive weeds, grazing, global change, and other agents of ecological change. The
agency is currently developing improved grass and forage legume germplasm for livestock,
conservation, bioenergy, and bioproduct systems as well as grazing-based livestock systems that
reduce risk and increase profitability. In addition, ARS is developing whole system management
strategies to reduce production costs and risks.
USDA Strategic Goal 3: Help America Promote Agricultural Production and Biotechnology
Exports As America Works to Increase Food Security
Livestock Production
ARS’ research program is directed toward fostering an abundant, safe, nutritionally wholesome,
and competitively priced supply of animal products produced in a viable, competitive, and
sustainable animal agriculture sector of the U.S. economy by: safeguarding and utilizing animal
genetic resources, associated genetic and genomic databases, and bioinformatic tools; developing
a basic understanding of food animal physiology to address priority issues related to animal
production, animal well-being, and product quality and healthfulness; and developing
information, best management practices, novel and innovative tools, and technologies that
improve animal production systems, enhance human health, and ensure domestic food security.
The research is heavily focused on the development and application of genomics technologies to
increase the efficiency and product quality of beef, dairy, swine, poultry, aquaculture, and sheep
systems. Areas of emphasis include increasing the efficiency of nutrient utilization, increasing
animal well-being and reducing stress in production systems, increasing reproductive rates and
breeding animal longevity, developing and evaluating non-traditional production systems
(e.g., organic and natural), and evaluating and conserving animal genetic resources.
Crop Production
ARS’ program focuses on developing and improving ways to reduce crop losses while protecting
and ensuring a safe and affordable food supply. The program concentrates on production
strategies that are environmentally friendly, safe to consumers, and compatible with sustainable
and profitable crop production systems. Research activities are directed at safeguarding and
utilizing plant genetic resources and their associated genetic, genomic, and bioinformatic
databases that facilitate selection of varieties and/or germplasm with significantly improved
traits. Research activities attempt to minimize the impacts of crop pests while maintaining
healthy crops and safe commodities that can be sold in markets throughout the world. The
S E C T I O N I I | F I N A N C I A L I N F O R M A T I O N
1 3 8 C R E A T I N G A U S D A F O R T H E 2 1 S T C E N T U R Y
agency is conducting research to discover and exploit naturally occurring and engineered genetic
mechanisms for plant pest control, develop agronomic germplasm with durable defensive traits,
and transfer genetic resources for commercial use. ARS is also providing taxonomic information
on invasive species that strengthens prevention techniques, aids in detection/identification of
invasive pests, and increases control through management tactics that restore habitats and
biological diversity.
USDA Strategic Goal 4: Ensure that All of America’s Children Have Access to Safe, Nutritious,
and Balanced Meals
Food Safety
ARS’ research program is designed to yield science-based knowledge on the safe production,
storage, processing, and handling of plant and animal products, and on the detection and control
of pathogenic bacteria and fungi, parasites, chemical contaminants, and plant toxins. All of ARS'
research activities involve a high degree of cooperation and collaboration with USDA's
Research, Education, and Economics agencies, as well as with the Food Safety and Inspection
Service (FSIS), Animal and Plant Health Inspection Service (APHIS), the Food and Drug
Administration (FDA), the Centers for Disease Control and Prevention (CDC), the Department
of Homeland Security (DHS), and the Environmental Protection Agency (EPA). The agency also
collaborates in international research programs to address and resolve global food safety issues.
Specific research efforts are directed toward developing new technologies that assist ARS
stakeholders and customers, including regulatory agencies, industry, and commodity and
consumer organizations in detecting, identifying, and controlling foodborne diseases that affect
human health.
Livestock Protection
ARS’ program is directed at protecting and ensuring the safety of the Nation's agriculture and
food supply through improved disease detection, prevention, control, and treatment. Basic and
applied research approaches are used to solve animal health problems of high national priority.
Emphasis is given to methods and procedures to control animal diseases through the discovery
and development of diagnostics, vaccines, biotherapeutics, animal genomics applications,
disease management systems, animal disease models, and farm biosecurity measures. The
research program has the following strategic objectives: establish ARS laboratories into a fluid,
highly effective research network to maximize use of core competencies and resources; use
specialized high containment facilities to study zoonotic and emerging diseases; develop an
integrated animal and microbial genomics research program; establish core competencies in
bovine, swine, ovine, and avian immunology; launch a biotherapeutic discovery program
providing alternatives to animal drugs; build a technology driven vaccine and diagnostic
discovery research program; develop core competencies in field epidemiology and predictive
biology; establish a best-in-class training center for our Nation's veterinarians and scientists; and
develop a model technology transfer program to achieve the full impact of ARS research
discoveries. The ARS animal research program includes the following core components:
biodefense research, animal genomics and immunology, zoonotic diseases, respiratory diseases,

F I S C A L Y E A R 2 0 1 5 A G E N C Y F I N A N C I A L R E P O R T
U . S . D E P A R T M E N T O F A G R I C U L T U R E 1 3 9
reproductive and neonatal diseases, enteric diseases, parasitic diseases, and transmissible
spongiform encephalopathies.
Crop Protection
ARS’ Crop Protection research program is directed to protect crops from insect and disease loss
through research to understand pest and disease transmission mechanisms, and to identify and
apply new technologies that increase our understanding of virulence factors and host defense
mechanisms. The program’s research priorities include: identification of genes that convey
virulence traits in pathogens and pests; factors that modulate infectivity, gene functions, and
mechanisms; genetic profiles that provide specified levels of disease and insect resistance under
field conditions; and mechanisms that reduce the spread of pests and infectious diseases. ARS is
developing new knowledge and integrated pest management approaches to control pest and
disease outbreaks as they occur. Its research will improve the knowledge and understanding of
the ecology, physiology, epidemiology, and molecular biology of emerging diseases and pests.
This knowledge will be incorporated into pest risk assessments and management strategies to
minimize chemical inputs and increase production. Strategies and approaches will be available to
producers to control emerging crop diseases and pest outbreaks and to address quarantine issues.
Human Nutrition
Maintenance of health throughout the lifespan along with prevention of obesity and chronic
diseases via food-based recommendations are the major emphases of ARS’ Human Nutrition
Research Program. These health-related goals are based on the knowledge that deficiency
diseases are no longer the primary public health concerns in the U.S. Excessive consumption has
become the primary nutrition problem in the American population. This is reflected by increased
emphasis on prevention of obesity, from basic science through intervention studies to
assessments of large populations. The agency’s research program also studies essential nutrients
and nonessential, health promoting components in foods. Four specific areas of research are
emphasized: nutrition monitoring; the scientific basis for dietary recommendations; prevention of
obesity and related diseases; and life stage nutrition and metabolism, in order to better define the
role of nutrition in pregnancy and growth of children, and for healthier aging.
NATIONAL INSTITUTE OF FOOD AND AGRICULTURE (NIFA)
NIFA participates in a nationwide land-grant university system of agriculture related research
and program planning and coordination between State institutions and USDA. It assists in
maintaining cooperation among the State institutions, and between the State institutions and their
Federal research partners. NIFA administers competitive grants and capacity/formula payments
to State institutions to leverage State and local funding for agriculture research.
FOREST SERVICE (FS)
Forest Service R&D has an integrated portfolio that supports achievement of the agency’s
strategic goals. The FS R&D structure has two components: Priority Research Areas and
Strategic Program Areas (SPAs).

S E C T I O N I I | F I N A N C I A L I N F O R M A T I O N
1 4 0 C R E A T I N G A U S D A F O R T H E 2 1 S T C E N T U R Y
The Priority Research Areas address urgent needs in seven areas: Forest Disturbances, Forest
Inventory and Analysis, Watershed Management and Restoration, Bioenergy and Biobased
Products, Urban Natural Resources Stewardship, Nanotechnology, and Localized Needs
Research.
The SPAs are the long-term programs from which Priority Research Areas are funded; the SPAs
are:
Wildland Fire and Fuels
R&D provides managers with the knowledge and tools to reduce negative impacts, while
enhancing the beneficial effects of wildland fire, as a natural process. This knowledge and these
tools are critical to understanding the human process of fire and fuels management on society
and the environment.
Research focuses on understanding and modeling fundamental fire processes; interactions of fire
with ecosystems; and the environmental, social, and economic aspects of fire, as well as
evaluating the integrated management strategies and disturbance interactions at multiple scales
and the application of fire research to address management problems.
Invasive Species
R&D provides the scientific information, methods, and technology to reduce or eliminate the
introduction, spread, and impact of invasive species and to restore or improve the functionality of
ecosystems affected by invasive species.
Research focuses on non-native plants, animals, fish, insects, diseases, invertebrates, and other
species whose introduction is likely to cause economic or environmental harm to an ecosystem.
Water, Air, and Soil
R&D enables the sustainable management of these essential resources by providing clear air and
safe drinking water, by protecting lives and property from wildfire and smoke, and by adapting
to climate variability and change.
The program features ecosystem services with a high level of integration between water, air, and
soil research, such as the effects of climate variability and change on water budgets or carbon
sequestration metrics from an ecosystem perspective.
Wildlife and Fish
R&D relies upon interdisciplinary research to inform policy initiatives affecting wildlife and fish
habitat on private and public lands, and the recovery of threatened or endangered species.
Scientists investigate the complex interactions among species, ecosystem dynamics and
processes, land use and management, and any emerging broadscale threats, including global
climate change, loss of open space, invasive species, and disease.

F I S C A L Y E A R 2 0 1 5 A G E N C Y F I N A N C I A L R E P O R T
U . S . D E P A R T M E N T O F A G R I C U L T U R E 1 4 1
Resource Management and Use
R&D provides the scientific and technology base to sustainably manage and use forest resources
and forest fiber-based products.
Research focuses on the plant sciences, soil sciences, social sciences, silviculture, productivity,
forest and range ecology management, harvesting and operations, forest and biomass products
and utilization, economics, urban forestry, and climate change.
Outdoor Recreation
R&D promotes human and ecological sustainability by researching environmental management,
activities, and experiences that connect people with the natural world.
Research in outdoor recreation is interdisciplinary, focusing on nature-based recreation and the
changing trends in American society; connections between recreation visitors, communities, and
the environment; human benefits and consequences of recreation and nature contact; the
effectiveness of recreation management and decision-making; and sustaining ecosystems
affected by recreational use.
Inventory and Monitoring
R&D provides the resource data, analysis, and tools needed to monitor forest ecosystems
vulnerable to rapid change due to threats from fire, insects, disease, natural processes, or
management actions. From their research, scientists determine the status and trend of the health
of the Nation’s forests and grasslands, and the potential impact from climate change.
Their research integrates the development and use of science, technology, and remotely sensed
data to better understand the incidences of forest fragmentation over time from changes in land
use or from insects, disease, fire, and extreme weather events.
A representative summary of FY 2015 accomplishments include the following:
48 new interagency agreements and contracts
13 interagency agreements and contracts continued
2,017 articles published in journals
357 articles published in all other publications
9 patents granted
ECONOMIC RESEARCH SERVICE (ERS)
ERS provides economic and other social science research and analysis for public and private
decisions on agriculture, food, natural resources, and rural America. Research results and
economic indicators on these important issues are fully disseminated through published and
electronic reports and articles, special staff analyses, briefings, presentations and papers,
databases, and individual contacts. ERS’ objective information and analysis helps public and
S E C T I O N I I | F I N A N C I A L I N F O R M A T I O N
1 4 2 C R E A T I N G A U S D A F O R T H E 2 1 S T C E N T U R Y
private decision makers attain the goals that promote agricultural competitiveness, food safety
and security, a well-nourished population, environmental quality, and a sustainable rural
economy.
NATIONAL AGRICULTURAL STATISTICS SERVICE (NASS)
Research is conducted to improve the statistical methods and related technologies used to
produce U.S. agricultural statistics. The research agenda has two primary areas of emphasis: the
National Agricultural Statistics Service estimation program and the Census of Agriculture
program. For each, the goal is the development of improved estimates at lower cost, with
reduced respondent burden, and with valid measures of uncertainty. All facets of the estimation
process are considered, from increasing efficiencies in sampling and data collection to enhancing
the statistical methodology used to analyze the data. Two high priority items within the research
effort are significance editing (cleaning of respondent data) and model-based estimates.
Significance editing has the potential to enhance the quality of survey data and to reduce manual
operations in preparing survey responses summaries. Model-based estimates are used to combine
data from disparate sources, from sample surveys to remote sensing, resulting in improved
estimates with valid measures of uncertainty. Going forward, users of NASS services and
products will be increasingly dependent upon methodological and technological efficiencies.

F I S C A L Y E A R 2 0 1 5 A G E N C Y F I N A N C I A L R E P O R T
U . S . D E P A R T M E N T O F A G R I C U L T U R E 1 4 3
Required Supplementary Information
Deferred Maintenance and Repairs (Unaudited)
The Forest Service is steward to nearly 193 million acres of national forests and grasslands
within the NFS. On these NFS lands, the agency manages major assets that are categorized as
general PP&E, including nearly 40,000 administrative, recreation, and research buildings and
approximately 26,750 recreational sites, such as campgrounds, picnic areas, trailheads, and
interpretive sites.
Across the NFS, the agency also manages over 371,000 miles of roads, of which 65,000 miles
are for passenger vehicles; over 157,000 miles of trails for motorized and non-motorized use;
nearly 13,000 road and trail bridges; and over 1,700 Forest Service-owned and Special
Use-Permitted dam structures.
ARS owns/manages approximately 15 million gross square feet of facility space in 3,000
buildings on 400,000 acres of land. APHIS operates approximately 28 facilities, which includes
378 buildings,in the United States and 14 facilities/buildings internationally. The NRCS portfolio
of owned assets encompasses 29 sites, including 13 parcels of owned land, 260 buildings, and
about 250 other structures.
Deferred Maintenance & Repairs (DM&R) estimates include capitalized PP&E, non-capitalized
heritage assets, and non-capitalized or fully depreciated PP&E.
No DM&R is reported for stewardship land because land is considered to be in acceptable
condition unless an environmental contamination or liability is identified and the land cannot be
used for its intended purpose. Stewardship land easements are excluded from DM&R since
ownership is retained by the landowner.
DEFINING AND IMPLEMENTING MAINTENANCE AND REPAIRS POLICIES IN PRACTICE
The Forest Service uses condition surveys to estimate DM&R on all major classes of its PP&E
and heritage assets. DM&R estimates for most assets—except bridges—are based on condition
surveys performed on a 5-year maximum revolving schedule. The bridge class is on a 2-year
maximum revolving schedule. The agency’s DM&R for NFS passenger-car roads is determined
annually—from random sample surveys—providing an 80-percent level of confidence. DM&R
is not reported for roads that are not part of the passenger-car system.
ARS, APHIS, and NRCS use similar condition surveys to estimate DM&R on all major classes
of its PP&E and heritage assets.

S E C T I O N I I | F I N A N C I A L I N F O R M A T I O N
1 4 4 C R E A T I N G A U S D A F O R T H E 2 1 S T C E N T U R Y
RANKING AND PRIORITIZING MAINTENANCE AND REPAIRS ACTIVITIES
Maintenance and repair activities are prioritized based on condition surveys and ranked based on
PP&E and heritage assets that pose serious threats to public health or safety, a natural resource,
or to the ability of the agency to implement its mission.
FACTORS CONSIDERED IN SETTING ACCEPTABLE CONDITION
The standards for acceptable operating condition for various classes of PP&E and heritage assets
are as follows:
Conditions of roads and bridges within the NFS road system are measured by various standards:
Federal Highway Administration regulations for the Federal Highway Safety Act.
Best management practices for the nonpoint source provisions of the Clean Water Act from
U.S. Environmental Protection Agency and States.
Road management objectives developed through the National Forest Management Act
forest planning process.
Forest Service directives—Forest Service Manual (FSM) 7730, Operation and Maintenance
(August 25, 2005, amendment was superseded with October 1, 2008, revision); Forest
Service Handbook (FSH) 7709.56a, Road Preconstruction, and FSH 7709.56b,
Transportation Structures Handbook.
Dams are managed according to FSM 7500, Water Storage and Transmission, and FSH 7509.11,
Dams Management Handbook. The condition of a dam is acceptable when the dam meets current
design standards and does not have any deficiencies that threaten the safety of the structure or
public. For dams to be rated in acceptable condition, the agency needs to restore the dams to the
original functional purpose, correct unsightly conditions, or prevent more costly repairs.
Buildings shall comply with the International Family of Building and Related Codes, the
National Fire Protection Association Life Safety Code, the Forest Service Health and Safety
Handbook, and the Occupational Safety Health Administration as determined by condition
surveys and safety inspections. These requirements are found in FSM 7310, Buildings and
Related Facilities, revised November 19, 2004.
Recreation facilities are located within recreation sites that range from highly developed sites to
general forest areas such as campgrounds, trailheads, trails, water and wastewater systems,
interpretive facilities, and visitor centers. Recreation sites are managed in accordance with
Federal laws and regulations (Code of Federal Regulations [CFR] 36).
Detailed management guidelines are contained in FSM 2330, Publicly Managed Recreation
Opportunities, and forest- and regional-level user guides. Quality standards for developed
recreation sites were established as Meaningful Measures for health and cleanliness, settings,
safety and security, responsiveness, and the condition of the facility.

F I S C A L Y E A R 2 0 1 5 A G E N C Y F I N A N C I A L R E P O R T
U . S . D E P A R T M E N T O F A G R I C U L T U R E 1 4 5
The condition assessment for range structures (fences and stock handling facilities) is based on
(1) a determination by knowledgeable range specialists or other district personnel of whether the
structure would perform the originally intended function and (2) a determination through the use
of a protocol system to assess conditions based on age. A long-standing range methodology is
used to gather this data.
Trails and trail bridges are managed according to Federal law and regulations (CFR 36). More
specific direction is contained in FSM 2350, Trail, River, and Similar Recreation Opportunities,
and the FSH 2309.18, Trails Management Handbook.
DM&R of structures for wildlife, fish, and threatened and endangered species is determined by
field biologists using their professional judgment. The DM&R is considered critical if resource
damage or species endangerment would likely occur if maintenance were deferred much longer.
ARS, APHIS, and NRCS define acceptable condition in accordance with standards comparable
to those used in private industry for buildings and other structures.
DEFERRED MAINTENANCE AND REPAIR COSTS
`FY 2015
Ending Balance
FY 2015
Beginning Balance
Asset Category
General PP&E 5,584$ 5,467$ Heritage Assets 130 127
Total 5,714$ 5,594$

S E C T I O N I I | F I N A N C I A L I N F O R M A T I O N
1 4 6 C R E A T I N G A U S D A F O R T H E 2 1 S T C E N T U R Y
Statement of Budgetary Resources (Unaudited)
FY 2015 FSA CCC FAS RMA FNS FSIS AMS APHIS GIPSA
Non-Budgetary Non-BudgetaryFinancing Financing
Budgetary Accounts Budgetary Accounts Budgetary Budgetary Budgetary Budgetary Budgetary Budgetary Budgetary
Budgetary Resources:Unobligated balance, brought forward, October 1: 471$ 965$ 991$ 283$ 337$ 571$ 29,250$ 116$ 153$ 551$ 22$ Recoveries of prior year unpaid obligations 50 101 2,953 14 32 1 1,406 18 23 31 2 Other changes in unobligated balance (+ or -) (82) (880) (23) (115) (4) - (947) (8) (5) (8) - Unobligated balance from prior year budget authority, net 439 186 3,921 182 365 572 29,709 126 171 574 24 Appropriations (discretionary and mandatory) 1,783 - 1,632 - 375 7,850 110,369 1,031 1,173 2,115 43 Borrowing authority (discretionary and mandatory) - 3,367 6,794 222 - - - - - - - Spending authority from offsetting collections (discretionary and mandatory) 451 1,635 37 168 134 3,487 81 201 108 196 65 Total budgetary resources 2,673 5,188 12,384 572 874 11,909 140,159 1,358 1,452 2,885 132
Status of Budgetary Resources:Obligations Incurred (Note 23) 2,272 3,043 11,786 393 358 11,336 105,870 1,214 1,300 2,212 100 Unobligated balance, end of year:Apportioned 286 1,494 104 64 281 571 4,294 127 138 614 28 Exempt from apportionment - - 167 3 - - - - - - - Unapportioned 116 651 327 112 235 2 29,994 17 14 59 4 Total unobligated balance, end of year 402 2,145 598 179 516 573 34,288 144 152 673 32 Total budgetary resources 2,674 5,188 12,384 572 874 11,909 140,158 1,358 1,452 2,885 132
Change in Obligated Balances:Unpaid obligations:Unpaid obligations, brought forward, October 1 394 446 10,579 136 439 2,228 8,533 135 540 397 13 Obligations incurred 2,272 3,043 11,786 393 358 11,336 105,870 1,214 1,300 2,212 100 Outlays (gross)(-) (2,197) (2,916) (14,124) (382) (354) (10,839) (104,017) (1,201) (1,172) (1,891) (97) Recoveries of prior year unpaid obligations (-) (50) (101) (2,953) (14) (32) (1) (1,406) (18) (23) (31) (2) Unpaid obligations, end of year 419 472 5,288 133 411 2,724 8,980 130 645 687 14 Uncollected payments:Uncollected payments, Federal sources, brought forward, October 1 (-) (43) (14) (17) - (290) - 1 (49) (22) (226) (9) Change in uncollected payments, Federal sources (+ or -) (17) 3 17 - (33) - (2) 10 1 (16) 1 Uncollected payments, Federal sources, end of year (-) (60) (11) - - (323) - (1) (39) (21) (242) (8) Memorandum (non-add) entries:Obligated balance, start of year (+ or -) 351 432 10,562 136 149 2,228 8,534 86 518 171 4 Obligated balance, end of year (+ or -) 359 461 5,288 133 88 2,724 8,979 91 624 445 6
Budget Authority and Outlays, Net Budget authority, gross (discretionary and mandatory) 2,234 5,002 8,463 390 509 11,337 110,450 1,232 1,281 2,311 108 Actual offsetting collections (-) (discretionary and mandatory) (518) (1,962) (6,039) (414) (101) (3,489) (79) (211) (109) (180) (66) Change in uncollected customer payments from Federal sources (17) 3 17 - (33) - (2) 10 1 (16) 1 (discretionary and mandatory)Anticipated offsetting collections (+ or -) (discretionary and mandatory) - - - - - - - - - - - Budget authority, net (discretionary and mandatory) 1,699 3,043 2,441 (24) 375 7,848 110,369 1,031 1,173 2,115 43
Outlays, gross (discretionary and mandatory) 2,197 2,916 14,124 382 354 10,839 104,017 1,201 1,172 1,891 97 Actual offsetting collections (discretionary and mandatory) (-) (518) (1,962) (6,039) (414) (101) (3,489) (79) (211) (109) (180) (66) Outlays, net (discretionary and mandatory) 1,679 954 8,085 (32) 253 7,350 103,938 990 1,063 1,711 31 Distributed offsetting receipts (-) (1) (407) 4 (135) - - - (15) (155) (7) - Agency outlays, net (discretionary and mandatory) 1,678$ 547$ 8,089$ (167)$ 253$ 7,350$ 103,938$ 975$ 908$ 1,704$ 31$

F I S C A L Y E A R 2 0 1 5 A G E N C Y F I N A N C I A L R E P O R T
U . S . D E P A R T M E N T O F A G R I C U L T U R E 1 4 7
FY 2015 FS NRCS ARS NIFA ERS NASS RD DO TOTAL
Non-Budgetary Non-BudgetaryFinancing Financing
Budgetary Budgetary Budgetary Budgetary Budgetary Budgetary Budgetary Accounts Budgetary Budgetary Accounts
Budgetary Resources:Unobligated balance, brought forward, October 1: 1,679$ 3,550$ 85$ 430$ 2$ 1$ 6,498$ 8,373$ 227$ 44,934$ 9,621$ Recoveries of prior year unpaid obligations 273 364 36 74 6 21 255 2,804 13 5,558 2,919 Other changes in unobligated balance (+ or -) (26) (33) (3) (43) (1) - (698) (4,491) (14) (1,895) (5,486) Unobligated balance from prior year budget authority, net 1,926 3,881 118 461 7 22 6,055 6,686 226 48,597 7,054 Appropriations (discretionary and mandatory) 5,738 4,125 1,206 1,418 85 172 5,299 2 381 144,795 2 Borrowing authority (discretionary and mandatory) - - - - - - - 8,879 - 6,794 12,468 Spending authority from offsetting collections (discretionary and mandatory) 814 237 141 35 7 23 2,526 10,621 1,027 9,570 12,424 Total budgetary resources 8,478 8,243 1,465 1,914 99 217 13,880 26,188 1,634 209,756 31,948
Status of Budgetary Resources:Obligations Incurred (Note 23) 7,247 4,093 1,330 1,498 95 216 7,735 14,716 1,418 160,080 18,152 Unobligated balance, end of year:Apportioned 775 1,808 97 484 - 1 3,927 8,324 166 13,701 9,882 Exempt from apportionment - - - - - - - - - 167 3 Unapportioned 456 2,342 38 (68) 4 - 2,218 3,148 50 35,808 3,911 Total unobligated balance, end of year 1,231 4,150 135 416 4 1 6,145 11,472 216 49,676 13,796 Total budgetary resources 8,478 8,243 1,465 1,914 99 217 13,880 26,188 1,634 209,756 31,948
Change in Obligated Balances:Unpaid obligations:Unpaid obligations, brought forward, October 1 2,341 4,495 460 1,926 34 48 4,359 22,483 485 37,406 23,065 Obligations incurred 7,247 4,093 1,330 1,498 95 216 7,735 14,716 1,418 160,080 18,152 Outlays (gross)(-) (6,748) (3,723) (1,286) (1,379) (79) (198) (8,094) (14,111) (1,441) (158,840) (17,409) Recoveries of prior year unpaid obligations (-) (273) (364) (36) (74) (6) (21) (255) (2,804) (13) (5,558) (2,919) Unpaid obligations, end of year 2,567 4,501 468 1,971 44 45 3,745 20,284 449 33,088 20,889 Uncollected payments:Uncollected payments, Federal sources, brought forward, October 1 (-) (613) (193) (194) (83) (10) (18) (11) (641) (362) (2,139) (655) Change in uncollected payments, Federal sources (+ or -) 13 (13) 29 14 (2) 3 1 79 55 61 82 Uncollected payments, Federal sources, end of year (-) (600) (206) (165) (69) (12) (15) (10) (562) (307) (2,078) (573) Memorandum (non-add) entries:Obligated balance, start of year (+ or -) 1,728 4,302 266 1,843 24 30 4,348 21,842 123 35,267 22,410 Obligated balance, end of year (+ or -) 1,967 4,295 303 1,902 32 30 3,735 19,722 142 31,010 20,316
Budget Authority and Outlays, Net Budget authority, gross (discretionary and mandatory) 6,552 4,362 1,347 1,453 92 195 7,825 19,502 1,408 161,159 24,894 Actual offsetting collections (-) (discretionary and mandatory) (826) (225) (170) (49) (4) (25) (3,739) (16,428) (1,084) (16,914) (18,804) Change in uncollected customer payments from Federal sources 13 (13) 29 14 (2) 3 1 79 55 61 82 (discretionary and mandatory)Anticipated offsetting collections (+ or -) (discretionary and mandatory) - - - - - - - - - - - Budget authority, net (discretionary and mandatory) 5,739 4,124 1,206 1,418 86 173 4,087 3,153 379 144,306 6,172
Outlays, gross (discretionary and mandatory) 6,748 3,723 1,286 1,379 79 198 8,094 14,111 1,441 158,840 17,409 Actual offsetting collections (discretionary and mandatory) (-) (826) (225) (170) (49) (4) (25) (3,739) (16,428) (1,084) (16,914) (18,804) Outlays, net (discretionary and mandatory) 5,922 3,498 1,116 1,330 75 173 4,355 (2,317) 357 141,926 (1,395) Distributed offsetting receipts (-) (701) (2) (31) (5) - - - (1,344) (35) (948) (1,886) Agency outlays, net (discretionary and mandatory) 5,221$ 3,496$ 1,085$ 1,325$ 75$ 173$ 4,355$ (3,661)$ 322$ 140,978$ (3,281)$

S E C T I O N I I | F I N A N C I A L I N F O R M A T I O N
1 4 8 C R E A T I N G A U S D A F O R T H E 2 1 S T C E N T U R Y
FY 2014 FSA CCC FAS RMA FNS FSIS AMS APHIS GIPSA
Non-Budgetary Non-BudgetaryFinancing Financing
Budgetary Accounts Budgetary Accounts Budgetary Budgetary Budgetary Budgetary Budgetary Budgetary Budgetary
Budgetary Resources:Unobligated balance, brought forward, October 1: 480$ 618$ 1,066$ 376$ 474$ 568$ 20,210$ 75$ 140$ 454$ 17$ Recoveries of prior year unpaid obligations 40 83 393 48 75 6 1,011 8 15 29 1 Other changes in unobligated balance (+ or -) (51) (540) (36) (138) (62) (1) (1,902) (7) (7) (6) (1) Unobligated balance from prior year budget authority, net 469 161 1,423 286 487 573 19,319 76 148 477 17 Appropriations (discretionary and mandatory) 1,824 - 2,833 - 374 8,828 114,563 1,024 1,145 1,158 37 Borrowing authority (discretionary and mandatory) 32 3,373 14,616 209 - - - - - - - Spending authority from offsetting collections (discretionary and mandatory) 397 134 (92) 104 81 4,038 154 193 107 201 62 Total budgetary resources 2,722 3,668 18,780 599 942 13,439 134,036 1,293 1,400 1,836 116
Status of Budgetary Resources:Obligations Incurred (Note 23) 2,251 2,703 17,789 316 605 12,868 104,786 1,177 1,247 1,285 94 Unobligated balance, end of year:Apportioned 339 195 312 96 162 569 11,033 98 143 507 18 Exempt from apportionment - - 195 8 - - - - - - - Unapportioned 132 770 484 179 175 2 18,217 18 10 44 4 Total unobligated balance, end of year 471 965 991 283 337 571 29,250 116 153 551 22 Total budgetary resources 2,722 3,668 18,780 599 942 13,439 134,036 1,293 1,400 1,836 116
Change in Obligated Balances:Unpaid obligations:Unpaid obligations, brought forward, October 1 327 259 11,597 209 296 1,716 7,238 137 214 357 10 Obligations incurred 2,251 2,703 17,789 316 605 12,868 104,786 1,177 1,247 1,285 94 Outlays (gross)(-) (2,144) (2,433) (18,414) (341) (388) (12,351) (102,480) (1,170) (905) (1,216) (90) Recoveries of prior year unpaid obligations (-) (40) (83) (393) (48) (75) (6) (1,011) (8) (15) (29) (1) Unpaid obligations, end of year 394 446 10,579 136 439 2,228 8,533 135 540 397 13 Uncollected payments: - - - - - - - - - - - Uncollected payments, Federal sources, brought forward, October 1 (-) (41) (12) (48) (157) (386) - - (45) (18) (208) (7) Change in uncollected payments, Federal sources (+ or -) (2) (2) 31 157 96 - 1 (4) (4) (18) (2) Uncollected payments, Federal sources, end of year (-) (43) (14) (17) - (290) - 1 (49) (22) (226) (9) Memorandum (non-add) entries: - - - - - - - - - - - Obligated balance, start of year (+ or -) 286 247 11,549 52 (90) 1,716 7,238 92 196 149 3 Obligated balance, end of year (+ or -) 351 432 10,562 136 149 2,228 8,534 86 518 171 4
Budget Authority and Outlays, Net - - - - - - - - - - - Budget authority, gross (discretionary and mandatory) 2,253 3,507 17,357 313 455 12,866 114,717 1,217 1,252 1,359 99 Actual offsetting collections (-) (discretionary and mandatory) (505) (1,939) (5,118) (537) (177) (4,039) (154) (190) (103) (182) (60) Change in uncollected customer payments from Federal sources (2) (2) 31 157 96 - 1 (4) (4) (18) (2) (discretionary and mandatory)Anticipated offsetting collections (+ or -) (discretionary and mandatory) - - - - - - - - - - - Budget authority, net (discretionary and mandatory) 1,746 1,566 12,270 (67) 374 8,827 114,564 1,023 1,145 1,159 37
Outlays, gross (discretionary and mandatory) 2,144 2,433 18,414 341 388 12,351 102,480 1,170 905 1,216 90 Actual offsetting collections (discretionary and mandatory) (-) (505) (1,939) (5,118) (537) (177) (4,039) (154) (190) (103) (182) (60) Outlays, net (discretionary and mandatory) 1,639 494 13,296 (196) 211 8,312 102,326 980 802 1,034 30 Distributed offsetting receipts (-) (4) (168) - (74) (9) - (3) (13) (161) (7) - Agency outlays, net (discretionary and mandatory) 1,635$ 326$ 13,296$ (270)$ 202$ 8,312$ 102,323$ 967$ 641$ 1,027$ 30$

F I S C A L Y E A R 2 0 1 5 A G E N C Y F I N A N C I A L R E P O R T
U . S . D E P A R T M E N T O F A G R I C U L T U R E 1 4 9
FY 2014 FS NRCS ARS NIFA ERS NASS RD DO TOTAL
Non-Budgetary Non-BudgetaryFinancing Financing
Budgetary Budgetary Budgetary Budgetary Budgetary Budgetary Budgetary Accounts Budgetary Budgetary Accounts
Budgetary Resources:Unobligated balance, brought forward, October 1: 1,087$ 3,051$ 61$ 295$ 1$ 1$ 5,483$ 7,764$ 268$ 33,731$ 8,758$ Recoveries of prior year unpaid obligations 273 470 38 53 2 10 209 1,135 22 2,655 1,266 Other changes in unobligated balance (+ or -) (10) (11) (5) (35) - - (378) (4,134) (8) (2,520) (4,812) Unobligated balance from prior year budget authority, net 1,350 3,510 94 313 3 11 5,314 4,765 282 33,866 5,212 Appropriations (discretionary and mandatory) 6,312 4,270 1,151 1,451 78 162 5,422 21 521 151,153 21 Borrowing authority (discretionary and mandatory) - - - - - - - 7,122 - 14,648 10,704 Spending authority from offsetting collections (discretionary and mandatory) 662 25 164 50 6 32 3,399 8,252 1,022 10,501 8,490 Total budgetary resources 8,324 7,805 1,409 1,814 87 205 14,135 20,160 1,825 210,168 24,427
Status of Budgetary Resources:Obligations Incurred (Note 23) 6,645 4,255 1,324 1,384 85 204 7,637 11,787 1,598 165,234 14,806 Unobligated balance, end of year:Apportioned 1,317 928 43 481 1 - 3,836 5,231 179 19,966 5,522 Exempt from apportionment - - - - - - - - - 195 8 Unapportioned 362 2,622 42 (51) 1 1 2,662 3,142 48 24,773 4,091 Total unobligated balance, end of year 1,679 3,550 85 430 2 1 6,498 8,373 227 44,934 9,621 Total budgetary resources 8,324 7,805 1,409 1,814 87 205 14,135 20,160 1,825 210,168 24,427
Change in Obligated Balances:Unpaid obligations:Unpaid obligations, brought forward, October 1 2,352 4,424 391 1,995 31 37 4,722 24,541 416 36,260 25,009 Obligations incurred 6,645 4,255 1,324 1,384 85 204 7,637 11,787 1,598 165,234 14,806 Outlays (gross)(-) (6,383) (3,714) (1,218) (1,400) (81) (183) (7,791) (12,710) (1,505) (161,433) (15,484) Recoveries of prior year unpaid obligations (-) (273) (470) (38) (53) (2) (10) (209) (1,135) (22) (2,655) (1,266) Unpaid obligations, end of year 2,341 4,495 460 1,926 34 48 4,359 22,483 485 37,406 23,065 Uncollected payments: - - - - - - - - - - - Uncollected payments, Federal sources, brought forward, October 1 (-) (459) (238) (183) (102) (8) (9) (20) (743) (395) (2,167) (912) Change in uncollected payments, Federal sources (+ or -) (154) 45 (11) 19 (2) (9) 9 102 33 28 257 Uncollected payments, Federal sources, end of year (-) (613) (193) (194) (83) (10) (18) (11) (641) (362) (2,139) (655) Memorandum (non-add) entries: - - - - - - - - - - - Obligated balance, start of year (+ or -) 1,893 4,186 208 1,893 23 28 4,702 23,798 21 34,093 24,097 Obligated balance, end of year (+ or -) 1,728 4,302 266 1,843 24 30 4,348 21,842 123 35,267 22,410
Budget Authority and Outlays, Net - - - - - - - - - - - Budget authority, gross (discretionary and mandatory) 6,974 4,295 1,315 1,501 84 194 8,821 15,395 1,543 176,302 19,215 Actual offsetting collections (-) (discretionary and mandatory) (507) (69) (153) (70) (4) (23) (4,669) (10,666) (1,056) (17,079) (13,142) Change in uncollected customer payments from Federal sources (154) 45 (11) 19 (2) (9) 9 102 33 28 257 (discretionary and mandatory)Anticipated offsetting collections (+ or -) (discretionary and mandatory) - - - - - - - - - - - Budget authority, net (discretionary and mandatory) 6,313 4,271 1,151 1,450 78 162 4,161 4,831 520 159,251 6,330
Outlays, gross (discretionary and mandatory) 6,383 3,714 1,218 1,400 81 183 7,791 12,710 1,505 161,433 15,484 Actual offsetting collections (discretionary and mandatory) (-) (507) (69) (153) (70) (4) (23) (4,669) (10,666) (1,056) (17,079) (13,142) Outlays, net (discretionary and mandatory) 5,876 3,645 1,065 1,330 77 160 3,122 2,044 449 144,354 2,342 Distributed offsetting receipts (-) (704) - (29) (5) - 3 - (1,380) 21 (911) (1,622) Agency outlays, net (discretionary and mandatory) 5,172$ 3,645$ 1,036$ 1,325$ 77$ 163$ 3,122$ 664$ 470$ 143,443$ 720$

S E C T I O N I I | F I N A N C I A L I N F O R M A T I O N
1 5 0 C R E A T I N G A U S D A F O R T H E 2 1 S T C E N T U R Y
Risk Assumed Information (Unaudited) Risk assumed is generally measured by the present value of unpaid expected losses net of
associated premiums based on the risk inherent in the insurance or guarantee coverage in force.
Risk assumed information is in addition to the liability for unpaid claims from insured events
that have already occurred. The assessment of losses expected based on the risk assumed are
based on actuarial or financial methods applicable to the economic, legal and policy environment
in force at the time the assessments are made. The FCIC has estimated the loss amounts based on
the risk assumed for its programs to be $7,642 million and $7,640 million as of September 30,
2015 and 2014, respectively.

F I S C A L Y E A R 2 0 1 5 A G E N C Y F I N A N C I A L R E P O R T
U . S . D E P A R T M E N T O F A G R I C U L T U R E 1 5 1
Section III: Other Information
Schedule of Spending The Schedule of Spending (SOS) presents an overview of how and where agencies are spending
(i.e. obligating) money for the reporting period. The data used to populate this schedule is the
same underlying data used to populate the Statement of Budgetary Resources (SBR). The “Total
Amounts Agreed to be Spent”line item of the SOS should reconcile to the “Obligations Incurred”
line in the SBR. These amounts may not reconcile to USAspending.gov because the SOS and the
website have different reporting requirements.
For The Years Ended September 30, 2015 and 2014 (In Millions)
Non-budgetary Non-budgetary
Credit Reform Credit Reform
Budgetary Financing Accounts Budgetary Financing Accounts
What Money is Available to Spend?
Total Resources 209,756$ 31,948$ 210,168$ 24,427$
Less Amount Available but Not Agreed to be Spent 13,868 9,885 20,161 5,530
Less Amount Not Available to be Spent 35,808 3,911 24,773 4,091
Total Amounts Agreed to be Spent 160,080 18,152 165,234 14,806
How was the Money Spent/Issued?
Assist Rural Communities to Create Prosperity so They Are
Self-Sustaining, Repopulating, and Economically Thriving:
Personnel Compensation and Benefits 2,108 - 2,101 -
Travel and transportation 80 - 71 -
Rent, communications, and util ities 187 - 136 (1)
Other contractual services 4,843 2,801 4,361 2,013
Supplies and materials 399 - 341 -
Equipment, land, and structures 48 - 57 -
Investments and loans 7,751 9,918 4,434 8,033
Grants, subsidies, and contributions 6,299 - 16,313 -
Insurance claims and indemnities 8,711 - 10,685 -
Interest, dividends, and refunds 97 4,684 120 4,135
Other 46 - 56 -
Total 30,569 17,403 38,675 14,180
Ensure Our National Forests and Private Working Lands Are Conserved,
Restored, and Made More Resilient to Climate Change, While
Enhancing Our Water Resources:
Personnel Compensation and Benefits 4,368 - 4,257 -
Travel and transportation 238 - 221 -
Rent, communications, and util ities 346 - 333 -
Other contractual services 3,427 5 2,908 5
Supplies and materials 290 - 271 -
Equipment, land, and structures 418 - 446 -
Investments and loans - 431 - 412
Grants, subsidies, and contributions 4,999 - 5,147 -
Insurance claims and indemnities 19 - 12 -
Interest, dividends, and refunds (3) 141 (14) 83
Other 320 - 139 -
Total 14,422 577 13,720 500
2015 2014

S E C T I O N I I I | O T H E R I N F O R M A T I O N
1 5 2 C R E A T I N G A U S D A F O R T H E 2 1 S T C E N T U R Y
Schedule of Spending (continued)
For The Years Ended September 30, 2015 and 2014 (In Millions)
Non-budgetary Non-budgetary
Credit Reform Credit Reform
Budgetary Financing Accounts Budgetary Financing Accounts
Help America Promote Agricultural Production and Biotechnology
Exports as America Works to Increase Food Security:
Personnel Compensation and Benefits 184 - 189 -
Travel and transportation 9 - 9 -
Rent, communications, and util ities 16 - 13 -
Other contractual services 148 - 157 -
Supplies and materials 16 - 19 -
Equipment, land, and structures 13 - 12 -
Investments and loans 68 112 1 20
Grants, subsidies, and contributions 2,820 - 2,502 56
Insurance claims and indemnities 13 - 1 -
Interest, dividends, and refunds - 60 - 50
Other 21 - 23 -
Total 3,308 172 2,926 126
Ensure that All of America's Children Have Access to Safe,
Nutritious, and Balanced Meals:
Personnel Compensation and Benefits 2,108 - 2,144 -
Travel and transportation 108 - 87 -
Rent, communications, and util ities 136 - 81 -
Other contractual services 1,305 - 812 -
Supplies and materials 2,085 - 1,812 -
Equipment, land, and structures 72 - 81 -
Investments and loans - - - -
Grants, subsidies, and contributions 104,377 - 103,266 -
Insurance claims and indemnities 144 - 5 -
Interest, dividends, and refunds - - - -
Other 59 - 50 -
Total 110,394 - 108,338 -
Create a USDA for the 21st Century that is High Performing,
Efficient, and Adaptable:
Personnel Compensation and Benefits 518 - 509 -
Travel and transportation 12 - 11 -
Rent, communications, and util ities 139 - 290 -
Other contractual services 621 - 651 -
Supplies and materials 16 - 12 -
Equipment, land, and structures 65 - 90 -
Investments and loans - - - -
Grants, subsidies, and contributions 9 - 10 -
Insurance claims and indemnities 1 - - -
Interest, dividends, and refunds - - 1 -
Other 6 - 1 -
Total 1,387 - 1,575 -
USDA Total
Personnel Compensation and Benefits 9,286 - 9,200 -
Travel and transportation 447 - 399 -
Rent, communications, and util ities 824 - 853 (1)
Other contractual services 10,344 2,806 8,889 2,018
Supplies and materials 2,806 - 2,455 -
Equipment, land, and structures 616 - 686 -
Investments and loans 7,819 10,461 4,435 8,465
Grants, subsidies, and contributions 118,504 - 127,238 56
Insurance claims and indemnities 8,888 - 10,703 -
Interest, dividends, and refunds 94 4,885 107 4,268
Other 452 - 269 -
Total 160,080 18,152 165,234 14,806
Total Amounts Agreed to be Spent 160,080 18,152 165,234 14,806
Who did the Money go to?
Federal 11,222 6,562 11,259 5,649
Non-Federal 148,858 11,590 153,975 9,157
Total Amounts Agreed to be Spent 160,080 18,152 165,234 14,806

F I S C A L Y E A R 2 0 1 5 A G E N C Y F I N A N C I A L R E P O R T
U . S . D E P A R T M E N T O F A G R I C U L T U R E 1 5 3
Response to Management Challenges The Reports Consolidation Act of 2000 requires the U.S. Department of Agriculture (USDA)
Office of Inspector General (OIG) to report annually on the most serious management challenges
USDA and its agencies face. To identify these Departmental challenges, OIG examined
previously issued audit reports where corrective actions have yet to be taken. OIG also assessed
ongoing investigative and audit work to ascertain significant vulnerabilities, and analyzed new
programs and activities that could pose significant challenges due to their range and complexity.
This year, OIG has undertaken a significant revision of how they present the management
challenges. In an effort to provide the Secretary and other policymakers with a document that
responds more fully to their needs and explains more clearly how challenges are identified,
addressed, and resolved, OIG has consolidated the 11 challenges from the 2014 management
challenges into 7 challenges. While the issues USDA faces are much the same in 2015 as in
2014, instead of discussing those challenges as affecting individual agencies, OIG has expressed
them in terms of issues that cut across the entire Department.
The following narratives summarize:
OIG-recognized management challenges;
USDA’s fiscal year (FY) 2015 agency accomplishments; and
FY 2016 planned actions to address these management challenges.
Challenge 1: USDA Needs to Improve Oversight and Accountability for its Programs
In Challenge 1, OIG recognizes that USDA faces challenges in overseeing its many agencies and
programs. The Department employs nearly 100,000 employees in 17 agencies and 18 staff
offices; in total, these employees operate more than 300 programs that are responsible for
$144 billion in spending per year. USDA program managers face critical problems in overseeing
these programs so that every dollar spent accomplishes the results intended.
USDA managers are responsible for establishing an effective internal control system, ensuring
that a culture of compliance with those controls exists, and USDA managers holding employees
accountable for implementing those controls. Ultimately, as the Government Accountability
Office (GAO) has stated, “People are what make internal control work.” If management does not
emphasize those controls, the Federal programs will not function as intended.

S E C T I O N I I I | O T H E R I N F O R M A T I O N
1 5 4 C R E A T I N G A U S D A F O R T H E 2 1 S T C E N T U R Y
INTERNAL CONTROLS
Internal controls are the tools managers use to ensure that programs achieve intended results
efficiently and effectively; they provide for program integrity and proper stewardship of
resources. Managers must design effective internal systems for program implementation,
comprising the policies, procedures, and organizational structures that collectively determine
how a program is managed and how its requirements are met. Since systemic control flaws can
yield systemic program weaknesses—e.g., unrealized goals and improper payments—managers
must continuously assess and improve their internal control systems. When they identify a
widespread deficiency, they must fix the problem before it undermines the program.
OIG determined the following:
The Farm Service Agency’s (FSA) Modernize and Innovate the Delivery of Agricultural
Systems (MIDAS) information technology system was 2 years overdue and approximately
$140 million over budget;
The Food and Nutrition Service (FNS) could improve its controls over the Special
Supplemental Nutrition Program for Women, Infants, and Children (WIC) by ensuring that
State agencies take appropriate and timely corrective actions to reduce food costs;
USDA needs to strengthen its controls for fund transfers between programs; and
The Risk Management Agency (RMA) needs to design the Pasture, Rangeland, Forage
pilot program to better meet the needs of producers.
CORRECTIVE ACTIONS:
Farm Service Agency
Over the life of the MIDAS investment, USDA and FSA have identified and acknowledged that
there were, and continue to be, opportunities to strengthen Agency-alignment to improve IT
program oversight and investment management. FSA has taken active steps to address the issues
raised and identified. Since the first deployment of MIDAS functionality in April 2013, the
Agency has implemented organizational controls to bolster internal controls and enable increased
program governance and oversight. The Agency has engaged a third party assessor, MITRE, a
FFRDC non-profit technology consulting firm, to conduct an analysis of the current IT and
organizational capability and provide recommendations that will enable a better future
information technology service delivery model.
As part of FSA’s continuous, Agency-wide transformation and improvement efforts, and in
response to recommendations cited by OIG and GAO in recently published audit reports, FSA is
pursuing an enhanced, more comprehensive governance structure that will further support
increased rigor and adherence to defined program management processes. In accordance with
USDA’s Integrated IT Governance Framework, the FSA IRB has the responsibility to review

F I S C A L Y E A R 2 0 1 5 A G E N C Y F I N A N C I A L R E P O R T
U . S . D E P A R T M E N T O F A G R I C U L T U R E 1 5 5
and evaluate Agency IT investments, make decisions on spending, and monitor performance of
investments with a holistic, wide-lens focus on FSA program delivery.
FSA and MIDAS are committed to devoting time and resources to implement improvements in
oversight, accountability, and overall program management capability across the organization.
Improvements to governance, oversight, and accountability have already been implemented. In
March 2015, after more than 24 months of consistently being rated as medium to high risk,
MIDAS was rated “Green”, or moderate to low risk. MIDAS has since maintained this rating for
each consecutive month, illustrating the improvement in internal management, control, and
oversight that has resulted from the implementation of enhanced program governance and
management best practices.
These comprehensive efforts demonstrate FSA’s commitment to improved oversight and
accountability at all levels of the organization, specifically as related to the MIDAS program.
With this leadership in place, the Agency has enabled organizational alignment around holistic
improvements and a focus on quality that evidence FSA’s capability to properly manage and
deliver IT systems.
To provide better oversight to IT projects to ensure program dollars achieve their intended
results, FSA completed a corrective action plan for Capital Planning to guide the agency in
consistently establishing effective plans for future IT projects. FSA is evaluating the IT
governance structure to improve oversight and visibility. As part of this evaluation, FSA
reviewed and updated the charter for the FSA Investment Review Board (FSA IRB). FSA is in
the process of establishing an Enterprise Program Management Office (ePMO) with authority to
define and enforce project controls across the agency. As the ePMO ramps up, a project controls
gap analysis will be conducted, findings of which will be used as an input into the development
of an ePMO implementation plan. A comprehensive FSA Capital Planning and Investment
Control process will be defined and documented. FSA’s Software Development Lifecycle
(SDLC), to align with USDA Integrated IT Governance Framework (IITGF) including
appropriate decision gates, will be updated.
FSA will complete the realignment of the FSA Office of the Chief Information Officer (OCIO)
organization to support end-to-end portfolio, program, and project management. FSA will
incorporate project planning, management, and controls into FSA OCIO employee performance
plans, as appropriate, to drive accountability to the individual level. Additionally, FSA will
establish the FSA OCIO Human Capital Plan, including a strategy and approach to obtain and
develop resources with appropriate training, experience, and certifications to manage portfolios,
programs, and projects. Program Managers, with the appropriate certifications, will be assigned
for each active IT investment to ensure leadership with requisite skills is in place to effectively
manage their respective investments.
FSA will establish a revised requirements management approach, including requirements base
lining and change control. FSA will publish an FSA IT Program and Project Management
Guidebook, as well as complete the third-party independent analysis of the enterprise solution to
determine if the current enterprise solution provides the necessary functionality, and identify a

S E C T I O N I I I | O T H E R I N F O R M A T I O N
1 5 6 C R E A T I N G A U S D A F O R T H E 2 1 S T C E N T U R Y
proposed strategic direction for modernizing and ensuring the most cost-effective means for
delivery of IT Services in FSA’s dynamic program environment. FSA will execute the finalized
ePMO implementation plan, establish a Performance Measurement Program to continually
measure and assess performance, and implement annual customer satisfaction survey(s) covering
all IT investments in support of operational assessments.
FSA awarded a contract to bring in an independent assessor to determine if the current enterprise
solution provides the necessary functionality and is the most cost-effective modernization
solution. To synthesize activities and improvement measures conducted in FY 2015 with
ongoing and future activities for program management improvement, FSA will develop and
document a comprehensive improvement plan. This plan will delineate tactical steps, timelines,
and performance metrics to track incremental progress in adopting recognized best practices and
improving program management capabilities across the organization, and will enable continuous
review and assessment of implemented improvements. This plan will be developed in direct
alignment with the Office of Inspector General’s recommendation to obtain a non-USDA,
third-party independent assessment to determine if the current enterprise solution provides the
necessary functionality and is the most cost-effective modernization solution.
Food and Nutrition Service
During FY 2015, FNS published WIC Policy Memorandum 2015-6, “Promising Practices in
WIC Food Cost Containment”. Through this guidance, FNS shared with WIC State agencies
some of the food cost containment practices that show promise for reducing State agencies’ WIC
food costs in two key areas: (1) vendor management; and (2) selection and authorization of
supplemental foods (i.e., creation of an authorized product list [APL]). In addition, through this
guidance, FNS requested from all WIC State agencies an analysis of implementing available cost
containment measures to reduce food costs.
WIC is currently participating in the FNS collaborative Standard Operating Procedures (SOP)
workgroup for tracking and resolving management evaluations (MEs). The SOP will include
established deadlines for the correction of deficiencies identified in MEs, how often FNS will
follow up with State agencies, the type of work performed, and the enforcement actions FNS will
take if the deadlines are missed. In addition, FNS will continue to issue fiscal claims against
improper payments as these payments are identified.
WIC is also in the process of developing a suite of technical assistance materials to include a
vendor management handbook, periodic webinars, and targeted technical assistance protocols as
part of the National Cost Containment Strategy.
FNS has been working with the Economic Research Service (ERS) on its update of the 2005
Report, Interstate Variation in WIC Food Package Costs: The Role of Food Prices, Caseload
Composition, and Cost-Containment Practices. This study examines the degree to which food
prices, caseloads, and the implementation of various cost containment measures influence in
State agencies’ food package costs. The study is underway, and ERS informed FNS that a draft
report would be published in September 2015.

F I S C A L Y E A R 2 0 1 5 A G E N C Y F I N A N C I A L R E P O R T
U . S . D E P A R T M E N T O F A G R I C U L T U R E 1 5 7
Department-wide
USDA has strengthened its system for approving, reviewing, and tracking appropriated fund
transfers. OCFO issued Departmental Regulation (DR) 2235-001 entitled "Economy Act
Agreements" and DR 2236-001 entitled "Shared Cost Programs" top provide policy guidance on
transfer of funds. In January 2015, the Office of the Chief Financial Officer (OCFO) provided
Interagency Agreement training on the Economy Act, Working Capital, and Shared Cost
Programs to all agency CFOs. This training was later expanded with a second round of training
to staff offices that execute interagency agreements. The training was evaluated with high marks,
was recorded, and put into AgLearn to be used as a refresher training aid or for new onboards
that have a role in executing interagency agreements.
The Department will continue its efforts to build an online system to track interagency
agreements, including the identification of the legal authority for the agreements.
The implementation was delayed due to a requirement to accommodate new data fields
necessary to provide compatibility with the Treasury-mandated Central Accounting Reporting
System. User Pilot testing began in April 2015. OCFO plans to complete a detailed
implementation plan for the required functionality by January 2016, with deployment of the
required changes by June 2016.
Risk Management Agency
In August 2015, RMA incorporated a separate pricing methodology for irrigated and
non-irrigated hay for the 2016 crop year.
HUMAN RESOURCES
As stated in the FY 2015 Management Challenges report, USDA, like most of the Federal
Government, has been asked to accomplish more with fewer employees. For many agencies, this
means appropriately training and utilizing their available staff.
OIG determined the following:
The Animal and Plant Health Inspection Service’s (APHIS) Plant Protection and
Quarantine (PPQ) program did not have a sufficient system of management controls to
ensure the Preclearance Offshore Program was able to effectively protect U.S. agriculture
from foreign pests and diseases;
PPQ officials did not implement management controls, such as performance measures, to
assess the effectiveness of the program, or identify or analyze risks after accepting
countries into the program; and
PPQ did not have a formal training program in place, which hindered its inspectors’
performance.

S E C T I O N I I I | O T H E R I N F O R M A T I O N
1 5 8 C R E A T I N G A U S D A F O R T H E 2 1 S T C E N T U R Y
CORRECTIVE ACTIONS:
APHIS agreed with OIG recommendations and is taking the steps described below to implement
corrective actions.
Animal and Plant Health Inspection Service
During FY 2015, APHIS has:
Implemented a management controls training program;
Developed guidance on calculating travel time;
Implemented a preclearance travel policy;
Revised Preclearance Commodity Management Guidelines showing clear roles and
responsibilities for all staff and management officials;
Implemented procedures requiring its review units to conduct ongoing assessments or
audits of the programmatic aspects of the Preclearance Program;
Implemented a policy memorandum outlining the requirements for Preclearance Program
trip reports, and a policy outlining the process for reviewing and evaluating trip reports and
ensuring that the reports include relevant operational information;
Implemented written policy outlining the process for tracking the recommendations and
planned corrective actions included in the trip reports;
Implemented policy requiring managers to ensure that all recommendations are addressed
and appropriate corrective actions taken on a quarterly basis; and
Implemented procedures for including training costs for the Preclearance Program
inspectors in the annual financial operating plans, the Cooperative Service Agreement, or
other agreements between APHIS and the cooperator. APHIS implemented a process to
track Locally Employed Staff (LES) inspector training in the Preclearance Program
SharePoint site, and implemented Preclearance Commodity Management Guidelines
requiring LES inspectors to complete on-the-job training prior to performing primary
inspections.
By the beginning of FY 2016, APHIS will:
Complete implementation of specific performance measures to evaluate and ensure the
effectiveness of the Preclearance Program;
Implement policies, procedures, and guidelines for performing and reporting program
operation reviews on a regular and recurring basis;
Implement an assessment process that includes measurable outcomes to ensure that
operations are properly performed;

F I S C A L Y E A R 2 0 1 5 A G E N C Y F I N A N C I A L R E P O R T
U . S . D E P A R T M E N T O F A G R I C U L T U R E 1 5 9
Revise the Pest Interception Record (PPQ Form 309A) to include a field for tracking
actionable pest interceptions;
Implement policies and procedures to ensure that operational work plans include definition
for "a lot" and that sampling procedures are consistent for each commodity and a review of
existing work plans are updated to include commodity sampling methodologies;
Implement a standard set of consequences for violations of compliance requirements; and
Implement policy regarding the training requirements of LES.
Open Audit Recommendations
OIG DETERMINED THE FOLLOWING:
USDA could improve program accountability and oversight by making a determined, concerted
effort to resolve outstanding audit recommendations.
CORRECTIVE ACTIONS:
Department-wide
At the end of FY 2015, the Department had 398 open recommendations. Of those
recommendations, 58 were under collection, 9 were without management decision, and 331 had
reached management decision. The Department will continue to work with the agencies to
reduce the number of outstanding recommendations. During FY 2015, the Department met with
the agencies to determine if the agreed-upon corrective actions for recommendations open longer
than 1 year, should be re-evaluated to determine if the corrective actions were still appropriate to
resolve the recommendations. Meetings will be ongoing in FY 2016.
Challenge 2: Information Technology Security Needs Continuing Improvement
OIG states that to accomplish its mission of providing benefits and services to the American
public, USDA must efficiently manage vast amounts of data. This critical information ranges
from agricultural statistics that drive domestic and global markets to data-driven inspection
systems that help ensure food safety. Department employees must be able to access, use, and
communicate this information in order to deliver programs effectively. Additionally, the general
public applies for and accesses many USDA program benefits and other services online, which
can require the transfer of personally identifiable information through these online portals. It is
therefore critical that the Department protect the security, confidentiality, and integrity of its
information technology (IT) infrastructure.

S E C T I O N I I I | O T H E R I N F O R M A T I O N
1 6 0 C R E A T I N G A U S D A F O R T H E 2 1 S T C E N T U R Y
OIG DETERMINED THE FOLLOWING:
The Department has not:
Developed risk management procedures in accordance with Federal guidance;
Monitored agencies for compliance with baseline configurations and ensured the correction
of known vulnerabilities;
Deleted separated employees’ access to computer systems;
Enforced a policy to detect and remove unauthorized network connections; and
The Department does not have a complete inventory of its cloud system.
OCIO will work with USDA agencies to identify overall risks, and then prioritize those
risks.
Outstanding Audit Recommendations
From FYs 2009 through 2014, OIG made 57 recommendations for improving the overall security
of USDA’s systems. Management decisions have been reached for all 57 recommendations, but
only 21 of these have been closed (i.e., the agreed-upon corrective action has been implemented).
OIG DETERMINED THE FOLLOWING:
Corrective action plans should be reviewed and updated.
CORRECTIVE ACTIONS:
Office of the Chief Information Officer
The OCIO coordinates with agency Chief Information Officers (CIOs) and their program staff to
ensure active exchange of program requirements and implementation challenges. This
communication is conducted on several fronts relative to IT Security: CIO Leadership Council;
CIO Council Advisory Working Group; one-on-one meetings with agency CIOs; monthly
Information System Security Program Manager (ISSPM) meetings; and bi-weekly agency
ISSPM and Agriculture Security Operation Centers (ASOC) liaison meetings to discuss
assessment and authorization (A&A) activities. Additionally, OCIO has an active Threat
Intelligence component which monitors active and real-time cyber-security threats and
communicates this information directly to the agencies. All of these activities continued
throughout FY 2015 and will continue as an effective means of bi-directional communication of
IT security program requirements, concerns, and challenges.
Since October 2011, OCIO has published eight IT and IT security-related Departmental
Regulations (DR) that are National Institute for Standards and Technology (NIST) compliant.
Additionally, OCIO currently has four IT-related policies in draft and/or revised and are
scheduled to be published by the end of FY 2016.

F I S C A L Y E A R 2 0 1 5 A G E N C Y F I N A N C I A L R E P O R T
U . S . D E P A R T M E N T O F A G R I C U L T U R E 1 6 1
USDA leverages the U.S. Department of Homeland Security’s (DHS) Cyber Hygiene Scanning
for monthly vulnerabilities scans on all USDA internet protocol (IP) space. OCIO continues to
work closely with DHS in evaluating and refining implementation into USDA’s environment for
DHS’ Federal Security Dashboard and Continuous Diagnostics and Mitigation (CDM) Program
and will report progress throughout FY 2016.
The Agriculture Security Operations Center (ASOC) conducts analysis of a statistical sample of
agency-scanning documentation monthly. The Standard Operating Procedure (SOP) for this is in
draft and OCIO anticipates the Chief Information Security Officer (CISO) approval by the end of
FY 2015. Over 119,000 agency endpoints are connected to the ASOC’s Tivoli Endpoint
Manager (TEM) for monitoring of the U.S. Government Configuration Baseline (USGCB)
compliance. The agencies continuously monitor the remaining non-TEM compatible systems for
USCGB compliance and vulnerability to emerging threats. These are ongoing OCIO oversight
activities and have continued throughout FY 2015 and into out-years.
OCIO published DR-3505-003 “Access Control for Information and Information Systems” on
February 10, 2015, which is NIST Special Publication 800-53 (Rev 4) compliant. This DR sets
forth USDA requirements for secure logical access administration and management to all IT
systems and network components. Agencies were required to develop, implement, and maintain
procedures to carry out the policy.
OCIO has undertaken an aggressive enterprise-wide initiative to implement technical
enforcement of the use of the Homeland Security Presidential Directive (HSPD)-12 personal
identity verification (PIV) cards for access-control (logical and physical) in FY 2015. This
technical enforcement will result in near immediately disabling of IT access upon termination
from a pay status of employees and contractors. OCIO is in the process of reviewing
agency-level access control procedures for compliance.
On August 12, 2014, OCIO published DR 3520-002 “Configuration Management”. This policy,
combined with DR 3540-003 “Security Assessment and Authorization”, requires agencies to
establish formal IT systems configuration management/change control processes and to
continuously monitor their systems for compliance with secure baselines and authorized and
unauthorized changes. Continuous monitoring and periodic scanning of operational systems
within the USDA network facilitate the identification and removal of unauthorized network
connections. The USDA’s Six Step Risk Management Framework (RMF) Process Guide was
re-published in May 2015. These documents apply to all systems operated by or on behalf of
USDA, including those systems within cloud environments.
OCIO has hired additional staff to assist in gathering and reviewing artifacts to support
documentation of remediation actions. OCIO has conducted an in-depth review of all
outstanding IT Security related audit recommendations and grouped them by control area to
leverage documentation over multiple findings. OCIO closed 8 outstanding recommendations in
FY 2015 and have several pending adjudication of supporting documentation and submission to
request final action. This has been delayed until the 1st quarter of FY 2016 due to other high
priority OMB reporting requirements.
S E C T I O N I I I | O T H E R I N F O R M A T I O N
1 6 2 C R E A T I N G A U S D A F O R T H E 2 1 S T C E N T U R Y
Challenge 3: USDA Needs to Strengthen Program Performance and Performance Measures
OIG emphasized a key program performance challenge: USDA has been challenged to design,
develop, and implement programs that reliably achieve their intended results. OIG has
sometimes found that agencies focus on providing payments with little certainty that the funds
provided are used to accomplish the program’s goals. USDA must continually strive to be a
careful custodian of Federal funds, ensuring that its programs are well designed and report data
that indicate the extent to which its programs have succeeded.
OIG DETERMINED THE FOLLOWING:
USDA’s programs for supporting beginner farmers could benefit from a thorough revision
of how these results are reported and better oversight of funds intended to encourage new
farmers;
In FYs 2012 and 2013, USDA spent $3.9 billion in assistance for beginning farmers but did
not develop an integrated and coordinated strategy to ensure that this assistance was
helping new farmers establish and sustain new farming operations;
USDA agencies need to improve their coordination and more consistently define eligibility
requirements for their programs;
The Department oversees the beginning farmers and ranchers initiative and focuses on
developing measureable outcomes and goals;
The Department is unable to gauge the effectiveness of its beginning farmer activities in
creating economically sustainable operations; and
The Departmental performance goal was not developed because the Department did not:
(1) provide adequate oversight or resources to ensure the Office of Advocacy and Outreach
(OAO) completed its task; (2) support OAO by requiring senior Department and agency
officials to participate in the development of this performance goal; and (3) ensure the
development of a standard definition of beginning farmers.
Without a cross-cutting Departmental strategic performance goal, USDA cannot measure
the outcomes of its many programs and activities that provide assistance to beginning
farmers.
CORRECTIVE ACTIONS:
Department-wide
USDA has made significant progress in developing a comprehensive strategy to enhance and
target our support of new and beginning farmers. Using the tools and authorities provided to
USDA by Congress, the Department made significant investments to support our nation’s next

F I S C A L Y E A R 2 0 1 5 A G E N C Y F I N A N C I A L R E P O R T
U . S . D E P A R T M E N T O F A G R I C U L T U R E 1 6 3
generation of farmers and ranchers. The Department has worked to modernize customer service
and program delivery, create ease of service for new farmers, and adapted the crop insurance
program, developed new loan products, and revised conservation policies to address the unique
challenges that new farmers and ranchers face. USDA has quickly implemented new programs
and authorities under the 2014 Farm Bill to provide additional resources and help USDA
modernize our customer service to new farmers. The Department is also regularly coordinating
its programmatic and outreach efforts. These efforts are overseen by the Deputy Secretary’s
office in coordination with OAO, FSA, and other agencies servicing new farmers.
As part of USDA’s efforts to strengthen program integrity and encourage transparency, the
Department is developing Department-wide measurable outcomes and goals to track our efforts
with new and beginning farmers. These goals, including relevant milestone dates, will soon be
publicly available.
Challenge 4: USDA Needs to Strengthen Controls over Improper Payments and Financial Management
USDA expends nearly $144 billion in public services every year. The Department’s annual
financial reports provide the public, Congress, and the President with information about USDA’s
costs and revenues, assets and liabilities, and other information, such as improper payments. It is
imperative that these reports are accurate and timely so that USDA’s financial management is
transparent. However, USDA continues to fall short of full compliance with Federal
requirements for improper payments and needs to address endemic control issues in some
component agencies in order to resolve ongoing problems with financial management.
Additionally, USDA needs to actively pursue efforts to identify root causes for improper
payments in high-risk programs, and make measurable progress to reduce the overall rate of
improper payments.
OIG DETERMINED THE FOLLOWING:
USDA did not comply with the Improper Payments Elimination and Recovery Act
(IPERA) for the fourth consecutive year;
The Office of the Chief Financial Officer and senior officials for each noncompliant
component agency need to set more aggressive goals to help USDA achieve compliance
with IPERA;
USDA needs to improve controls for reducing improper payments;
FNS needs to improve documentation requirements and the verification process for the
National School Lunch Program (NSLP);

S E C T I O N I I I | O T H E R I N F O R M A T I O N
1 6 4 C R E A T I N G A U S D A F O R T H E 2 1 S T C E N T U R Y
RMA developed new sampling methods for FYs 2015 and 2016, which OMB has
approved, with the expectation that RMA will develop a more comprehensive sampling
methodology for approval and use for FY 2017 reporting and beyond; and
Component agencies (NRCS, RMA, and CCC) need to implement actions to provide
adequate evidence and strengthen their internal control over financial reporting.
CORRECTIVE ACTIONS:
Department-wide
USDA completed the third quarter High-Dollar report on time and will work to duplicate that
result in future quarters. USDA determined that the Wildland Fire Suppression program has
consistently reduced their improper payments to the point that they are no longer at high risk for
making improper payments. With concurrence from OIG and the Office of Management and
Budget (OMB), USDA has removed this program from the list of programs at high risk of
improper payments. The Direct and Counter-Cyclical and Milk Income Loss Contract programs
were removed from the list of high-risk programs because they were phased out.
USDA successfully implemented the new Do Not Pay portal with the Treasury and is performing
post payment adjudication on all USDA payments. USDA will also focus on high quality,
timely, and transparent reporting of improper payment compliance activities.
Food and Nutrition Service
In February 2015, FNS consulted with the Office of the General Counsel (OGC) to determine its
regulatory authority to require households to submit income documentation with school meals
applications. FNS, along with its State and local partners, have invested in system improvements
and process reforms over the last several years that are beginning to pay dividends and promise
long-term reductions in program error. A number of these reforms were mandated by the
Healthy, Hunger-Free Kids Act of 2010.
FNS will collaborate with State partners to determine opportunities to identify, in subsequent
school years, those households that, based on the results of the regular verification process, have
been found to have misreported income. Feasible and reasonable strategies identified will be
incorporated into verification for cause guidance, and will also be incorporated into the annually
updated eligibility guidance by April 2016.
In school year 2013-2014, FNS implemented the new Administrative Review process to include
a new section entitled “Resource Management”. This section was specifically designed to
provide a systematic approach to ensuring the overall financial health of a School Food
Authority's (SFA) nonprofit school food service. The section consists of a review of four areas
integral to the financial health of the SFA’s food service: Paid Lunch Equity, Nonprogram
Revenue, Indirect Costs, and Net Cash Resources.

F I S C A L Y E A R 2 0 1 5 A G E N C Y F I N A N C I A L R E P O R T
U . S . D E P A R T M E N T O F A G R I C U L T U R E 1 6 5
FNS issued additional clarification to State agencies to ensure that they adequately monitor the
SFAs’ net cash resources through further updates to the Administrative Review Manual.
Risk Management Agency
RMA implemented the OMB-approved sampling methodology for the 2015 and 2016 reporting
periods.
RMA is in the process of developing a more comprehensive sampling methodology for the
2017 reporting period. RMA will submit the draft methodology to OMB for approval. The
strategy for reducing improper payments includes using data mining techniques, analyzing
trends, and providing instructions to the approved insurance providers to implement controls to
reduce errors. RMA initiated supplemental measures in FY 2015. RMA will measure the
reduction in acreage reporting discrepancies greater than 100 acres using data mining techniques.
Farm Service Agency/Commodity Credit Corporation
National Farm Bill Training was provided to State offices for the Noninsured Crop Disaster
Assistance Program (NAP) in November 2014. The Deputy Administrator for Farm Programs
(DAFP) announced a new interim Web-based system for monitoring and tracking the Loan
Deficiency Payment System (eLDP) and market loan gains with respect to producer eligibility
and payment limitation. FSA conducted bi-weekly teleconferences with State offices to address
new and existing policies and procedures that may be contributing to the potential risk of
improper payments. Compliance reviews and spot-checks were performed to ensure the accuracy
of payments and integrity of FSA programs.
This reporting mechanism allows the National Office to monitor the overall integrity of each
program being implemented. FSA’s DAFP Office and the Outreach and Office of External
Affairs collaborated to keep external and internal stakeholders informed of program
requirements, policies and procedures. Multiple training sessions, under the Supplemental
Revenue Assistance Payments Program, were provided to assist in reducing administrative or
process errors.
CCC implemented several business process and system improvements to record, track, and
report obligations at the detailed transaction level. CCC:
Implemented the new Common Obligation Framework (COF) shared service. A phased
implementation has been in progress during FY 2015 to bring FSA program and financial
management applications into full compliance. The COF provides an automated real-time
funds control environment where funds availability is checked prior to obligation at the
detail transaction level. Program applications call the COF shared service to ensure
obligations occur at the time of contract approval. Budget authority is tracked and executed
by program, as categorized on the approved apportionment. The system ensures obligations
do not exceed apportioned amounts, allotments, sub-allotments, and other administrative
subdivisions, and it records obligations at the transaction level. Phase I was released
December 12, 2014, and Phase IB was released on June 26, 2015.
S E C T I O N I I I | O T H E R I N F O R M A T I O N
1 6 6 C R E A T I N G A U S D A F O R T H E 2 1 S T C E N T U R Y
Deployed Phase I of the Commodity Loan Processing System (CLPS) on July 1, 2015.
CLPS is the replacement for the legacy Automated Price Support System (APSS), which
resides on the System 36/AS400 platform. CLPS uses the new COF shared service. Phase 1
included all commodities except cotton, rice, and peanuts.
Established an automated tool to reconcile the Statement of Budgetary Resources (SBR)
status of funds to the CORE general ledger by FSA/CCC programs.
Implemented a 48XX account balance reconciliation process to ensure that obligation
transactions are timely and accurately recorded in the CORE general ledger system for
non-12X4336 and 12X4336 funds. The reconciliation process compares the electronic
Funds Management System (eFMS) subsidiary system to the CORE General Ledger.
Completed working sessions with DAFP and the Office of Budget and Finance (OBF)
personnel to draft policy for each DAFP program that identifies the appropriate obligation
trigger points. The results of these discussions will aid in developing the business
requirements to design program application software to ensure all CCC programs are in full
compliance with funds control.
Enhanced the SBR reconciliation and reporting process to include the obligation type and
funds control status for all FSA/CCC programs. The report tracks the status of
program-area funds control compliance by identifying programs that obligate at the detail
transaction level.
FSA/CCC has successfully moved two of the three financially significant applications, i.e. Farm
Storage Facility Loans (FSFL) and the Conservation Reserve Program (CRP), off the IBM
AS400/S36 platform hosting county office (CO) applications. The Automated Price Support
System (APSS) 2014 crop year loans remain on the AS400, with a target date of closing out by
April 2016.
FSA conducted national conservation program training regarding issuing proper payments.
Compliance reviews and spots-checks will be completed by County Offices and results will be
recorded in the National Compliance Review database. The National Office will analyze the
National Compliance Review results to identify program policies and procedures that need to be
reinforced to field offices. Acreage Reporting Target Reviews will be conducted by CO Review
staff to mitigate improper payments caused by errors related to CO acreage reporting activities.
FSA will implement the Web-enabled Loan Deficiency Payment System (eLDP) programmed to
read the Common Payment Software. The Common Payment Software will read the producers
applicable eligibility flags to ensure the producer is eligible for a LDP payment before execution,
in addition to keeping track of a producer’s payment limitation. A customer training package will
be developed to educate producers on NAP recordkeeping requirements and will introduce them
to a NAP tool that could help collect data for production reporting.
FSA will continue to modernize electronic systems to eliminate the standing material weakness
and become substantially compliant with the Funds Control/Obligation Requirements related to
obligations at the transaction level. The following releases are scheduled for deployment during

F I S C A L Y E A R 2 0 1 5 A G E N C Y F I N A N C I A L R E P O R T
U . S . D E P A R T M E N T O F A G R I C U L T U R E 1 6 7
the end of FY 2015 and during FY 2016: Phase II Common Obligation Framework (COF);
Agriculture Risk Coverage (ARC)/Price Loss Coverage (PLC); Remaining CLPS Phases; Phase
II Direct Loan System (DLS)/FSFL); Margin Dairy Protection Program (MPP); close out all
activity on AS400; and move existing programs CRP, Emergency Conservation Program (ECP),
Emergency Forest Restoration Program (EFRP), and FSFL to COF at the transactional level and
properly sequester funds in FY 2016.
Natural Resources Conservation Service
Released in FY 2015, National Instruction 120-354 identifies that NRCS will verify that each
participant that is an applicable entity type that is required to be registered in the Central
Contractor Registration (CCR) on the System for Award Management (SAM.gov) has fully
complied with those requirements prior to awarding a conservation program contract or
agreement, and that failure to comply with these requirements will be cause for NRCS to use that
determination as a basis for making an award to another eligible applicant. Additionally, for
these applications, the records will be checked, and the registration status will be confirmed for
each payment thereafter.
NRCS’ National Accounts Payable Service Team implemented standardized procedures for the
direct entry of easement obligations that included checklists that contained verification of the
Data Universal Numbering System/ System for Award Management (DUNS/SAM)
requirements.
Nationwide implementation of the Enhanced Internal Controls took place in January 2015. The
Easement Programs Division (EPD) holds a monthly online conference, and the Internal
Controls Team implemented a monthly question-and-answer session. EPD implemented a
weekly question and answer session with NRCS National Programs Managers. EPD reminded
easement programs staff of the SAM registration requirements with an emphasis that the
requirements include restoration agreements during an EPD sponsored net conference.
A standardized procedure for reviewing payments related to prior year contracts is currently in
clearance. ProTracts, an NRCS system, has been updated to check SAM.gov registrations
automatically at obligation and payment. Nationwide EPD training and teleconferences will be
conducted during FY 2016 on documenting ownership length.
Challenge 5: USDA Needs to Improve Outreach Efforts OIG identified in Challenge 5 that due to a history of public attention concerning how USDA has
allegedly treated members of socially disadvantaged groups—most notably, lawsuits like Pigford
I, Black Farmers Discrimination Litigation (BFDL), Keepseagle, and Garcia/Love—the
Department faces challenges in conducting outreach to disadvantaged groups and persuading
members of those groups that the Department represents their best interests. Throughout his
tenure, the Secretary of Agriculture has reiterated the importance of civil rights, emphasizing that
there is significant progress to be made in working with communities to address past civil rights
issues.

S E C T I O N I I I | O T H E R I N F O R M A T I O N
1 6 8 C R E A T I N G A U S D A F O R T H E 2 1 S T C E N T U R Y
OIG DETERMINED THE FOLLOWING:
There was insufficient evidence to support that positive results were achieved during the
Strikeforce Initiative pilot program and questioned the almost $2.7 million in funds
provided to the awarded organizations;
Grant approval processes in OAO were informal and undocumented and regulatory
processes were disregarded;
OAO did not ensure that grantees adhered to regulations or the terms and conditions of
their grant agreements, and performed limited monitoring of the grantees; and
USDA needs to ensure the accountability and transparency of funds it spends in outreach,
especially when those funds are intended to address past inequities experienced by socially
disadvantaged groups.
CORRECTIVE ACTIONS:
Office of Advocacy and Outreach
OAO improved accountability around funds spent on the USDA Strikeforce for Rural Growth
and Opportunity Initiatives by: (1) obtaining and reviewing the final reports for all of the
community-based organizations (CBOs) and made a determination on each CBO’s effectiveness
in carrying out the Strikeforce Initiative pilot program; (2) issuing a report assessing the overall
effectiveness of the Strikeforce Initiative pilot program in meeting the goals of the strategic plan.
The report included an assessment of the use of the almost $2.7 million in funds provided to the
CBOs.
By the beginning of FY 2016, OAO will revise the standard operating procedures (SOPs) in
response to the OIG audit of the Section 2501 grant program to apply to all program activities—
these procedures will include instructions for competitively selecting CBOs and appropriately
monitoring their activities.
Challenge 6: Food Safety Inspections Need Improved Controls
OIG’s evaluation of Challenge 6 indicates that foodborne pathogens and food contamination can
put consumer health in jeopardy, USDA inspection systems work to effectively protect the safety
of the Nation’s food supply. The Department provides a range of safety measures, from placing
qualified inspectors in livestock slaughtering facilities to operating comprehensive inspection
and testing programs that pinpoint likely risks at processing facilities. The Food Safety and
Inspection Service’s (FSIS) mission is to ensure the nation’s commercial supply of meat, poultry,
and egg products are safe, wholesome, and correctly labeled and packaged. Part of that mission
is ensuring that technology systems and inspection processes are current, accurate, and compliant
with safety standards.

F I S C A L Y E A R 2 0 1 5 A G E N C Y F I N A N C I A L R E P O R T
U . S . D E P A R T M E N T O F A G R I C U L T U R E 1 6 9
OIG DETERMINED THE FOLLOWING:
FSIS could improve the Public Health Information System’s (PHIS) development and
implementation controls;
Inspectors were not adequately able to record inspection results, due to poor connectivity;
Inspectors were not always using a function in PHIS that allowed them to record the
reasons that inspection tasks were not completed;
Issues with how FSIS managed access privileges for separated employees was discovered;
FSIS management can improve how the agency oversees the safety of ground turkey and
other turkey products; and
FSIS should review and improve (1) its Salmonella Initiative Program (SIP) approval and
monitoring processes; (2) the data recorded and collected on noncompliance records to
better gauge the significance of the noted violations; (3) how it tracks the timely updating
of directives; (4) its pathogen sampling policies; and (5) the guidance provided to the
industry for developing its prerequisite programs.
CORRECTIVE ACTIONS:
Food Safety and Inspection Service
Over the last few years, FSIS has instituted enhanced internal controls through implementation
of investment planning and controls. FSIS implemented the following management controls for
the PHIS Investment:
Reviewed the PHIS investment as part of FSIS’ Annual Portfolio Stat, including briefing
senior leadership’s Management Council, as part of the Agency’s Enterprise Governance
(EG) process. The investment is also reviewed by the Under Secretary for Food Safety and
briefed to the USDA Chief Information Officer. The investment is additionally evaluated
by senior leadership on an annual basis through the EG process, whereby the Management
Council (MC) functions as the Agency’s IT Investment Review Board (ITIRB) for
approval of major development, modernization, or enhancement (DME) work.
Quarterly Investment Reviews are conducted to review the PHIS Investment, including
project activities, Earned Value Management (EVM), issues, and risks. FSIS also performs
monthly investment reviews, in conjunction with the USDA OCIO. These reviews are
posted on the Office of Management and Budget (OMB) Federal IT Dashboard. Detailed
briefings on the system’s health and status are provided weekly to senior OCIO staff.
The PHIS investment program is managed by a Federal Acquisition Certification for
Program and Project Managers (FAC P/PM) Level 3 certified program manager. The
development contract is managed by a certified Contracting Officer’s Representative.

S E C T I O N I I I | O T H E R I N F O R M A T I O N
1 7 0 C R E A T I N G A U S D A F O R T H E 2 1 S T C E N T U R Y
In 2014, a rebaseline of the PHIS investment was reviewed and approved by the USDA
Executive Information Technology Investment Review Board as part of USDA’s Integrated
Information Technology Governance Framework.
FSIS has implemented a process through targeted FSIS policy issuances to utilize directed PHIS
task functionality to distinction updates of specific PHIS establishment profile elements, such as
a particular task to update poultry products profiles and another separate task to update pork
products. FSIS intends to continue using this approach to update data elements under a
systematic scheduled timeline culminating in July 2016.
FSIS will develop a reference document that defines the PHIS data elements used in sampling
algorithms. This reference guide will describe how sampling algorithms are implemented in
terms of PHIS data elements on products produced, volumes, intended uses, exclusion criteria,
and other relevant parameters.
For future letters that FSIS sends when approving an establishment’s request for a waiver from
regulatory requirements under the SIP, FSIS will send a consolidated document that includes
appropriate attachments that clearly and concisely outline the procedures the plant is required to
follow based on the waiver, and other supporting documents. These letters will be available to
inspection program personnel (IPP) in the establishments granted SIP waivers, for verification
purposes.
FSIS has developed a chart that includes all current FSIS Directives in the 1000–13000 series.
This chart is reviewed and updated quarterly by FSIS program areas to determine whether the
directives are up to date, or whether they need to be revised or cancelled. As a result of
instituting this process, FSIS has identified a number of directives that the agency plans to revise
or cancel over the next year.
FSIS issued new directives for Food Safety Assessments (FSAs), FSIS Directive 5100.1,
Enforcement, Investigations and Analysis Officer (EIAO) Food Safety Assessment (FSA)
Methodology, Revision 4, published on May 29, 2015, and FSIS Directive 5100.4, Enforcement,
Investigations and Analysis Officer (EIAO) Public Health Risk Evaluation (PHRE) Methodology
published on May 22, 2015. Additionally, PSIS will perform PHREs on a random sample of 16
of the 32 establishments with SIP waivers and if any warrant additional review, FSIS will
conduct a FSA, as instructed by FSIS Directive 5100.1. FSIS will also perform an analysis of the
16 PHREs.
FSIS will review results of the FSA activities under the new directives in December 2015. Based
on analysis of EIAO findings, FSIS will determine whether changes to FSIS Directive 5020.1,
Verification of Salmonella Initiative Program are necessary.
FSIS utilizes information in the Public Health Information System (PHIS) about the regulations
cited in non-compliances to assess the severity of non-compliances. When certain regulations are
cited at a high enough rate, establishments may be scheduled for a public health risk evaluation
(PHRE) depending on the outcome of the PHRE, a FSA, or enforcement action. FSIS will
conduct an evaluation of this new decision-making process, which will include evaluating how

F I S C A L Y E A R 2 0 1 5 A G E N C Y F I N A N C I A L R E P O R T
U . S . D E P A R T M E N T O F A G R I C U L T U R E 1 7 1
sanitations noncompliance records (NRs) are drafted and the data that is recorded, and consider
how the scope and complexity of sanitation NRs might be better utilized to evaluate an
establishment's underlying plant process control. Based on the results of this review, FSIS will
take appropriate actions, if necessary.
FSIS will make public the FY 2015 prevalence estimate for comminuted poultry products by
December 31, 2015. FSIS will make public preliminary prevalence estimates for turkey and
broiler carcasses and chicken parts, based on data collected through September 30, 2015, by
December 31, 2015. Finally, FSIS will develop a schedule, with milestones, for periodically
updating Salmonella prevalence estimates by December 2015.
FSIS is drafting the 4th edition of the Compliance Guideline for Controlling Salmonella and
Campylobacter in Raw Poultry. The Agency intends to address the following issues in the
updated guideline: (1) recommended best practices, (2) information on the components of a
prerequisite program, (3) recommendations for maintaining sanitary conditions during
operations, (4) information explaining that sampling procedures should be described in a written
program, (5) information explaining that interventions used (and their operational parameters)
need to be safe and suitable, (6) information on how establishments should document their use of
antimicrobial interventions, and (7) information on actions that establishments should take if
they find steps in their prerequisite programs have not been properly implemented or followed.
An APHIS work group has been established that will analyze current task scheduling data, task
completion data and justifications for tasks not performed. The group will also review the list of
priority tasks identified in FSIS Directive 13,000.1. Based on its assessment, the group will
develop a plan to address inspection task assignment and completion of priority tasks in PHIS so
that the Agency could begin implementing the plan by July 31, 2016.
In addition, FSIS’s Office of Field Operations (OFO) is currently working on revising its In-
Plant Performance System (IPPS) and associated FSIS Directive 4430.3, with the goal of
implementing on December 31, 2015. As part of its revision of Directive 4430.3, OFO will
instruct supervisors to monitor Inspection Program Personnel application and execution of the
PHIS, including completion of routine inspection tasks as part of the IPPS assessment.
FSIS is working to strengthen its off-boarding policy and procedures to ensure that there is
timely notification of employee separations and transfers. FSIS will issue a directive to all
personnel with updated policy and checklist instructions for separating and transferring
employee clearance by June 30, 2016.

S E C T I O N I I I | O T H E R I N F O R M A T I O N
1 7 2 C R E A T I N G A U S D A F O R T H E 2 1 S T C E N T U R Y
Challenge 7: FNS Needs to Strengthen SNAP Management Controls
OIG highlights a major USDA program in Challenge 7: Although OIG’s management challenges
predominately focus on concerns that cut across program lines, the Supplemental Nutrition
Assistance Program (SNAP), as the largest program within USDA and one of the largest
programs in the Federal Government, presents a special challenge. SNAP provides monthly food
assistance and nutrition for the health and well-being of more than 46 million low-income
individuals. Since 2007, program participation has grown by 77 percent, and the program
disbursed over $70 billion in benefits in FY 2014.
OIG DETERMINED THE FOLLOWING:
FNS needs to redouble its efforts to enforce policies against trafficking; and
FNS needs to establish strong internal controls to prevent abuse.
CORRECTIVE ACTIONS:
Food and Nutrition Service
Retailer Management: A Quality Assurance Branch was formed to enhance retailer management
functions. A series of data management issues have been identified and have or are being
addressed. Targeted training on reviewing and applying the correct retailer store types, and
training on Transfer of Ownership Civil Money Penalties have been conducted for operations
staff. Several retailer management training modules have been developed and delivered to
provide foundational training to new retailer management policy staff. Since the function was
centralized, operations staff has had close to 120 training sessions on a broad variety of retailer
management topics. The efficiencies gained from this model are apparent in the resulting annual
increase in SNAP retailer sanction actions.
Review of retailer management policy is underway. Several policy handbook subject areas have
been replaced by issue-specific policy memoranda. Enhanced retailer eligibility and enhanced
sanctions regulations are also underway. The definition of trafficking was updated and became
effective in March 2013. The owners of close to 5,000 permanently disqualified SNAP retailers
have been added to the GSA System for Award Management (SAM) so that other government
agencies and entities can identify potential risks if/as these SNAP-disqualified owners apply for
other government programs and services.
Retailer Background Checks: Senior OIG officials have acknowledged that FNS has no statutory
authority to directly access the National Crime Information Center (NCIC) for the purpose of
obtaining criminal background checks for retailers. Therefore, FNS has agreed to initiate a
proposed rule that would require any new high-risk applicants and high-risk retailers being
authorized who have not already completed such certification to provide FNS with a

F I S C A L Y E A R 2 0 1 5 A G E N C Y F I N A N C I A L R E P O R T
U . S . D E P A R T M E N T O F A G R I C U L T U R E 1 7 3
self-initiated NCIC background check prior to authorization or reauthorization. The work plan to
initiate this proposed rule was completed in fiscal year 2015.
The National Accuracy Clearinghouse (NAC) pilot project completed its evaluation period on
May 31, 2015. FNS received the draft report in August 2015 and is reviewing the report for
internal comments. The final report will be released in 30 days of issuance of the draft. After
allowing up to 90 days for internal clearance, FNS expects to deliver the report to Congress
before the end of the calendar year, and on target by the deadline established in Section 4032 of
the Agricultural Act of 2014. FNS estimates to have this report completed by the end of
December 2015.
The OIG USDA Management Challenges Report issued August 25, 2015 may be viewed in its
entirety at the following Website: http://www.usda.gov/oig/webdocs/MgmtChallenges2015.pdf.

S E C T I O N I I I | O T H E R I N F O R M A T I O N
1 7 4 C R E A T I N G A U S D A F O R T H E 2 1 S T C E N T U R Y
Summary of Financial Statement Audit and Management Assurances
Summary of Existing Material Weaknesses
The U.S. Department of Agriculture’s material weaknesses and financial system
nonconformance, as related to management’s assurance for the Federal Managers’ Financial
Integrity Act (FMFIA) and the certification for the Federal Financial Management Improvement
Act (FFMIA), are listed in Exhibit 22 and Exhibit 23.
Exhibit 22: Summary of Financial Statement Audit
Audit Opinion: Disclaimer Restatement: No
Material Weakness Beginning Balance New Resolved Consolidated Reassessed
Ending Balance
Improvement Needed in Overall Financial Management
1
1
Improvement Needed in Information Technology Security and Controls
1
1
TOTAL MATERIAL WEAKNESSES
2
2
Exhibit 23: Summary of Management Assurances
Effectiveness of Internal Control Over Financial Reporting (FMFIA § 2) Statement of Assurance: Qualified
Material Weakness Beginning Balance New Resolved Consolidated Reassessed
Ending Balance
Information Technology 1
1
Financial Management 1
1
TOTAL MATERIAL WEAKNESSES
2
2

F I S C A L Y E A R 2 0 1 5 A G E N C Y F I N A N C I A L R E P O R T
U . S . D E P A R T M E N T O F A G R I C U L T U R E 1 7 5
Effectiveness of Internal Control Over Operations (FMFIA § 2) Statement of Assurance: Unqualified
Material Weakness Beginning Balance New Resolved Consolidated Reassessed
Ending Balance
TOTAL MATERIAL WEAKNESSES
0 0
Conformance With Financial Management System Requirements (FMFIA § 4) Statement of Assurance: Systems do not conform to financial management system requirements
Material Weakness Beginning Balance New Resolved Consolidated Reassessed
Ending Balance
Funds Control Management 1 1
TOTAL NONCONFORMANCES 1
1
Compliance With Federal Financial Management Improvement Act (FFMIA)
Item Agency Auditor
1. System Requirements Lack of substantial compliance noted Lack of substantial compliance noted
2. Accounting Standards Lack of substantial compliance noted Lack of substantial compliance noted
3. U.S. Standard General
Ledger at Transaction Level Lack of substantial compliance noted Lack of substantial compliance noted

S E C T I O N I I I | O T H E R I N F O R M A T I O N
1 7 6 C R E A T I N G A U S D A F O R T H E 2 1 S T C E N T U R Y
Improper Payments The Improper Payments Information Act of 2002 (IPIA), as amended by the Improper Payments
Elimination and Recovery Act of 2010 (IPERA) and the Improper Payments Elimination and
Recovery Improvement Act of 2012 (IPERIA), require that executive agencies identify programs
that may be susceptible to significant improper payments, estimate the annual amount of
improper payments, and submit those estimates to Congress. A program with significant
improper payments (or a high-risk program) has both a 1.5 percent improper payment rate and at
least $10 million in improper payments, or exceeds $100 million dollars in improper payments.
Fiscal Year 2015 Results
The U.S. Department of Agriculture’s improper payment rate is 5.70 percent for fiscal year (FY)
2015, an increase from 5.52 percent for FY 2014. USDA’s FY 2015 improper payment results
are as follows:
1. Eight USDA high-risk programs appear to be fully compliant with the Improper Payments
Elimination and Recovery Act of 2010 in FY 2015.
2. The Child and Adult Care Food Program (CACFP) reported an improper payment rate of
0.84 percent—less than the FY 2015 reduction target of 1.43 percent and less than the
1.05 percent improper payment rate reported for FY 2014.
3. The School Breakfast Program (SBP) reported an improper payment rate of
22.95 percent—less than the FY 2015 reduction target of 24.43 percent and less than the
25.61 percent improper payment rate reported for FY 2014.
4. The Rental Assistance Program (RAP) reported an improper payment rate of
1.41 percent—less than the FY 2015 reduction target of 1.90 percent and less than the
1.99 percent improper payment rate reported for FY 2014.
5. The Federal Crop Insurance Corporation (FCIC) program fund reported an improper
payment rate of 2.20 percent—less than the FY 2015 reduction target of 5.75 percent and
less than the 5.58 percent improper payment rate reported for FY 2014.
In FY 2015, the Department took the following actions to address improper payments:
1. Determined that the Wildland Fire Suppression Management, Milk Income Loss Contract
Program, and Direct and Counter-Cyclical Payments have consistently reduced their
improper payments to the point that they are no longer at high risk for making improper
payments. With concurrence from the OIG and OMB, USDA has removed them from the
improper payments high risk list of programs at high risk of improper payments.

F I S C A L Y E A R 2 0 1 5 A G E N C Y F I N A N C I A L R E P O R T
U . S . D E P A R T M E N T O F A G R I C U L T U R E 1 7 7
2. Implemented a statistically valid methodology to accurately test and report improper
payment results for FCIC. OMB approved the Risk Management Agency’s (RMA) plan to
bring its statistical sampling approach into compliance with IPERA.
3. Implemented the Do Not Pay Portal with the U.S. Department of the Treasury. This
implementation allows checks on all USDA post payments against the public Death Master
File, commonly known as the Social Security Death Index (SSDI), and private System for
Award Management Exclusion lists to verify payments.
4. Executed an expansion of the supplier credit audit to include commodity payments made
through the Web-Based Supply Chain Management system.
5. USDA recovered approximately $384 million in improper payments.
Compliance with IPERA Requirements
OIG conducts a compliance review of IPERA requirements annually. OIG’s USDA IPERA
Compliance Review for FY 2014, dated May 2015, found that USDA agencies did not fully
comply with three of six IPERA requirements. Information on the findings, accomplishments,
and planned actions are included in Section 1: Management’s Discussion and Analysis,
Compliance with Laws and Regulations.
Programs noncompliant with IPERA for one fiscal year must submit a plan to Congress
describing the actions that the agency will take to become compliant. For programs
noncompliant with IPERA for 2 consecutive fiscal years, OMB is to review the program and
determine if additional funding would help the agency come into compliance. For programs that
are noncompliant with IPERA for 3 consecutive fiscal years, the agency must submit to
Congress a reauthorization proposal for each discretionary program or proposed statutory
changes necessary to bring a mandatory program into compliance.
Status of Noncompliant Programs
It appears that USDA will be noncompliant with three of the six IPERA requirements for
FY 2015. OIG will conduct the FY 2015 USDA’s IPERA Compliance Review and publish a
report in FY 2016.
Programs Noncompliant with IPERA:
The following programs have been noncompliant with IPERA for 1 year and did not meet annual
improper payment reduction targets:
Farm Service Agency (FSA) Livestock Forage Disaster Program
FSA Supplemental Revenue Assistance Payments Program
FSA Non-insured Crop Disaster Assistance Program

S E C T I O N I I I | O T H E R I N F O R M A T I O N
1 7 8 C R E A T I N G A U S D A F O R T H E 2 1 S T C E N T U R Y
Food and Nutrition Service (FNS) Supplemental Nutrition Assistance Program
Forest Service (FS) Hurricane Sandy—Capital Improvement and Maintenance
USDA identified the following programs that were noncompliant with IPERA for between 3 and
5 years.
Natural Resources Conservation Service (NRCS) Farm Security and Rural Investment Act
Programs: Did not report improper payment rates of less than 10 percent; did not meet
annual improper payment reduction target; and noncompliant with IPERA for 3 years.
National School Lunch Program: Did not report improper payment rates of less than
10 percent; did not meet annual improper payment reduction target; and noncompliant with
IPERA for 5 years.
School Breakfast Program: Did not report improper payment rates of less than 10 percent;
and noncompliant with IPERA for 5 years.
Child and Adult Care Food Program: Did not report sufficient improper payment estimates.
Special Supplemental Nutrition Program for Women, Infants, and Children: Did not meet
annual improper payment reduction target; and noncompliant with IPERA for 5 years.
RISK ASSESSMENT
The Office of the Chief Financial Officer (OCFO) issued detailed guidance for the risk
assessment process, including templates, and performed extensive reviews of draft risk
assessments. Programs with larger outlays were required to perform more detailed assessments
than smaller programs.
The risk assessment process for USDA’s largest programs consists of the following evaluation
criteria:
1. Amount of improper payments needed to meet the reporting standards;
2. Description of the program including purpose and basic eligibility requirements;
3. Definition of improper payments specific to the program;
4. Program vulnerabilities linked to improper payments;
5. Internal controls designed to offset the program vulnerabilities;
6. Test of transactions for selected programs;
7. Listing of significant reviews and audits;
8. Final determination of risk level;
9. Planned future enhancements; and
10. Description of how improper payments are recovered.

F I S C A L Y E A R 2 0 1 5 A G E N C Y F I N A N C I A L R E P O R T
U . S . D E P A R T M E N T O F A G R I C U L T U R E 1 7 9
USDA has 148 programs that are considered to have a low risk of making improper payments.
Risk assessments for low risk programs are completed on a 3-year rotating cycle. During
FY 2015, the following programs completed risk assessments and were determined to be low
risk and not susceptible to significant improper payments.
1. Agricultural Marketing Service (AMS) Commodity Purchase Programs
2. AMS Salaries and Expenses
3. AMS Grants Programs
4. Animal and Plant Health Inspection Service (APHIS) Cooperative Agreements
5. Commodity Credit Corporation (CCC) Tobacco Transition Payment Program
6. CCC Administrative Contracts
7. CCC Marketing Programs
8. CCC Tree Assistance Program
9. CCC Emergency Assistance for Livestock, Honeybees, and Farm Raised Fish Program
10. Farm and Foreign Agricultural Services (FFAS) Salaries and Expenses
11. Food and Nutrition Service (FNS) Food Distribution Program on Indian Reservations
12. Forest Service (FS) State and Private Forestry
13. FS Forest and Rangeland Research
14. FS Stewardship Contracting Product Sales
15. FS Forest Service Permanent Appropriations
16. FS Working Capital Fund
17. Farm Service Agency (FSA) Agricultural Credit Insurance Fund-Program Account
18. Food Safety and Inspection Service (FSIS) Salaries and Expenses
19. FSIS Cooperative State Food Safety and Inspection
20. Grain Inspection Packers and Stockyards Administration (GIPSA)
21. National Institute of Food and Agriculture (NIFA) Research and Education Activities
22. NIFA Extension Activities
23. NIFA Integrated Activities
24. Natural Resources Conservation Service (NRCS) Watershed Programs
25. NRCS Voluntary Public Access and Habitat Incentive Program
26. Office of the Inspector General (OIG) Salaries and Expenses
27. Rural Development (RD) Rural Business Service (RBS) Grant Programs

S E C T I O N I I I | O T H E R I N F O R M A T I O N
1 8 0 C R E A T I N G A U S D A F O R T H E 2 1 S T C E N T U R Y
28. RD RBS Guaranteed Loan Programs
29. RD Rural Housing Service (RHS) Direct Community Facility Loans
30. RD RHS Direct Single Family Housing
31. RD RHS Guaranteed Single Family Housing Loans
32. RD Community Program Grants
33. RD RHS Multi-Family Housing (MFH) Preservation and Revitalization Demo Program—
514/516 Loans/Grants and 515 Loans
34. RD Rural Utility Service (RUS) Grants—
Other Electric - Telecom - Water and Environmental Programs
35. RD Congressional Earmarked Funds
36. RD Water and Waste Guaranteed Loans
37. RD Revolving Loan Fund Program
USDA identified 18 programs in previous fiscal years as shown in Exhibit 24 as susceptible to
significant improper payments. This year’s risk assessment identified no additional high risk
programs.

F I S C A L Y E A R 2 0 1 5 A G E N C Y F I N A N C I A L R E P O R T
U . S . D E P A R T M E N T O F A G R I C U L T U R E 1 8 1
Exhibit 24: Programs Susceptible to Improper Payments
Selection Methodology USDA Agency Program
Former Section 57 of Office of Management and Budget (OMB) Circular No. A-11, Preparation, Submission, and Execution of the Budget (Circular No. A-11).
Food and Nutrition Service (FNS)
Supplemental Nutrition Assistance Program (SNAP)
National School Lunch Program (NSLP)
School Breakfast Program (SBP)
Special Supplemental Nutrition Program for Women, Infants, and Children (WIC)
USDA Identified as Susceptible to Significant Improper Payments
Farm Service Agency (FSA), Commodity Credit Corporation (CCC)
Loan Deficiency Payments (LDP)
Livestock Forage Disaster Program (LFP)
Livestock Indemnity Program (LIP)
Supplemental Revenue Assistance Payments Program (SURE)
Noninsured Crop Disaster Assistance Program (NAP)
FNS Child and Adult Care Food Program (CACFP)
Rural Development (RD) Rental Assistance Program (RAP)
Risk Management Agency (RMA)
Federal Crop Insurance Corporation Program Fund (FCIC)
Natural Resources Conservation Service (NRCS)
Farm Security and Rural Investment Act Programs (FSRIP)
Disaster Relief Appropriation Act of 2013 (Sandy Disaster)
FSA, CCC Hurricane Sandy—Emergency Conservation Program (ECP)
FSA, CCC Hurricane Sandy—Emergency Forest Restoration Program (EFRP)
FS Hurricane Sandy—EFRP
FS Hurricane Sandy—Capital Improvement and Maintenance (CMDF)
NRCS Hurricane Sandy—Emergency Watershed Protection Program (EWPP)
Statistical Sampling
USDA’s programs that are susceptible to significant improper payments are required to conduct
an annual sample that complies with OMB Circular A-123, Appendix C. Compliance can be
accomplished by conducting a standard statistically valid sample or an OMB-approved
alternative methodology.
The FSA/CCC Loan Deficiency Payments program had no FY 2014 outlays and therefore did
not conduct a sample.

S E C T I O N I I I | O T H E R I N F O R M A T I O N
1 8 2 C R E A T I N G A U S D A F O R T H E 2 1 S T C E N T U R Y
The following is a list of programs with brief descriptions of the sampling process that utilized a
standard statistically valid sampling methodology:
1. FSA/CCC LFP, LIP and SURE
a. FSA determined a sample from the payments made in the prior fiscal year using a
90 percent confidence interval of plus or minus 2.5 percentage points.
b. Change in sampling process: These programs used to be sampled and reported as a
component of the Miscellaneous Disaster Programs, but have now been designated as
separate high-risk programs.
2. FSA/CCC NAP
a. FSA determined a sample from a large population, or universe, of NAP and NAP Frost
Freeze payments using a confidence interval of plus or minus 2.5 percentage points.
The NAP universe consisted of payments made in October 2013 through September
2014, and the NAP Frost Freeze universe consisted of payments made from September
2014 through December 2014.
b. Change in sampling process: NAP Frost Freeze payments were included in the NAP
sampling universe.
3. FSA/CCC Hurricane Sandy—ECP, NRCS FSRIP, and RHS RAP
a. Determined a sample from the payments made in the prior fiscal year using a
90 percent confidence interval of plus or minus 2.5 percentage points.
b. Change in sampling process: None.
4. FSA/CCC Hurricane Sandy—EFRP
a. One hundred percent of the payments made in FY 2014 were tested for improper
payments.
b. Change in sampling process: This is the first year this program was sampled.
5. NRCS Hurricane Sandy—EWPP
a. One hundred percent of the non-payroll payments made in FY 2014 were tested for
improper payments. NRCS determined a sample of payments related to employee
salaries made in FY 2014 using a 90 percent confidence interval of plus or minus
2.5 percentage points.
b. Change in sampling process: This is the first year this program was sampled.
6. FS Hurricane Sandy—EFRP
a. One hundred percent of the payments made in FY 2014 were tested for improper
payments.

F I S C A L Y E A R 2 0 1 5 A G E N C Y F I N A N C I A L R E P O R T
U . S . D E P A R T M E N T O F A G R I C U L T U R E 1 8 3
b. Change in sampling process: This is the first year this program was sampled.
7. FS Hurricane Sandy - CMDF
a. One hundred percent of the FY 2014 non-payroll payments were tested for improper
payments. FS payments related to employee salaries made in FY 2014.
b. Change in sampling process: Employee salaries and payments related to charge cards
were added into the payment universe (if made during the fiscal year being sampled).
The following is a list of programs, brief descriptions of the sampling process, and their
justifications for utilizing an OMB-approved alternative sampling methodology:
1. FNS SNAP
a. FNS requires States to pull a monthly random sample from the population of
households receiving SNAP benefits for that given month. Most States draw the
samples systematically (i.e. using a constant sampling interval); however, some States
employ simple random or stratified sampling techniques. The sample universe
represents payments made in the prior fiscal year.
b. Change in sampling process: None.
c. Justification: The SNAP Quality Control Process used for many years was fully
reviewed and vetted.
2. FNS NSLP, SBP, WIC, and CACFP
a. The NSLP/SBP Access, Participation, Eligibility, and Certification Study-II (APEC-II)
established estimates of erroneous payments due to certification error and
non-certification error for school year 2012-2013. FNS generates an annual update for
the improper payment measurements of both components using statistical techniques
based on the findings of this bookend study. The sample universe represents payments
made in School Year 2013-2014.
b. Estimates of improper payments in the Special Supplemental Nutrition Program for
Women, Infants, and Children (WIC) focus on two components: certification error and
vendor error. FNS makes use of periodic studies to assess the level of error in program
payments and then “ages” the data to produce updated annual estimates. The National
Survey of WIC Participants-II Study, established estimates of erroneous payments due
to certification error. The 2013 WIC Vendor Management Study established the most
recent national estimates of erroneous payments due to vendor error. FNS generates an
annual update for the improper payment measurements of both components using
statistical techniques based on the findings of these bookend studies. The sampling
universe represents payments made in fiscal year 2014.
c. CACFP - In lieu of producing a program-wide improper payment measure, FNS has
identified the Family Day Care Home (FDCH) component of this program as

S E C T I O N I I I | O T H E R I N F O R M A T I O N
1 8 4 C R E A T I N G A U S D A F O R T H E 2 1 S T C E N T U R Y
potentially high risk. A three-stage sample design was used: The first stage was
developing a sample of States, from which a sample of sponsors was selected at the
second stage, and a sample of FDCHs was selected in the final stage. FNS measured
the level of erroneous payments due to sponsor error for the two types of program
reimbursement (Tier 1 and Tier 2). The sampling universe represents payments made
in fiscal year 2014. The improper payment measures presented do not include
improper payments associated with the Adult Day Care component or Child Care
Centers, nor do they include meal claiming errors at this time.
d. Change in sampling process: None.
e. Justification: Using the OMB-approved alternative methodology is the only way to
report an improper payment rate for these programs.
3. RMA FCIC
a. Change in sampling process: The FY 2015 measurement plan changed from the
previous year’s plan and was approved by OMB. The previous methodology for
measuring improper payments in the FCIC drew too small of a sample to be
statistically valid, provided disproportionate weight to the smaller Approved Insurance
Providers (AIP), included only policies with indemnity payments, and excluded
improper payments related to premium subsidy and Administrative and Operating
(A&O) payments. The improper payment error rate was calculated as the sum of
indemnity errors for policies reviewed during the current year plus previous
2 reinsurance years divided by the sum of the indemnities for the policies reviewed
during the 3 reinsurance years.
The revised methodology for FY 2015 uses a statistically valid estimate of the
improper payment rate and of the dollar amount of improper payments for FCIC. The
improper payment reviews include all payment categories (premium subsidies, A&O
subsidies, and indemnity payments) and considers how an improper payment can
occur. A simple random sample is used to select the policies for review and the
previous methodology of using inappropriate weighting factors is no longer an issue.
b. Justification: During FY 2015, RMA used an OMB-approved alternative sampling
methodology. A random sample was based on ten crops that account for about
90 percent of the total policies earning premium. RMA also plans to use this sampling
methodology in FY 2016. For FY 2017 and beyond, RMA intends to sample from all
crops, not just the 10 that were used for FY 2015 and FY 2016 reporting, and develop
an estimated improper payment rate applicable to the entire program. RMA intends to
use a more comprehensive measurement plan that will use a larger sample stratified
by AIP.

F I S C A L Y E A R 2 0 1 5 A G E N C Y F I N A N C I A L R E P O R T
U . S . D E P A R T M E N T O F A G R I C U L T U R E 1 8 5
IMPROPER PAYMENT REPORTING
Table 13 shows USDA’s high-risk programs. See the annotated notes below for additional program explanations as appropriate (dollars in
millions).
Table 13: Improper Payment Reduction Outlook
Program
Pre
vio
us
Ye
ar
(PY
) O
utl
ays
$
PY
Imp
rop
er
Pay
me
nt
(IP
) %
PY
IP $
Cu
rre
nt
Ye
ar
(CY
) O
utl
ays
$
CY
IP %
CY
IP $
CY
Ove
r-
pay
me
nt
$
CY
Un
de
r-
pay
me
nt
$
CY
+1
Est
.
Ou
tlay
s $
CY
+ 1
Est
. IP
%
CY
+ 1
Est
. IP
$
CY
+2
Est
.
Ou
tlay
s $
CY
+2
Est
. IP
%
CY
+ 2
Est
. IP
$
CY
+ 3
Est
.
Ou
tlay
s $
CY
+ 3
Est
. IP
%
CY
+ 3
Est
. IP
$
FNS Supplemental Nutrition Assistance Program (SNAP) [Note # 1(b)] 7
6,0
87
3.2
0%
2,4
37
.00
70
,02
2.0
0
3.6
6%
2,5
62
.81
2,078.81
48
4.0
0
70
,89
3
3.6
6%
2,5
95
.00
70
,69
2.0
0
3.6
6%
2,5
87
.00
70
,38
7.0
0
3.6
6%
2,5
76
.00
FNS National School Lunch Program (NSLP) Total Program [Note # 2] 1
1,4
63
15
.25
%
1,7
48
.00
11
,31
9.0
0
15
.66
%
1,7
73
.00
1,3
32
.00
44
1.0
0
11
,83
4.0
0
14
.79
%
1,7
50
.20
12
,29
3.0
0
14
.43
%
1,7
73
.90
12
,36
2.0
0
14
.08
%
1,7
40
.10
FNS NSLP Certification Error N/A
8.3
7%
95
9.0
0
N/A
9.7
0%
1.0
98
.00
78
2.0
0
31
6.0
0
N/A
N/A
N/A
N/A
N/A
N/A
N/A
N/A
N/A
FNS NSLP Counting/Claiming Error N
/A
6.8
8%
78
9.0
0
N/A
5.9
6%
67
5.0
0
55
0.0
0
12
5.0
0
N/A
N/A
N/A
N/A
N/A
N/A
N/A
N/A
N/A
FNS School Breakfast Program (SBP) Total Program [Note # 2] 3
,60
5
25
.61
%
92
3.0
0
3,8
12
.00
22
.95
%
87
5.0
0
70
9.0
0
16
6.0
0
3,9
37
.00
22
.19
%
87
3.8
0
4,1
89
.00
21
.46
%
89
9.0
0
4,2
30
.00
20
.75
%
87
7.9
0

S E C T I O N I I I | O T H E R I N F O R M A T I O N
1 8 6 C R E A T I N G A U S D A F O R T H E 2 1 S T C E N T U R Y
Program
Pre
vio
us
Ye
ar
(PY
) O
utl
ays
$
PY
Imp
rop
er
Pay
me
nt
(IP
) %
PY
IP $
Cu
rre
nt
Ye
ar
(CY
) O
utl
ays
$
CY
IP %
CY
IP $
CY
Ove
r-
pay
me
nt
$
CY
Un
de
r-
pay
me
nt
$
CY
+1
Est
.
Ou
tlay
s $
CY
+ 1
Est
. IP
%
CY
+ 1
Est
. IP
$
CY
+2
Est
.
Ou
tlay
s $
CY
+2
Est
. IP
%
CY
+ 2
Est
. IP
$
CY
+ 3
Est
.
Ou
tlay
s $
CY
+ 3
Est
. IP
%
CY
+ 3
Est
. IP
$
FNS SBP Certification Error N/A
9.8
1%
35
4.0
0
N/A
10
.86
%
41
4.0
0
29
1.0
0
12
3.0
0
N/A
N/A
N/A
N/A
N/A
N/A
N/A
N/A
N/A
FNS SBP Counting/Claiming Error N
/A
15
.79
%
56
9.0
0
N/A
12
.10
%
46
1.0
0
41
8.0
0
43
.00
N/A
N/A
N/A
N/A
N/A
N/A
N/A
N/A
N/A
FNS Special Supplemental Nutrition Program for Women, Infants, and Children (WIC) Total Program
4,5
17
4.5
5%
20
6.0
0
4,5
42
.00
4.6
2%
21
0.0
0
13
9.0
0
71
.00
4,7
78
.00
4.0
8%
19
5.0
0
4,8
42
.00
3.9
8%
19
3.0
0
4,9
18
.00
3.8
8%
19
1.0
0
FNS WIC Certification Error N/A
2.8
7%
13
0.0
0
N/A
2.7
1%
12
3.0
0
12
3.0
0
0.0
0
N/A
N/A
N/A
N/A
N/A
N/A
N/A
N/A
N/A
FNS WIC Vendor Error N/A
1.6
8%
76
.00
N/A
1.9
1%
87
.00
16
.00
71
.00
N/A
N/A
N/A
N/A
N/A
N/A
N/A
N/A
N/A
FSA Loan Deficiency Payments (LDP) [Note #7] 0
.20
18
.80
%
0.0
0
0.0
00
N/A
N/A
N/A
N/A
10
7.0
0
0.4
0%
0.4
3
72
.00
0.3
9%
0.2
9
72
.00
0.3
8%
0.2
9
FSA Livestock Forage Disaster Program (LFP) [Note # 3] N
/A
N/A
N/A
3,3
57
.00
3.1
0%
10
4.2
0
97
.60
6.6
0
2,7
20
.00
2.5
0%
68
.00
48
8.0
0
2.4
8%
12
.10
48
8.0
0
2.4
0%
11
.70
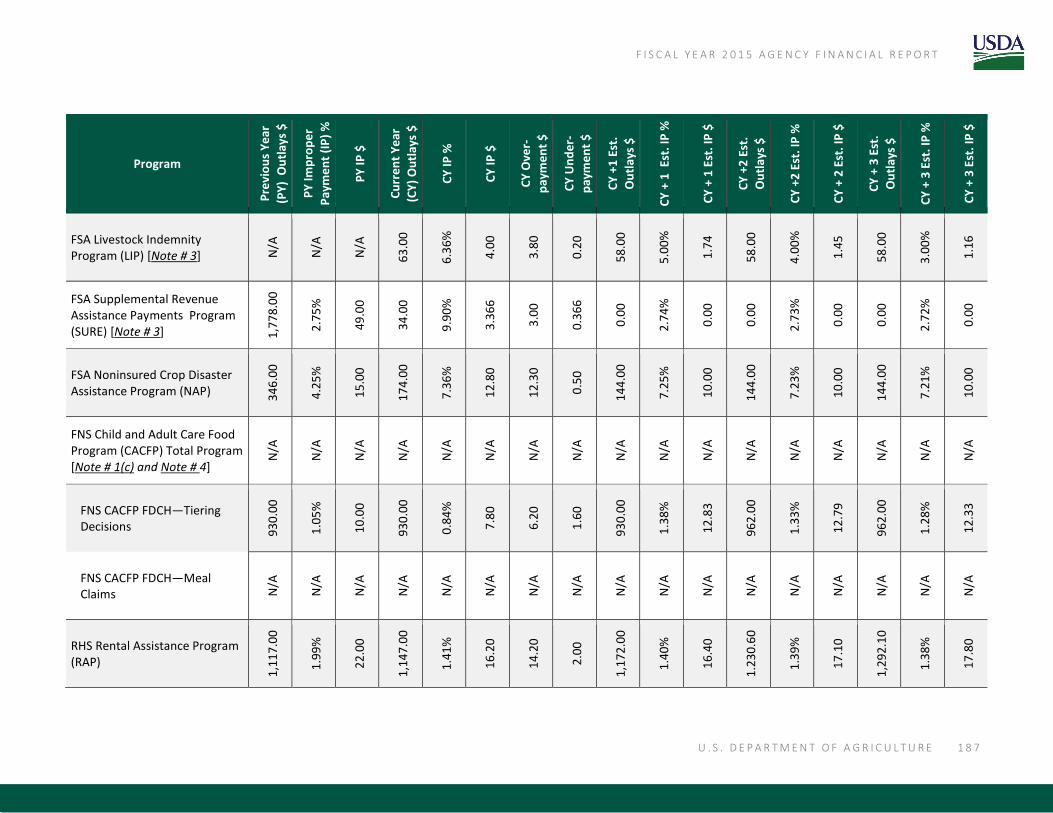
F I S C A L Y E A R 2 0 1 5 A G E N C Y F I N A N C I A L R E P O R T
U . S . D E P A R T M E N T O F A G R I C U L T U R E 1 8 7
Program
Pre
vio
us
Ye
ar
(PY
) O
utl
ays
$
PY
Imp
rop
er
Pay
me
nt
(IP
) %
PY
IP $
Cu
rre
nt
Ye
ar
(CY
) O
utl
ays
$
CY
IP %
CY
IP $
CY
Ove
r-
pay
me
nt
$
CY
Un
de
r-
pay
me
nt
$
CY
+1
Est
.
Ou
tlay
s $
CY
+ 1
Est
. IP
%
CY
+ 1
Est
. IP
$
CY
+2
Est
.
Ou
tlay
s $
CY
+2
Est
. IP
%
CY
+ 2
Est
. IP
$
CY
+ 3
Est
.
Ou
tlay
s $
CY
+ 3
Est
. IP
%
CY
+ 3
Est
. IP
$
FSA Livestock Indemnity Program (LIP) [Note # 3] N
/A
N/A
N/A
63
.00
6.3
6%
4.0
0
3.8
0
0.2
0
58
.00
5.0
0%
1.7
4
58
.00
4.0
0%
1.4
5
58
.00
3.0
0%
1.1
6
FSA Supplemental Revenue Assistance Payments Program (SURE) [Note # 3] 1
,77
8.0
0
2.7
5%
49
.00
34
.00
9.9
0%
3.3
66
3.0
0
0.3
66
0.0
0
2.7
4%
0.0
0
0.0
0
2.7
3%
0.0
0
0.0
0
2.7
2%
0.0
0
FSA Noninsured Crop Disaster Assistance Program (NAP) 3
46
.00
4.2
5%
15
.00
17
4.0
0
7.3
6%
12
.80
12
.30
0.5
0
14
4.0
0
7.2
5%
10
.00
14
4.0
0
7.2
3%
10
.00
14
4.0
0
7.2
1%
10
.00
FNS Child and Adult Care Food Program (CACFP) Total Program [Note # 1(c) and Note # 4]
N/A
N/A
N/A
N/A
N/A
N/A
N/A
N/A
N/A
N/A
N/A
N/A
N/A
N/A
N/A
N/A
N/A
FNS CACFP FDCH—Tiering Decisions 9
30
.00
1.0
5%
10
.00
93
0.0
0
0.8
4%
7.8
0
6.2
0
1.6
0
93
0.0
0
1.3
8%
12
.83
96
2.0
0
1.3
3%
12
.79
96
2.0
0
1.2
8%
12
.33
FNS CACFP FDCH—Meal Claims N
/A
N/A
N/A
N/A
N/A
N/A
N/A
N/A
N/A
N/A
N/A
N/A
N/A
N/A
N/A
N/A
N/A
RHS Rental Assistance Program (RAP)
1,1
17
.00
1.9
9%
22
.00
1,1
47
.00
1.4
1%
16
.20
14
.20
2.0
0
1,1
72
.00
1.4
0%
16
.40
1.2
30
.60
1.3
9%
17
.10
1,2
92
.10
1.3
8%
17
.80

S E C T I O N I I I | O T H E R I N F O R M A T I O N
1 8 8 C R E A T I N G A U S D A F O R T H E 2 1 S T C E N T U R Y
Program
Pre
vio
us
Ye
ar
(PY
) O
utl
ays
$
PY
Imp
rop
er
Pay
me
nt
(IP
) %
PY
IP $
Cu
rre
nt
Ye
ar
(CY
) O
utl
ays
$
CY
IP %
CY
IP $
CY
Ove
r-
pay
me
nt
$
CY
Un
de
r-
pay
me
nt
$
CY
+1
Est
.
Ou
tlay
s $
CY
+ 1
Est
. IP
%
CY
+ 1
Est
. IP
$
CY
+2
Est
.
Ou
tlay
s $
CY
+2
Est
. IP
%
CY
+ 2
Est
. IP
$
CY
+ 3
Est
.
Ou
tlay
s $
CY
+ 3
Est
. IP
%
CY
+ 3
Est
. IP
$
RMA Federal Crop Insurance Corporation (FCIC) Program Fund 1
7,4
30
.00
5.5
8%
97
2.0
0
13
,73
4.0
0
2.2
0%
30
2.1
5
28
9.4
1
12
.74
7,9
03
.00
2.1
9%
17
3.0
0
7,9
10
.00
2.1
8%
17
2.0
0
8,7
09
.00
2.1
7%
18
9.0
0
NRCS Farm Security and Rural Investment Act Programs (FSRIP) 2
,20
0.0
0
23
.08
%
50
8.0
0
2,1
22
.00
22
.04
%
46
7.7
9
46
7.7
9
0.0
0
3,7
17
.60
9.9
0%
36
8.0
4
3,1
76
.80
9.7
0%
30
8.1
5
3,5
88
.80
9.5
0%
34
0.9
4
FSA Hurricane Sandy—Emergency Conservation Program (ECP)
0.4
0
0.0
2%
0.0
0
0.4
0
0.5
0%
0.0
02
0.0
0
0.0
0
0.0
1
0.4
9%
0.0
0
0.0
0
0.4
8%
0.0
0
0.0
0
0.4
7%
0.0
0
FSA Hurricane Sandy—Emergency Forest Restoration Program (EFRP)
N/A
N/A
N/A
0.3
0
1.6
7%
0.0
05
0.0
1
0.0
0
0.3
0
1.5
0%
0.0
0
0.3
0
1.4
5%
0.0
0
0.3
0
1.4
0%
0.0
0
FS Hurricane Sandy—EFRP [Note # 1(a)] N
/A
N/A
N/A
0.0
7
0.0
0%
0.0
0
0.0
0
0.0
0
0.0
8
0.0
2%
0.0
0
0.0
0
0.0
2%
0.0
0
0.0
0
0.0
2%
0.0
0
FS Hurricane Sandy—Capital Improvement and Maintenance (CMDF)
0.3
0
0.0
0%
0.0
0
1.1
8
0.0
6%
0.0
0
0.0
0
0.0
0
1.0
0
0.0
5%
0.0
0
0.0
0
0.0
4%
0.0
0
0.0
0
0.0
3%
0.0
0
NRCS Hurricane Sandy—Emergency Watershed Protection Program (EWPP)
N/A
N/A
N/A
4.8
3
0.0
0%
0.0
0
0.0
0
0.0
0
57
.38
0.0
0%
0.0
0
23
.86
0.0
0%
0.0
0
7.7
4
0.0
0%
0.0
0
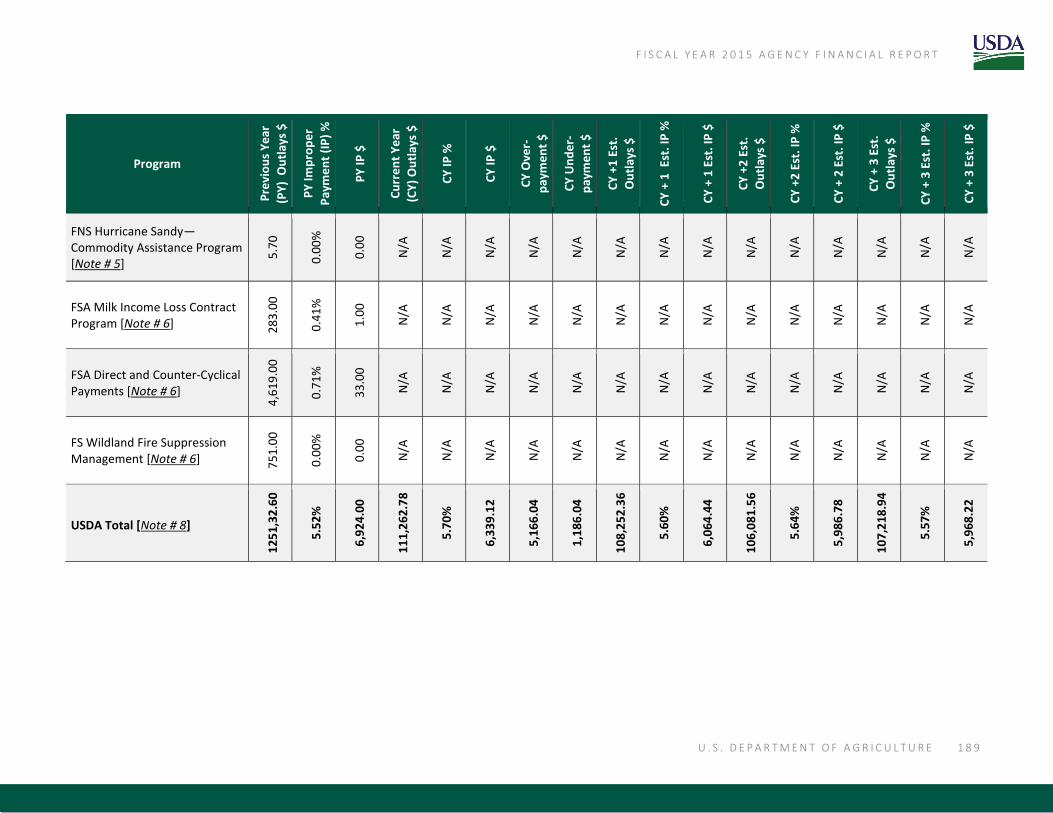
F I S C A L Y E A R 2 0 1 5 A G E N C Y F I N A N C I A L R E P O R T
U . S . D E P A R T M E N T O F A G R I C U L T U R E 1 8 9
Program
Pre
vio
us
Ye
ar
(PY
) O
utl
ays
$
PY
Imp
rop
er
Pay
me
nt
(IP
) %
PY
IP $
Cu
rre
nt
Ye
ar
(CY
) O
utl
ays
$
CY
IP %
CY
IP $
CY
Ove
r-
pay
me
nt
$
CY
Un
de
r-
pay
me
nt
$
CY
+1
Est
.
Ou
tlay
s $
CY
+ 1
Est
. IP
%
CY
+ 1
Est
. IP
$
CY
+2
Est
.
Ou
tlay
s $
CY
+2
Est
. IP
%
CY
+ 2
Est
. IP
$
CY
+ 3
Est
.
Ou
tlay
s $
CY
+ 3
Est
. IP
%
CY
+ 3
Est
. IP
$
FNS Hurricane Sandy—Commodity Assistance Program [Note # 5]
5.7
0
0.0
0%
0.0
0
N/A
N/A
N/A
N/A
N/A
N/A
N/A
N/A
N/A
N/A
N/A
N/A
N/A
N/A
FSA Milk Income Loss Contract Program [Note # 6] 2
83
.00
0.4
1%
1.0
0
N/A
N/A
N/A
N/A
N/A
N/A
N/A
N/A
N/A
N/A
N/A
N/A
N/A
N/A
FSA Direct and Counter-Cyclical Payments [Note # 6]
4,6
19
.00
0.7
1%
33
.00
N/A
N/A
N/A
N/A
N/A
N/A
N/A
N/A
N/A
N/A
N/A
N/A
N/A
N/A
FS Wildland Fire Suppression Management [Note # 6] 7
51
.00
0.0
0%
0.0
0
N/A
N/A
N/A
N/A
N/A
N/A
N/A
N/A
N/A
N/A
N/A
N/A
N/A
N/A
USDA Total [Note # 8]
12
51
,32
.60
5.5
2%
6,9
24
.00
11
1,2
62
.78
5.7
0%
6,3
39
.12
5,1
66
.04
1,1
86
.04
10
8,2
52
.36
5.6
0%
6,0
64
.44
10
6,0
81
.56
5.6
4%
5,9
86
.78
10
7,2
18
.94
5.5
7%
5,9
68
.22

S E C T I O N I I I | O T H E R I N F O R M A T I O N
1 9 0 C R E A T I N G A U S D A F O R T H E 2 1 S T C E N T U R Y
Note # 1: (a) The Forest Service’s Emergency Forest Restoration Program reported a
0.00% improper payment rate in the FY 2015 AFR but would like to request an improper
reduction target increase of 0.02% and an increase to a 0.06% reduction target rate for CMDF in
the following years due to the limited number of transactions and risk impact of any improper
payments identified: (b) FNS’ SNAP is requesting to flatline its future year reduction targets at
3.66% due to the historical downward trend, the nature of the program, and the tolerance
threshold for SNAP quality control cases lowered from $50 to $37, which resulted in more
improper payments being included in the calculation than in previous years. (c) FNS’ CACFP is
reporting an improper payment rate of 0.84% for the FY 2015 AFR. FNS would like to request
an increase in its future year reduction targets to 1.38% in FY 2016, 1.33% in FY 2017, and
1.28% in FY 2018. The justification is that CACFP is currently reporting an improper payment
rate below the high risk threshold and that continued reduction of improper payments may not be
cost effective.
Note # 2: Information has not been adjusted for interaction between the different sources of
certification error and counting/claiming error.
Note # 3: These programs used to be reported as a component of the Miscellaneous Disaster
Programs. The passage of the Agricultural Act of 2014 authorized LIP and LFP as permanent
disaster programs. This change allowed FSA to conduct an individual sample on each of the
following disaster programs (LIP, LFP, and SURE).
Note # 4: CACFP currently tests and reports on the FDCH-tiering decision component of the
payment process. FNS continues to evaluate the measurement processes for the CACFP meal
claim component. FNS has not set a date for measurement and reporting.
Note # 5: The FNS’ Hurricane Sandy—Commodity Assistance Program expended all of its
disaster relief funds and will no longer be included in the Agency Financial Report.
Note # 6: These programs are marked as not applicable (N/A) for current year and future years
because they have been removed from the high risk list. The Wildland Fire Suppression
Management, Milk Income Loss Contract Program, and Direct and Counter-Cyclical Payments
have consistently reduced their improper payments to the point that they are no longer at high
risk for making improper payments. With concurrence from the OIG and OMB, USDA has
removed them from the improper payments high risk list of programs at high risk of improper
payments.
Note # 7: The Loan Deficiency Payments program had no FY 2014 outlays and therefore did not
conduct a sample in FY 2015. USDA anticipates conducting a sample and reporting results in
FY 2016.
Note # 8: The Current Year results reflect the sampling results completed in FY 2015. USDA
sampling tests the prior year’s outlays or an OMB-approved alternative sampling plan. The
Statistical Sampling Section above Table 13 discusses this in more detail.

F I S C A L Y E A R 2 0 1 5 A G E N C Y F I N A N C I A L R E P O R T
U . S . D E P A R T M E N T O F A G R I C U L T U R E 1 9 1
Discussion of Supplemental Measures OMB determines the designation of a high-priority program based on improper payment
reporting in an agency’s AFR. The threshold for high-priority program determinations is
$750 million in estimated improper payments as reported in the AFR or Planning and
Accountability Report. USDA currently has four programs designated as high-priority programs:
1. FNS SNAP
a. State agencies and FNS report the QC Payment Error Rates to PaymentAccuracy.gov
every June.
b. Each month, SNAP cases from every State are sampled for QC review, which looks at
benefits a household receives and verifies whether the benefit determination was
correct. This activity identifies where improper payments occur. The baseline is the
amount of monthly program benefits issued to households the QC review identified
and whether the benefit payment or any portion of it was an improper payment.
c. Data collected during the QC process is analyzed to identify areas of program
administration that need improvement.
d. Each year, SNAP issues QC Payment Error Rates. States with rates above 6 percent
for 2 consecutive years are subject to a liability, which requires that the State invest
funds into its program certification activities to reduce the amount of improper
payments.
2. FNS NSLP
a. Percent of Students Directly Certified for Free School Meals: This measure reflects,
as a percentage, the number of students directly certified for free school meals without
an application (based on determination of eligibility in other programs), in comparison
to the total number of students certified for free meals. The higher the number of direct
certifications that are conducted accurately, the greater the impact on reducing
certification errors that otherwise may occur during application processing. Programs
used for direct certification include SNAP, TANF, FDPIR, foster care, and Medicaid.
This measure is updated on an annual basis.
b. State Technology Grants: This measure reflects the number of states receiving grants
for school meals oversight systems. The purpose of these grants is to assist schools in
reducing errors relating to recordkeeping and meal claiming. Increasing state grants
will reduce related errors. This measure is updated on an annual basis.
3. FNS SBP
a. Percent of Students Directly Certified for Free School Meals: This measure reflects, as
a percentage, the number of students directly certified for free school meals without an
application (based on determination of eligibility in other programs), in comparison to

S E C T I O N I I I | O T H E R I N F O R M A T I O N
1 9 2 C R E A T I N G A U S D A F O R T H E 2 1 S T C E N T U R Y
the total number of students certified for free meals. The higher the number of direct
certifications that are conducted accurately, the greater the impact on reducing
certification errors that otherwise may occur during application processing. Programs
used for direct certification include SNAP, TANF, FDPIR, foster care, and Medicaid.
This measure is updated on an annual basis.
b. State Technology Grants: This measure reflects the number of states receiving grants
for school meals oversight systems. The purpose of these grants is to assist schools in
reducing errors relating to recordkeeping and meal claiming. Increasing state grants
will reduce related errors. This measure is updated on an annual basis.
4. RMA FCIC
RMA has initiated supplemental measures in FY 2015. RMA will measure the reduction in
acreage reporting discrepancies greater than 100 acres using data mining techniques.
a. Description—Producers report acreage to their Approved Insurance Provider and to
FSA. The insurance companies then report to RMA. The reported acres for a
producer are compared between RMA and FSA. For reinsurance year (RY) 2014,
over 80% of producers reported the same acres to both RMA and FSA. However,
over 20,000 producers reported significant differences of over 100 acres to RMA and
FSA.
b. Measurement Baseline—As of RY 2014, there were 25,904 Eligible Crop Insurance
Contracts (ECIC) having an acreage reporting discrepancy of 100 or more acres. This
means that 2.64% of approximately 990,000 ECICs nationwide had an acreage
reporting discrepancy of over 100 acres. An ECIC represents all insured acres for a
producer in a county by crop.
c. Frequency—Annually.
d. Planned Target—Reduce the percentage of ECICs with very large acreage
discrepancies of over 100 acres, from 2.64% to 2.6%. This could equate to a
reduction of approximately 400 ECICs.
e. Benefit—RMA will produce a spot-check list of producers with significant
discrepancies (over 100 acres) between acreage reported to RMA and FSA. This list
will be provided to the Approved Insurance Providers for further review and
reconciliation, as necessary. Corrections to the acreage reports could potentially
prevent improper payments of insurance premium subsidies and indemnities.

F I S C A L Y E A R 2 0 1 5 A G E N C Y F I N A N C I A L R E P O R T
U . S . D E P A R T M E N T O F A G R I C U L T U R E 1 9 3
Improper Payment Root Cause Categories Table 14 is the USDA matrix used to provide a cross-tabulation framework for the way in which
each program categorizes and reports its improper payment estimate (dollars in millions).
Table 14: Improper Payment Root Cause Category Matrix (Dollars in Millions)
Reason for Improper Payment
Supplemental Nutrition Assistance Program (SNAP), FNS
National School Lunch Program
(NSLP), FNS
School Breakfast Program (SBP),
FNS
Special Supplemental
Nutrition Program for
Women, Infants, and Children (WIC), FNS
Ove
r-
pay
me
nt
Un
de
r-p
aym
en
t
Ove
r-
pay
me
nt
Un
de
r-p
aym
en
t
Ove
r-p
aym
en
t
Un
de
r-p
aym
en
t
Ove
r-p
aym
en
t
Un
de
r-
pay
me
nt
Program Design or Structural Issue
Inability to Authenticate Eligibility
Failure to Verify
Death Data
Financial Data
Excluded Party Data
Prisoner Data
Other Eligibility
Administrative or Process Error Made By
Federal Agency
State or Local Agency
$1,153.22 $441.93
Other Party
$1,332.00 $441.00 $709.00 $166.00 $139.00 $71.00
Medical Necessity
Insufficient Documentation
Other Reason* $925.59 $42.07
TOTAL $ 2,078.91 $484.00 $1,332.00 $441.00 $709.00 $166.00 $139.00 $71.00
*Due to errors by clients

S E C T I O N I I I | O T H E R I N F O R M A T I O N
1 9 4 C R E A T I N G A U S D A F O R T H E 2 1 S T C E N T U R Y
Reason for Improper Payment
Loan Deficiency Payments
(LDP), FSA/CCC
Livestock Forage Disaster Program
(LFP), FSA/CCC
Livestock Indemnity Program
(LIP), FSA/CCC
Supplemental Revenue
Assistance Payments Program
(SURE), FSA/CCC
Ove
r-
pay
me
nts
Un
de
r-
pay
me
nts
Ove
r-
pay
me
nts
Un
de
r-
pay
me
nts
Ove
r-
pay
me
nts
Un
de
r-
pay
me
nts
Ove
r-
pay
me
nts
Un
de
r-
pay
me
nts
Program Design or Structural Issue
Inability to Authenticate Eligibility
$31.26
Failure to Verify
Death Data
Financial Data
Excluded Party Data
Prisoner Data
Other Eligibility
Administrative or Process Error Made By
Federal Agency
$44.46 $6.60 $2.70 $0.20 $2.25 $0.40
State or Local Agency
Other Party
Medical Necessity
Insufficient Documentation $21.88 $1.10 $0.75
Other Reason
TOTAL N/A N/A $97.60 $6.60 $3.80 $0.20 $3.00 $0.40

F I S C A L Y E A R 2 0 1 5 A G E N C Y F I N A N C I A L R E P O R T
U . S . D E P A R T M E N T O F A G R I C U L T U R E 1 9 5
Reason for Improper Payment
Noninsured Crop Disaster
Assistance Program (NAP),
FSA
Child and Adult Care Food
Program (CACFP), FNS
Rental Assistance Program (RAP),
RD
Federal Crop Insurance
Corporation (FCIC) Program Fund,
RMA
Ove
r-
pay
me
nts
Un
de
r-
pay
me
nts
Ove
r-
pay
me
nts
Un
de
r-
pay
me
nts
Ove
r-
pay
me
nts
Un
de
r-
pay
me
nts
Ove
r-
pay
me
nts
Un
de
r-
pay
me
nts
Program Design or Structural Issue
Inability to Authenticate Eligibility
$0.49 $160.05 $3.54
Failure to Verify
Death Data
Financial Data
$0.13
Excluded Party Data
Prisoner Data
Other Eligibility
$0.38 $77.57 $9.20
Administrative or Process Error Made By
Federal Agency
$8.07 $0.50
State or Local Agency
Other Party
$6.2 $1.6 $10.4 $2 $34.63
Medical Necessity
Insufficient Documentation $3.23 $3.8 $17.16
Other Reason
TOTAL $12.30 $0.50 $6.2 $1.6 $14.2 $2 $289.41 $12.74

S E C T I O N I I I | O T H E R I N F O R M A T I O N
1 9 6 C R E A T I N G A U S D A F O R T H E 2 1 S T C E N T U R Y
Reason for Improper Payment
Farm Security and Rural Investment
Act Programs (FSRIP), NRCS
Hurricane Sandy—
Emergency Conservation
Program, FSA/CCC
Hurricane Sandy—
Emergency Forest Restoration
Program, FSA/CCC
Hurricane Sandy—
Emergency Forest Restoration Program, FS
Ove
r-
pay
me
nts
Un
de
r-
pay
me
nts
Ove
r-
pay
me
nts
Un
de
r-
pay
me
nts
Ove
r-
pay
me
nts
Un
de
r-
pay
me
nts
Ove
r-p
aym
en
ts
Un
de
r-p
aym
en
ts
Program Design or Structural Issue
Inability to Authenticate Eligibility
Failure to Verify
Death Data
Financial Data
Excluded Party Data
Prisoner Data
Other Eligibility
$437.83
Administrative or Process Error Made By
Federal Agency
$0.002 $0.005
State or Local Agency
$29.96
Other Party
Medical Necessity
Insufficient Documentation
Other Reason
TOTAL $467.79 N/A $0.002 N/A $0.005 N/A N/A N/A

F I S C A L Y E A R 2 0 1 5 A G E N C Y F I N A N C I A L R E P O R T
U . S . D E P A R T M E N T O F A G R I C U L T U R E 1 9 7
Reason for Improper Payment
Hurricane Sandy—Capital Improvement and Maintenance, FS
Hurricane Sandy—Emergency Watershed Protection
Program, NRCS
Ove
r-
pay
me
nts
Un
de
r-
pay
me
nts
Ove
r-
pay
me
nts
Un
de
r-
pay
me
nts
Program Design or Structural Issue
Inability to Authenticate Eligibility
Failure to Verify
Death Data
Financial Data
Excluded Party Data
Prisoner Data
Other Eligibility
Administrative or Process Error Made By
Federal Agency
State or Local Agency
Other Party 0.00037124 0.00037147
Medical Necessity
Insufficient Documentation
Other Reason
TOTAL 0.00037124 0.00037147 N/A N/A

S E C T I O N I I I | O T H E R I N F O R M A T I O N
1 9 8 C R E A T I N G A U S D A F O R T H E 2 1 S T C E N T U R Y
Corrective Actions
Each program is required to develop a Corrective Action Plan. Exhibit 25 describes actions taken
and planned. High-priority programs include a discussion of actions taken to recover and prevent
future improper payments.
Exhibit 25: Program Corrective Action Plans
Agency Program Corrective Actions
Food and Nutrition Service (FNS)
Supplemental Nutrition Assistance Program (SNAP)
Root Cause #1—Administrative or Process Error Made By State or Local Agency.
Program regulations require State agencies to analyze data to develop corrective action plans (CAPs) to reduce or eliminate program deficiencies. A State with a high error rate must conduct an analysis of its State quality control (QC) data to identify the root causes of errors in the State and develop a QC CAP to address root causes. A State with an excessive error rate will be required to invest a specified amount (depending on its error rate and size) designated specifically to program improvements that address the root causes. Each State’s CAP or plan to invest in program improvements is unique and based on the root causes of the errors that occurred in that State. The State will also face further fiscal penalties if it fails to lower its error rate in a future fiscal year. These actions were completed in FY 2014 and are ongoing.
FNS, through its regional offices, works directly with States to impart the importance of payment accuracy to State leadership and to assist in developing effective corrective actions to reduce errors. Regional offices provided technical assistance to States throughout FY 2015.
FNS administers a State Exchange Program whereby funds are provided to States to facilitate travel to obtain, observe, and share information on best practices and effective techniques for error reduction. Coalitions have been formed among States to promote partnerships, information exchange, and collaborative efforts that address mutual concerns and support development of effective corrective action. These activities were conducted throughout FY 2015.
QC Payment Error Rates are announced at the end of June in the year following the end of the review period. State agencies with error rates of 6 percent or higher are required to submit CAPs to FNS addressing these errors. These CAPs remain in effect until deficiencies in program operations have been substantially reduced or eliminated. State agencies will provide updates to their CAPs through regular, semiannual updates received by FNS by May 1, 2015 and November 1, 2015, respectively.
High-Priority Program Discussion.
SNAP is a State run program. FNS must work with State agencies to improve program administration. The State Exchange Program promotes communication and partnerships between high- and

F I S C A L Y E A R 2 0 1 5 A G E N C Y F I N A N C I A L R E P O R T
U . S . D E P A R T M E N T O F A G R I C U L T U R E 1 9 9
Agency Program Corrective Actions
low-performing State agencies, providing low-performing State agencies access to best practices and support.
The State CAPs document how State agencies plan to improve payment accuracy and allow the corrective actions to be tailored to specific State needs and deficiencies.
FNS implemented a process to identify, collect, and report overpayment information for SNAP from available sources to the Department on a quarterly basis.
FNS National School Lunch Program (NSLP)
Root Cause # 1: Administrative or Process Error Made by Other Party.
Addressed certification error by expanding the use of direct certification, increasing the number of School Food Authorities (SFA) and schools participating in the Community Eligibility Provision, and improved the application for free and reduced-price meals by making it easier to complete and process the application.
Developed and implemented training programs and established professional certification standards for school food service workers that are helping schools reduce meal claiming error.
Published the final rule, Professional Standards for School Nutrition Programs Personnel as Required by the Healthy, Hunger-Free Kids Act of 2010 (HHFKA). The rule became effective July 1, 2015.
Required an independent review of applications to increase the accuracy of eligibility determinations in school districts that demonstrate high levels of administrative error. Implementation of this review was required in school year (SY) 2014-2015.
In SY 2014-2015, the Community Eligibility Provision (CEP) was expanded nationwide following a 3-year phased pilot.
Issued a policy memo on January 14, 2015, providing guidance on all aspects of CEP implementation, including eligibility for CEP election, meal counting and claiming, integrity and recordkeeping, and other administrative procedures.
Updated the Administrative Review Manual in August 2015.
Built upon the assessment of the Coordinated Review Effort (CRE) Data Report (FNS-640) to identify and target corrective actions and to consider revisions to the form to capture information regarding the Administrative Reviews by convening a working group in June 2015. The work group analyzed data from the administrative review process at the SFA level in an effort to identify the meaningful data to collect moving forward.
Published a new Prototype Application for Free and Reduced-Price School Meals on April 13, 2015, along with accompanying informational documents.
Issued a revised Eligibility Manual in July 2015.
Issued a Community Eligibility Provision Manual in August 2015.
Conducted the third year of a phased-in demonstration project in SY 2014-2015 in select school districts and States to test the potential for direct certification using Medicaid data. The interim report for the

S E C T I O N I I I | O T H E R I N F O R M A T I O N
2 0 0 C R E A T I N G A U S D A F O R T H E 2 1 S T C E N T U R Y
Agency Program Corrective Actions
first year was published in January 2015, and showed that States have had success in reaching eligible children through matching with Medicaid data. The final report was sent to Congress in October 2015.
Made $4 million available in FY 2015 for Administrative Reviews and Training (ART) grants to States to implement training and technology solutions to reduce and prevent administrative errors in local education agencies that are at high risk for such errors. The request for applications was released in May 2015, and grants were awarded in October 2015.
Utilized ongoing contracts with expert consultants to provide technical assistance directly to States in the areas of training and automation. Targeted technical assistance support, including site visits, was provided to approximately 30 State agencies in FY 2015. Targeted technical assistance support, including site visits, will be provided to approximately 30 State agencies in FY 2016.
In FY 2015, FNS convened the Child Nutrition State Systems Workgroup (CNSSW), a national workgroup of State, FNS regional and national office representatives, to identify priorities for State and local automation initiatives to improve program accountability, monitoring, training, data quality, and other program areas where automation is a strong business solution for program integrity.
FNS conducted the first national technology training for State agencies and technology vendors, “Child Nutrition (CN) Access and Accountability through Technology,” September 22–24, 2015.
Required States not meeting the direct certification rate benchmarks for a given SY to develop continuous improvement plans (CIP) to describe the activities they will implement to reach more eligible children in future years. FNS approved 28 CIP plans in FY 2014 and provided training in 2015 to 41 State agencies on the development of revisions to improvement plans to help them reach and maintain rates at or above 95 percent.
FNS issued a Request for Applications in May 2015 to allow quarterly opportunities for State agencies to apply for the grant funding to help them improve their direct certification rates.
A number of reports and studies that were recently completed support efforts to reduce improper payments, including as follows:
o The Regional Office Review of Applications, which was posted on the Web site May 4, 2015.
o The NSLP and SBP Access, Participation, Eligibility, and Certification Study II (APEC-II); a final report, which was released in May 2015.
o The State Performance on Enrolling Children Receiving Program Benefits for Free School Meals (Direct Certification), which was released in May 2015.
On March 9, 2015, FNS announced the expansion of the “Team Up for School Nutrition Success Initiative,” which provides training, technical assistance, and peer-to-peer mentorship opportunities to school food service professionals.

F I S C A L Y E A R 2 0 1 5 A G E N C Y F I N A N C I A L R E P O R T
U . S . D E P A R T M E N T O F A G R I C U L T U R E 2 0 1
Agency Program Corrective Actions
FNS issued a revised Offer Versus Serve (OVS) Manual in July 2015.
Granted an extension for the use of funds to help State agencies implement new meal pattern requirements in May 2015.
Will require training for schools on certification and accountability issues. This training will be ongoing through FY 2016.
In FY 2016, $4 million will be made available to State agencies for ART grants to implement training and technology solutions to reduce and prevent administrative errors in LEAs that are at high risk for such errors. The request for applications will be released in early 2016, and grants will be awarded in the summer of 2016.
FNS is completing a number of proposed rules that will serve to reduce improper payments by:
o Mandating schools to post a summary of the administrative review final results and make the information available to the public; this transparency requirement should be published in SY 2015-2016.
o Levying fines for gross mismanagement and violating program requirements. An estimated publication date for the proposed rule is early FY 2016.
o Strengthening program compliance by prohibiting any school, institution, or individual that is terminated from one of the Child Nutrition Programs and on a list of disqualified institutions and individuals from participating in, or administering, any of the Child Nutrition Programs; an estimated publication date for the proposed rule is early FY 2016.
States not meeting the required 95 percent benchmark for direct certification rates with SNAP are required to develop and implement CIPs to describe the activities they will implement to reach more eligible children in future years. In FY 2016, FNS will provide technical assistance to the 41 States with CIPs resulting from SY 2013-2014 direct certification rates, as well as begin work with those States that did not meet the benchmark for SY 2014-2015.
Allowing States to apply for grants to help them improve their direct certification rates in FY 2016—October 2015, January 2016, April 2016, and July 2016 (if funds remain available). All grants under this request will be awarded by October 2016.
School Nutrition and Meal Cost Study, commissioned by FNS, is an examination of the relationships between school environment and school food service operations, nutritional quality of meals offered and served in school meal programs, plate waste, costs to produce reimbursable meals, student participation, participant characteristics, satisfaction and related attitudes toward the school lunch and breakfast programs. Primary data collection occurred in SY 2014-2015. A final report is due in early 2017.

S E C T I O N I I I | O T H E R I N F O R M A T I O N
2 0 2 C R E A T I N G A U S D A F O R T H E 2 1 S T C E N T U R Y
Agency Program Corrective Actions
High-Priority Program Discussion.
The NSLP program has specifically tailored the corrective actions above to better reflect the unique processes, procedures, and risks of this high-priority program.
Current statutory authority allows USDA to recover improper payments from state agencies when identified through reviews, audits or other operational oversight activities. These improper payments are recovered through direct billing and offset of future program payments earned. Current statutory authority does not support collection of improper payments identified on the basis of a statistical sample or estimation procedure, as used to develop the national estimates of improper payments reported here.
FNS School Breakfast Program (SBP)
Root Cause # 1: Administrative or Process Error Made by Other Party.
Addressed certification error by expanding the use of direct certification, increasing the number of SFAs and schools participating in the Community Eligibility Provision, and improved the application for free and reduced-price meals by making it easier to complete and process the application.
Developed and implemented training programs and established professional certification standards for school food service workers that are helping schools reduce meal claiming error.
Published the final rule, Professional Standards for School Nutrition Programs Personnel as Required by the Healthy, Hunger-Free Kids Act of 2010. The rule became effective July 1, 2015.
Required an independent review of applications to increase the accuracy of eligibility determinations in school districts that demonstrate high levels of administrative error. Implementation of this review was required in SY 2014-2015.
In SY 2014-2015, the Community Eligibility Provision (CEP) was expanded nationwide following a 3-year phased pilot.
Issued a policy memo on January 14, 2015 providing guidance on all aspects of CEP implementation, including eligibility for CEP election, meal counting and claiming, integrity and recordkeeping, and other administrative procedures.
Updated the Administrative Review Manual in August 2015.
Built upon the assessment of the Coordinated Review Effort (CRE) Data Report (FNS-640) to identify and target corrective actions and to consider revisions to the form to capture information regarding the Administrative Reviews by convening a working group in June 2015. The work group analyzed data from the administrative review process at the SFA level in an effort to identify the meaningful data to collect moving forward.
Published a new Prototype Application for Free and Reduced-Price School Meals on April 13, 2015, along with accompanying informational documents.
Issued a revised Eligibility Manual in July 2015.

F I S C A L Y E A R 2 0 1 5 A G E N C Y F I N A N C I A L R E P O R T
U . S . D E P A R T M E N T O F A G R I C U L T U R E 2 0 3
Agency Program Corrective Actions
Issued a Community Eligibility Provision Manual in August 2015.
Conducted the third year of a phased-in demonstration project in SY 2014-2015 in selected school districts and States to test the potential for direct certification using Medicaid data. The interim report for the first year was published in January 2015 showing that States have had success in reaching eligible children through matching with Medicaid data. The final report was sent to Congress in October 2015.
Made $4 million available in FY 2015 for ART grants to States to implement training and technology solutions to reduce and prevent administrative errors in local education agencies that are at high risk for such errors. The request for applications was released in May 2015, and grants were awarded in October 2015.
Utilized ongoing contracts with expert consultants to provide technical assistance directly to States in the areas of training and automation. Targeted technical assistance support, including site visits, was provided to approximately 30 State agencies in FY 2015. Targeted technical assistance support, including site visits, will be provided to approximately 30 State agencies in FY 2016.
In FY 2015, FNS convened the Child Nutrition State Systems Workgroup (CNSSW), a national workgroup of State, regional, and national office representatives to identify priorities for State and local automation initiatives to improve program accountability, monitoring, training, data quality, and other program areas where automation is a strong business solution for program integrity.
FNS conducted the first national technology training for State agencies and technology vendors, “CN Access and Accountability through Technology,” on September 22–24, 2015.
Required States not meeting the direct certification rate benchmarks for a given SY to develop Continuous Improvement Plans (CIPs) to describe the activities they will implement to reach more eligible children in future years. FNS approved 28 CIP plans in FY 2014 and provided training in 2015 to 41 State agencies on the development or revisions to improvement plans to help them reach and maintain rates at or above 95 percent.
FNS issued a Request for Applications in May 2015 to allow quarterly opportunities for State agencies to apply for the grant funding to help them improve their direct certification rates.
A number of reports and studies that were recently completed support efforts to reduce improper payments, including as follows:
o The Regional Office Review of Applications was posted on the Website May 4, 2015.
o NSLP and SBP Access, Participation, Eligibility, and Certification Study II (APEC-II) final report which was released in May 2015.
The State Performance on Enrolling Children Receiving Program Benefits for Free School Meals (Direct Certification) which was released in May 2015.

S E C T I O N I I I | O T H E R I N F O R M A T I O N
2 0 4 C R E A T I N G A U S D A F O R T H E 2 1 S T C E N T U R Y
Agency Program Corrective Actions
On March 9, 2015, FNS announced the expansion of the “Team Up for School Nutrition Success Initiative,” which provides training, technical assistance, and peer-to-peer mentorship opportunities to school food service professionals.
FNS issued a revised Offer Versus Serve (OVS) Manual in July 2015.
Granted an extension for the use of funds to help State agencies implement new meal pattern requirements in May 2015.
Will require training for schools on certification and accountability issues. This training will be ongoing through FY 2016.
In FY 2016, $4 million will be made available to State agencies for ART grants to implement training and technology solutions to reduce and prevent administrative errors in LEAs that are at high risk for such errors. The request for applications will be released in early 2016, and grants will be awarded in the summer of 2016.
FNS is completing a number of proposed rules that will serve to reduce improper payments by: o Mandating schools to post a summary of the administrative review
final results and make the information available to the public; this transparency requirement is estimated to be published in SY 2015-2016.
o Providing for fines for gross mismanagement and violating program requirements. An estimated publication date for the proposed rule is early FY 2016.
o Strengthening program compliance by prohibiting any school, institution, or individual that is terminated from one of the Child Nutrition Programs and on a list of disqualified institutions and individuals from participating in or administering any of the Child Nutrition Programs; an estimated publication date for the proposed rule is early FY 2016.
States not meeting the required 95 percent benchmark for direct certification rates with SNAP are required to develop and implement CIPs to describe the activities they will implement to reach more eligible children in future years. In FY 2016, FNS will provide technical assistance to the 41 States with CIPs resulting from school year 2013-2014 direct certification rates, as well as begin work with those States that did not meet the benchmark for school year 2014-2015.
Allowing States to apply for grants to help them improve their direct certification rates in FY 2016—October 2015, January 2016, April 2016, and July 2016 (if funds remain available). All grants under this request will be awarded by October 2016.
Conducting the School Nutrition and Meal Cost Study, an examination of the relationships between school environment and school food service operations, nutritional quality of meals offered and served in school meal programs, plate waste, costs to produce reimbursable meals, student participation, participant characteristics, satisfaction, and related attitudes toward the school lunch and breakfast programs. The primary data collection occurred in SY 2014-2015; a final report is due in early 2017.

F I S C A L Y E A R 2 0 1 5 A G E N C Y F I N A N C I A L R E P O R T
U . S . D E P A R T M E N T O F A G R I C U L T U R E 2 0 5
Agency Program Corrective Actions
High-Priority Program Discussion.
The SBP program has specifically tailored the corrective actions above to better reflect the unique processes, procedures, and risks of this high-priority program.
Current statutory authority allows USDA to recover improper payments from state agencies when identified through reviews, audits or other operational oversight activities. These improper payments are recovered through direct billing and offset of future program payments earned. Current statutory authority does not support collection of improper payments identified on the basis of a statistical sample or estimation procedure, as used to develop the national estimates of improper payments reported here.
FNS
Special Supplemental Nutrition Program for Women, Infants, and Children (WIC)
Root Cause #1: Administrative or Process Error made by Other Party.
FNS initiated focused ME Reviews in CE for all 90 WIC State agencies in FY 2015. As of June 15, 2015, 30 CE MEs have been initiated.
On March 13, 2015, FNS initiated a monthly Certification/Eligibility CE ME conference call with Regional Office staff to clarify certification/eligibility policy.
FNS will conduct ME Reviews in CE for all 90 WIC States agencies (October 2016).
FNS will conduct quarterly reviews of the CE Reviews to track milestones and identify areas where additional training, technical assistance and policy guidance is needed (November 2016).
FNS is preparing to issue Certification Guidance that will provide clarification of policy related to income, identity, and residency requirements in a single document. This document will provide easy reference for State and local agency use (September 2016).
FNS staff has conducted a series of vendor integrity training Webinars for regional offices to assist in oversight of WIC State agencies.
FNS will provide technical assistance to State agencies with weaknesses in the vendor management system (November 2016).
FNS will create a Vendor Management Handbook for regional offices to assist WIC State agencies (January 2016).
FNS will assess the data collected from WIC State agencies on vendor monitoring and compliance activity (July 2016).
FSA, CCC Loan Deficiency Payments (LDP)
LDP had no outlays in FY 2014; however, the following corrective actions were taken, or are planned, to reduce future improper payments:
FSA issued Notice LP-2200, Additional Requirements for crop year 2014 LDPs and Market Loan Gains, which included a one-page table listing specific eligibility requirements and the form(s) required. Action completed on October 6, 2014.
FSA issued Notice CN-1051, Processing Cotton Loan Redemptions and LDP Requests, on October 6, 2014. This notice highlighted additional information on processing LDP requests for cotton, including as follows:

S E C T I O N I I I | O T H E R I N F O R M A T I O N
2 0 6 C R E A T I N G A U S D A F O R T H E 2 1 S T C E N T U R Y
Agency Program Corrective Actions
Eligibility under the Adjusted Gross Income (AGI) provisions;
Payment limitation requirements; and
Announcement of an interim Web-based system for monitoring and tracking LDPs and market loan gains with respect to producer eligibility and payment limitation.
FSA issued Notice LP-2202, FY 2014 National County Operations Review Program (CORP) Review for Improper Payments for Marketing Assistance Loans (MAL), on December 3, 2014. This notice:
Updated and required a detailed LDP checklist to be completed by each employee for the first 5 LDPs they process each crop year; and
Required Web-based PowerPoint® training for all employees working with LDPs each crop year.
FSA issued Notice LP-2205, MAL and LDP Authority for Crop Years 2015 through 2018, on January 2, 2015. This notice:
Announced MAL and LDP policy changes published in the applicable Federal Register regulations.
Included an updated easy-to-follow one-page table of MAL and LDP eligibility requirements and the required form(s) for each.
FSA issued Handbook 2-LP Peanuts (Rev. 9)—Loans and Loan Deficiency Payments for Peanuts—Amendment 1, on March 17, 2015. Updated LDP policy applicable to 2015 crop year peanut LDPs.
Conducted Video Teleconference/Conference call with State Office (STO) Price support Specialists on MAL and LDP policy on April 28, 2015. Included an updated PowerPoint presentation for STOs to use when training their counties.
The following handbook amendments updating and further clarifying LDP policy were issued:
Marketing Assistance Loans and Loan Deficiency Payments for 2008 and Subsequent Crop Years—Amendment 12 on April 13, 2015.
o General LDP and MAL policy applicable for crop year 2015; and
o LDP and MAL producer eligibility requirements.
Issued Loans and Loan Deficiency Payments for Honey—Amendment 16, on May 12, 2015:
o Updated both LDP and MAL policy specific to 2015 crop year for honey.
Issued Loans and Loan Deficiency Payments for Rice—Amendment 25 on June 10, 2015:
o Updated both LDP and MAL policy specific to 2015 crop year for rice.
Issued Marketing Assistance Loans and Loan Deficiency Payments for 2008 and Subsequent Crop Years—Amendment 13 on June 19, 2015:
o Clarified LDP and MAL producer eligibility requirements.
Issued both Loans and Purchases (LP) and Cotton notices before possible crop year 2015 LDPs to remind employees of specific eligibility and processing requirements, August 2015.

F I S C A L Y E A R 2 0 1 5 A G E N C Y F I N A N C I A L R E P O R T
U . S . D E P A R T M E N T O F A G R I C U L T U R E 2 0 7
Agency Program Corrective Actions
Issued Cotton and Loan Deficiency Payments—Amendment 52, August 2015:
o Updated LDP and MAL policy specific to 2015 crop year for cotton.
Required training for county office employees before they process crop year 2015 LDPs; training was also made available to State offices, August 2015.
Actions planned to reduce improper payments for LDPs:
Will code eLoan Deficiency Program (eLDP) to read the Common Payment Software by summer, 2016. The Common Payment Software analyzes criteria to ensure that the producer is eligible for LDP before making a payment, in addition to keeping track of a producer’s payment limitation. Currently, county offices track LDPs disbursed to each producer using a manual process.
FSA, CCC Livestock Forage Disaster Program (LFP)
Root Cause #1: Administrative or Process Errors Made by Federal Agency.
A notice was issued in September 2015 to field offices to reinforce and outline program policies; payments are to be made on correct forage and livestock information, carrying capacities, and complete applications.
A CCC-770 LFP checklist form was developed for the District Director’s review of LFP applications to ensure that payment eligibility and documentation are correctly reviewed and documented and provided to the field in November 2015.
Root Cause #2: Inability to Authenticate Eligibility.
A notice was issued in September 2015 to field offices to reinforce policies on acceptable evidence that grazing land is owned or leased by a producer, and to emphasize that documentation must be filed before the application is approved.
Root Cause #3: Insufficient Documentation to Determine Eligibility.
A notice was issued in September 2015 to field offices to reinforce policies regarding documentation of eligibility for farm operation plans, acreage reports, and highly erodible land conservation and wetland conservation certifications, as well as documenting whether grazing land is owned or leased.
FSA, CCC Livestock Indemnity Program (LIP)
Root Cause #1 and #2: Administrative or Process Errors Made by Federal Agency and Insufficient Documentation to Determine.
A notice will be issued to field offices to reinforce program policies and procedures. Action completed in September 2015.
Developed an optional checklist for County Office employees to use prior to payment. County Executive Directors and District Directors may review/spot-check the completed checklist to help identify apparent internal control deficiencies and address training needs to reduce future errors. Action completed in October 2015.

S E C T I O N I I I | O T H E R I N F O R M A T I O N
2 0 8 C R E A T I N G A U S D A F O R T H E 2 1 S T C E N T U R Y
Agency Program Corrective Actions
Compliance reviews and spots-checks will be completed by County Offices and results will be recorded in the National Compliance Review database. Action expected to be completed in December 2015.
National Office will analyze the National Compliance Review results to identify program policy and procedures that need to be reinforced. Action expected to be completed in January 2016.
FSA, CCC Supplemental Revenue Assistance Payments (SURE) Program
Root Cause #1 and #2: Administrative or Process Errors Made by Federal Agency and Insufficient Documentation to Determine.
The Supplemental Revenue Assistance Payments (SURE) Program was authorized under the 2008 Farm Bill, and eligibility was limited to those disaster events occurring through September 30, 2011. SURE was not reauthorized under the Agricultural Act of 2014, also known as the 2014 Farm Bill.
Registration for SURE ended August 29, 2014, and no applications have been accepted since then. Future activity will be limited to activity from appeals or litigation. In FY 2015, only 183 SURE payments totaling $3.9 million were issued, which reflects a significant decrease in program activity. We do not anticipate the error rate spike under SURE will have an impact on other programs because those programs are implemented under a fully integrated software process minimizing data entry errors.
The National Office sent a directive to all State and county offices reminding employees of the importance of second-party reviews and verification of data, prior to finalizing any carry over payment activity. In addition to second-party reviews conducted by the county office, all carry over payment activity will require the District Director’s initials prior to payment, thus holding them accountable for accurate payments. This action was completed in September 2015.
No further actions are planned to reduce improper payments, since the authority for the SURE Program has expired.
FSA, CCC Noninsured Crop Disaster Assistance Program (NAP)
Root Cause #1: Administrative or Process Error Made by Federal Agency.
National Farm Bill training modules were delivered to State offices the week of November 3–7, 2014. State Offices were required to deliver the modules to county offices by January 30, 2015.
The NAP handbook was rewritten to clarify policy and procedure, and to include new provisions authorized by the 2014 Farm Bill. Handbook 1-NAP, Revision 2, was issued to field offices on February 20, 2015.
A National NAP Notice was issued to field offices to reinforce current program policies and procedures on August 31, 2015.
Root Cause #2: Insufficient Documentation.
National Farm Bill training modules were delivered to State offices the week of November 3–7, 2014. State Offices were required to deliver the modules to county offices by January 30, 2015.

F I S C A L Y E A R 2 0 1 5 A G E N C Y F I N A N C I A L R E P O R T
U . S . D E P A R T M E N T O F A G R I C U L T U R E 2 0 9
Agency Program Corrective Actions
The NAP handbook was revised to clarify policy and procedure, and to include new provisions authorized by the 2014 Farm Bill. Handbook 1-NAP, Revision 2, was issued to field offices on February 20, 2015.
A National NAP Notice was issued to field offices to reinforce current program policies and procedures by July 31, 2015.
Acreage Reporting Target Reviews will be conducted by CORP staff to mitigate improper payments caused by errors related to county office acreage reporting activities by December 31, 2015.
The NAP Basic Provisions, which provide producers with the terms and conditions for program participation and payment eligibility, will be revised to clarify producer responsibilities by December 31, 2015.
A customer training package will be developed to educate producers on NAP recordkeeping requirements and introduce them to a NAP tool to collect data for production reporting by December 31, 2015.
FNS Child and Adult Care Food Program (CACFP)
Root Cause # 1: Family Day Care Homes (FDCH) improper payments are caused by sponsor error in determining a participating home’s reimbursement tier (tiering error) and/or by FDCH error in reporting the number of meals that are eligible for reimbursement (claiming error).
FNS issued policy memos intended to minimize meal counting and claiming errors, thus decreasing improper payments.
On April 22, 2015, FNS provided an overview to State Agencies on the new CACFP policies, CACFP meal pattern proposed rule, Paperwork Reduction Report for Congress, Team Nutrition updates and resources, and CACFP monitoring issues.
Continued Management Evaluations in FYs 2015 and 2016–FNS Regional offices are in the process of conducting management evaluations of State agencies, to ensure State agency compliance with Program regulations in HHFKA.
A proposed rule, Providing Child Nutrition Program Integrity, will be published in early FY 2016. This rule will provide additional CACFP audit funding, making additional monies available to State agencies for Program improvement.
Improper Payments in CACFP Centers—this study will provide a comprehensive measure of the level of erroneous payments (dollars and rates) to child care centers and center sponsors participating in CACFP. The estimated completion date for the study is late 2019.
The CACFP Family Day Care Homes Meal Claims Feasibility Study will examine ways to measure erroneous payments to FDCHs (meal claims portion) participating in CACFP. The estimated completion date for the study is late 2017.

S E C T I O N I I I | O T H E R I N F O R M A T I O N
2 1 0 C R E A T I N G A U S D A F O R T H E 2 1 S T C E N T U R Y
Agency Program Corrective Actions
RD Rental Assistance Program (RAP)
Root Cause #1: Administrative or Process Error Made by Other Party.
RD State Office staff is required to follow up on each instance of error found in the audit and either: (1) obtain appropriate supporting documentation for the subsidy amount paid, or (2) begin recovery of unauthorized assistance amounts. Action completed November 1, 2015.
The agency will meet with key industry groups to discuss audit findings. Action completed November 1, 2015.
Root Cause #2: Insufficient Documentation to Determine.
RD State Office staff is required to follow up on each instance of error found in the audit and either: (1) obtain appropriate supporting documentation for the subsidy amount paid, or (2) begin recovery of unauthorized assistance amounts. Action completed November 1, 2015.
RMA Federal Crop Insurance Corporation (FCIC) Program Fund
Root Cause #1: Inability to Authenticate Eligibility.
RMA issued an Informational Memorandum to the AIPs reminding them of the Crop Insurance Handbook language that encourages production be measured prior to feeding. Action completed November 15, 2015.
Root Cause #2: Failure to Verify Other Eligibility Data.
Develop acreage reporting (June 2016)
o RMA will review data on the acreage reported to the Farm Service Agency (FSA).
o Cross-check the RMA and FSA databases noting any differences in acreage reporting.
o Check producers with very large differences (greater than 100 acres) between acreage reported to FSA and what was reported to RMA.
o The list will be provided to the AIPs for further review and reconciliation, as necessary.
Land Classification (June 2016)
o RMA will evaluate the feasibility of using data mining information on high-risk land locations to create an automated edit to identify policies with potential misreported risk levels.
Root Cause #3: Administrative or Process Errors Made by Other Party.
RMA will use the new National Program Operations Review (NPOR) process to evaluate the training material used by the AIPs, and to see if it addresses the common errors that were identified. RMA is redesigning the NPOR process with an expected completion date of June 2016.

F I S C A L Y E A R 2 0 1 5 A G E N C Y F I N A N C I A L R E P O R T
U . S . D E P A R T M E N T O F A G R I C U L T U R E 2 1 1
Agency Program Corrective Actions
High-Priority Program Discussion. The Federal crop insurance program is a self-certification program where participants certify as to the correctness of information (acres, share, production, etc.) as a basis for program participation. This information may be subject to further review and verification. Errors and improper payments are due to program participants’ (producers, companies, agents, and/or loss adjusters) failure to correctly interpret, provide, and/or process information in accordance with policy and procedures for determining eligibility and payment amounts.
The strategy for identifying and controlling these routine errors includes taking actions to address and correct each one in the appropriate manner, utilizing data mining techniques and identifying error trends and policy concerns, and providing instructions to the approved insurance companies to correct them or implement controls to correct them.
RMA is aware of the self-certification aspect of the program and the potential vulnerabilities it presents, but is confident the coordination with AIPs and policyholders will limit the risk associated with this regulatory barrier.
RMA’s strategy to recover improper payments is to use data mining to identify potential errors, research the discrepancies, and collect any amounts due from the insurance companies.
NRCS Farm Security and Rural Investment Act Programs (FSRIP)
Root Cause #1: Failure to Verify Other Eligibility Data. The deployment of the National Service Delivery Teams, specifically
the National Accounts Payable Service Team in January 2015, implemented standardized procedures for the direct entry of easement obligations that included checklists and verification of the DUNS/SAM requirements.
A standardized procedure for reviewing payments related to prior-year contracts was issued. Action was completed in September 2015.
The Easement Programs Division (EPD) reminded program staff of the SAM registration requirements, with an emphasis on restoration agreements. Action was completed on September 30, 2015.
ProTracts will check SAM.gov registrations automatically at obligation and payment. Proposed completion date is December 31, 2015.
Root Cause #2: Error Made by State Agency. Nationwide implementation of the Enhanced Internal Controls Group
took place in January 2015. The group was formed primarily to address improper payments, specifically, easement value, landowner eligibility, agreement validity, easement obligation, and payment documentation. As a new process was implemented nationally, EPD initiated bi-weekly Q&A sessions to discuss the enhanced internal controls process, checklists, review timing, and National Easement Staging Tool (NEST) functions.
EPD holds a monthly online conference for State easement coordinators and program managers that conduct the 1st and 2nd level reviews. The Internal Controls Team has also implemented bi-weekly Q&A sessions that began in January 2015.

S E C T I O N I I I | O T H E R I N F O R M A T I O N
2 1 2 C R E A T I N G A U S D A F O R T H E 2 1 S T C E N T U R Y
Agency Program Corrective Actions
EPD conducted training on reducing improper payments. Action was completed in September 2015.
EPD conducted nationwide training and teleconferences. Documenting ownership length was covered as a specific topic. Action was completed in October 2015.
FSA, CCC Hurricane Sandy—Emergency Conservation Program
Root Cause #1: Administrative or Process Error Made Federal Agency.
Individual counsel was provided via telephone by the Program Manager to the State office identified as causing improper payments. Action was completed in April 2015.
FSA plans to conduct national conservation program training in late 2015. Topics will include ECP, EFRP, and the importance of issuing proper payments.
FSA, CCC Hurricane Sandy—Emergency Forest Restoration Program
Root Cause #1: Administrative or Process Error Made Federal Agency.
Individual counsel was provided via telephone by the Program Manager to the State office identified as causing improper payments. Action was completed in April 2015.
FSA plans to conduct national conservation program training in late 2015. Topics will include ECP, EFRP, and the importance of issuing proper payments.
FS Hurricane Sandy—Emergency Forest Restoration Program
No improper payments were discovered.
FS Hurricane Sandy—Capital Improvement and Maintenance
Root Cause # 1: Administrative or Process Error Made by Other Party; Cooperator failed to properly charge the Forest Service for the appropriate amount. Cooperator failed to understand the requirements of transparent corrections when overcharging the Forest Service on an invoice.
Recommended an adjustment to move the expenditure charged on the Hurricane Sandy Fund CMDF to the proper fund for Trails Maintenance CMTL. An adjustment was completed by the agency for the $8,278.00 expenditure originally billed to the Hurricane Sandy job code. Completed on June 30, 2015.
Washington Office Acquisition Management will release a letter reminding Grants and Agreements Specialists of their responsibility to properly review invoices. To be completed by December 2015.
Audit and Assurance will conduct a training in February 2016 to reiterate the roles and responsibilities of the FS for grants and agreements management and recipients.

F I S C A L Y E A R 2 0 1 5 A G E N C Y F I N A N C I A L R E P O R T
U . S . D E P A R T M E N T O F A G R I C U L T U R E 2 1 3
Agency Program Corrective Actions
NRCS Hurricane Sandy—Emergency Watershed Protection Program
No improper payments were discovered.
Internal Control Over Improper Payments
As shown in Table 15 below, USDA programs have implemented internal controls to prevent
improper payments, but there is room for improvement. USDA programs are enhancing
communication of updated policies and guidance to the field offices, having managers build an
atmosphere in which reducing improper payments is a top priority, and establishing
accountability through performance standards, examining root causes of error, developing
appropriate corrective actions, and engaging critical stakeholders through communication and
educational efforts.
USDA issued guidance in May, 2015 requiring justifications for three or four ratings. The
guidance also required programs to propose new internal controls to resolve the deficiency for all
ratings of one or two.
Table 15: Status of Internal Controls
Program
Internal Control Standards
Control Environment
Risk Assessment
Control Activities
Information and Communication
Monitoring
Supplemental Nutrition Assistance Program (SNAP), FNS
3 3 3 3 3
National School Lunch Program (NSLP), FNS
3 3 3 3 3
School Breakfast Program (SBP), FNS 3 3 3 3 3
Special Supplemental Nutrition Program for Women, Infants, and Children (WIC), FNS
3 3 3 3 3
Loan Deficiency Payments (LDP), FSA/CCC 4 3 3 4 4
Livestock Forage Disaster Program (LFP), FSA/CCC
4 3 3 4 4
Livestock Indemnity Program (LIP), FSA/CCC
2 3 3 4 3

S E C T I O N I I I | O T H E R I N F O R M A T I O N
2 1 4 C R E A T I N G A U S D A F O R T H E 2 1 S T C E N T U R Y
Program
Internal Control Standards
Control Environment
Risk Assessment
Control Activities
Information and Communication
Monitoring
Supplemental Revenue Assistance Payments Program (SURE), FSA/CCC
3 2 3 3 3
Noninsured Crop Disaster Assistance Program (NAP), FSA/CCC
4 3 3 4 4
Child and Adult Care Food Program (CACFP), FNS
3 3 3 3 3
Rental Assistance Program (RAP), RD 3 2 3 3 3
Federal Crop Insurance Corporation (FCIC) Program Fund, RMA
3 3 3 2 2
Farm Security and Rural Investment Act Programs (FSRIP), NRCS
3 3 2 3 3
Hurricane Sandy—Emergency Conservation Program, FSA/CCC
4 3 3 4 4
Hurricane Sandy—Emergency Forest Restoration Program, FSA/CCC
4 3 3 4 4
Hurricane Sandy—Emergency Forest Restoration Program, FS
3 3 3 3 3
Hurricane Sandy—Capital Improvement and Maintenance, FS
3 3 3 3 3
Hurricane Sandy—Emergency Watershed Protection Program, NRCS
3 3 3 3 3
Legend:
4 = Sufficient controls are in place to prevent improper payments.
3 = Controls are in place to prevent improper payments, but there is room for improvement.
2 = Minimal controls are in place to prevent improper payments.
1 = Controls are not in place to prevent improper payments.
Accountability
The following steps were taken to ensure that agency managers are held accountable for reducing
and recovering improper payments:
FOOD AND NUTRITION SERVICE (FNS)
1. FNS has established corporate priorities to improve stewardship of Federal funds and to
improve program management. Within these priorities are specific goals applicable to
programs at high risk for erroneous payments. The goal for SNAP, NSLP, SBP, WIC, and
CACFP is to continue management improvements. The agency goals and priorities are
F I S C A L Y E A R 2 0 1 5 A G E N C Y F I N A N C I A L R E P O R T
U . S . D E P A R T M E N T O F A G R I C U L T U R E 2 1 5
incorporated into each manager’s performance plan. Standards for meeting reduction
targets and establishing and maintaining sufficient internal controls have been incorporated
into each manager’s plan since 2005.
2. In NSLP and SBP, USDA has a strategic objective to improve nutrition assistance program
management that is managed by FNS, including a measure to improve the accuracy of
school administrative processes that certify children for school meals. As part of its actions
to advance this objective, FNS sets annual priority goals and initiatives, including specific
goals applicable to programs at high risk for erroneous payments. These agency goals and
priorities are incorporated into each manager’s performance plan. Standards for meeting
reduction targets and establishing and maintaining sufficient internal controls have been
incorporated into each manager’s plan since 2005.
3. FNS has a corporate priority to maintain a high standard of integrity in SNAP. This priority
includes specific goals to support achievement of error rate goals, to use multiple strategies
to support payment accuracy even as program participation increases, and to participate
actively in efforts related to the President’s Executive Order on Improper Payments. The
agency goals and priorities are incorporated into each manager’s performance plan.
Standards for meeting reduction targets and establishing and maintaining sufficient internal
controls have been incorporated into each manager’s plan since 2005.
FARM SERVICE AGENCY (FSA)
1. FSA has a performance management program in place to improve individual and
organizational effectiveness in accomplishing the agency's mission and goals. This
program provides for improper payments to be included in the State Executive Director
(SED) Performance Plan, Element 5, titled “Program Management.” National, State, and
county office employees are also held accountable.
2. The Deputy Administrator of Field Operations (DAFO) facilitates meetings with the
program areas to discuss any additional action necessary for senior management to address
accountability.
3. FSA provides training on improper payments to field personnel and educates them on the
importance of control procedures as well as the potential risks of noncompliance.
4. Compliance reviews and spot-checks are required to ensure the accuracy of payments and
integrity of FSA programs. Annually, based on a statistical sampling method, producers
nationwide are selected for compliance review and spot-check.
RURAL DEVELOPMENT (RD)
1. State Office Directors, staff managing RAP, and program managers’ performance plans
include appropriate performance elements regarding the Improper Payments Information
Act of 2002 (IPIA) and recovery of unauthorized assistance.

S E C T I O N I I I | O T H E R I N F O R M A T I O N
2 1 6 C R E A T I N G A U S D A F O R T H E 2 1 S T C E N T U R Y
2. The Deputy Administrator of Multi-Family Housing Programs continues to facilitate
monthly meetings with State and area office program areas to discuss action necessary to
address accountability and program administration with regard to improper payments and
unauthorized assistance.
3. The national staff performance plans contain position-corresponding mission-area strategic
goals and priorities, and are incorporated into each manager’s performance plan. Field
offices must conduct supervisory visits on Section 515 and Section 514 properties every
5 years. These visits include the review of tenant files to verify income and calculation of
qualified rental assistance. In addition, RD headquarters staff conducts a Management
Control Review every 5 years for RAP.
RISK MANAGEMENT AGENCY (RMA)
1. RMA senior accountable officials’ annual performance plans are tied to Goal #4 of the
Strategic Plan—“Safeguarding the integrity of the FCIP.” The performance measure is to
reduce the improper payment rate from 5.23% in 2013 to 4.9% by 2018.
2. RMA incorporated standards in FY 2015 annual performance plans to ensure compliance
personnel conduct IPERA reviews to measure the FCIP improper payment error rate and
perform data mining reviews to identify, reduce, and collect improper payments.
3. RMA also incorporated standards in the performance plans to promote a strong control
environment over the prevention, detection, and recovery of improper payments to make
certain compliance personnel do the following:
a. Conduct national program operation reviews to determine whether insurance
companies are complying with their insurance agreements;
b. Issue findings and final determination reports, and provide sanctions to reinsured
companies based on evidence of not adhering to policy, procedures, agreements,
contracts, and ethical insurance principles; and
c. Follow up on recoveries of monetary findings in a timely manner.
NATURAL RESOURCES CONSERVATION SERVICE (NRCS)
Since FY 2013, State Conservationists’ performance plans include specific language regarding
the prevention, identification, and recovery of improper payments.

F I S C A L Y E A R 2 0 1 5 A G E N C Y F I N A N C I A L R E P O R T
U . S . D E P A R T M E N T O F A G R I C U L T U R E 2 1 7
FOREST SERVICE (FS)
Management will be made aware of improper payments, and will be held accountable for
reduction and recoveries of improper payments. FS Handbook 6500-2012-1, Chapter 6540.44
directs managers and payment staff to manage and monitor payment policies in accordance with
direction issued by the Chief Financial Officer, and to provide an appropriate control
environment that prevents, detects, and recovers improper payments. The Forest Service utilizes
IPIA statistical testing and the Quarterly-High Dollar Report to detect improper payments. These
analytics assist in identifying the number and dollar value of improper payments that have been
identified and recovered. In addition, dissemination of audit findings and identification of root
causes ensure management’s awareness. Quarterly monitoring and corrective actions will
improve accountability, identification, and resolution of improper payments.
AGENCY INFORMATION SYSTEMS AND OTHER INFRASTRUCTURE
FNS
1. CACFP does not have an infrastructure or methods for producing yearly estimates of
improper payment rates and dollar values. FNS is developing measurement methodologies
for one component of the program that will yield measurement of risk of improper
payments for that component.
CACFP payments and claim information are transferred between FNS, State agencies,
program sponsors and program sites; each transaction represents a risk for improper
payment. Because requirements vary significantly for each different type of program
sponsor and site, a full and rigorous assessment of the rate of improper payments is
extremely complex.
FNS did not have the resources to develop a measurement approach for erroneous
payments in CACFP, and therefore, submitted their initial request for resources in the
FY 2006 budget. The original plan was to develop a program-wide study to examine
reimbursements for meals served and develop program error measurements that complied
with the requirements of the Improper Payments Information Act of 2002 (IPIA). Because
of the complexities of the program, FNS estimated that it would cost $20 million to
measure improper payments at the precision required by IPIA. Although the FY 2006
budget request included funds designated for the nationally representative CACFP
erroneous payments study, funds were not provided by Congress.
FNS awarded a contract in September 2014 to conduct a new CACFP study to look at
alternative methodologies for developing a reliable measurement for the meal claims
component. This new study was completed September 30, 2016.
2. The NSLP does not have an administrative infrastructure for producing yearly estimates of
improper payment rates and dollar values. FNS uses its periodic Access, Participation,
Eligibility, and Certification (APEC) study to provide a baseline error rate estimate and an

S E C T I O N I I I | O T H E R I N F O R M A T I O N
2 1 8 C R E A T I N G A U S D A F O R T H E 2 1 S T C E N T U R Y
aging methodology to update this estimate annually using program administrative data and
macroeconomic indicators. FNS has worked with OMB to provide an annual estimate
using an approved methodology to estimate payment errors. The continuance of the APEC
study will enable FNS to estimate and measure changes in erroneous payments over time
and would help inform FNS, Congress, the States, and advocacy partners for the
development of additional guidance, training, and policy options.
3. The FNS FY 2016 Budget requests an increase in funding for the following program
integrity line items to establish and maintain effective internal controls to reduce improper
payments as follows:
a. Training and Technical Assistance
b. CN Payment Accuracy
CN Training and Technical Assistance—an increase of $12.1 million was requested
($8,137,000 enacted for FY 2015). Effective and continual training and technical assistance
are necessary to help States properly administer the Child Nutrition program to ensure that
States are equipped to identify and prevent fraud and abuse. This is especially critical
because of the changes made to these vital programs by the Healthy, Hunger-Free Kids Act
of 2010, which reauthorized these programs and instituted new requirements on State
agencies. This request reflects an increase in Federal activity associated with this project,
including implementation of the new requirements.
CN Payment Accuracy—an increase of $658,000 was requested ($9,904 million enacted
for FY 2015). Robust Federal oversight, monitoring, and technical assistance are essential
to the identification, prevention, and resolution of erroneous payments. This request
supports FNS’ efforts to reduce erroneous payments through training, technical assistance,
and oversight. An increase of $500,000 is related to an Enhanced State/Local Reporting
proposal.
FNS’ FY 2016 Budget reflects the same level of funding as in previous years to continue
effective internal control measures to promote program integrity for the Coordinated
Review Effort.
Coordinated Review Effort—$10 million was provided for training and technical assistance
for State agencies responsible for reviewing local school food authorities that participate in
the school meal programs. Local administrative reviews help ensure that school children
are offered meals that meet regulatory standards and that the financial claims associated
with those meals are appropriate.
FSA
During FY 2014, FSA was under a hiring freeze in response to agency funding and budget
limitations. The outside hiring restrictions resulted in staffing reductions in FSA State- and
county-level offices. The staff reductions with no corresponding reduction in FSA program
workload and servicing responsibilities could have contributed to increased improper payments.

F I S C A L Y E A R 2 0 1 5 A G E N C Y F I N A N C I A L R E P O R T
U . S . D E P A R T M E N T O F A G R I C U L T U R E 2 1 9
As new staff was able to be hired after the hiring freeze was lifted, required training in program
responsibilities and procedures was provided to new employees; however, full performance of
new employees takes time, and the lack of full program knowledge may have also contributed to
improper payments.
While FSA continues to modernize and enhance its IT systems, the transition from the legacy
systems to the Web-based platform has been challenging. With the rapid implementation of the
2014 Farm Bill programs and the numerous organizational changes necessary to adopt new and
modernized technologies, FSA’s ability to integrate new business requirements and modernized
IT was limited. However, significant improvements are being made in IT and business
operations and processes, as well as the stabilization of new and enhanced systems and IT
platforms supporting the delivery of farm programs. The ability to continue making investments
in upgrading systems is a key factor that will provide for more efficient business tools to support
FSA employees in their daily operations, i.e. improving the accuracy of customer records and
reducing improper payments through automated validation.
RD
Internal Controls
RD has internal controls and implements them through several avenues.
1. Multi-Family Housing (MFH) field staff in RD State and area offices performs supervisory
visits triennially at each multi-family property. The supervisory visit consists of reviewing
the practices and performance of property managers, including intake applications,
calculation of subsidy, proper application of deductions from tenant income, and review of
documentation to support the tenant’s income claims. Property managers are responsible
for obtaining and verifying this information. The MFH staff conducts a review of randomly
selected tenant files to check for documentation; staff also conducts a mini-IPIA audit of
those selected files to identify any improper payment, and to ensure compliance with the
collection of unauthorized assistance.
2. RD ensures quality-control reviews of all mandated reporting. Additionally, RD ensures
that the reviews are completed by an office separate from the processing and reporting
office. The RD Office of the Chief Financial Officer (CFO), National Financial and
Accounting Operations Center (NFAOC), and Internal Control and Initiatives Staff (ICIS)
complete all quality-control reviews.
a. Quarterly—Improper Payment Recoveries Report
i. The NFAOC cash reporting and servicing staff is responsible for RD collection
processing. RD improper payment recoveries are deposited with the
U.S. Department of the Treasury and agency collection records are reconciled
daily. Treasury deposit files are loaded to the automated accounting system that
stores the Recovery Audit (RA) improper payment receivables, and recoveries are
posted daily. NFAOC executes the quarterly Improper Payment Recovery Report
from the automated accounting system. The NFAOC internal control staff
provides quality control reviews and requests signoff from the RD CFO.

S E C T I O N I I I | O T H E R I N F O R M A T I O N
2 2 0 C R E A T I N G A U S D A F O R T H E 2 1 S T C E N T U R Y
b. Quarterly—High-Dollar Overpayment Report
i. Criteria—FY 2015—increased to $25,000 for any individual reporting.
ii. Completed by National Office—based on information from the Multi-Family
Information System (MFIS).
The NFAOC internal control staff provides quality-control reviews and requests
signoff from the RD CFO.
c. Annually—Conduct Statistical Sampling
i. RD’s Centralized Servicing Center (which handles MFH payments) reviews the
documentation.
ii. National Office prepares the report and identifies corrective actions.
iii. The NFAOC internal control staff provides quality-control reviews and requests
signoff from the RD CFO.
d. FY 2015—First received access to Treasury’s Do Not Pay Portal
i. Used the portal to review tenants selected for the annual statistical sampling (IPIA
audit).
3. The Rental Assistance Program payments are managed by NFAOC, through an electronic
portal used by borrowers and property managers. Borrowers and managers are required to
provide monthly information on tenant incomes and subsidy calculations, and to advise RD
if tenants move in or out. The automated system checks for changes and, if all appropriate
changes have been submitted, the payment is authorized directly to NFAOC. If appropriate
changes have not been submitted, the Centralized Servicing Center, which provides cash
management services to MFH, reviews the documentation and contacts the
borrower/manager for corrections before a payment will be authorized. This automated
process handles about 95 percent of all payments, while the human intervention is minimal
and is only required when the system flags a submission.
4. The Rental Assistance Program staff will partner with the Treasury Department in late
FY 2015 to educate Treasury staff about the Rental Assistance program and to engage in
group discussions about process improvements.
Human Capital
MFH has about 250 field offices around the country that are responsible for monitoring borrower
and management agent performance and compliance with loan requirements. MFH has staff
members who are assigned a portfolio of multiple States. Staff works with a program director
that is responsible for overseeing and monitoring performance of area loan specialists at the State
office. Loan specialists work one-on-one with borrowers and management agents to ensure they
understand the program requirements. If unauthorized assistance is detected, on the part of either
the manager or the tenant, loan specialists follow established procedure to recover funds. The
NFAOC servicing area has about 3 staff members who establish and monitor receivables and

F I S C A L Y E A R 2 0 1 5 A G E N C Y F I N A N C I A L R E P O R T
U . S . D E P A R T M E N T O F A G R I C U L T U R E 2 2 1
provide support to field and national offices, and 2 staff members who provide quality-control
reviews.
Information Systems
Information systems currently in use by MFH include the Multi-Family Information System
(MFIS) database, the Automated Multi-Family Accounting System (AMAS), the Management
Interactive Network Connection (MINC), and the Commercial Loan Servicing System (CLSS).
MFIS houses all of the multi-family property and tenant data; AMAS maintains all accounting
records of financial transactions; MINC is the submission portal used by borrowers and
management agents to provide MFH with monthly updates on tenancy and financial reporting;
and CLSS is the automated accounting system for processing financial transactions and servicing
loans, grants, and miscellaneous receivables such as improper payment receivables. MFH works
closely with the IT staff and NFAOC staff to upgrade and improve the MFIS, AMAS, and CLSS
systems. Field staff also use these systems to monitor property performance and use the Change
Control Board (CCB), which is the formal mechanism to suggest system changes. All system
upgrades are approved by the CCB; after testing, but before production, changes must be
approved by users in order to ensure proper functionality.
In FY 2015, all RA improper payment receivable accounts were converted to the CLSS
automated accounting system. CLSS provides automated financial transactions, a wide range of
servicing abilities, automated system edits, and reporting. Additionally, the CLSS system
provides for delinquency tracking and Treasury debt reporting. Monthly, the NFAOC staff
monitor receivable balances and send delinquent accounts to Treasury to begin debt collection
procedures.
RMA
1. Due to the high-risk nature of RMA crop insurance programs under IPERIA, ensuring that
improper payment rates are lowered is a high priority. Additional information and analysis
on the root causes of improper payments will help RMA target effective corrective actions
and implement preventive measures. RMA is collecting this information to develop trends
and design potential cost-effective preventive controls by the end of FY 2016.
2. Effective detection techniques to identify and recover improper payments are also
important. RMA performs data mining activities to deter and identify improper payments.
RMA will continue to use data mining to target examination of payments that can be
recaptured, and will explore other ways to expand these reviews.
3. RMA performs the National Program Operations Review (NPOR) as one of its primary
tools for assessing AIP’s compliance with all crop insurance program requirements. RMA
contracted with a business consultant to assist in the redesign of RMA’s AIP operations
reviews to more effectively evaluate the AIP’s internal controls and identify and address
program vulnerabilities. The contract will end in May 2016. Before completion of the
contract, the contractor will assist RMA in the development of standardized guidelines that
the Regional Compliance Offices (RCOs) will use to conduct operations reviews

S E C T I O N I I I | O T H E R I N F O R M A T I O N
2 2 2 C R E A T I N G A U S D A F O R T H E 2 1 S T C E N T U R Y
consistently across the regions. The consultant will also provide RMA with an updated
Compliance Manual.
4. The 2016 Budget includes a request for $2.3 million in salaries and expenses to enhance
RMA’s compliance efforts, with an emphasis on testing and reporting improper payments,
in response to recent Office of Inspector General and Government Accountability Office
recommendations. The overall objective of the additional funding is to reduce RMA’s
improper payment rate through enhanced validation and improved process (such as error
rate sampling) and oversight.
NRCS
Manual and information system internal control changes have been identified; most of them will
be implemented by the end of 2015. In addition, NRCS is in the process of reorganizing its
administrative functions, standardizing processes, and adding staff in accounting and other
administrative functions. This is a multi-year effort that began in FY 2013 and will continue for a
number of years.
FS
The following needed improvements have been identified:
Capital Improvement and Maintenance (CMDF)
1. Recommended an adjustment to move the expenditure charged on the Hurricane Sandy
Fund CMDF to the proper fund for Trails Maintenance CMTL. An adjustment was
completed by the agency for the $8,278.00 expenditure originally billed to the Hurricane
Sandy job code. Completed on June 30, 2015.
2. Washington Office Acquisition Management will release a letter reminding Grants and
Agreements Specialists of their responsibility to properly review invoices. To be completed
by December 2015.
3. Audit and Assurance will conduct a training in February 2016 to reiterate the roles and
responsibilities of the FS for grants and agreement management and recipients.

F I S C A L Y E A R 2 0 1 5 A G E N C Y F I N A N C I A L R E P O R T
U . S . D E P A R T M E N T O F A G R I C U L T U R E 2 2 3
Barriers
FNS
Federal nutrition assistance was not designed with accuracy as its primary purpose;
accountability is often a secondary consideration to other concerns in managing the program.
Some policy choices, many embodied in law, greatly impact the risk of improper payments and
the ability to mitigate them. Congress, through legislation, defines the limits of authority for
accountability.
In many instances the mandated goal of providing easy access to benefits must be balanced
against the goal of reducing improper and erroneous payments. Provisions that improve access
can increase the risk of improper payments. While the risks involved vary by program, some
general characterizations can be made:
Program administration is highly decentralized and can involve a myriad of governmental and
non-governmental organizations. For example, there are approximately 58,403 child and adult
care centers, 824 FDCH-sponsoring organizations, and approximately 117,621 FDCH providers
through which benefits are distributed. Many of these simply do not have the capacity to develop
robust accountability processes, which puts a special burden on Federal and State oversight and
technical assistance systems.
States and localities tend to focus on managing local funds, rather than Federal funds. One
hundred percent of benefit costs and a significant portion of administrative expenses incurred by
State agencies are funded by Federal appropriations. Although this distribution of costs has
contributed to the strength of the nutrition safety net with national eligibility standards and
program access, States and localities may reasonably be expected to put a higher priority on
managing programs funded with local revenues than those subsidized by the Federal
government.
Proper implementation of nutrition assistance programs requires a high degree of accuracy. This
accuracy helps to ensure that benefits are targeted to those most in need, that there is uniformity
of access across the country, and that benefits can only be used for food. Such exacting standards
do, however, create a significant number of opportunities for error.
Recent Child Nutrition reauthorization legislation, while it did include some changes requested
by the Administration to improve accountability, limited USDA’s ability to act in this area
because of concerns about potential barriers to participation. In many instances, the mandated
goal of providing easy access to benefits must be balanced against the goal of reducing improper
and erroneous payments. In addition, program administration is highly decentralized; there are
approximately 100,000 school meals locations at which benefits are provided. Many of these
benefit providers simply do not have the capacity to develop robust accountability processes. For
these reasons, any approach to reducing school meals improper payments must:
S E C T I O N I I I | O T H E R I N F O R M A T I O N
2 2 4 C R E A T I N G A U S D A F O R T H E 2 1 S T C E N T U R Y
1. Improve accuracy without compromising access for low-income families. A process that
keeps eligible children from participating would undermine the program;
2. Not unduly increase burden on schools. Many schools consider the program burdensome
now. Adding burden could discourage schools from participating;
3. Be cost effective. Improving accuracy is potentially resource-intensive, and policymakers
must not create a process that increases net program costs; and
4. Answer the needs of other users of program data, which often use certification data to
distribute millions of dollars in other kinds of benefits to schools. As these needs contribute
to the problem, a solution may also require new commitments from those users.
In SNAP, the 2002 Farm Bill restricted the liability levels States can be sanctioned due to high
error rates and also restricted the amount of bonus funding available to States that do a good job
reducing and maintaining a low error rate. The goal of providing easy access to benefits must be
balanced with the goal of reducing improper and erroneous payments.
FSA
A key barrier that limits FSA's ability to recover improper payments is the Department of
Agriculture Reorganization Act of 1994, Section 281. This legislation provides that ""Each
decision of a State, County, or area committee or an employee of such a committee, made in
good faith in the absence of misrepresentation, false statement, fraud, or willful misconduct shall
be final not later than 90 calendar days after the date of filing of the application for benefits,
[and] ... no action may be taken ... to recover amounts found to have been disbursed as a result of
the decision in error unless the participant had reason to believe that the decision was erroneous."
This statute is commonly referred to as the Finality Rule.
RD
The agency does not have the statutory authority similar to the U.S. Department of Housing and
Urban Development (HUD) to gain access to the U.S. Department of Health and Human
Services (HHS) Directory of New Hires, IRS, SSI, or DOL data to share with field offices and
management agents. Having these resources would better enable borrowers and management
agents to confirm and verify income information from tenants, on whose behalf Rental
Assistance subsidy is provided. The Department submitted the legislation to seek access to the
New Hires database as part of the FY 2015 budget submission.
RMA
RMA is not subject to any critical statutory or regulatory barriers to reducing improper
payments.

F I S C A L Y E A R 2 0 1 5 A G E N C Y F I N A N C I A L R E P O R T
U . S . D E P A R T M E N T O F A G R I C U L T U R E 2 2 5
NRCS
Currently, NRCS is working with FSA to implement a real-time adjusted gross income
verification process. This will allow NRCS to verify whether a producer meets the program’s
Adjusted Gross Income requirements prior to obligating a contract.
Furthermore, NRCS’ improper payment issues due to entities not registering in SAM.gov should
be greatly reduced based on new functionality in ProTracts which allows it to communicate
directly with SAM.gov. With this change, NRCS is able to use this data source during the pre-
award and pre-payment processes to help reduce improper payments.
A majority of the errors identified in the annual testing are related to the failure of participants to
register in SAM.gov, as required, prior to receiving payment.
FS
FS has not identified any statutory or regulatory barriers that would limit corrective actions in
reducing improper payments.
Recapture of Improper Payments Reporting
USDA recaptured approximately $2 million from its recovery audit contractors, and
$382 million outside of payment recapture audits during FY 2015. Detailed results are shown in
Table 16 USDA conducted limited-scope pilot payment recapture audits, as recommended by
OMB in Circular A-123 Appendix C. These pilot payment recapture audits are complete with the
following results:
1. USDA recovered and distributed $2.6 million as shown in Table 17;
2. Based on the success of the Supplier Credit Recovery Audit contract, USDA expanded the
contract to include commodity contracts in addition to the administrative contracts it was
already auditing; and
3. In FY 2016, the Department will require all programs over $1 million in annual
expenditures to perform recovery auditing, or provide justification that recovery auditing
would not be cost effective.
Of USDA's total of 148 programs and activities evaluated for improper payments in FY 2015,
128 of them had over $1 million in annual expenditures or were conducting recovery auditing.
The Rental Assistance Program conducted program recovery auditing through a recovery audit
contract. Fifty-six programs participated in the Supplier Credit Recovery audit. A detailed list of
programs by category follows.

S E C T I O N I I I | O T H E R I N F O R M A T I O N
2 2 6 C R E A T I N G A U S D A F O R T H E 2 1 S T C E N T U R Y
SUPPLIER CREDIT RECOVERY AUDIT PROGRAMS
1. AMS Salaries and Expenses
2. APHIS Salaries and Expenses
3. CCC Export 416 Ocean Transportation
4. CCC Food for Progress Program
5. CR Salaries and Expenses
6. DA Agriculture Buildings and Facilities
7. DA Biobased Markets Program
8. DA Hazardous Materials Management
9. FAS McGovern-Dole Food for Education Grants
10. FFAS Salaries and Expenses
11. FNS Child and Adult Care Food Program
12. FNS Commodity Supplement Food Program
13. FNS The Emergency Food Assistance Program
14. FNS Food Distribution Program on Indian Reservations
15. FNS National School Lunch Program
16. FNS Program Administration
17. FNS Summer Food Service Program
18. Food Safety and Inspection Salaries and Expenses
19. FSA Public Law 480
20. FS Capital Improvement and Maintenance
21. FS Forest and Rangeland Research
22. FS Forest Service Permanent Appropriations
23. FS Forest Service Trust Funds
24. FS Land Acquisition
25. FS Management of National Forest Lands for Subsistence Uses
26. FS National Forest System
27. FS Range Betterment Fund
28. FS Salaries and Expenses
29. FS SmartPay

F I S C A L Y E A R 2 0 1 5 A G E N C Y F I N A N C I A L R E P O R T
U . S . D E P A R T M E N T O F A G R I C U L T U R E 2 2 7
30. FS State and Private Forestry
31. FS Stewardship Contracting Product Sales
32. FS Wildland Fire Management
33. FS Wildland Fire Management—Suppression
34. FS Working Capital Fund
35. Grain Inspection Packers and Stockyards Administration
36. NAD Salaries and Expenses
37. NRCS Conservation Technical Assistance (non-Farm Bill)
38. NRCS Farm Bill Financial Assistance
39. NRCS Farm Bill Technical Assistance
40. NRCS Plant Materials Centers
41. NRCS Salaries and Expenses
42. NRCS Snow Survey and Water Supply Forecasting
43. NRCS Soil Surveys
44. NRCS Voluntary Public Access and Habitat Incentive Program
45. NRCS Watershed Programs
46. OBPA Salaries and Expenses
47. OCE Salaries and Expenses
48. OCFO Salaries and Expenses
49. OCIO Salaries and Expenses
50. OGC Salaries and Expenses
51. OIG Salaries and Expenses
52. OSEC Salaries and Expenses
53. RD Salaries and Expenses
54. RD Voucher Program (Section 542)
55. RD Water and Waste Disposal Systems for Rural Communities-Loans
56. REE Salaries and Expenses

S E C T I O N I I I | O T H E R I N F O R M A T I O N
2 2 8 C R E A T I N G A U S D A F O R T H E 2 1 S T C E N T U R Y
PROGRAMS AND ACTIVITIES OVER ONE MILLION NOT CURRENTLY CONDUCTING RECOVERY AUDITS
1. AMS Commodity Purchase Programs
2. AMS Grants Programs
3. APHIS Buildings and Facilities
4. APHIS Cooperative Agreements
5. APHIS Trust Funds
6. ARS Buildings and Facilities
7. CCC Administrative Contracts
8. CCC Biomass Crop Assistance Program
9. CCC Conservation Reserve Program
10. CCC Dairy Indemnity
11. CCC Emergency Assistance for Livestock, Honeybees, and Farm Raised Fish Program
12. CCC Emergency Forestry Conservation Reserve
13. CCC Export Guarantee Program Level
14. CCC Farm Storage Facility Loan
15. CCC Hazardous Waste Activities
16. CCC Livestock Forage Disaster Program
17. CCC Livestock Indemnity Program
18. CCC Loan Deficiency Payments
19. CCC Marketing Assistance Loan Program
20. CCC Marketing Programs
21. CCC Noninsured Assistance Program
22. CCC Supplemental Revenue Assistance Payments Program
23. CCC Tobacco Transition Payment Program
24. CCC Tree Assistance Program
25. CCC Upland Cotton Economic Adjustment Assistance Program
26. FNS American Samoa
27. FNS Commonwealth of the Northern Mariana Islands
28. FNS Farmers Market Nutrition Program

F I S C A L Y E A R 2 0 1 5 A G E N C Y F I N A N C I A L R E P O R T
U . S . D E P A R T M E N T O F A G R I C U L T U R E 2 2 9
29. FNS Nutrition Assistance—Puerto Rico
30. FNS School Breakfast Program
31. FNS Senior Farmers Market Nutrition Program
32. FNS Special Milk Program
33. FNS Supplemental Nutrition Assistance Program
34. FNS Women, Infants, and Children
35. FSA Agricultural Credit Insurance Fund—Program Account
36. FSA Hurricane Sandy—Emergency Conservation Program
37. FSA State Mediation Grants
38. FSIS Cooperative State Food Safety and Inspection
39. NIFA Community Foods Project
40. NIFA Extension Activities
41. NIFA Integrated Activities
42. NIFA Research and Education Activities
43. OAO Outreach for Socially Disadvantaged Farmers
44. RD Broadband Telecom Loans—Treasury Rate
45. RD Community Connect Grants
46. RD Community Program Grants
47. RD Congressional Earmarked Funds
48. RD Direct Community Facility Loans
49. RD Direct Single Family Housing
50. RD Electric Loan Programs (CFDA 10.850)—FFB Guaranteed
51. RD Guaranteed Community Facility Loans
52. RD Guaranteed Multi-Family Housing Loans (Section 538 Loans)
53. RD Guaranteed Single Family Housing Loans
54. RD Housing Loans and Grants—Other
55. RD MFH Preservation and Revitalization Demo Program: 514/516 Loans/Grants and
515 Loans
56. RD Public Television Digital Transition Grants
57. RD RBS Grant Programs
58. RD RBS Guaranteed Loan Programs

S E C T I O N I I I | O T H E R I N F O R M A T I O N
2 3 0 C R E A T I N G A U S D A F O R T H E 2 1 S T C E N T U R Y
59. RD RBS Payment Programs
60. RD RBS Relending Programs
61. RD Rural Community Development Initiative Grants
62. RD Rural Rental Housing Loans (Section 515 Direct Rural Rental Housing Loans)
63. RD Rural Telecommunications Hardship Loans—Direct Telecom Loans
64. RD Rural Telecommunications Loans—FFB Telecom Loans
65. RD Rural Telecommunications Loans—Treasury Telecom Loans
66. RD Rural Utilities Electric Program—Direct 5%
67. RD RUS Grants—Other Electric—Telecom—WEP
68. RD Water and Waste Disposal Loans and Grants Section 306C
69. RD Water and Waste Disposal Systems for Rural Communities—Grants
70. RD Water and Waste Guaranteed Loans
71. RMA Federal Crop Insurance Corporation Program Fund
USDA implemented Treasury’s Web-based Invoice Processing Platform in FY 2015. This new
invoicing process should reduce the duplicate payments and unused credits discovered by
USDA’s Supplier Credit Recovery Audit contract.

FISCAL YEAR 2015 AGENCY FINANCIAL REPORT
U . S . D E P A R T M E N T O F A G R I C U L T U R E 2 3 1
Table 16: Improper Payment Recaptures With and Without Audit Programs ($ in millions)
Overpayments Recaptured Through Payment Recapture Audits
Program or Activity
Contracts Benefits Overpayments Recaptured Outside
of Payment Recapture Audits
Am
ou
nt
Ide
nti
fie
d
Am
ou
nt
Re
cove
red
CY
Re
cap
ture
Am
ou
nt
CY
+1
Re
cap
ture
Rat
e T
arge
t
CY
+2
Re
cap
ture
Rat
e T
arge
t
Am
ou
nt
Ide
nti
fie
d
Am
ou
nt
Re
cove
red
CY
Re
cap
ture
Am
ou
nt
CY
+1
Re
cap
ture
Rat
e T
arge
t
CY
+2
Re
cap
ture
Rat
e T
arge
t
Am
ou
nt
Ide
nti
fie
d
Am
ou
nt
Re
cove
red
Rental Assistance Program $0.00 $0.00 $0.00 0% 0% $0.00 $0.00 100% 100% 100% $0.00 $0.00
Supplier Credit Recovery Audit Program $2.05 $2.05 100% 100% 100% $0.00 $0.00 $0.00 $0.00 $0.00 $0.00 $0.00
Programs Not Currently Conducting Recovery Audits $0.00 $0.00 $0.00 $0.00 $0.00 $0.00 $0.00 $0.00 $0.00 $0.00 $0.00 $0.00
Overpayments Recaptured Outside of Payment Recapture Audits $0.00 $0.00 $0.00 $0.00 $0.00 $0.00 $0.00 $0.00 $0.00 $0.00 $428.36 $382.32
USDA Total $2.05 $2.05 100% 100% 100% $0.00 $0.00 $0.00 100% 100% $428.36 $382.32

S E C T I O N I I I | O T H E R I N F O R M A T I O N
2 3 2 C R E A T I N G A U S D A F O R T H E 2 1 S T C E N T U R Y
Table 17: Disposition of Funds Recaptured Through Payment Recapture Audit
Program or Activity
Amount Recovered
Type of Payment
Agency Expenses to Administer
the Program
Payment Recapture
Auditor Fees
Financial Management Improvement
Activities
Original Purpose
Office of Inspector General
Returned to Treasury
Other*
Rental Assistance Program
$0.00 Benefit $0.00 $0.01 $0.00 $0.00 $0.00 $0.00 $0.00
Supplier Credit Recovery Audit Program*
$2.05 Contract $0.00 $0.57 $0.28 $0.81 $0.06 $0.28 $0.05
Programs Not Currently Conducting Recovery Audits
$0.00 N/A $0.00 $0.00 $0.00 $0.00 $0.00 $0.00 $0.00
Overpayments Recaptured Outside of Payment Recapture Audits
$0.00 N/A $0.00 $0.00 $0.00 $0.00 $0.00 $0.00 $0.00
USDA Total $2.05 $0.00 $0.58 $0.28 $0.81 $0.06 $0.28 $0.05
*The Other amounts are funds that have been recovered but have not yet completed the disposition process.

F I S C A L Y E A R 2 0 1 5 A G E N C Y F I N A N C I A L R E P O R T
U . S . D E P A R T M E N T O F A G R I C U L T U R E 2 3 3
Table 18: Aging of Outstanding Overpayments Identified in the Payment Recapture Audits ($ in millions)
Program or Activity
Type of Payment
Amount Outstanding
(0– 6 months)
Amount Outstanding
(6 months to 1 year)
Amount Outstanding
(over 1 year)
Amount Determined
to Not Be Collectable
Rental Assistance Program
Benefit $0.00 $0.00 $0.039 $0.00
Supplier Credit Recovery Audit Program*
Contract $0.00 $0.00 $0.00 $0.00
Programs Not Currently Conducting Recovery Audits
N/A $0.00 $0.00 $0.00 $0.00
Overpayments Recaptured Outside of Payment Recapture Audits
N/A $0.00 $0.00 $0.00 $0.00
TOTAL $0.000 $0.000 $0.039 $0.000
Additional Comments
No additional comments.
Do Not Pay Initiative
The Do Not Pay (DNP) Initiative is an effort to reduce the frequency of improper payments
made by the U.S. Government through the use of improper payment verification databases.
These databases include:
Credit Alert Interactive Voice Response System (CAIVRS)
Death Master File (DMF)
Debt Check Database
List of Excluded Individuals/Entities (LEIE)
System for Award Management (SAM)/ Excluded Parties List System (EPLS)

S E C T I O N I I I | O T H E R I N F O R M A T I O N
2 3 4 C R E A T I N G A U S D A F O R T H E 2 1 S T C E N T U R Y
These databases are available via direct access, and some are of these databases are available
through the Treasury DNP Business Center DNP Portal. The databases offered and functionality
of the Treasury DNP Portal varies between agency and program needs and requirements. While
the number of databases in the DNP Portal has expanded in 2015, access is still being processed.
USDA’s use of these databases can be categorized as follows:
1. Contracts, Grants, Cooperative Agreements, and insurance programs are verified against
System for Award Management (SAM Exclusion) at pre-award.
2. Loans are verified against the Credit Alert System or Credit Alert Interactive Verification
Reporting System, SAM Exclusion, and Debt Check at pre-award.
3. Some USDA programs and activities validate payments and awards against the Death
Master File, such as:
a. Risk Management Agency, pre-award.
b. The Farm Service Agency, which verifies at pre-payment.
4. USDA programs don’t use the List of Excluded Individuals/Entities of the Office of
Inspector General of the Department of Health and Human Services, or the Prisoner Update
Processing System of the Social Security Administration.
5. Finally, Treasury matches the Payment Integration Processes against DMF and
SAM Exclusion databases in the DNP Portal. USDA agencies conduct post-payment
adjudication.
Table 19: Implementation of the Do Not Pay Initiative to Prevent Improper Payments
Nu
mb
er
(#)
of
pay
me
nts
revi
ew
ed
fo
r p
oss
ible
imp
rop
er
pay
me
nts
Do
llars
of
pay
me
nts
revi
ew
ed
fo
r p
oss
ible
imp
rop
er
pay
me
nts
(In
Mill
ion
s)
Nu
mb
er
(#)
of
pay
me
nts
sto
pp
ed
Do
llars
of
pay
me
nts
sto
pp
ed
(In
Mill
ion
s)
Nu
mb
er
(#)
of
po
ten
tial
imp
rop
er
pay
me
nts
revi
ew
ed
an
d
de
term
ine
d a
ccu
rate
Do
llars
($
) o
f p
ote
nti
al
imp
rop
er
pay
me
nts
revi
ew
ed
an
d
de
term
ine
d a
ccu
rate
(In
Mill
ion
s)
Reviews with the Death Master File
26,075,734 $59,274 0 $0 26,075,272 $59,273
Reviews with SAM.gov
26,075,734 $59,274 0 $0 26,075,723 $59,274
Data gathered October 1, 2014 through June 30, 2015.

F I S C A L Y E A R 2 0 1 5 A G E N C Y F I N A N C I A L R E P O R T
U . S . D E P A R T M E N T O F A G R I C U L T U R E 2 3 5
Inspector General Act Amendments of 1988: Management’s Report on Audit Follow Up
Background
The Inspector General Act Amendments of 1988 (P.L. 100-504), require that each agency head
submit semi-annual reports to Congress on the actions taken in response to Office of Inspector
General (OIG) audit, evaluation, and inspection reports. Consistent with the Reports
Consolidation Act of 2000 (P.L. 106-531), the U.S. Department of Agriculture’s (USDA) Office
of the Chief Financial Officer (OCFO) consolidates and annualizes the required semi-annual
Inspector General Act Amendments’ reporting elements for inclusion in the annual Agency
Financial Report.
OIG audits USDA’s programs, systems, and operations. It then recommends improvements to
management based on its findings. USDA management may agree or disagree with the audit’s
findings or recommendations. An agreement is reached during the management-decision process.
If management agrees with a recommendation, a written plan for corrective action with a target
completion date is developed. The plan is then submitted to OIG for concurrence. If both OIG
and management agree that the proposed corrective action will correct the weakness, a
management decision is concluded for that recommendation.
Audit follow-up ensures that prompt and responsive action is taken. USDA’s OCFO oversees
audit follow-up for the Department. An audit remains open until all corrective actions for each
recommendation are completed. As agencies complete planned corrective actions and submit
closure documentation, OCFO reviews the submitted documentation for sufficiency and
determines if final action needs to be completed.
Fiscal Year Results (as of July 31, 2015)
USDA agencies closed 28 audits in fiscal year (FY) 2015. As of July 31, 2015, OIG and USDA
agencies reached management decisions on 25 audits. As shown in the following exhibit, the
Department’s inventory of open audits decreased in FY 2015 by 3 percent from 91 to 88.

S E C T I O N I I I | O T H E R I N F O R M A T I O N
2 3 6 C R E A T I N G A U S D A F O R T H E 2 1 S T C E N T U R Y
Exhibit 26: Open Audit Inventory
0
20
40
60
80
100
120
140
160
FY2011 FY2012 FY2013 FY2014 FY2015
96
124
106
91 88
Open Audit Inventory
Note: The FY 2014 ending balance was revised from 81 to 91 to include 9 audits transmitted
from the Office of Inspector General after the reporting period as well as one audit that was
erroneously omitted. These adjustments are also reflected in the beginning balances for audits
with disallowed costs (DC) shown in Exhibit 26 and Exhibit 28.
Audit Follow-Up Process
The Inspector General Act Amendments of 1988 require an annual report to Congress providing
the status of resolved audits that remain open. Resolved audits are those for which management
decision has been reached for all recommendations. Reports on resolved audits must include the
elements listed in the bullets below (see Exhibit 27 for definitions):
Beginning and ending balances for the number of audit reports and dollar value of
disallowed costs (DC) and funds to be put to better use (FTBU);
The number of new management decisions reached;
The disposition of audits with final action;
Resolved audits that remain open one year or more past the management decision date and
require an additional reporting element; and
The date issued, dollar value, and an explanation of why final action has not been taken.

F I S C A L Y E A R 2 0 1 5 A G E N C Y F I N A N C I A L R E P O R T
U . S . D E P A R T M E N T O F A G R I C U L T U R E 2 3 7
Exhibit 27: Audit Follow-Up Definitions
Term Definition
Disallowed Cost (DC)
An incurred cost questioned by the Office of Inspector General (OIG) that management has agreed should not be chargeable to the Government.
Final Action An action that management has agreed will address the audit findings and recommendations when completed.
Funds To Be Put to Better Use (FTBU)
An OIG recommendation that funds could be used more efficiently if management completes the recommendation, including:
Reductions in outlays or other savings;
Deobligation of funds from programs or operations, or the withdrawal of subsidy costs on loans, guarantees, or bonds; and
Implementation of recommended improvements for grants or contracts, or unnecessary expenditures noted in pre-award reviews of contracts or grant agreements.
Management Decision
Agreement between management and OIG on corrective action needed to address audit findings and recommendations.
Beginning and Ending Inventory for Audits with Disallowed Costs and Funds to Be Put to Better Use
Of the 28 audits that achieved final action during the fiscal year, 8 contained disallowed
costs (DC). The number of DC audits remaining in the inventory at the end of the fiscal year
is 23, with a monetary value of $108,912,671. See Exhibit 28 below.
Exhibit 28: Inventory of Audits with Disallowed Costs
Audits with Disallowed Costs (DC) # of Audits Amount ($)
Beginning of the Period (October 2014) 25 $109,433,447
Plus: New Management Decisions 6 $8,973,936
Total Audits Pending Collection of DC 31 $118,407,383
Adjustments (see Exhibit 29) $2,715,728
Revised Subtotal $115,691,655
Less: Final Actions (Recoveries) 8 $6,778,984
Audits with DC Requiring Final Action at the End of the Period (July 2015) 23 $108,912,671
Exhibit 28 and Exhibit 30 include only those open audits with DC and FTBU, respectively. Additionally, some audits contain
both DC and FTBU amounts. For these reasons, the number of audits shown as the ending balances in Exhibit 28 and Exhibit 30
does not equal the total resolved audit inventory balance in Exhibit 26. Beginning balance in Exhibit 28 was adjusted to include
two audits with DC that were transmitted from OIG after the July 31, 2014 reporting period and one audit that was erroneously omitted.

S E C T I O N I I I | O T H E R I N F O R M A T I O N
2 3 8 C R E A T I N G A U S D A F O R T H E 2 1 S T C E N T U R Y
As shown in Exhibit 28 above, for DC audits that achieved final action in FY 2015, OIG and
management agreed to collect $9,494,712. Adjustments were made totaling $2,715,728
(29 percent of the total) for the following reasons: (1) documentation; (2) write-offs; (3) appeals;
and (4) agency discovery. Management recovered the remaining $6,778,984.
Exhibit 29: Distribution of Adjustments to Disallowed Cost
Category Amount ($)
Documentation $1,114,618
Write-offs $1,465,831
Appeals $153,565
Agency Discovery ($18,286)
Total $2,715,728
Final action occurred on 2 audits that involved FTBU amounts. The number of FTBU audits
remaining in the inventory to date is 16, with a monetary value of $749,694,002 (see Exhibit 30).
Exhibit 30: Inventory of Audits with Funds to Be Put to Better Use (FTBU)
Audits with FTBU # of Audits Amount ($)
Beginning of the Period 12 $726,306,381
Plus: New Management Decisions 6 $50,208,818
Total Audits Pending 18 $776,515,199
Less: Final Actions 2 $26,821,197
Audits with FTBU Requiring Final Action at the End of the Period 16 $749,694,002
Disposition of FTBU:
FTBU Implemented $26,821,197
FTBU Not Implemented 0
Total FTBU Amounts for Final Action Audits $26,821,197
Exhibit 28 and Exhibit 30 include only those open audits with DC and FTBU, respectively. Additionally, some audits contain
both DC and FTBU amounts. For these reasons, the number of audits shown as the ending balances in Exhibit 28 and Exhibit
30 do not equal the total resolved audit inventory balance in Exhibit 26. Beginning balance in Exhibit 30 was adjusted to include three audits with FTBU that were transmitted from OIG after the July 31, 2014 reporting period.

F I S C A L Y E A R 2 0 1 5 A G E N C Y F I N A N C I A L R E P O R T
U . S . D E P A R T M E N T O F A G R I C U L T U R E 2 3 9
The number of audits open one or more years without final action in FY 2015 decreased from
63 to 58 audits, or a 8 percent decrease. The 58 audits include 13 audits that reached one year
past management decision date during FY 2015. USDA agencies continue to pursue
compensating controls that address many of the underlying issues identified in these older audits.
Exhibit 31: Decrease in the Number of Audits Open One or More Years Past the Management Decision Date (MDD)
Audits One Year or More Past MDD # of Audits
Beginning of the period 63
Less: Audits closed 18
Subtotal FY 2015 audits one year or more past MDD 45
Plus: Audits that reached one year past MDD during FY 2015 13
Ending balance as of July 31, 2015 58
Agencies have completed all planned corrective actions on 12 audits that are pending collection
of associated DC (see Exhibit 32 below).
Exhibit 32: Distribution of Audits Open One Year or More Past the Management Decision Date (MDD)
Audits on Schedule Audits Behind Schedule Audits Under Collection
No. DC ($) FTBU ($) No. DC ($) FTBU ($) No. DC ($) FTBU ($)
3 $56,800 $0 43 $14,260,971 $656,354,294 12 $45,826,156 $3,810,087

S E C T I O N I I I | O T H E R I N F O R M A T I O N
2 4 0 C R E A T I N G A U S D A F O R T H E 2 1 S T C E N T U R Y
Management’s Report on Audit Follow-Up
Audits without final action one year or more past MDD, and behind schedule are listed
individually in Exhibit 33. The audits are categorized by agency and by reason final action has
not occurred. More detailed information on audits on-schedule, and audits under collection, is
available from OCFO.
Exhibit 33: Audits Open One Year or More Past the MDD, and Behind Schedule
Agricultural Marketing Service (AMS)
Audits Date
Issued
Revised Completion
Date Audit Title
Monetary Amount Pending by
Reason DC ($) FTBU ($)
01099-0001-21
1/28/2014 9/30/2016
Agricultural Marketing Service Oversight of the Beef Promotion and Research Board's Activities
$0 $0 Pending Internal Monitoring/ Program Reviews
01601-0002-32 7/15/2013 12/31/2015
National Organic Program—Organic Milk Operations
$0 $0 Pending Administrative Action
AMS Subtotal (2)
$0 $0
Animal and Plant Health Inspection Service (APHIS)
Audits Date
Issued
Revised Completion
Date Audit Title
Monetary Amount Pending by
Reason DC ($) FTBU ($)
50601-0008-TE
1/28/2005 12/31/2015
Controls over APHIS Issuance of Genetically Engineered Organisms Release Permits
$0 $0 Issuance of Policy Guidance and Legislation 50601-0016-
TE 5/31/2011 12/31/2015 Controls over Genetically Engineered Animal and Insect Research
$0 $0
APHIS Subtotal (2)
$0 $0

F I S C A L Y E A R 2 0 1 5 A G E N C Y F I N A N C I A L R E P O R T
U . S . D E P A R T M E N T O F A G R I C U L T U R E 2 4 1
Agricultural Research Service (ARS)
Audits Date
Issued
Revised Completion
Date Audit Title
Monetary Amount Pending by
Reason DC ($) FTBU ($)
50601-0006-TE
3/4/2004 12/31/2015 ARS Controls Over Plant Variety Protection and Germplasm Storage
$0 $0 Issuance of Policy Guidance and Legislation
50601-0010-AT
3/8/2004 12/31/2015
ARS Follow-Up Report on the Security of Biological Agents at U.S. Department of Agriculture Laboratories
$0 $0
ARS Subtotal (2)
$0 $0
Commodity Credit Corporation (CCC)
Audits Date
Issued
Revised Completion
Date Audit Title
Monetary Amount Pending by
Reason DC ($) FTBU ($)
06401-0020-FM
11/9/2005 12/31/2017 CCC’s Financial Statements for FY 2005 and 2004
$0 $0 Pending Administrative Action
CCC Subtotal (1)
$0 $0
Food and Nutrition Service (FNS)
Audits Date Issued Revised
Completion Date
Audit Title Monetary Amount
Pending by Reason DC ($) FTBU ($)
27002-0011-13
9/28/2012 12/31/2015
Analysis of FNS’ Supplemental Nutrition Assistance Program Fraud Prevention and Detection Efforts
$0 $0 Pending Administrative Action
27099-0049-TE
3/10/2008 10/31/2015
Disaster Food Stamp Program for Hurricanes Katrina and Rita in Louisiana, Mississippi, and Texas
$0 $0
Issuance of Policy Guidance and Legislation

S E C T I O N I I I | O T H E R I N F O R M A T I O N
2 4 2 C R E A T I N G A U S D A F O R T H E 2 1 S T C E N T U R Y
Audits Date Issued Revised
Completion Date
Audit Title Monetary Amount
Pending by Reason DC ($) FTBU ($)
27601-0001-23
1/3/2013 06/30/2016
National School Lunch Program-Food Service Management Company Contracts
$0 $0 Pending Administrative Action
27601-0012-SF
11/18/2011 7/31/2016
Review of Management Controls for the Child and Adult Care Food Program
$2,486,633 $0
Issuance of Policy Guidance and Legislation
27601-0016-AT
3/31/2008 12/31/2015 FNS Food Stamp Employment and Training
$0 $0
Issuance of Policy Guidance and Legislation
50601-0014-AT
8/16/2010 11/30/2015
Effectiveness and Enforcement of Suspension and Debarment Regulations
$0 $0 Pending Administrative Action
FNS Subtotal (6)
$2,486,633 $0
Office of Homeland Security and Emergency Coordination (OHSEC)
Audits Date Issued Revised
Completion Date Audit Title
Monetary Amount Pending by Reason DC ($) FTBU ($)
61701-0001-32
9/27/ 2013 12/31/2015 Classification Management
$0 $0 Pending Administrative Action
OHSEC Subtotal (1)
$0 $0
Forest Service (FS)
Audits Date
Issued
Revised Completion
Date Audit Title
Monetary Amount Pending by
Reason DC ($) FTBU ($)
08601-0055-SF 6/16/2011 12/31/2017 Forest Service Administration of Special Use Program
$0 $5,387,567
Issuance of Policy Guidance and Legislation
FS Subtotal (1) $0 $5,387,567

F I S C A L Y E A R 2 0 1 5 A G E N C Y F I N A N C I A L R E P O R T
U . S . D E P A R T M E N T O F A G R I C U L T U R E 2 4 3
Farm Service Agency (FSA)
Audits Date
Issued
Revised Completion
Date Audit Title
Monetary Amount Pending by
Reason DC ($) FTBU ($)
03601-0018-CH 8/10/2010 06/30/2016 Farm Loan Security $0 $0
Pending IT System Implementation and Enhancements
FSA Subtotal (1) $0 $0
Food Safety and Inspection Service (FSIS)
Audits Date
Issued
Revised Completion
Date Audit Title
Monetary Amount Pending by
Reason DC ($) FTBU ($)
24601-0001-31 5/9/2012 9/30/2015
Application of FSIS Sampling Protocol for Testing Beef Trim for E. coli O157:H7
$0 $0
Issuance of Policy Guidance and Legislation
24601-0001-41
5/9/2013 12/31/2015
Inspection and Enforcement Activities at Swine Slaughter Plants
$0 $0
24601-0003-31 3/22/2013 9/31/2015 E. coli Testing of Boxed Beef
$0 $0
50601-0006-HY
7/15/2009 6/30/2016
Assessment of USDA’s Controls to Ensure Compliance with Beef Export Requirements
$0 $0
Pending IT System Implementation and Enhancements
FSIS Subtotal (4)
$0 $0

S E C T I O N I I I | O T H E R I N F O R M A T I O N
2 4 4 C R E A T I N G A U S D A F O R T H E 2 1 S T C E N T U R Y
Natural Resources Conservation Service (NRCS)
Audits Date
Issued
Revised Completion
Date Audit Title
Monetary Amount Pending by
Reason DC ($) FTBU ($)
10099-0001-31 9/27/2013 3/31/2016
Natural Resources Conservation Service’s Administration of Easement Programs in Wyoming
$0 $0 Pending Administrative Action
10401-0003-11 12/9/2013 12/31/2015
Natural Resources Conservation Service’s Financial Statements for Fiscal Year 2013
$0 $0 Pending Administrative Action
10601-0001-31 7/24/2014 10/31/2015 Environmental Quality Incentives Program
$0 $0
Issuance of Policy Guidance and Legislation
10703-0001-AT 3/25/2013 10/01/2015 Recovery Act—Rehabilitation of Flood Control Dams
$0 $1,440,028 Pending Administrative Action
NRCS Subtotal (4)
$0 $1,440,028
Office of the Chief Financial Officer (OCFO)
Audits Date Issued Revised
Completion Date
Audit Title Monetary Amount
Pending by Reason DC ($) FTBU ($)
50024-0005-11 4/15/2014 12/30/2015
U.S. Department of Agriculture Improper Payments Elimination and Recovery Act of 2010 Compliance Review for Fiscal Year 2013
$0 $0 Pending Administrative Action
50401-0003-11 11/15/2012 9/30/2015
USDA’s Consolidated Financial Statements for FY 2011 and 2012
$0 $0
Pending Administrative Action
OCFO Subtotal (2) $0 $0

F I S C A L Y E A R 2 0 1 5 A G E N C Y F I N A N C I A L R E P O R T
U . S . D E P A R T M E N T O F A G R I C U L T U R E 2 4 5
Office of the Chief Information Officer (OCIO)
Audits Date Issued Revised
Completion Date
Audit Title Monetary Amount
Pending by Reason DC ($) FTBU ($)
50501-0001-IT
8/15/2011 11/30/2015
OCIO USDA’s Management and Security Over Wireless Handheld Devices
$0 $0 Pending Administrative Action
50501-0001-12
4/19/2012 9/30/2015
USDA’s Configuration, Management, and Security over Domain Name System Servers
$0 $0 Issuance of Policy Guidance
50501-0002-IT
11/19/2010 9/30/2015 OCIO FY 2010 Federal Information Security Management Act
$0 $0
Pending IT System Implementation and Enhancements
50501-0015-FM
11/18/2009 9/30/2016 OCIO FY 2009 Federal Information Security Management Act
$0 $0 Issuance of Policy Guidance
88401-0001-12
8/2/2012 9/30/2015
OCIO’s FY’s 2010 and 2011 Funding Received for Security Enhancements
$0 $0 Pending Administrative Action
OCIO Subtotal (5)
$0 $0

S E C T I O N I I I | O T H E R I N F O R M A T I O N
2 4 6 C R E A T I N G A U S D A F O R T H E 2 1 S T C E N T U R Y
Rural Development (RD)
Audits Date Issued Revised
Completion Date
Audit Title Monetary Amount
Pending by Reason DC ($) FTBU ($)
04601-0001-31
7/18/2014 12/31/2015
Rural Development: Single Family Housing Direct Loan Servicing and Payment Subsidy Recapture
$34,338 $0 Administrative Action
04601-0018-CH
9/27/2012 12/31/2015
Project Cost and Inspection Procedures for the Rural Rental Housing Program
$0 $0
Issuance of Policy Guidance and Legislation
09703-0001-22
3/26/2013 12/31/2015
Rural Utilities Service Controls Over Recovery Act Water and Waste Loans and Grants Expenditures and Performance Measures
$0 $454,355 Administrative Action
09703-0001-32
3/29/2013 12/31/2015
American Recovery and Reinvestment Act of 2009—Broadband Initiatives Program—Pre-Approval Controls
$0 $6,378,419 Administrative Action
09703-0002-22
8/14/2014 12/31/2015
Review of a Utility Company’s Use of RUS Financial Assistance
$0 $11,395,145 Administrative Action
09703-0002-32
8/22/2013 12/31/2015
American Recovery and Reinvestment Act of 2009—Broadband Initiatives Program—Post-Award Controls
$0 $150,503,439
34601-0015-TE
9/30/2003 12/31/2015
RBS National Report on the Business and Industry Loan Program
$0 $0
Issuance of Policy Guidance and Legislation

F I S C A L Y E A R 2 0 1 5 A G E N C Y F I N A N C I A L R E P O R T
U . S . D E P A R T M E N T O F A G R I C U L T U R E 2 4 7
Audits Date Issued Revised
Completion Date
Audit Title Monetary Amount
Pending by Reason DC ($) FTBU ($)
34703-0001-32
3/29/2013 12/31/2015
American Recovery and Reinvestment Act—Business and Industry Guaranteed Loans, Phase 3
$0 $0 Administrative Action
34703-0002-TE
12/5/2011 12/31/2015
American Recovery and Reinvestment Act—Business and Industry Guaranteed Loans, Phase 2
$0 $0
Issuance of Policy Guidance and Legislation
RD Subtotal (9)
$34,338 $168,731,358
Risk Management Agency (RMA)
Audits Date Issued Revised
Completion Date
Audit Title Monetary Amount
Pending by Reason DC ($) FTBU ($)
05401-0003-11
12/12/2013 9/30/2015
Financial Statements for Fiscal Years 2013 and 2012
$0 $0 Pending Administrative Action
05601-0001-31
9/03/2013 5/30/2016 Controls Over Prevented Planting
$0 $480,795,341
RMA Subtotal (1)
$480,795,341

S E C T I O N I I I | O T H E R I N F O R M A T I O N
2 4 8 C R E A T I N G A U S D A F O R T H E 2 1 S T C E N T U R Y
Multi - Agency
Audits Date
Issued
Revised Completion
Date Audit Title
Monetary Amount Pending by
Reason DC ($) FTBU ($)
50601-0002-31
7/31/2013
12/31/2015 (AMS)
1/30/2017 (FSIS)
FSIS’ and AMS’ Field-Level Workforce Challenges
$11,740,000 $0
Pending Administrative Action—AMS
Pending IT System Implementation and Enhancements—FSIS
Multi-Agency Subtotal (1)
$11,740,000 $0
Total Number Audits (43)
Total $14,260,971 $656,354,294

F I S C A L Y E A R 2 0 1 5 A G E N C Y F I N A N C I A L R E P O R T
U . S . D E P A R T M E N T O F A G R I C U L T U R E 2 4 9
Freeze the Footprint The USDA is implementing an OMB policy to “Freeze the Footprint” by committing to dispose
of excess properties held by the Federal Government and make more efficient use of the
Government’s real estate assets.
Exhibit 34: Freeze the Footprint Baseline Comparison
Square Footage (SF) In Millions
Fiscal Year 2012
Baseline 2014
Change
(2012–2014)
35.93 35.44 -1.35%
Exhibit 35: Reporting Of Operation and Maintenance Costs—Owned and Directly Leased Buildings
Operations and Maintenance (O&M) Costs (In Millions)
Fiscal Year 2012
Baseline 2014
Change
(2012–2014)
$615.87 $598.06 $-17.81
This data is available in the FY 2014 annual Federal Real Property Profile report submitted to
GSA and OMB.
More information about Federal Real Property can be in the FY 2014 annual Federal Real
Property Profile report.
USDA has issued an Agriculture Property Management Regulation (AGPMR No. 15-05)
providing policy and procedures for the Reduce the Footprint OMB space initiative. Starting in
2015, departments are to project their 5-year building footprint as well as outline their internal
controls for managing their footprint. The Department has set forth processes and procedures to
halt space needs at the FY 2012 baseline represented in the figure above.
USDA continues to support footprint reductions by identifying opportunities for disposal,
consolidation, and increased utilization of office and warehouse space. USDA is doing this by
the formation of the Space Utilization Management Council, with a mission to work with USDA
agencies and the General Services Administration (GSA) in developing and implementing
programs designated to realize increased space utilization. USDA has also created a Center of
Excellence (COE) for Leasing to concentrate on cost-saving efforts for the more than
3,000 direct leases. USDA partnered with GSA to develop a Corporate Portfolio Plan to identify

S E C T I O N I I I | O T H E R I N F O R M A T I O N
2 5 0 C R E A T I N G A U S D A F O R T H E 2 1 S T C E N T U R Y
opportunities for consolidation with other Federal agencies. A strategic sourcing initiative has
identified opportunities for integration and consolidation within USDA. USDA has updated
Departmental Regulation 1620-002, “USDA Space Management Policy”, to reflect a 150-square
foot per person utilization rate that is all-inclusive. These actions and continued focus are
examples of how USDA is managing the office and warehouse square footage at or below the
baseline FY 2012 totals.
Civil Monetary Penalties USDA maintains regulations regarding civil monetary policies at Title 7 of the Code of Federal
Regulations § 3.913. The Department is reviewing, updating, and making adjustments to the
penalties; however they will not be finalized and published in the Federal Register when the
Annual Financial Report is published in November 2015. The table below briefly describes the
penalty, under which authority, the dates of the previous and current adjustments, and current
penalty amount.
Exhibit 36: Civil Monetary Penalties
Penalty (Name of Penalty) Authority (Statute)
Date of Previous
Adjustment
Date of Current
Adjustment Current Penalty Level
($ Amount)
Improper recordkeeping; pesticides
7 U.S.C. 136i-1(d) 5/24/2005 4/7/2010 $750
Violation of the unfair conduct rule Perishable Agricultural Commodities Act, codified at 7 U.S.C. 499b(5)
5/24/2005 4/7/2010 $2,200
Violation of the licensing requirements
Perishable Agricultural Commodities Act, codified at 7 U.S.C. 499c(a)
5/24/2005 4/7/2010 $1,200 plus $350 a per day for as long as offence occurs or $350 for each non-willful offence
Violative transaction Perishable Agricultural Commodities Act, codified at 7 U.S.C. 499h(e)
5/24/2005 4/7/2010 $2,000
3 http://www.gpo.gov/fdsys/pkg/CFR-2011-title7-vol1/xml/CFR-2011-title7-vol1-sec3-91.xml

F I S C A L Y E A R 2 0 1 5 A G E N C Y F I N A N C I A L R E P O R T
U . S . D E P A R T M E N T O F A G R I C U L T U R E 2 5 1
Penalty (Name of Penalty) Authority (Statute)
Date of Previous
Adjustment
Date of Current
Adjustment Current Penalty Level
($ Amount)
Violation Export Apple Act, 7 U.S.C. 586
5/24/2005 4/7/2010 $110–$11,000
Violation Export Grape and Plum Act, codified at 7 U.S.C. 596
5/24/2005 4/7/2010 $110–$11,000
Violation of an order issued by the Secretary
Agricultural Adjustment Act, reenacted with amendments by the Agricultural Marketing Agreement Act of 1937, codified at 7 U.S.C. 608c(14)(B)
5/24/2005 4/7/2010 $1,100
Failure to file certain reports Agricultural Adjustment Act, reenacted by the Agricultural Marketing Agreement Act of 1937, codified at 7 U.S.C. 610(c)
5/24/2005 4/7/2010 $110
Violation of a seed program Federal Seed Act, codified at 7 U.S.C. 1596(b)
5/24/2005 4/7/2010 $37.50–$7,500
Failure to collect any assessment or fee for violation
Cotton Research and Promotion Act, codified at 7.U.S.C. 2112(b)
5/24/2005 4/7/2010 $1,100
Failure to obey a cease and desist order, or for deceptive marketing
Plant Variety Protection Act, codified at 7 U.S.C. 2568(b)
5/24/2005 4/7/2010 $750–$11,000
Failure to pay, collect, or remit any assessment or fee for a violation of a program
Potato Research and Promotion Act, codified at 7 U.S.C. 2621(b)(1)
5/24/2005 4/7/2010 $750–$7,500
Failure to obey a cease and desist order
Potato Research and Promotion Act, codified at 7 U.S.C. 2621(b)(3)
5/24/2005 4/7/2010 $750
Failure to pay, collect, or remit any assessment or fee or for a violation of a program
Egg Research and Consumer Information Act, codified at 7 U.S.C. 2714(b)(1)
5/24/2005 4/7/2010 $750–$7,500

S E C T I O N I I I | O T H E R I N F O R M A T I O N
2 5 2 C R E A T I N G A U S D A F O R T H E 2 1 S T C E N T U R Y
Penalty (Name of Penalty) Authority (Statute)
Date of Previous
Adjustment
Date of Current
Adjustment Current Penalty Level
($ Amount)
Failure to obey a cease and desist order
Egg Research and Consumer Information Act, codified at 7 U.S.C. 2714(b)(3)
5/24/2005 4/7/2010 $750
Failure to remit any assessment or fee or for a violation of a program
Beef Research and Information Act, codified at 7 U.S.C. 2908(a)(2)
5/24/2005 4/7/2010 $7,500
Failure to remit any assessment or for a violation of a program regarding wheat and wheat foods research
7 U.S.C. 3410(b) 5/24/2005 4/7/2010 $1,100
Failure to pay, collect, or remit any assessment or fee or for a violation of a program
Floral Research and Consumer Information Act, codified at 7 U.S.C. 4314(b)(1)
5/24/2005 4/7/2010 $7,500
Failure to obey a cease and desist order
Floral Research and Consumer Information Act, codified at 7 U.S.C. 4314(b)(3)
5/24/2005 4/7/2010 -$7,500
Violation of an order Dairy Promotion Program, codified at 7 U.S.C. 4510(b)
5/24/2005 4/7/2010 $1,100
[failure to] pay, collect, or remit any assessment or fee or for a violation
Honey Research, Promotion, and Consumer Information Act, codified at 7 U.S.C. 4610(b)(1)
5/24/2005 4/7/2010 $750–$7,500
Failure to obey a cease and desist order
Honey Research, Promotion, and Consumer Information Act, codified at 7 U.S.C. 4610(b)(3)
5/24/2005 4/7/2010 $750
Violation of a program Pork Promotion, Research, and Consumer Information Act of 1985, codified at 7 U.S.C. 4815(b)(1)(A)(i)
5/24/2005 4/7/2010 $1,100

F I S C A L Y E A R 2 0 1 5 A G E N C Y F I N A N C I A L R E P O R T
U . S . D E P A R T M E N T O F A G R I C U L T U R E 2 5 3
Penalty (Name of Penalty) Authority (Statute)
Date of Previous
Adjustment
Date of Current
Adjustment Current Penalty Level
($ Amount)
Failure to obey a cease and desist order
Pork Promotion, Research, and Consumer Information Act of 1985, codified at 7 U.S.C. 4815(b)(3)(A)
5/24/2005 4/7/2010 $750
Failure to pay, collect, or remit any assessment or fee or for a violation of a program
Watermelon Research and Promotion Act, codified at 7 U.S.C. 4910(b)(1)
5/24/2005 4/7/2010 $750–$7,500
Failure to obey a cease and desist order
Watermelon Research and Promotion Act, codified at 7 U.S.C. 4910(b)(3)
5/24/2005 4/7/2010 $750
Failure to pay, collect, or remit any assessment or fee or for a violation of a program
Pecan Promotion and Research Act of 1990, codified at 7 U.S.C. 6009(c)(1)
5/24/2005 4/7/2010 $1,100–$11,000
Failure to obey a cease and desist order
Pecan Promotion and Research Act of 1990, codified at 7 U.S.C. 6009(e)
5/24/2005 4/7/2010 $1,100
Failure to pay, collect, or remit any assessment or fee or for a violation of a program
Mushroom Promotion, Research, and Consumer Information Act of 1990, codified at 7 U.S.C. 6107(c)(1)
10/1/2011
4/7/2010 $750–$7,500
Failure to obey a cease and desist order
Mushroom Promotion, Research, and Consumer Information Act of 1990, codified at 7 U.S.C. 6107(e)
10/1/2011 4/7/2010 $750
Failure to pay, collect, or remit any assessment or fee or for a violation
Lime Research, Promotion, and Consumer Information Act of 1990, codified at 7 U.S.C. 6207(c)(1)
10/1/2011 4/7/2010 $750–$7,500
Failure to obey a cease and desist order
Lime Research, Promotion, and Consumer Information Act of 1990, codified at 7 U.S.C. 6207(e)
10/1/2011 4/7/2010 $750

S E C T I O N I I I | O T H E R I N F O R M A T I O N
2 5 4 C R E A T I N G A U S D A F O R T H E 2 1 S T C E N T U R Y
Penalty (Name of Penalty) Authority (Statute)
Date of Previous
Adjustment
Date of Current
Adjustment Current Penalty Level
($ Amount)
Failure to pay, collect, or remit any assessment or fee or for a violation of a program
Soybean Promotion, Research, and Consumer Information Act, codified at 7 U.S.C. 6307(c)(1)(A)
10/1/2011 4/7/2010 $1,100
Failure to obey a cease and desist order
Soybean Promotion, Research, and Consumer Information Act, codified at 7 U.S.C. 6307(e)
10/1/2011 4/7/2010 $7,500
Failure to pay, collect, or remit any assessment or fee or for a violation of a program
Fluid Milk Promotion Act of 1990, codified at 7 U.S.C. 6411(c)(1)(A) and 7 U.S.C. 6411(c)(1)(B)
10/1/2011 4/7/2010 Unwillful violation: $750–$7,500; willful violation: $11,000–$140,000
Failure to obey a cease and desist order
Fluid Milk Promotion Act of 1990, codified at 7 U.S.C. 6411(e)
10/1/2011 4/7/2010 $7,500
Knowingly labeling or selling a product as organic except in accordance with the Organic Foods Production Act of 1990
Organic Foods Production Act of 1990, codified at 7 U.S.C. 6519(a)
10/1/2011 4/7/2010 $11,000
Failure to pay, collect, or remit any assessment or fee or for a violation of a program
Fresh Cut Flowers and Fresh Cut Greens Promotion and Information Act of 1993, codified at 7 U.S.C. 6808(c)(1)(A)(i)
10/1/2011 4/7/2010 $750–$7,500
Failure to obey a cease and desist order
Fresh Cut Flowers and Fresh Cut Greens Promotion and Information Act of 1993, codified at 7 U.S.C. 6808(e)(1)
10/1/2011 4/7/2010 $7,500
Violation of a program Sheep Promotion, Research, and Information Act of 1994, codified at 7 U.S.C. 7107(c)(1)(A)
10/1/2011 4/7/2010 $1,100

F I S C A L Y E A R 2 0 1 5 A G E N C Y F I N A N C I A L R E P O R T
U . S . D E P A R T M E N T O F A G R I C U L T U R E 2 5 5
Penalty (Name of Penalty) Authority (Statute)
Date of Previous
Adjustment
Date of Current
Adjustment Current Penalty Level
($ Amount)
Failure to obey a cease and desist order
Sheep Promotion, Research, and Information Act of 1994, codified at 7 U.S.C. 7107(e)
10/1/2011 4/7/2010 $750
Violation of an order or regulation issued under the Commodity Promotion, Research, and Information Act of 1996
Commodity Promotion, Research, and Information Act of 1996, codified at 7 U.S.C. 7419(c)(1)
10/1/2011 4/7/2010 $1,200–$12,000 for each violation
Failure to obey a cease and desist order
Commodity Promotion, Research, and Information Act of 1996, codified at 7 U.S.C. 7419(e)
10/1/2011 4/7/2010 $1,200–$12,000
Violation of an order or regulation issued under the Canola and Rapeseed Research, Promotion, and Consumer Information Act, codified at 7 U.S.C. 7448(c)(1)(A)(i)
Canola and Rapeseed Research, Promotion, and Consumer Information Act, codified at 7 U.S.C. 7448(c)(1)(A)(i)
10/1/2011 4/7/2010 $1,200 for each violation
Failure to obey a cease and desist order
Canola and Rapeseed Research, Promotion, and Consumer Information Act, codified at 7 U.S.C. 7448(e)
10/1/2011 4/7/2010 $7,000 for each day the violation occurs
Violation of an order or regulation issued under the National Kiwifruit Research, Promotion, and Consumer Information Act, codified at 7 U.S.C. 7468(c)(1)
National Kiwifruit Research, Promotion, and Consumer Information Act, codified at 7 U.S.C. 7468(c)(1)
10/1/2011 4/7/2010 $700–$7,000
Failure to obey a cease and desist order
National Kiwifruit Research, Promotion, and Consumer Information Act, codified at 7 U.S.C. 7468(e)
10/1/2011 4/7/2010 $700 for each day the violation occurs

S E C T I O N I I I | O T H E R I N F O R M A T I O N
2 5 6 C R E A T I N G A U S D A F O R T H E 2 1 S T C E N T U R Y
Penalty (Name of Penalty) Authority (Statute)
Date of Previous
Adjustment
Date of Current
Adjustment Current Penalty Level
($ Amount)
Violation of an order or regulation under the Popcorn Promotion, Research, and Consumer Information Act, codified at 7 U.S.C. 7487(a)
Popcorn Promotion, Research, and Consumer Information Act, codified at 7 U.S.C. 7487(a)
10/1/2011 4/7/2010 $1,200 for each violation
Certain violations Egg Products Inspection Act, codified at 21 U.S.C. 1041(c)(1)(A)
10/1/2011 4/7/2010 $7,500 for each violation
Violation of an order or regulation issued under the Hass Avocado Promotion, Research, and Information Act of 2000, codified at 7 U.S.C. 7807(c)(1)(A)(i)
Hass Avocado Promotion, Research, and Information Act of 2000, codified at 7 U.S.C. 7807(c)(1)(A)(i)
10/1/2011 4/7/2010 $1,100–$11,000 for each violation
Failure to obey a cease and desist order
Hass Avocado Promotion, Research, and Information Act of 2000, codified at 7 U.S.C. 7807(e)(1)
10/1/2011 4/7/2010 $11,000 for each offense
Violation of certain provisions of the Livestock Mandatory Reporting Act of 1999, codified at 7 U.S.C. 1636b(a)(1)
Livestock Mandatory Reporting Act of 1999, codified a 7 U.S.C. 1636b(a)(1)
10/1/2011 4/7/2010 $11,000 for each violation
Failure to obey a cease and desist order
Livestock Mandatory Reporting Act of 1999, codified at 7 U.S.C. 1636b(g)(3)
10/1/2011 4/7/2010 $11,000 for each violation
Failure to obey an order of the Secretary issued pursuant to the Dairy Product Mandatory Reporting program, codified at 7 U.S.C. 1637b(c)(4)(D)(iii)
Dairy Product Mandatory Reporting program, codified at 7 U.S.C. 1637b(c)(4)(D)(iii)
10/1/2011 4/7/2010 $1,000–$11,000
Willful violation of the Country of Origin Labeling program by a retailer or person engaged in the business of supplying a covered commodity to a retailer
7 U.S.C. 1638b(b)(2) 10/1/2011 4/7/2010 $1,000 for each violation
Violations of the Dairy Research Program, codified at 7 U.S.C. 4535 and 4510(b)
Dairy Research Program, codified at 7 U.S.C. 4535 and 4510(b)
10/1/2011 4/7/2010 $1,100 for each violation

F I S C A L Y E A R 2 0 1 5 A G E N C Y F I N A N C I A L R E P O R T
U . S . D E P A R T M E N T O F A G R I C U L T U R E 2 5 7
Penalty (Name of Penalty) Authority (Statute)
Date of Previous
Adjustment
Date of Current
Adjustment Current Penalty Level
($ Amount)
Violation of the imported seed provisions of the Federal Seed Act, codified at 7 U.S.C. 1596(b)
Federal Seed Act, codified at 7 U.S.C. 1596(b)
10/1/2011 4/7/2010 $37–$750
Violation of the Animal Welfare Act, codified at 7 U.S.C. 2149(b)
Animal Welfare Act, codified at 7 U.S.C. 2149(b)
10/1/2011 4/7/2010 $1,650–$10,000
Any person that causes harm to, or interferes with, an animal used for the purposes of official inspection by the Department
7 U.S.C. 2279e(a) 10/1/2011 4/7/2010 $11,000
Penalty for a violation of the Swine Health Protection Act, codified at 7 U.S.C. 3805(a)
Swine Health Protection Act, codified at 7 U.S.C. 3805(a)
10/1/2011 4/7/2010 $11,000
Any person that violates the Plant Protection Act (PPA), or that forges, counterfeits, or, without authority from the Secretary, uses, alters, defaces, or destroys any certificate, permit, or other document provided for in the PPA
Plant Protection Act, 7 U.S.C. 7734(b)(1)
10/1/2011 4/7/2010 $60,000/individual, $300,000/any other person, $500,000 violations adjudicated in a single proceeding if not a willful violation, $1,000,000 violations adjudicated in a single proceeding if a willful violation; or twice the gross gain or gross loss for any violation, forgery, counterfeiting, unauthorized use, defacing, or destruction of a certificate, permit, or other document provided for in the PPA that results in the person deriving pecuniary gain or causing pecuniary loss to another.

S E C T I O N I I I | O T H E R I N F O R M A T I O N
2 5 8 C R E A T I N G A U S D A F O R T H E 2 1 S T C E N T U R Y
Penalty (Name of Penalty) Authority (Statute)
Date of Previous
Adjustment
Date of Current
Adjustment Current Penalty Level
($ Amount)
Any person [except as provided in 7 U.S.C. 8309(d)] that violates the Animal Health Protection Act (AHPA), or that forges, counterfeits, or, without authority from the Secretary, uses, alters, defaces, or destroys any certificate, permit, or other document provided under the AHPA
Animal Health Protection Act, 7 U.S.C. 8313(b)(1)
10/1/2011 4/7/2010 $60,000 in the case of any individual, $300,000 in the case of any other person for each violation, $500,000 for all violations adjudicated in a single proceeding if the violations do not include a willful violation, $1,000,000 for all violations adjudicated in a single proceeding if the violations include a willful violation; or twice the gross gain or gross loss for any violation, forgery, counterfeiting, unauthorized use, defacing, or destruction of a certificate, permit, or other document provided under the AHPA that results in the person's deriving pecuniary gain or causing pecuniary loss to another person.
Any person that violates certain regulations under the Agricultural Bioterrorism Protection Act of 2002 regarding transfers of listed agents and toxins or possession and use of listed agents and toxins.
10/1/2011 4/7/2010 $300,000 in the case of an individual and $600,000 in the case of any other person.
Violation of the Horse Protection Act, codified at 15 U.S.C. 1825(b)(1)
Horse Protection Act, codified at 15 U.S.C. 1825(b)(1)
10/1/2011 4/7/2010 $2,200
Failure to obey Horse Protection Act disqualification, codified at 15 U.S.C. 1825(c)
Horse Protection Act, codified at 15 U.S.C. 1825(c)
10/1/2011 4/7/2010 $4,300

F I S C A L Y E A R 2 0 1 5 A G E N C Y F I N A N C I A L R E P O R T
U . S . D E P A R T M E N T O F A G R I C U L T U R E 2 5 9
Penalty (Name of Penalty) Authority (Statute)
Date of Previous
Adjustment
Date of Current
Adjustment Current Penalty Level
($ Amount)
Knowingly violating, or, if in the business as an importer or exporter, violating, with respect to terrestrial plants, any provision of the Endangered Species Act of 1973, any permit or certificate issued thereunder, or any regulation issued pursuant to section 9(a)(1)(A) through (F), (a)(2)(A) through (D), (c), (d) (other than regulations relating to recordkeeping or filing reports), (f), or (g) of the Endangered Species Act of 1973 (16 U.S.C. 1538(a)(1)(A) through (F), (a)(2)(A) through (D), (c), (d), (f), and (g)), as set forth at 16 U.S.C. 1540(a)
Endangered Species Act of 1973, (16 U.S.C. 1538(a)(1)(A) through (F), (a)(2)(A) through (D), (c), (d), (f), and (g)), as set forth at 16 U.S.C. 1540(a)
10/1/2011 4/7/2010 $37,500
Knowingly violating, or, if in the business as an importer or exporter, violating, with respect to terrestrial plants, any other regulation under the Endangered Species Act of 1973, as set forth at 16 U.S.C. 1540(a)
Endangered Species Act of 1973, as set forth at 16 U.S.C. 1540(a)
10/1/2011 4/7/2010 $18,200
Violation, with respect to terrestrial plants, of the Endangered Species Act of 1973, or any regulation, permit, or certificate issued thereunder, as set forth at 16 U.S.C. 1540(a)
Endangered Species Act of 1973, as set forth at 16 U.S.C. 1540(a)
10/1/2011 4/7/2010 $750
Knowingly and willfully violating 49 U.S.C. 80502 with respect to the transportation of animals by any rail carrier, express carrier, or common carrier (except by air or water), a receiver, trustee, or lessee of one of those carriers, or an owner or master of a vessel
49 U.S.C. 80502(d) 10/1/2011 4/7/2010 $110–$650
Violating a provision of the Food and Nutrition Act of 2008 (Act), or a regulation under the Act, by a retail food store or wholesale food concern
Food and Nutrition Act of 2008 (Act), or a regulation under the Act, codified at 7 U.S.C. 2021(a) and (c)
10/1/2011 4/7/2010 $100,000

S E C T I O N I I I | O T H E R I N F O R M A T I O N
2 6 0 C R E A T I N G A U S D A F O R T H E 2 1 S T C E N T U R Y
Penalty (Name of Penalty) Authority (Statute)
Date of Previous
Adjustment
Date of Current
Adjustment Current Penalty Level
($ Amount)
Trafficking in food coupons Food and Nutrition Act of 2008 (Act), codified at 7 U.S.C. 2021(b)(3)(B)
10/1/2011 4/7/2010 $32,000–$59,000
Sale of firearms, ammunitions, explosives, or controlled substances for coupons
Food and Nutrition Act of 2008 (Act),codified at 7 U.S.C. 2021(b)(3)(c)
10/1/2011 4/7/2010 $32,000–$59,000
Any entity that submits a bid to supply infant formula to carry out the Special Supplemental Nutrition Program for Women, Infants, and Children and discloses the amount of the bid, rebate or discount practices in advance of the bid opening or for any entity that makes a statement prior to the opening of bids for the purpose of influencing a bid
42 U.S.C. 1786(h)(8)(H)(i)
10/1/2011 4/7/2010 $145,200,000
Vendor convicted of trafficking in food instruments
42 U.S.C. 1786(o)(1)(A) and 42 U.S.C. 1786(o)(4)(B)
10/1/2011 4/7/2010 $11,000–$49,000
Vendor convicted of selling firearms, ammunition, explosives, or controlled substances in exchange for food instruments
2 U.S.C. 1786(o)(1)(B) and 42 U.S.C. 1786(o)(4)(B)
10/1/2011 4/7/2010 $11,000
Certain violations under the Egg Products Inspection Act
Egg Products Inspection Act, codified at 21 U.S.C. 1041(c)(1)(A)
10/1/2011 4/7/2010 $7,500
Failure to timely file certain reports, codified at 21 U.S.C. 467d
21 U.S.C. 467d 10/1/2011 4/7/2010 $110 per day for each day the report is not filed
Failure to timely file certain reports, codified at 21 U.S.C. 677
21 U.S.C. 677 10/1/2011 4/7/2010 $110 per day for each day the report is not filed
Failure to timely file certain reports, codified at 21 U.S.C. 678
21 U.S.C. 1051 10/1/2011 4/7/2010 $110 per day for each day the report is not filed

F I S C A L Y E A R 2 0 1 5 A G E N C Y F I N A N C I A L R E P O R T
U . S . D E P A R T M E N T O F A G R I C U L T U R E 2 6 1
Penalty (Name of Penalty) Authority (Statute)
Date of Previous
Adjustment
Date of Current
Adjustment Current Penalty Level
($ Amount)
Willful disregard of the prohibition against the export of unprocessed timber originating from Federal lands
16 U.S.C. 620d(c)(1)(A) 10/1/2011 4/7/2010 $750,000
Violation in disregard of the Forest Resources Conservation and Shortage Relief Act or the regulations that implement such Act
16 U.S.C. 620d(c)(2)(A)(i)
10/1/2011 4/7/2010 $107,500
Person that should have known that an action was a violation of the Forest Resources Conservation and Shortage Relief Act or the regulations that implement such Act
Forest Resources Conservation and Shortage Relief Act or the regulations that implement such Act, 16 U.S.C. 620d(c)(2)(A)(ii)
10/1/2011 4/7/2010 $70,000
Willful violation of the Forest Resources Conservation and Shortage Relief Act or the regulations that implement such Act
Forest Resources Conservation and Shortage Relief Act or the regulations that implement such Act, codified at 16 U.S.C. 620d(c)(2)(A)(iii)
10/1/2011 4/7/2010 $725,000
Violation involving protections of caves
16 U.S.C. 4307(a)(2) 10/1/2011 4/7/2010 $11,000
Packer or swine contractor violation
7 U.S.C. 193(b) 10/1/2011 4/7/2010 $11,000
Livestock market agency or dealer failure to register
Packers and Stockyards Act of 1921, 7 U.S.C. 203
10/1/2011 4/7/2010 $750
Operating without filing, or in violation of, a stockyard rate schedule, or of a regulation or order of the Secretary made thereunder
Packers and Stockyards Act of 1921, 7 U.S.C. 207(g)
10/1/2011 4/7/2010 $750
A stockyard owner, livestock market agency, and dealer violation
Packers and Stockyards Act of 1921, 7 U.S.C. 213(b)
10/1/2011 4/7/2010 $11,000
Stockyard owner, livestock market agency, and dealer compliance order
Packers and Stockyards Act of 1921, 7 U.S.C. 215(a)
10/1/2011 4/7/2010 $750

S E C T I O N I I I | O T H E R I N F O R M A T I O N
2 6 2 C R E A T I N G A U S D A F O R T H E 2 1 S T C E N T U R Y
Penalty (Name of Penalty) Authority (Statute)
Date of Previous
Adjustment
Date of Current
Adjustment Current Penalty Level
($ Amount)
Failure to file required reports 15 U.S.C. 50 10/1/2011 4/7/2010 $110
Live poultry dealer violations Packers and Stockyards Act of 1921, 7 U.S.C. 228b-2(b)
10/1/2011 4/7/2010 $32,000
Refusal of inspection and weighing services violation
7 U.S.C. 86(c) 10/1/2011 4/7/2010 $107,500
Any person who willfully and intentionally provides any false or inaccurate information to the Federal Crop Insurance Corporation or to an approved insurance provider with respect to any insurance plan or policy that is offered under the authority of the Federal Crop Insurance Act
Federal Crop Insurance Act, codified at 7 U.S.C. 1506(n)(1)(A)
10/1/2011 4/7/2010 $11,000
Any person who willfully and intentionally provides any false or inaccurate information to the Federal Crop Insurance Corporation or to an approved insurance provider with respect to any insurance plan or policy that is offered under the authority of the Federal Crop Insurance Act, or who fails to comply with a requirement of the Federal Crop Insurance Corporation
Federal Crop Insurance Act, codified at 7 U.S.C. 1515(h)(3)(A)
10/1/2011 4/7/2010 $11,000
Violation of section 536 of Title V of the Housing Act of 1949
Section 536 of Title V of the Housing Act of 1949, codified at 42 U.S.C. 1490p(e)(2)
10/1/2011 4/7/2010 $120,000/individual and $1,200,000 in the case of an applicant other than an individual
Equity skimming Section 543(a) of the Housing Act of 1949, codified at 42 U.S.C. 1490s(a)(2)
10/1/2011 4/7/2010 $32,500

F I S C A L Y E A R 2 0 1 5 A G E N C Y F I N A N C I A L R E P O R T
U . S . D E P A R T M E N T O F A G R I C U L T U R E 2 6 3
Penalty (Name of Penalty) Authority (Statute)
Date of Previous
Adjustment
Date of Current
Adjustment Current Penalty Level
($ Amount)
Violation of regulations or agreements made in accordance with Title V of the Housing Act of 1949, by submitting false information, submitting false certifications, failing to timely submit information, failing to maintain real property in good repair and condition, failing to provide acceptable management for a project, or failing to comply with applicable civil rights statutes and regulations
Section 543b of the Housing Act of 1949, codified at 42 U.S.C. 1490s(b)(3)(A)
10/1/2011 4/7/2010 $60,000
Failure to comply with certain provisions of the U.S. Warehouse Act
U.S. Warehouse Act, codified at 7 U.S.C. 254
10/1/2011 4/7/2010 $27,500
Willful failure or refusal to furnish information, or willful furnishing of false information under section 156 of the Federal Agricultural Improvement and Reform Act of 1996
Section 156 of the Federal Agricultural Improvement and Reform Act of 1996, codified at 7 U.S.C. 7272(g)(5).
10/1/2011 4/7/2010 $10,000
Willful failure or refusal to furnish information or willful furnishing of false data by a processor, refiner, or importer of sugar, syrup and molasses
Section 156 of the Federal Agriculture Improvement and Reform Act of 1996, codified at 7 U.S.C. 7272(g)(5)
10/1/2011 4/7/2010 $10,000
Filing a false acreage report that exceeds tolerance
Federal Agriculture Improvement and Reform Act of 1996, Section 156
10/1/2011 4/7/2010 $10,000
Knowingly violating any regulation of the Secretary of the Commodity Credit Corporation pertaining to flexible marketing allotments for sugar
Section 359h(b) of the Agricultural Adjustment Act of 1938
10/1/2011 4/7/2010 $5,500
Knowing violation of regulations promulgated by the Secretary pertaining to cotton insect eradication
Section 104(d) of the Agricultural Act of 1949
10/1/2011 4/7/2010 $5,500

S E C T I O N I I I | O T H E R I N F O R M A T I O N
2 6 4 C R E A T I N G A U S D A F O R T H E 2 1 S T C E N T U R Y
Penalty (Name of Penalty) Authority (Statute)
Date of Previous
Adjustment
Date of Current
Adjustment Current Penalty Level
($ Amount)
Making, presenting, submitting or causing to be made, presented or submitted, a false, fictitious, or fraudulent claim
Program Fraud Civil Remedies Act of 1986, codified at 31 U.S.C. 3802(a)(1)
10/1/2011 4/7/2010 $5,500
Making, presenting, submitting or causing to be made, presented or submitted, a false, fictitious, or fraudulent written statement
Program Fraud Civil Remedies Act of 1986, codified at 31 U.S.C. 3802(a)(2)
10/1/2011 4/7/2010 $5,500
F I S C A L Y E A R 2 0 1 5 A G E N C Y F I N A N C I A L R E P O R T
U . S . D E P A R T M E N T O F A G R I C U L T U R E 2 6 5
Abbreviations—Acronyms
A
A&O—Administrative and Operating
AARC—Alternative Agricultural Research and Commercialization Corporation
ACEP—Agricultural Conservation Easement Program
ACFO-FS—Associate Chief Financial Officer for Financial Systems
ADA—Antideficiency Act
AR—Administrative Review
AFMSS—Automated Fluid Mineral Support System
AFR—Agency Financial Report
AGI—Adjusted Gross Income
AGPMR—Agriculture Property Management Regulation
AMS—Agricultural Marketing Service
APEC—Access, Participation, Eligibility and Certification
APHIS—Animal and Plant Health Inspection Service
APR—Annual Performance Report
AQI—Agricultural Quarantine Inspection
AQM—Acquisition Management
ARRA—American Reinvestment and Recovery Act of 2009
ARS—Agricultural Research Service
ART—Administrative Reviews and Training
ATA—Actual Time Automation
B
BDO—Barter Delivery Obligation
BFDL—Black Farmers Discrimination Lawsuit
BLM—Bureau of Land Management
C
C&A—Certification and Accreditation
CACFP—Child and Adult Care Food Program
CAP—Corrective Action Plan
CBO—Certificates of Beneficial Ownership
CCC—Commodity Credit Corporation
CED—County Executive Director
CEP—Community Eligibility Provision
CFR—Code of Federal Regulations
CI—Condition Index
CIO—Chief Information Officer
CIP—Continuous Improvement Plan
CM—Continuous Monitoring
CMDF—Construction Disaster Fund Supplemental
CN—Child Nutrition
CND—Child Nutrition Division
CNPP—Center for Nutrition Policy and Promotion
CNSTAT—National Academies’ Committee on National Statistics
CO—Contracting Officer
CoC—Cushion of Credit
COF—County Office
COR—Contracting Officer’s Representative
CORE—Core Accounting System
CORP—County Office Review Program
CRE—Coordinated Review Effort
CRP—Conservation Reserve Program
CSAM—Cyber Security Assessment and Management
CSC—Centralized Servicing Center
CSS—Country Strategy Statement
CVV—Cash Value Voucher
CY—Current Year

A B B R E V I A T I O N S – A C R O N Y M S
2 6 6 C R E A T I N G A U S D A F O R T H E 2 1 S T C E N T U R Y
D
DAFP—Deputy Administrator Farm Programs
DC—Disallowed Costs
DCP—Direct and Counter-Cyclical Payments
DHS—United States Department of Homeland Security
DM—Deferred Maintenance
DM&R—Deferred Maintenance & Repairs
DNP—Do Not Pay
E
E&T—Employment and Training
EAAP—Economic Adjustment Assistance to Users of Upland Cotton Program
ECP—Emergency Conservation Program
eDRS—electronic Disqualified Recipient System
EFCRP—Emergency Forestry Conservation Reserve Program
eFMS—Electronic Funds Management System
EO—Executive Order
EPD—Easement Programs Division
EQIP—Environmental Quality Incentives Program
ERS—Economic Research Service
EWPP—Emergency Watershed Protection Program
Floodplain Easements
F
FAS—Foreign Agricultural Service
FCIC—Federal Crop Insurance Corporation
FDA—Food and Drug Administration
FDCH—Family Day Care Homes
FECA—Federal Employee Compensation Act
FFAS—Farm and Foreign Agricultural Services
FFB—Federal Financing Bank
FFIS—Foundation Financial Information System
FFMIA—Federal Financial Management Improvement Act
FFMS—Federal Financial Management System
FISMA—Federal Information Security Management Act
FMD—Financial Management Division
FMFIA—Federal Managers’ Financial Integrity Act
FMMI—Financial Management Modernization Initiative
FNCS—Food, Nutrition and Consumer Services
FNS—Food and Nutrition Service
FOA—Funding Opportunity Announcement
FS—Forest Service
FSA—Farm Service Agency
FSFL—Farm Storage Facility Loan
FSH—Forest Service Handbook
FSIS—Food Safety and Inspection Service
FSM—Forest Service Manual
FSMC—Food Service Management Company
FSRIA—Farm Security and Rural Investment Act
FSRIP— Farm Security and Rural Investment Act Programs
FSSP—Federal Shared Service Provider
FTBU—Funds To Be Put to Better Use
FY—Fiscal Year
G
G&A—Grants and Agreements
GAO—Government Accountability Office
GIPSA—Grain Inspection, Packers and Stockyards Administration
GMS—Global Market Strategy
GSA—General Services Administration

F I S C A L Y E A R 2 0 1 5 A G E N C Y F I N A N C I A L R E P O R T
U . S . D E P A R T M E N T O F A G R I C U L T U R E 2 6 7
H
HHFKA—Healthy, Hunger-Free Kids Act
HIMP—Hazard Analysis and Critical Control Point-based Inspection Models Project
HUD—Department of Housing and Urban Development
I
IP—Improper Payments
IPAC—Intragovernmental Payment and Collection
IPERA—Improper Payments Elimination and Recovery Act of 2010
IPERIA—Improper Payments Elimination and Recovery Improvement Act of 2012
IPIA—Improper Payments Information Act of 2002
IRS—Internal Revenue Service
IT—Information Technology
ITSD—Information Technology Services Division
L
L&WCF—Land and Water Conservation Fund
LDP—Loan Deficiency Payment
LEA—Local Educational Agency
LFP—Livestock Forage Disaster Program
M
MAL—Marketing Assistance Loan
MAR—Maximum Allowable Reimbursement
MD&A—Management’s Discussion and Analysis
MDD—Management Decision Date
MDP—Miscellaneous Disaster Programs
MILC—Milk Income Loss Contract
MFH—Multi-Family Housing
MFIS—Multi Family Housing Information System
ME—Management Evaluation
MINC—Management Interactive Network Connection
MOU—Memorandum of Understanding
MRP—Marketing and Regulatory Programs
N
NAL—National Agricultural Library
NAP—Noninsured Assistance Program
NAP—Noninsured Crop Disaster Assistance Program
NASS—National Agricultural Statistics Service
NCIC—National Crime Information Center
NEST—National Easement Staging Tool
NFAOC—National Financial and Accounting Operations Center
NFS—National Forest System
NHQ—National Headquarters
NIFA—National Institute of Food and Agriculture
NIST—National Institute of Standards and Technology
NPS—National Payment System
NRCS—Natural Resources Conservation Service
NRE—Natural Resources and Environment
NRHP—National Register of Historic Places
NSLP—National School Lunch Program
NTE—Not-to-Exceed

A B B R E V I A T I O N S – A C R O N Y M S
2 6 8 C R E A T I N G A U S D A F O R T H E 2 1 S T C E N T U R Y
O
OCFO—Office of the Chief Financial Officer
OCIO—Office of the Chief Information Officer
OGC— Office of the General Counsel
OIG—Office of Inspector General
OMB—Office of Management and Budget
OPPM—Office of Procurement and Property Management
OPS—Office of Policy Support
P
PAR—Performance and Accountability Report
PHA—Priority Heritage Assets
PHIS—Public Health Information System
PIP—Practice Incentive Payments
PMC—Plant Materials Centers
POA&Ms—Plan of Action Milestones
PP&E—Property, Plant, and Equipment
PRRA—Payment Recapture/Recovery Auditing
PRV—Plant Replacement Value
PSU—Primary Sampling Unit
PVO—Private Voluntary Organizations
PY—Previous Year
R
RA—Rental Assistance
RAP—Rental Assistance Program
RBEG—Recovery Act Rural Business Enterprise Grant
RBS—Rural Business and Cooperative Service
RC&D—Resource Conservation and Development
RD—Rural Development
REE—Research, Education, and Economics
RFA—Request for Application
RHIF—Rural Housing Insurance Fund
RHS—Rural Housing Service
RMA—Risk Management Agency
RME—Risk Management Education
RMF—Risk Management Framework
RO—Regional Office
RORA—Regional Office Review of Applications
RUS—Rural Utilities Service
S
SA—State Agency
SAM—System for Award Management
SAP—Salmonella Action Plan (SAP)
SAP— Systems, Applications, and Products
SBP—School Breakfast Program
SBR—Statement of Budgetary Resources
SCRA—Supplier Credit Recovery Audit
SDA—Socially Disadvantaged Farmers
SED—State Executive Director
SER—Single Effective Rate
SFA—School Food Authority
SFH—Single Family Housing
SIP—Salmonella Initiative Program
SITC—Smuggling, Interdiction and Trade Compliance
SMI—School Meal Initiative
SNAP—Supplemental Nutrition Assistance Program
SOP—Standard Operating Procedure
SOS—Schedule of Spending
SP—Special Publication
SPA—Special Program Area
SSA—Security Stack Array
STO—State Office
SURE—Supplemental Revenue Assistance Payments
SY—School Year

F I S C A L Y E A R 2 0 1 5 A G E N C Y F I N A N C I A L R E P O R T
U . S . D E P A R T M E N T O F A G R I C U L T U R E 2 6 9
T
TAAF– Trade Adjustment Assistance for Farmers
TANF—Temporary Assistance to Needy Families
TB—Technical Bulletin
TEFAP—Report of the Emergency Food Assistance Program
TME—Target Management Evaluations
TPMC—Tucson Plant Materials Center
U
ULO—Unliquidated Obligations
USAID—United States Agency for International Development
USDA—U.S. Department of Agriculture
USGCB—U.S. Government Configuration Baseline
USSGL—U.S. Standard General Ledger
UTN—Universal Telecommunications Network
W
WebTA—Web-based Time and Attendance
WEP—Water and Environmental Program
WFM—Wildland Fire Management
WFSU—Wildland Fire Suppression Management
WIC—Special Supplemental Program for Women, Infants, and Children
WRP—Wetlands Reserve Program

To learn more about OIG, visit our website at www.usda.gov/oig/index.htm
How To Report Suspected Wrongdoing in USDA Programs
Fraud, Waste, and Abuse
File complaint online: http://www.usda.gov/oig/hotline.htmClick on Submit a Complaint Telephone: 800-424-9121Fax: 202-690-2474
Bribes or Gratuities 202-720-7257 (24 hours a day)
The U.S. Department of Agriculture (USDA) prohibits discrimination in all of its programs and activities on the basis of race, color, national origin, age, disability, and where applicable, sex (including gender identity and expression), marital status, familial status, parental status, religion, sexual orientation, political beliefs, genetic information, reprisal, or because all or part of an individual’s income is derived from any public assistance program. (Not all prohibited bases apply to all programs.) Persons with disabilities who require al-ternative means for communication of program information (Braille, large print, audiotape, etc.) should contact USDA’s TARGET Center at (202) 720-2600 (voice and TDD).
To file a complaint of discrimination, write to USDA, Assistant Secretary for Civil Rights, Office of the Assistant Secretary for Civil Rights, 1400 Independence Avenue, SW., Stop 9410, Washington, D.C. 20250-9410, or call toll-free at (866) 632-9992 (English) or (800) 877-8339 (TDD) or (866) 377-8642 (English Federal-relay) or (800) 845-6136 (Spanish Federal-relay). USDA is an equal opportunity provider and employer.