Liberal Internationalism 3.0: America and the Dilemmas of Liberal ...

United StatesDepartment of Agriculture
Center for NutritionPolicy and Promotion
CNPP-20
November 2007
The Low-Cost,Moderate-Cost, andLiberal Food Plans, 2007

CNPP-20 i
Carlson, A., Lino, M., & Fungwe, T. (2007). The Low-Cost, Moderate-Cost, andLiberal Food Plans, 2007 (CNPP-20). U.S. Department of Agriculture, Center forNutrition Policy and Promotion.
Abstract
The Low-Cost, Moderate-Cost, and Liberal Food Plans, three fundamental parts of theU.S. food guidance system, have been revised by USDA’s Center for Nutrition Policyand Promotion, with assistance from USDA’s Food and Nutrition Service, EconomicResearch Service, and Agricultural Research Service. The plans provide representativehealthful market baskets at three different cost levels. This revision maintains the sameinflation-adjusted costs as those of the previous three food plans, last revised in 2003.In line with previous food plans, an assumption used to develop these plans wasthat all purchased food is consumed at home. The newly revised (2007) Low-Cost,Moderate-Cost, and Liberal Food Plans differ from, and improve upon, the previousversions in a number of ways:
• The Plans are based on the most current dietary standards: the 2005 DietaryGuidelines for Americans as well as the 2005 MyPyramid Food Guidance System.
• The Plans use the latest data on food consumption, nutrient content, and food prices:the 2001-2002 National Health and Nutrition Examination Survey and the 2001-2002 Food Price Database.
• The Plans offer a more realistic reflection of the time available for home foodpreparation; hence, each plan incorporates more prepared foods within the recipesand requires fewer preparations from scratch.
The U.S. Department of Agriculture (USDA) prohibits discrimination in all its programs and activities on thebasis of race, color, national origin, age, disability, and where applicable, sex, marital status, familial status,parental status, religion, sexual orientation, genetic information, political beliefs, reprisal, or because all orpart of an individual’s income is derived from any public assistance program. (Not all prohibited bases applyto all programs.) Persons with disabilities who require alternative means for communication of program infor-mation (Braille, large print, audiotape, etc.) should contact USDA’s TARGET Center at (202) 720-2600 (voiceand TDD).
To file a complaint of discrimination, write to USDA, Director, Office of Civil Rights, 1400 IndependenceAvenue, S.W., Washington, D.C. 20250-9410 or call (800) 795-3272 (voice) or (202) 720-6382 (TDD). USDAis an equal opportunity provider and employer.
November 2007

ii The Low-Cost, Moderate-Cost, and Liberal Food Plans, 2007
Acknowledgments
In undertaking this study of the Low-Cost, Moderate-Cost, and Liberal Food Plans,the Center for Nutrition Policy and Promotion received valuable assistance from otherU.S. Department of Agriculture agencies. Specifically, the staff of the Center thank theFood and Nutrition Service for its valuable assistance with combining Nielsen pricedata and National Health and Nutrition Examination Survey food consumption data,and the Economic Research Service (with special thanks to Kenneth Hanson) forproviding major contributions on the modeling aspects of the project, and the Nielsenprice data and guidance on its use. We also thank the Agricultural Research Servicefor facilitating the project by providing MyPyramid cup and ounce equivalents offoods in the National Health and Nutrition Examination Survey and by assisting inconverting foods from an “as-consumed” to an “as-purchased” form; and we thankthe Cooperative State Research, Education, and Extension Service for helpful adviceon methodology. Lastly, we thank Peter Basiotis (retired, CNPP staff director) for hisyears of expertise and dedication to the food plans.

CNPP-20 iii
Contents Page
The Low-Cost, Moderate-Cost, and Liberal Food Plans, 2007 Executive Summary ........................................... ES-1Food Plan Development ............................................................................................................................................... ES-1Results .......................................................................................................................................................................... ES-2Conclusions .................................................................................................................................................................. ES-3
The Low-Cost, Moderate-Cost, and Liberal Food Plans, 2007 .................................................................................... 1Introduction ......................................................................................................................................................................... 1Historical Background of the USDA Food Plans ................................................................................................................ 2Data ............................................................................................................................................................................... 3
2001-2002 National Health and Nutrition Examination Survey ............................................................................ 32001-2002 Food Price Database .......................................................................................................................... 4
Methods .............................................................................................................................................................................. 6Model Inputs ..................................................................................................................................................................... 11
Average Consumption of Each of the Food Categories ..................................................................................... 11Average Price of the Food Categories ................................................................................................................ 12Nutrient Profile and MyPyramid Equivalents Profile of Each of the Food Categories ....................................... 12
Model Constraints ............................................................................................................................................................. 13Dietary Standards ............................................................................................................................................... 13Cost and Other Constraints ................................................................................................................................ 19
Mathematical Model ......................................................................................................................................................... 20Food Plan Consumption Patterns .................................................................................................................................... 20
Market Baskets or As-Purchased Form .............................................................................................................. 21Average Market Basket for Each Food Plan ...................................................................................................... 21
Grains................................................................................................................................................... 34Vegetables ........................................................................................................................................... 34Fruits .................................................................................................................................................... 34Milk Products ....................................................................................................................................... 34Meat and Beans ................................................................................................................................... 34Other Foods ......................................................................................................................................... 35
Average Food Plan Market Baskets Versus Average Consumption and Previous Market Baskets ............................... 35Future Cost Updates of the Food Plans ........................................................................................................................... 38Conclusions ...................................................................................................................................................................... 39References ....................................................................................................................................................................... 40Appendix 1. Food Group Database Documentation .................................................................................................... A1-1Appendix 2. Description of Low-Cost, Moderate-Cost, and Liberal Food Plan Optimization Model ........................... A2-1Appendix 3. Food Plan Consumption Patterns in USDA MyPyramid Amounts of Food ............................................. A3-1Appendix 4. Expenditure Shares for Food Categories in the Food Plans ................................................................... A4-1

CNPP-20 ES-1
The Low-Cost, Moderate-Cost, and Liberal FoodPlans, 2007
Executive Summary
The Low-Cost, Moderate-Cost, and Liberal Food Plans have been revised to reflect currentdietary recommendations, food consumption patterns, food composition data, and foodprices while maintaining the same inflation-adjusted costs as those of the previous threefood plans, last revised in 2003.1 This revision was undertaken by the U.S. Department ofAgriculture’s (USDA) Center for Nutrition Policy and Promotion (CNPP), with assistancefrom USDA’s Food and Nutrition Service (FNS), Economic Research Service (ERS), andAgricultural Research Service (ARS).
These three plans, as well as the Thrifty Food Plan, are the four official USDA food plansmaintained by CNPP. The Thrifty Food Plan serves as a national standard for a nutritiousdiet at a minimal cost and is used as the basis for maximum food stamp allotments. TheLow-Cost, Moderate-Cost, and Liberal Food Plans are used for various purposes:bankruptcy courts often use the value of the Low-Cost Food Plan to determine the portionof a bankrupt person’s income to allocate to necessary food expenses. The Departmentof Defense uses the value of the Liberal Food Plan to determine the Basic Allowance forSubsistence rates for all servicemembers. Many divorce courts use the values of the USDAFood Plans to set alimony payments. The Low-Cost, Moderate-Cost, and Liberal Plans areused in USDA’s report Expenditures on Children by Families, which is used to set Statechild support guidelines and foster care payments.
The market baskets of the Low-Cost, Moderate-Cost, and Liberal Food Plans specify thetypes and quantities of foods that people could purchase and prepare at home to obtain anutritious diet at three cost levels. For each food plan, there are 15 market baskets—onefor each of 15 age-gender groups. The Low-Cost Food Plan represents food expendituresin the second from the bottom quartile of food spending; the Moderate-Cost Food Plan,food expenditures in the second from the top quartile of food spending; and the LiberalFood Plan, food expenditures in the top quartile of food spending.
Food Plan Development
CNPP used two main data sets to revise the market baskets of all three food plans: theFederal Government’s 2001-2002 National Health and Nutrition Examination Survey(NHANES) and the 2001-2002 Food Price Database. A mathematical optimization modelwas used to develop these food plans to meet required dietary standards and maintainspecified cost levels.
1 “Previous” Low-Cost, Moderate-Cost, and Liberal Food Plans refer to the 2003 plans. The “newly revised,”“revised,” or “new” Low-Cost, Moderate-Cost, and Liberal Food Plans refer to the 2007 food plans.

ES-2 The Low-Cost, Moderate-Cost, and Liberal Food Plans, 2007
The dietary standards include (1) the 1997-2005 Recommended Dietary Allowances(RDAs), Adequate Intakes (AIs), and Acceptable Macronutrient Distribution Ranges(AMDRs); (2) the 2005 Dietary Guidelines for Americans; and (3) the 2005 MyPyramidfood intake recommendations. The cost levels of the revised food plans’ market basketsalso remain equal to the inflation-adjusted cost of the previous food plans’ market baskets.
For each of the three food plans, the model yielded a suggested consumption pattern thatconsisted of quantities of 58 food categories for each of the 15 age-gender groups. CNPPconverted foods and quantities consumed into the corresponding set of purchasable foodsand then collapsed them into a simplified group of 29 market basket groups.
Results
The 1-week market baskets of the 29 market basket groups as purchased for each of the15 age-gender groups for each of the three food plans are shown in tables ES-1a-c. Theseindividual market baskets may be combined to form a household market basket.
For each age-gender group, the market baskets of the three food plans meet all dietarystandards with the exception of vitamin E, potassium, and sodium. However, for all threefood plans, the market baskets for all age-gender groups contain more vitamin E andpotassium than generally is consumed. It was not possible for any of the market basketsto meet the sodium guideline, so sodium was limited to no more than median consumptionfor each age-gender group in the sample. To meet the recommendations for vitamin E,potassium, and sodium would have resulted in market baskets that are very different fromtypical consumption (in the case of vitamin E and potassium) or would require changes infood-manufacturing practices (in the case of sodium). This revision of the market basketsof the Low-Cost, Moderate-Cost, and Liberal Food Plans does meet food (e.g., fruit,vegetables, and milk) intake recommendations of the MyPyramid Food Guidance System.
To understand how reported diets would need to change to meet the dietary standardsof the new Low-Cost, Moderate-Cost, and Liberal Food Plans, CNPP compared thepopulation-weighted average market baskets for each plan (in pounds) with weightedaverage consumption (in pounds) based on the food expenditure quartile correspondingto each plan. The average market baskets for all three food plans contain more vegetables,fruits, and milk products and less other foods (fats, oils, sweets, etc.) compared withaverage consumption amounts. This is not surprising because the food plans represent anutritious diet.
CNPP also compared the weighted average market baskets of the new and previous Low-Cost, Moderate-Cost, and Liberal Food Plans. This comparison shows the effects ofchanging dietary guidance over time. Compared with their respective previous marketbaskets, the new average market baskets of the Low-Cost, Moderate-Cost, and LiberalFood Plans contain fewer pounds of grains (but more whole grain products), meat and

CNPP-20 ES-3
beans, and other foods, and more fruit, vegetables, and milk products. The 2005 DietaryGuidelines for Americans encourage increased intakes of fruit, vegetables, and fat-freeor lowfat milk and dairy products. The new USDA food guidance system, MyPyramid,recommends greater consumption of these food groups than was the case with the 1992Food Guide Pyramid. The increased amounts of these food groups in the revised foodplans resulted inevitably in decreases of the other food groups.
Conclusions
The Low-Cost, Moderate-Cost, and Liberal Food Plans represent nutritious diets at variouscosts. This revision of the market baskets of each food plan reflects recent changes indietary guidance and incorporates updated information on food composition, consumptionpatterns, and food prices at the same inflation-adjusted cost of the previous food plans.The new market baskets of the Low-Cost, Moderate-Cost, and Liberal Food Plans are nowofficial. Monthly cost updates of the three food plans will be based on the content of thesebaskets. Also, the list of foods and quantities specified in the market baskets may be usedin nutrition and consumer education programs designed to help people eat a healthful dietat various cost levels.

ES-4 The Low-Cost, Moderate-Cost, and Liberal Food Plans, 2007
Table ES-1a. Low-Cost Food Plan market baskets, quantities of food purchased for a week, by age-gender group, 2007
ChildrenFood category 1 year 2-3 years 4-5 years 6-8 years 9-11 years
Total pounds 18.49 19.41 23.23 25.24 34.87
Pounds per weekGrainsWhole grain breads, rice, pasta, and pastries (including whole grain flours) 0.76 0.90 1.30 0.39 1.87Whole grain cereals (including hot cereal mixes) 0.11 0.16 0.38 0.23 0.21Popcorn and other whole grain snacks 0.03 0.15 0.01 0.47 0.05Non-whole grain breads, cereals, rice, pasta, pies, pastries, snacks, and flours 0.39 0.63 0.79 1.42 0.77
1.29 1.83 2.48 2.51 2.90
VegetablesAll potato products 0.16 0.33 0.56 0.42 0.58Dark-green vegetables 0.37 0.83 0.75 1.01 0.09Orange vegetables 0.11 0.41 1.02 0.62 0.76Canned and dry beans, lentils, and peas (legumes) 0.31 0.48 0.66 1.69 1.60Other vegetables 3.93 1.20 1.58 2.61 1.30
4.88 3.25 4.57 6.35 4.33
FruitsWhole fruits 1.56 3.10 3.88 2.82 8.65Fruit juices 1.27 0.46 1.54 1.73 1.51
2.82 3.56 5.42 4.55 10.16
Milk productsWhole milk, yogurt, and cream 7.85 1.06 0.27 0.18 0.37Lower fat and skim milk and lowfat yogurt 0.00 7.08 7.79 8.02 12.10All cheese (including cheese soup and sauce) 0.01 0.03 0.02 0.00 0.04Milk drinks and milk desserts 0.00 0.00 0.03 0.00 0.06
7.85 8.17 8.11 8.20 12.58
Meat and beansBeef, pork, veal, lamb, and game 0.32 0.30 0.31 2.09 0.53Chicken, turkey, and game birds 0.37 0.49 0.50 0.44 0.49Fish and fish products 0.18 0.83 0.54 0.34 0.55Bacon, sausages, and luncheon meats (including spreads) 0.00 0.01 0.04 0.18 0.02Nuts, nut butters, and seeds 0.09 0.14 0.41 0.18 0.79Eggs and egg mixtures 0.00 0.02 0.02 0.02 0.05
0.97 1.79 1.81 3.25 2.43
Other foodsTable fats, oils, and salad dressings 0.25 0.22 0.26 0.14 0.16Gravies, sauces, condiments, and spices 0.20 0.23 0.32 0.20 0.37Coffee and tea 0.00 0.00 0.00 0.00 0.00Soft drinks, sodas, fruit drinks, and ades (including rice beverages) 0.21 0.18 0.20 0.02 0.62Soups (ready-to-serve and condensed) 0.01 0.15 0.00 0.01 1.22Soups (dry) 0.00 0.00 0.01 0.00 0.02Frozen or refrigerated entrees (including pizza, fish sticks, and frozen meals) 0.02 0.00 0.00 0.00 0.02
0.68 0.81 0.84 0.37 2.46
Notes: Food in as-purchased form, which includes uncooked grain products; raw, canned, and frozen vegetables; fruit juice concentrates; and meat withbones. Components of the market baskets are discussed in terms of pounds; therefore, fluids such as milk are weighted more prominently than are dryfoods, and juice concentrates are weighted less prominently than are their reconstituted forms.For children age 1, all milk and yogurt were assigned to the whole milk, yogurt, and cream category, because dietary guidance recommends consumptionof primarily whole milk products for these children.The numbers are rounded; thus, when summed, they may not equal the respective totals.

CNPP-20 ES-5
Table ES-1a. Low-Cost Food Plan market baskets, quantities of food purchased for a week, by age-gender group, 2007(cont’d)
MalesFood category 12-13 years 14-18 years 19-50 years 51-70 years 71+ years
Total pounds 35.21 44.38 40.70 38.88 34.43
Pounds per weekGrainsWhole grain breads, rice, pasta, and pastries (including whole grain flours) 1.45 3.21 1.01 2.39 0.70Whole grain cereals (including hot cereal mixes) 0.15 0.19 0.57 0.47 1.73Popcorn and other whole grain snacks 0.97 0.05 0.38 0.05 0.03Non-whole grain breads, cereals, rice, pasta, pies, pastries, snacks, and flours 1.03 1.18 1.31 1.17 0.56
3.60 4.64 3.27 4.08 3.02
VegetablesAll potato products 1.20 2.00 2.26 1.36 1.99Dark-green vegetables 0.62 0.53 1.01 1.15 0.87Orange vegetables 0.43 0.55 0.91 0.90 0.71Canned and dry beans, lentils, and peas (legumes) 1.87 1.63 1.83 1.26 1.47Other vegetables 1.58 3.48 3.39 3.29 2.27
5.70 8.19 9.39 7.96 7.31
FruitsWhole fruits 3.93 6.27 6.04 6.98 4.75Fruit juices 2.21 1.37 1.68 1.83 1.72
6.15 7.63 7.71 8.81 6.46
Milk productsWhole milk, yogurt, and cream 1.31 1.37 1.15 0.49 0.65Lower fat and skim milk and lowfat yogurt 10.18 9.12 9.26 10.99 11.46All cheese (including cheese soup and sauce) 0.07 0.19 0.27 0.11 0.17Milk drinks and milk desserts 0.54 0.32 0.27 0.23 0.10
12.10 11.01 10.96 11.82 12.38
Meat and beansBeef, pork, veal, lamb, and game 0.82 0.71 1.00 0.79 1.03Chicken, turkey, and game birds 0.57 0.77 1.13 0.69 0.77Fish and fish products 0.49 0.06 0.24 0.60 0.10Bacon, sausages, and luncheon meats (including spreads) 0.12 0.13 0.19 0.09 0.06Nuts, nut butters, and seeds 0.63 0.80 0.62 0.80 0.81Eggs and egg mixtures 0.07 0.12 0.18 0.12 0.17
2.70 2.59 3.36 3.08 2.95
Other foodsTable fats, oils, and salad dressings 0.24 0.56 0.58 0.37 0.43Gravies, sauces, condiments, and spices 0.29 1.06 0.36 0.18 0.18Coffee and tea 0.00 0.00 0.00 0.01 0.01Soft drinks, sodas, fruit drinks, and ades (including rice beverages) 3.44 7.88 4.62 2.03 1.10Sugars, sweets, and candies 0.19 0.57 0.22 0.12 0.12Soups (ready-to-serve and condensed) 0.63 0.18 0.11 0.38 0.44Soups (dry) 0.01 0.02 0.01 0.01 0.01Frozen or refrigerated entrees (including pizza, fish sticks, frozen meals) 0.16 0.04 0.08 0.03 0.02
4.96 10.31 6.00 3.12 2.31
Notes: Food in as-purchased form, which includes uncooked grain products; raw, canned, and frozen vegetables; fruit juice concentrates; and meat withbones. Components of the market baskets are discussed in terms of pounds; therefore, fluids such as milk are weighted more prominently than are dryfoods, and juice concentrates are weighted less prominently than are their reconstituted forms.The numbers are rounded; thus, when summed, they may not equal the respective totals.

ES-6 The Low-Cost, Moderate-Cost, and Liberal Food Plans, 2007
Table ES-1a. Low-Cost Food Plan market baskets, quantities of food purchased for a week, by age-gender group, 2007(cont’d)
FemalesFood category 12-13 years 14-18 years 19-50 years 51-70 years 71+ years
Total pounds 33.51 35.79 38.13 34.77 29.33
Pounds per weekGrainsWhole grain breads, rice, pasta, and pastries (including whole grain flours) 2.24 2.22 1.71 2.52 1.50Whole grain cereals (including hot cereal mixes) 0.17 0.09 0.22 0.09 0.26Popcorn and other whole grain snacks 0.02 0.03 0.03 0.02 0.00Non-whole grain breads, cereals, rice, pasta, pies, pastries, snacks, and flours 0.94 1.16 0.89 0.54 0.72
3.38 3.50 2.84 3.17 2.48
VegetablesAll potato products 0.80 1.62 1.08 0.82 0.64Dark-green vegetables 0.86 1.13 1.18 0.96 1.05Orange vegetables 0.74 0.61 0.68 0.86 0.72Canned and dry beans, lentils, and peas (legumes) 1.96 1.71 1.56 1.59 1.32Other vegetables 1.34 2.67 2.63 3.13 2.17
5.70 7.75 7.13 7.35 5.90
FruitsWhole fruits 5.99 4.84 6.59 5.21 3.50Fruit juices 0.90 1.72 1.43 1.45 1.57
6.90 6.56 8.02 6.66 5.07
Milk productsWhole milk, yogurt, and cream 1.43 0.80 0.81 1.14 0.67Lower fat and skim milk and lowfat yogurt 9.83 10.51 10.62 10.84 11.02All cheese (including cheese soup and sauce) 0.11 0.10 0.18 0.05 0.03Milk drinks and milk desserts 0.37 0.19 0.25 0.21 0.10
11.74 11.60 11.87 12.24 11.82
Meat and beansBeef, pork, veal, lamb, and game 0.46 0.69 0.86 0.70 0.78Chicken, turkey, and game birds 0.74 0.68 1.03 1.00 0.83Fish and fish products 0.54 0.36 0.44 0.42 0.04Bacon, sausages, and luncheon meats (including spreads) 0.07 0.06 0.09 0.01 0.02Nuts, nut butters, and seeds 0.70 0.53 0.76 0.73 0.79Eggs and egg mixtures 0.08 0.14 0.24 0.13 0.07
2.59 2.45 3.42 2.98 2.53
Other foodsTable fats, oils, and salad dressings 0.23 0.37 0.26 0.20 0.21Gravies, sauces, condiments, and spices 0.12 0.16 0.15 0.09 0.08Coffee and tea 0.00 0.00 0.00 0.00 0.01Soft drinks, sodas, fruit drinks, and ades (including rice beverages) 2.57 3.10 4.13 1.69 0.87Sugars, sweets, and candies 0.22 0.26 0.21 0.26 0.10Soups (ready-to-serve and condensed) 0.00 0.01 0.06 0.12 0.24Soups (dry) 0.04 0.01 0.02 0.00 0.01Frozen or refrigerated entrees (including pizza, fish sticks, frozen meals) 0.01 0.03 0.03 0.00 0.01
3.21 3.94 4.86 2.36 1.53
Notes: Food in as-purchased form, which includes uncooked grain products; raw, canned, and frozen vegetables; fruit juice concentrates; and meat withbones. Components of the market baskets are discussed in terms of pounds; therefore, fluids such as milk are weighted more prominently than are dryfoods, and juice concentrates are weighted less prominently than are their reconstituted forms.The numbers are rounded; thus, when summed, they may not equal the respective totals.

CNPP-20 ES-7
Table ES-1b. Moderate-Cost Food Plan market baskets, quantities of food purchased for a week, by age-gendergroup, 2007
ChildrenFood category 1 year 2-3 years 4-5 years 6-8 years 9-11 years
Total pounds 23.88 21.01 25.85 26.92 37.95
Pounds per weekGrainsWhole grain breads, rice, pasta, and pastries 1.05 0.48 0.96 0.72 0.77 (including whole grain flours)Whole grain cereals (including hot cereal mixes) 0.05 0.23 0.14 0.21 0.06Popcorn and other whole grain snacks 0.03 0.38 0.31 0.34 0.75Non-whole grain breads, cereals, rice, pasta, pies, pastries, snacks, and flours 0.36 0.82 1.23 1.50 1.33
1.48 1.90 2.64 2.78 2.91
VegetablesAll potato products 0.40 0.74 0.70 0.43 0.09Dark-green vegetables 1.31 0.72 0.80 0.88 3.19Orange vegetables 0.07 0.38 1.32 0.66 0.85Canned and dry beans, lentils, and peas (legumes) 0.47 0.55 0.41 1.28 1.59Other vegetables 4.65 1.69 2.98 2.65 4.14
6.90 4.09 6.21 5.91 9.86
FruitsWhole fruits 2.13 2.99 3.46 3.37 5.68Fruit juices 1.60 1.47 1.81 1.79 1.66
3.73 4.46 5.28 5.16 7.33
Milk productsWhole milk, yogurt, and cream 8.65 0.13 0.40 0.18 0.29Lower fat and skim milk and lowfat yogurt 0.00 8.63 8.40 8.62 12.77All cheese (including cheese soup and sauce) 0.02 0.01 0.04 0.03 0.01Milk drinks and milk desserts 0.05 0.00 0.07 0.07 0.07
8.72 8.77 8.91 8.89 13.14
Meat and beansBeef, pork, veal, lamb, and game 0.28 0.10 0.34 0.50 0.45Chicken, turkey, and game birds 0.23 0.05 0.29 1.32 0.58Fish and fish products 0.25 0.85 1.14 1.28 1.91Bacon, sausages, and luncheon meats (including spreads) 0.02 0.01 0.04 0.04 0.07Nuts, nut butters, and seeds 0.21 0.29 0.28 0.23 0.21Eggs and egg mixtures 0.02 0.14 0.03 0.03 0.03
1.01 1.44 2.12 3.39 3.26
Other foodsTable fats, oils, and salad dressings 0.10 0.26 0.16 0.21 0.34Gravies, sauces, condiments, and spices 0.36 0.04 0.13 0.12 0.46Coffee and tea 0.00 0.00 0.00 0.00 0.00Soft drinks, sodas, fruit drinks, and ades (including rice beverages) 0.14 0.04 0.24 0.34 0.49Sugars, sweets, and candies 0.02 0.02 0.05 0.03 0.08Soups (ready-to-serve and condensed) 0.20 0.01 0.09 0.08 0.04Soups (dry) 0.01 0.00 0.00 0.01 0.02Frozen or refrigerated entrees (including pizza, fish sticks, and frozen meals) 1.20 0.00 0.04 0.01 0.02
2.03 0.36 0.71 0.79 1.44
Notes: Food in as-purchased form, which includes uncooked grain products; raw, canned, and frozen vegetables; fruit juice concentrates; and meat withbones. Components of the market baskets are discussed in terms of pounds; therefore, fluids such as milk are weighted more prominently than are dryfoods, and juice concentrates are weighted less prominently than are their reconstituted forms.For children age 1, all milk and yogurt were assigned to the whole milk, yogurt, and cream category, because dietary guidance recommends consumptionof primarily whole milk products for these children.The numbers are rounded; thus, when summed, they may not equal the respective totals.
ES-8 The Low-Cost, Moderate-Cost, and Liberal Food Plans, 2007
Table ES-1b. Moderate-Cost Food Plan market baskets, quantities of food purchased for a week, by age-gendergroup, 2007 (cont’d)
MalesFood category 12-13 years 14-18 years 19-50 years 51-70 years 71+ years
Total pounds 37.43 44.04 45.00 41.20 38.99
Pounds per weekGrainsWhole grain breads, rice, pasta, and pastries (including whole grain flours) 0.29 2.25 2.39 1.74 0.82Whole grain cereals (including hot cereal mixes) 0.03 0.09 0.10 0.14 1.34Popcorn and other whole grain snacks 1.95 0.82 0.20 0.74 0.28Non-whole grain breads, cereals, rice, pasta, pies, pastries, snacks, and flours 1.35 1.89 2.04 1.30 0.88
3.62 5.05 4.74 3.92 3.32
VegetablesAll potato products 1.61 1.81 1.61 1.20 1.84Dark-green vegetables 0.50 1.07 1.12 1.10 2.95Orange vegetables 1.06 0.99 0.88 0.78 0.74Canned and dry beans, lentils, and peas (legumes) 2.21 3.11 2.64 1.61 1.51Other vegetables 2.99 3.10 3.39 3.59 2.86
8.37 10.08 9.64 8.28 9.90
FruitsWhole fruits 5.28 7.07 7.00 5.90 5.91Fruit juices 2.22 1.80 1.68 1.74 1.70
7.50 8.87 8.68 7.63 7.61
Milk productsWhole milk, yogurt, and cream 0.37 0.42 0.39 0.38 0.44Lower fat and skim milk and lowfat yogurt 12.94 12.12 12.33 12.82 12.03All cheese (including cheese soup and sauce) 0.08 0.11 0.13 0.06 0.11Milk drinks and milk desserts 0.17 0.20 0.15 0.14 0.15
13.55 12.85 13.00 13.41 12.73
Meat and beansBeef, pork, veal, lamb, and game 0.78 0.88 1.04 1.02 0.87Chicken, turkey, and game birds 0.71 2.07 2.95 3.79 2.22Fish and fish products 0.59 0.61 0.42 0.42 0.15Bacon, sausages, and luncheon meats (including spreads) 0.04 0.10 0.11 0.07 0.06Nuts, nut butters, and seeds 0.64 0.34 0.33 0.32 0.53Eggs and egg mixtures 0.08 0.12 0.17 0.16 0.10
2.85 4.13 5.03 5.78 3.92
Other foodsTable fats, oils, and salad dressings 0.25 0.44 0.47 0.31 0.39Gravies, sauces, condiments, and spices 0.17 0.26 0.46 0.21 0.21Coffee and tea 0.00 0.00 0.01 0.00 0.00Soft drinks, sodas, fruit drinks, and ades (including rice beverages) 0.97 1.93 2.64 1.40 0.62Sugars, sweets, and candies 0.06 0.14 0.13 0.11 0.07Soups (ready-to-serve and condensed) 0.00 0.24 0.15 0.12 0.21Soups (dry) 0.01 0.01 0.01 0.02 0.00Frozen or refrigerated entrees (including pizza, fish sticks, and frozen meals) 0.07 0.05 0.04 0.01 0.00
1.53 3.06 3.91 2.18 1.51
Notes: Food in as-purchased form, which includes uncooked grain products; raw, canned, and frozen vegetables; fruit juice concentrates; and meat withbones. Components of the market baskets are discussed in terms of pounds; therefore, fluids such as milk are weighted more prominently than are dryfoods, and juice concentrates are weighted less prominently than are their reconstituted forms.The numbers are rounded; thus, when summed, they may not equal the respective totals.

CNPP-20 ES-9
Table ES-1b. Moderate-Cost Food Plan market baskets, quantities of food purchased for a week, by age-gendergroup, 2007 (cont’d)
FemalesFood category 12-13 years 14-18 years 19-50 years 51-70 years 71+ years
Total pounds 37.56 36.49 38.94 38.53 34.58
Pounds per weekGrainsWhole grain breads, rice, pasta, and pastries (including whole grain flours) 1.30 1.53 1.09 2.67 2.11Whole grain cereals (including hot cereal mixes) 0.20 1.19 0.68 0.07 0.07Popcorn and other whole grain snacks 0.48 0.02 0.72 0.29 0.04Non-whole grain breads, cereals, rice, pasta, pies pastries, snacks, and flours 1.31 0.90 0.92 0.28 0.55
3.30 3.64 3.41 3.31 2.78
VegetablesAll potato products 1.04 1.26 1.49 1.19 0.89Dark-green vegetables 2.77 1.83 1.80 1.75 2.67Orange vegetables 0.84 0.68 1.59 0.90 0.72Canned and dry beans, lentils, and peas (legumes) 1.50 2.33 2.04 1.12 1.46Other vegetables 4.04 2.72 3.54 2.62 2.83
10.19 8.81 10.46 7.58 8.57
FruitsWhole fruits 5.63 5.07 5.14 7.80 4.93Fruit juices 1.79 1.64 1.50 1.57 1.61
7.41 6.71 6.64 9.38 6.55
Milk productsWhole milk, yogurt, and cream 0.76 0.58 0.40 0.06 0.22Lower fat and skim milk and lowfat yogurt 12.12 12.59 12.86 13.25 12.80All cheese (including cheese soup and sauce) 0.07 0.01 0.08 0.00 0.01Milk drinks and milk desserts 0.10 0.06 0.05 0.02 0.04
13.05 13.24 13.40 13.34 13.08
Meat and beansBeef, pork, veal, lamb, and game 0.47 0.78 0.86 0.45 0.75Chicken, turkey, and game birds 0.25 0.97 1.45 2.13 0.94Fish and fish products 1.13 0.26 0.32 0.56 0.13Bacon, sausages, and luncheon meats (including spreads) 0.03 0.01 0.02 0.00 0.01Nuts, nut butters, and seeds 0.12 0.24 0.58 0.54 0.79Eggs and egg mixtures 0.03 0.02 0.06 0.04 0.03
2.04 2.28 3.30 3.73 2.65
Other foodsTable fats, oils, and salad dressings 0.41 0.24 0.27 0.32 0.19Gravies, sauces, condiments, and spices 0.31 0.36 0.16 0.14 0.10Coffee and tea 0.00 0.00 0.00 0.00 0.00Soft drinks, sodas, fruit drinks, and ades (including rice beverages) 0.69 0.42 0.92 0.30 0.26Sugars, sweets, and candies 0.06 0.08 0.06 0.02 0.04Soups (ready-to-serve and condensed) 0.04 0.70 0.31 0.40 0.36Soups (dry) 0.00 0.00 0.00 0.01 0.00Frozen or refrigerated entrees (including pizza, fish sticks, and frozen meals) 0.05 0.01 0.02 0.00 0.00
1.57 1.81 1.75 1.18 0.96
Notes: Food in as-purchased form, which includes uncooked grain products; raw, canned, and frozen vegetables; fruit juice concentrates; and meat withbones. Components of the market baskets are discussed in terms of pounds; therefore, fluids such as milk are weighted more prominently than are dryfoods, and juice concentrates are weighted less prominently than are their reconstituted forms.The numbers are rounded; thus, when summed, they may not equal the respective totals.

ES-10 The Low-Cost, Moderate-Cost, and Liberal Food Plans, 2007
Table ES-1c. Liberal Food Plan market baskets, quantities of food purchased for a week, by age-gender group, 2007
ChildrenFood category 1 year 2-3 years 4-5 years 6-8 years 9-11 years
Total pounds 22.37 22.39 32.07 33.47 51.34
Pounds per weekGrainsWhole grain breads, rice, pasta, and pastries (including whole grain flours) 0.00 0.01 1.38 0.84 1.37Whole grain cereals (including hot cereal mixes) 0.23 0.10 0.12 0.07 0.07Popcorn and other whole grain snacks 0.00 0.40 0.20 0.50 0.46Non-whole grain breads, cereals, rice, pasta, pies, pastries, snacks, and flours 0.37 0.69 0.93 1.20 1.46
0.59 1.20 2.63 2.60 3.36
VegetablesAll potato products 0.64 1.22 0.73 0.76 2.16Dark-green vegetables 1.11 0.47 0.53 0.63 2.75Orange vegetables 0.10 0.41 0.95 0.64 2.27Canned and dry beans, lentils, and peas (legumes) 0.45 1.33 1.06 1.72 1.24Other vegetables 2.94 1.88 1.59 2.50 4.05
5.24 5.31 4.87 6.24 12.47
FruitsWhole fruits 3.66 2.49 9.98 9.06 14.67Fruit juices 1.57 1.28 1.86 1.73 1.88
5.23 3.77 11.84 10.79 16.55
Milk productsWhole milk, yogurt, and cream 9.54 0.36 0.23 0.27 0.35Lower fat and skim milk and lowfat yogurt 0.00 9.07 9.29 9.16 13.82All cheese (including cheese soup and sauce) 0.01 0.03 0.04 0.03 0.05Milk drinks and milk desserts 0.03 0.05 0.06 0.11 0.11
9.58 9.52 9.62 9.57 14.34
Meat and beansBeef, pork, veal, lamb, and game 0.25 0.13 0.31 0.54 0.68Chicken, turkey, and game birds 0.17 0.10 0.31 0.99 0.53Fish and fish products 0.27 0.85 1.21 1.11 1.01Bacon, sausages, and luncheon meats (including spreads) 0.01 0.08 0.03 0.09 0.21Nuts, nut butters, and seeds 0.27 0.18 0.32 0.40 0.57Eggs and egg mixtures 0.01 0.13 0.02 0.01 0.04
0.98 1.48 2.21 3.14 3.04
Other foodsTable fats, oils, and salad dressings 0.13 0.34 0.17 0.20 0.21Gravies, sauces, condiments, and spices 0.36 0.38 0.39 0.27 0.23Coffee and tea 0.00 0.00 0.00 0.00 0.00Soft drinks, sodas, fruit drinks, and ades (including rice beverages) 0.12 0.29 0.23 0.41 0.93Sugars, sweets, and candies 0.12 0.06 0.03 0.05 0.10Soups (ready-to-serve and condensed) 0.01 0.00 0.05 0.15 0.08soups (dry) 0.01 0.00 0.01 0.01 0.02Frozen or refrigerated entrees (including pizza, fish sticks, and frozen meals) 0.01 0.04 0.02 0.04 0.03
0.75 1.12 0.90 1.13 1.59
Notes: Food in as-purchased form, which includes uncooked grain products; raw, canned, and frozen vegetables; fruit juice concentrates; and meat withbones. Components of the market baskets are discussed in terms of pounds; therefore, fluids such as milk are weighted more prominently than are dryfoods, and juice concentrates are weighted less prominently than are their reconstituted forms.For children age 1, all milk and yogurt were assigned to the whole milk, yogurt, and cream category, because dietary guidance recommends consumptionof primarily whole milk products for these children.The numbers are rounded; thus, when summed, they may not equal the respective totals.

CNPP-20 ES-11
Table ES-1c. Liberal Food Plan market baskets, quantities of food purchased for a week, by age-gender group, 2007(cont’d)
MalesFood category 12-13 years 14-18 years 19-50 years 51-70 years 71+ years
Total pounds 43.50 49.01 50.36 48.87 46.94
Pounds per weekGrainsWhole grain breads, rice, pasta, and pastries (including whole grain flours) 0.37 2.59 1.34 2.23 1.92Whole grain cereals (including hot cereal mixes) 0.13 0.50 1.74 0.10 0.14Popcorn and other whole grain snacks 1.48 0.48 0.42 0.65 0.15Non-whole grain breads, cereals, rice, pasta, pies, pastries, snacks, and flours 2.07 1.47 1.72 1.45 0.95
4.04 5.04 5.22 4.43 3.16
VegetablesAll potato products 2.44 1.23 2.01 1.80 1.93Dark-green vegetables 0.84 1.06 1.58 1.97 4.70Orange vegetables 0.68 0.99 1.05 1.07 0.99Canned and dry beans, lentils, and peas (legumes) 2.93 2.70 2.96 2.51 2.82Other vegetables 4.13 5.51 4.66 4.20 3.08
11.01 11.48 12.26 11.55 13.52
FruitsWhole fruits 7.12 9.16 8.03 8.67 8.36Fruit juices 2.08 1.76 1.62 1.24 1.71
9.20 10.93 9.65 9.91 10.07
Milk productsWhole milk, yogurt, and cream 0.46 0.79 0.60 0.53 0.27Lower fat and skim milk and lowfat yogurt 13.67 13.34 13.06 13.40 13.32All cheese (including cheese soup & sauce) 0.08 0.09 0.22 0.09 0.05Milk drinks and milk desserts 0.14 0.16 0.24 0.48 0.21
14.36 14.36 14.12 14.50 13.85
Meat and beansBeef, pork, veal, lamb, and game 0.89 2.18 1.47 1.26 0.92Chicken, turkey, and game birds 0.23 0.25 1.66 1.54 2.64Fish and fish products 1.14 0.49 0.50 0.95 0.39Bacon, sausages, and luncheon meats (including spreads) 0.04 0.11 0.15 0.06 0.05Nuts, nut butters, and seeds 0.41 0.60 0.39 0.52 0.20Eggs and egg mixtures 0.27 0.11 0.18 0.17 0.08
2.99 3.73 4.36 4.51 4.28
Other foodsTable fats, oils, and salad dressings 0.34 0.38 0.50 0.52 0.51Gravies, sauces,condiments, and spices 0.42 0.44 0.50 0.22 0.30Coffee and tea 0.00 0.00 0.00 0.01 0.00Soft drinks, sodas, fruit drinks, and ades (including rice beverages) 0.79 1.77 3.30 2.85 0.56Sugars, sweets, and candies 0.08 0.35 0.16 0.13 0.06Soups (ready-to-serve and condensed) 0.23 0.52 0.25 0.20 0.62Soups (dry) 0.01 0.01 0.02 0.01 0.01Frozen or refrigerated entrees (including pizza, fish sticks, and frozen meals) 0.03 0.01 0.02 0.03 0.00
1.89 3.47 4.75 3.96 2.05
Notes: Food in as-purchased form, which includes uncooked grain products; raw, canned, and frozen vegetables; fruit juice concentrates; and meat withbones. Components of the market baskets are discussed in terms of pounds; therefore, fluids such as milk are weighted more prominently than are dryfoods, and juice concentrates are weighted less prominently than are their reconstituted forms.The numbers are rounded; thus, when summed, they may not equal the respective totals.

ES-12 The Low-Cost, Moderate-Cost, and Liberal Food Plans, 2007
Table ES-1c. Liberal Food Plan market baskets, quantities of food purchased for a week, by age-gender group, 2007(cont’d)
FemalesFood category 12-13 years 14-18 years 19-50 years 51-70 years 71+ years
Total pounds 47.82 41.68 46.93 41.15 40.32
Pounds per weekGrainsWhole grain breads, rice, pasta, and pastries (including whole grain flours) 1.29 1.89 1.69 2.24 2.09Whole grain cereals (including hot cereal mixes) 0.21 0.36 0.72 0.08 0.08Popcorn and other whole grain snacks 0.44 0.04 0.03 0.75 0.02Non-whole grain breads, cereals, rice, pasta, pies, pastries, snacks, and flours 1.66 1.21 1.26 0.44 0.84
3.60 3.50 3.69 3.50 3.04
VegetablesAll potato products 2.41 1.94 1.96 1.50 1.07Dark-green vegetables 1.46 1.73 3.14 1.18 4.65Orange vegetables 0.80 0.87 0.89 0.88 0.94Canned and dry beans, lentils, peas (legumes) 2.52 2.27 2.37 1.31 1.83Other vegetables 2.91 3.94 3.82 3.20 2.99
10.10 10.74 12.18 8.08 11.47
FruitsWhole fruits 12.18 6.07 9.42 9.88 7.38Fruit juices 1.73 1.58 1.65 0.44 0.39
13.91 7.65 11.06 10.32 7.78
Milk productsWhole milk, yogurt, and cream 0.37 0.39 0.33 0.21 0.19Lower fat and skim milk and lowfat yogurt 13.79 14.19 13.62 14.37 13.89All cheese (including cheese soup and sauce) 0.08 0.28 0.09 0.01 0.00Milk drinks and milk desserts 0.18 0.10 0.17 0.06 0.04
14.42 14.97 14.22 14.66 14.13
Meat and beansBeef, pork, veal, lamb, and game 1.30 0.96 0.86 0.86 0.80Chicken, turkey, and game birds 1.48 0.31 0.72 0.78 0.74Fish and fish products 0.60 0.39 0.54 1.30 0.46Bacon, sausages, and luncheon meats (including spreads) 0.08 0.14 0.08 0.00 0.05Nuts, nut butters, and seeds 0.28 0.70 0.76 0.64 0.79Eggs and egg mixtures 0.04 0.07 0.08 0.10 0.03
3.77 2.57 3.05 3.69 2.87
Other foodsTable fats, oils, and salad dressings 0.44 0.38 0.37 0.26 0.20Gravies, sauces, condiments, and spices 0.32 0.39 0.37 0.17 0.11Coffee and tea 0.00 0.00 0.00 0.00 0.00Soft drinks, sodas, fruit drinks, and ades (including rice beverages) 0.98 1.05 1.64 0.27 0.09Sugars, sweets, and candies 0.10 0.13 0.09 0.04 0.02Soups (ready-to-serve and condensed) 0.15 0.25 0.22 0.17 0.60Soups (dry) 0.02 0.00 0.01 0.01 0.01Frozen or refrigerated entrees (including pizza, fish sticks, and frozen meals) 0.02 0.03 0.04 0.00 0.00
2.02 2.24 2.74 0.92 1.04
Notes: Food in as-purchased form, which includes uncooked grain products; raw, canned, and frozen vegetables; fruit juice concentrates; and meat withbones. Components of the market baskets are discussed in terms of pounds; therefore, fluids such as milk are weighted more prominently than are dryfoods, and juice concentrates are weighted less prominently than are their reconstituted forms.The numbers are rounded; thus, when summed, they may not equal the respective totals.

CNPP-20 1
The Low-Cost, Moderate-Cost, and Liberal FoodPlans, 2007
Introduction
The U.S. Department of Agriculture’s (USDA) Low-Cost, Moderate-Cost, and LiberalFood Plans serve as national standards for nutritious diets at various cost levels. Each planrepresents a set of market baskets, applicable to one of 15 age-gender groups. Each marketbasket contains a selection of foods in quantities that reflect current dietary recommend-ations, food composition data, food prices, and actual consumption patterns. The threeplans, as well as the fourth, the Thrifty Food Plan, are the official USDA Food Plansmaintained by the USDA Center for Nutrition Policy and Promotion (CNPP). Revisedin 2007 (Carlson et al., 2007), the Thrifty Food Plan serves as the basis for maximumfood stamp allotments. Bankruptcy courts often use the value of the Low-Cost Food Planto determine the portion of a bankrupt person’s income to allocate to necessary foodexpenses. The Department of Defense uses the value of the Liberal Food Plan to determinethe Basic Allowance for Subsistence rates for all servicemembers. Many divorce courts usethe values of the USDA Food Plans to set alimony payments. The Low-Cost, Moderate-Cost, and Liberal Food Plans are used in USDA’s report Expenditures on Children byFamilies (Lino, 2007), which is used to set State child support guidelines and foster carepayments.
This report presents a revision of the market baskets of the Low-Cost, Moderate-Cost, andLiberal Food Plans to reflect recent changes in dietary guidance and incorporates updatedinformation on food composition, consumption patterns, and food prices at the sameinflation-adjusted cost of the previous three food plans.2 This report provides backgroundinformation on the newly revised market baskets of the Low-Cost, Moderate-Cost, andLiberal Food Plans and describes the data sources, dietary standards, and methods used torevise the market baskets. To illustrate some of the implications of the new market basketsof the three plans, CNPP compared them with both reported consumption patterns and theprevious market baskets.
The market baskets of the Low-Cost, Moderate-Cost, and Liberal Food Plans are importantas national standards that illustrate how a nutritious household diet based on variousbudgets can be attained. Past research has found that regardless of income level, mostpeople do not consume a healthful diet (Basiotis, Carlson, Gerrior, Juan, & Lino, 2002).Therefore, the market baskets of the three food plans are useful as guides in educationalprograms and as references for policies designed to assist families in efficiently budgetingtheir food expenditures and improving their diets.
2 “Previous” Low-Cost, Moderate-Cost, and Liberal Food Plans refer to the 2003 plans. The “newly revised,”“revised,” or “new” Low-Cost, Moderate-Cost, and Liberal Food Plans refer to the 2007 food plans.

2 The Low-Cost, Moderate-Cost, and Liberal Food Plans, 2007
Historical Background of the USDA Food Plans
For over 100 years, the USDA has prepared guides for selecting nutritious diets atdifferent cost levels. In 1894, the Department published information on the quantity offoods purchasable at a relatively economical price level that met the nutrient standard forthe average American male undertaking moderate physical work. In this original food plan,nutrient needs, food composition, and the price of foods were factored in—the criteriastill used in the development of food plans (Cofer, Grossman, & Clark, 1962).
In the 1920s, research had demonstrated the presence of minerals and vitamins in foodsand their dietary benefits. USDA developed basic food plans that were adequate innutrients, moderate in cost, and satisfying in flavor. These early food plans and dietguides provided consumers with practical and economical advice on healthful eating. Inthe 1930s, USDA developed four nutritious food plans at different cost levels for familieswith varying incomes. These plans were (1) the Restricted Food Plan for Emergency Use,(2) the Minimum-Cost Food Plan, (3) the Moderate-Cost Food Plan, and (4) the Liberal-Cost Food Plan. The two lower cost food plans were used in programs for low-incomefamilies affected by the Depression and were replaced in the early 1940s by the Low-CostFood Plan. The early food plans were revised periodically to reflect changes in dietaryguidance, consumption behavior, and food prices (Cofer et al., 1962).
In 1961, the Economy Food Plan was developed as a nutritionally adequate diet for short-term or emergency use. This plan, priced at less than the Low-Cost Plan, served as thebasis for maximum food stamp allotments, as stipulated in the 1964 Food Stamp ProgramAct. In 1975, the Economy Food Plan was replaced by the Thrifty Food Plan, whichrepresented a completely new set of market baskets but at the same minimal cost as theEconomy Food Plan. The Thrifty Food Plan was also designed for long-term use. As thenew basis for the maximum food stamp allotments, the Thrifty Food Plan represented aminimal cost diet based on up-to-date dietary recommendations, food composition data,food habits, and food price information.
All four food plan market baskets were revised periodically to reflect changes in dietaryguidance, eating patterns, and food prices. The market baskets of the Thrifty Food Planwere revised last year (Carlson et al., 2007) with data from the 2001-2002 National Healthand Nutrition Examination Survey (NHANES) and the 2001-2002 Food Price Database(which was constructed by merging information from the 2001-2002 NHANES on foodsconsumed with price data from the Nielsen Homescan™ Panel). The previous revision ofthe Low-Cost, Moderate-Cost, and Liberal Food Plans was in 2003; 1989-91 data wereused (Carlson et al., 2003).
This current revision of the Low-Cost, Moderate-Cost, and Liberal Food Plans is thecounterpart to the recent revision of the Thrifty Food Plan, and it captures importantchanges in nutrient content of foods, food preparation methods, eating patterns, and priceinformation that have occurred since 1989-91. Also, since the 2003 market baskets were
CNPP-20 3
released, dietary guidance has been updated with the issuance of the Dietary ReferenceIntakes (DRIs) in 1997 through 2005, the 2005 Dietary Guidelines for Americans, and the2005 MyPyramid Food Guidance System. Lastly, relative food prices have changed overtime, affecting food choices and consumption patterns and thereby representing anotherreason for the revision.
Data
Two main data sets were used in revising the Low-Cost, Moderate-Cost, and Liberal FoodPlan market baskets: the Federal Government’s 2001-2002 NHANES and the 2001-2002Food Price Database.
2001-2002 National Health and Nutrition Examination SurveyNHANES provides information about participants’ consumption of foods and nutrients,as well as extensive health-related data and information about participants’ demographicand socioeconomic characteristics. NHANES data for 2001-2002, the most recent dataavailable at the time of this revision, were used to update the market baskets of the Low-Cost, Moderate-Cost, and Liberal Food Plans. The previous revision of these marketbaskets was based on data from the Federal Government’s 1989-91 Continuing Surveyof Food Intakes by Individuals, which has since been integrated with NHANES.
NHANES 2001-2002, a complex, multistage probability sample of the civilian non-institutionalized population of the United States, consists of a sampling of individualsof all ages. NHANES 2001-2002 also includes expanded samples of low-income people,Mexican Americans, African Americans, adolescents 12 to 19 years old, and adults60 years old and older.3
For NHANES 2001-2002, individuals’ dietary intakes were collected for 1 day. Priorresearch has indicated that food intake data based on 1-day dietary recall are reliablemeasures of usual intakes of population groups (Basiotis, Welsh, Cronin, Kelsay, & Mertz,1987). Data were collected through an in-person interview with respondents. A 24-hourdietary recall was administered by an interviewer in a mobile examination center.Typically, for children less than 6 years old, information was provided by a parent (or aproxy); the parent or proxy could also consult with others, such as a daycare provider,regarding what the child ate. For 6- to 11-year-olds, intake information was provided bythe child, with assistance typically from a parent (or proxy). Information about dietaryintake for individuals 12 years old and older was self-reported.
3 For more information on NHANES data, seewww.cdc.gov/nchs/data/nhanes/nhanes_01_02/general_data_release_doc.pdf.

4 The Low-Cost, Moderate-Cost, and Liberal Food Plans, 2007
This revision of the market baskets of the Low-Cost, Moderate-Cost, and Liberal FoodPlans is based upon data collected from participants ages 1 year old and older. The finalsample for this revision of the three food plans consisted of 6,753 individuals.4 Pregnantand lactating women were excluded. The final sample reported consuming about 4,152different foods. Information about the ingredients, nutrient content, and amount consumedof each of these foods is contained in the NHANES data sets. CNPP used statisticalweights to ensure that the sample for the plans was representative of the U.S. population.
2001-2002 Food Price DatabaseThe 2001-2002 Food Price Database was created by CNPP, with assistance from USDA’sEconomic Research Service and USDA’s Food and Nutrition Service, by merging infor-mation about food consumption from NHANES with national data on food prices fromthe 2001 and 2002 Nielsen Homescan™ Panels (2005). The Panels contain the prices paidfor food items by 16,821 households, selected and weighted to reflect the U.S. population,in the 48 coterminous States. The food purchases of these households were tracked over a1-year period and include items normally not in supermarket scanner data, such as freshproduce, random-weight meats, and bakery products that are priced by the item. Foodspurchased at supermarkets, convenience stores, warehouse clubs, mass merchandisers,and drug stores are included.
The two data sources were merged because NHANES has extensive information aboutreported food intake but does not contain information about food prices or foodexpenditures. For the previous revision of the USDA Food Plans, CNPP constructed asimilar database (Bowman, 1997).
Creation of the Food Price Database involved the following steps:
1. Identifying all foods reported as being consumed by individuals participating inNHANES 2001-2002.
2. Identifying which foods should be purchased in the ready-to-eat or ready-to-heatform and which foods should be prepared at home from purchased ingredients.
3. Reviewing the recipes for foods prepared at home for practicality (e.g., ingredientsthat could be easily purchased, such as dried beans, but are being bought in canned orfrozen form; using convenience items such as box mixes and seasoning packets; andpurchasing items such as ready-to-use sauces, pie crusts, and breads).
4. Converting all foods from the partially prepared ingredients in the recipes (e.g.,cooked pasta, peeled and cored apples) to the purchasable form by adjusting forrefuse factors and cooking loss or gain.
5. Pricing all foods and ingredients by using data from the 2001 and 2002 NielsenHomescan™ Panels.
6. Putting the ingredients’ cost into the recipes and calculating the price of the foodin the “as-consumed” form.
4 This sample consists of people with food expenditures in the top three quartiles of food spending becausethe Low-Cost, Moderate-Cost, and Liberal Food Plans traditionally have applied to these quartiles. This isexplained more fully in the methods section.
CNPP-20 5
For many foods, the USDA food codes used to code dietary intake data distinguish thelevel of convenience the consumer selects. For example, macaroni and cheese has codesthat detail whether it is made from scratch, made from a box mix, or purchased as a frozenentree. For other foods, CNPP reviewed data on foods most frequently consumed byparticipants in NHANES to determine the form in which foods were most likely purchased.Commercially prepared foods were matched directly to foods in the Nielsen data to obtaina price. For foods prepared at home, CNPP used data from version 1 of the USDA’s Foodand Nutrient Database for Dietary Studies (FNDDS) to break the foods down into specificingredients. Because these recipes were originally created to calculate the nutrient contentof foods rather than the price, some recipes had to be modified to match ingredients thatpeople could reasonably purchase in stores. This process generated an additional list ofitems that could be purchased in the ready-to-eat form as well as additional convenienceitems to use in preparing foods.
Other foods represented in the FNDDS recipes are cooked or processed (peeled, shelled,etc.) and must be adjusted to retail form before pricing. For such foods, cooking and refuseconversion factors that adjust for the loss or gain in food weight due to cooking andpreparation were applied to all relevant ingredients.5
For example, steamed vegetables were converted to raw, unprepared forms, and cookedpasta was converted to its uncooked form. Similarly, cooked eggs were converted to eggswith shells, and peeled bananas were converted to their purchasable form with the peel.For more information on the development of the Food Price Database, see Bowman (1997)and Carlson et al. (2007 manuscript in preparation).
To determine retail prices that would be used to calculate the costs of foods, CNPP usedthe 2001 and 2002 Nielsen Homescan™ Panels. The average price paid by these house-holds for each food item bought was calculated. All brands and brand sizes of a foodreported as purchased during the year were used in determining prices and calculated on aper unit basis. If a household purchased a food item more than once, all purchase occasionswere used to determine average price per unit. For example, for skim milk, all brands,sizes, and purchase occasions of skim milk bought by households during the year wereused in determining the price per gram of skim milk. Foods were priced in dollar amountsper 100 grams.
The calculated average prices were then matched to each food reported consumed byparticipants age 1 year and older in NHANES 2001-2002. Ingredients in a food item,such as milk, eggs, butter, and salt in scrambled eggs, were priced separately.
5 USDA National Nutrient Database for Standard Reference (Release 16 and 18, Nutrient Data Laboratoryhome page, http://www.ars.usda.gov/Services/docs.htm?docid=8964) contains data on the weight of cookedand uncooked foods as well as refuse factors. These data permit computation of cooking conversion factors.Some waste conversion factors that adjust for waste when food is prepared (e.g., due to peeling, coring, slicing,de-boning, dicing, and draining in the case of canned goods) are found in USDA Agriculture Handbook No.102 Food Yields: Summarized by Different Stages of Preparation (USDA, 1975). Food ingredients that arecooked and/or have a waste factor were converted by using either or both conversion factors and then priced.
6 The Low-Cost, Moderate-Cost, and Liberal Food Plans, 2007
All food ingredients were then converted back to the prepared form in the recipe, and thefood was priced per 100 grams. To illustrate, first, scrambled eggs were separated intoingredients: eggs without the shell, milk, butter, and salt. Second, these ingredients werethen adjusted for loss in weight due to cooking (e.g., the loss of moisture in eggs and milk)and for refuse in food preparation (e.g., the shell of the egg). Third, using Nielsen data,CNPP derived national average prices paid by all households to estimate the price of eachof the ingredients per 100 grams. Fourth, the food ingredients were then regrouped into thefood that participants reported consuming—the scrambled eggs—and this food was pricedper 100 grams.
For some infrequently purchased food items, such as deer meat, Nielsen data did notcontain prices. Proxy prices were therefore used. The proxies were determined by usingthe closest substitute for the food item or food services found on the World Wide Web.This applied to less than 5 percent of the as-consumed foods.
Methods
Development of the Low-Cost, Moderate-Cost, and Liberal Food Plans includes threemajor steps. First is the selection of a survey sample to use as the basis for each food planat a particular cost level. Second is the establishment of dietary standards and a cost limitfor the food plan. Third is the use of a computerized mathematical optimization model todevelop the food plan. This model should be designed to identify food market basketsrepresenting a diet as close as possible to actual food consumption patterns to meet thedietary standards and the cost limit desired.
An overview of the model used to update the market baskets of the Low-Cost, Moderate-Cost, and Liberal Food Plans is depicted in figure 1. For each plan, CNPP calculated arevised market basket for 15 age-gender groups: Children ages 1, 2 to 3, 4 to 5, 6 to 8, and9 to 11; females ages 12 to 13, 14 to 18, 19 to 50, 51 to 70, and 71 and over; and malesages 12 to 13, 14 to 18, 19 to 50, 51 to 70, and 71 and over.6 These age-gender groupingsare different from those of the previous USDA Food Plans. Grouping in this way alignsmore closely the age-gender groups with those of the Dietary Reference Intakes (DRIs).Individual market baskets of the Low-Cost, Moderate-Cost, and Liberal Food Planscalculated for each age-gender group may be combined to form a respective market basketfor the household.
The Low-Cost, Moderate-Cost, and Liberal Food Plans have historically reflected theconsumption patterns and eating habits of people according to quartiles of food spending:the Low-Cost Plan corresponds to participants’ food consumption in the second quartile(25th to 50th percentile) of food expenditure; the Moderate-Cost Plan, the third quartile(50th to 75th percentile) of food expenditure; and the Liberal Plan, the upper quartile
6 Nineteen-year-olds were assigned the respective market baskets of the 20- to 50-year-old age-gender groupsbecause of similarity in nutritional needs.

CNPP-20 7
(75th to 100th percentile) of food expenditure. Because the model inputs for the three foodplans should reflect the consumption patterns of people in these quartiles, CNPP assignedeach individual to one of these quartiles based on their food expenditure relative to theexpenditure of others in the same age-gender group and calculated the inputs only forpeople in the quartile. We will refer to each of these 15 age-gender groups and the asso-ciated three expenditure quartiles as food plan groups; there are a total of 45 food plangroups.
For modeling purposes, CNPP assigned each of the 4,152 foods reported in NHANES2001-2002 to one of 58 food categories. Table 1 presents these 58 food categories andsome example foods in each. Foods were assigned to food categories based on similarityof nutrient content, food costs, number of cup or ounce equivalents in MyPyramid, anduse in meals. (See appendix 1 for Food Category Database Documentation.)
To calculate a Low-Cost, Moderate-Cost, and Liberal Food Plan market basket for eachage-gender group, CNPP estimated 45 mathematical optimization models for each of thefood plan groups. For each food plan group, the model selected the optimal food planthat met the dietary standards and cost constraints, with as little change as possible fromreported food consumption. Each model consisted of four sets of data inputs related tothe 58 food categories, subject to three sets of constraints. The food category inputs wereaverage consumption, average cost per 100 grams, average nutrient profile per 100 grams,and average MyPyramid ounce or cup equivalents profile per 100 grams. The cost inputswere calculated by using the foods consumed by people in each food plan group and theFood Price Database created by CNPP.
Figure 1. Food Plan Model
Average Consumptionof 58 Food Categories
for 15 Age-Gender Groups
Cost per 100 Grams of 58 Food Categories
Nutrient Profile of58 Food Categories
per 100 Grams
MyPyramid Profileof 58 Food Categories
per 100 Grams
OptimizationProcess Solution Output
Food Plan Market Baskets for the
15 Age-Gender Groups
Dietary Standardsfor 15 Age-Gender Groups
MyPyramid Recommendations
for 15 Age-Gender Groups
Food Plan MaximumCost Allotment for
15 Age-Gender Groups
Inputs Constraints
MathematicalOptimization
Process
Conversion Process(From 58 Food
Categories to 29)

8 The Low-Cost, Moderate-Cost, and Liberal Food Plans, 2007
Table 1. Food categories and examples of foods in each category, Low-Cost, Moderate-Cost, and Liberal Food Plans,2007
Food category Examples of foods
GrainsBreads, yeast and quick—whole grain (n = 38) Whole wheat, multigrain, or pumpernickel breads, rolls, bagels, scones, English muffins, biscuits,
tortillas, and pancakes—all with 50% or more of ounce equivalents1 from whole grain
Breads, yeast and quick—non-whole grain (n = 271) White, French, potato, bran, or rye breads and rolls; muffins, English muffins, bagels, waffles,corn tortillas, taco shells, cornbread, and pancakes—all with less than 50% of ounceequivalents from whole grain
Breakfast cereal—whole grain, regular calories2 Cooked cereals (e.g., oatmeal and bulgur) with sugars, fat, and whole milk or 2% milk added;(n = 74) sweetened ready-to-eat cereals (e.g., frosted wheats and granola)—all with 50% or more of
ounce equivalents from whole grain
Breakfast cereal—whole grain, low calories2 Cooked cereals (e.g., oatmeal, bulgur, and buckwheat groats) without added sugars or fat;(n = 54) nonsweetened ready-to-eat cereals (e.g., shredded wheat and mueslix)—all with 50% or more
of ounce equivalents from whole grain
Breakfast cereal—non-whole grain (n = 214) Cooked cereal (e.g., cream of wheat, grits, and oat bran); sweetened or nonsweetened ready-to-eat cereals (e.g., frosted cornflakes and puffed rice)—all with less than 50% of ounceequivalents from whole grain
Rice and pasta—whole grain (n = 15) Brown rice, wild rice, whole wheat pasta (e.g., macaroni, spaghetti, and noodles)—all with50% or more of ounce equivalents from whole grain
Rice and pasta—non-whole grain (n = 48) Long or short white rice, sweet rice, rice noodles and pasta (e.g., macaroni, spaghetti, andnoodles)—all with less than 50% of ounce equivalents from whole grain
Cakes, pies, and other sweet bakery Oatmeal cookies, granola cookies, whole wheat doughnuts, granola bars, and graham crackers—products—whole grain (n = 20) all with 50% or more of ounce equivalents from whole grain
Cakes, pies, and other sweet bakery Pies, cookies, pastries, doughnuts, shortbread; all cakes (e.g., white, yellow, shortcake, sponge,products—non-whole grain (n = 425) pound, and angel food); croissants; and sweet rolls—all with less than 50% of ounce
equivalents from whole grain
Grain-based snacks—whole grain (n = 30) Popcorn, salty snacks, crackers, multigrain pretzels, and puffed wheat cakes—all with 50% ormore of ounce equivalents from whole grain
Grain-based snacks—non-whole grain (n = 58) Crackers (e.g., soda, oyster, cheese, and rice); hard or soft pretzels; and salty snacks (e.g.,tortilla chips)—all with less than 50% of ounce equivalents from whole grain
Grain mixtures—regular fat (n = 229) Foods such as tacos, burritos, enchiladas, pizzas, egg rolls, and pasta and rice with meat wheregrain is major ingredient and containing 6% or more fat by weight
Grain mixtures—lowfat (n = 140) Foods such as rice and pasta with vegetables and/or beans, noodle or rice soups withvegetables and/or meat, and garden rolls where grain is major ingredient and containing lessthan 6% fat by weight
Vegetables and fruitsPotato products—regular fat (n = 34) French-fried potatoes, potato chips, hash browns, potato puffs, potato patty; and potato salads
and mashed potatoes with added fat, eggs, or cheese
Potato products—lowfat (n = 60) Boiled, baked, scalloped, mashed, and stuffed potatoes; and potato salad, German style
Dark-green vegetables—added fat (n = 34) All dark-green vegetables such as broccoli, spinach, chard, collard greens, mustard greens, andDark-green vegetables—no added fat (n = 21) kale—with or without fat added
Orange vegetables—added fat (n = 28) All orange vegetables such as carrots, pumpkin, winter squash, and sweet potatoes—with orOrange vegetables—no added fat (n = 28) without fat added
Tomatoes—added fat (n = 32) Tomato, tomato sauce, tomato puree, tomato paste, tomato soup, and tomato juice—with orTomatoes—no added fat (n = 37) without fat added
Other vegetables—added fat (n = 136) All other vegetables such as green beans, beets, cabbage, cauliflower, corn, eggplant, green peas,Other vegetables—no added fat (n = 163) iceberg lettuce, bell pepper, snow peas, turnip, and Brussels sprouts—with or without fat added
Mixed vegetables—added fat (n = 101) Foods such as stuffed vegetables, creamed peas and carrots, batter-dipped fried vegetables, andMixed vegetables—no added fat (n = 43) vegetable stir-fry where vegetables are the primary ingredient—with or without fat added
1The following each counts as 1 ounce equivalent (1 serving) of grains: 1/2 cup cooked rice, pasta, or cooked cereal; 1 ounce dry pasta or rice; 1 slice ofbread; 1 small muffin (1 oz); 1 cup ready-to-eat cereal flakes.2In this context, “calories” refers to total calories from discretionary solid fat and added sugars in the product. Discretionary solid fat in cereals is the fatthat is solid at room temperature and is added to the cereals during processing or at the table.
Note: n refers to number of food codes in the food category.

CNPP-20 9
Table 1. Food categories and examples of foods in each category, Low-Cost, Moderate-Cost, and Liberal Food Plans,2007 (cont’d)
Food category Examples of foods
Citrus fruits, melons, and berries (n = 62) Oranges, grapefruits, limes, lemons, and tangelos; melons (e.g.,watermelon, cantaloupe, andhoneydew); berries (e.g., strawberries, blueberries, cranberries, raspberries, and blackberries)
Citrus fruit, melon, and berry juices (n = 38) 100% fruit juices made from citrus fruits, melons, and berries
Fruits other than citrus fruits, melons, and berries Fruits such as bananas, apples, cherries, peaches, pears, grapes, plums, papayas, and apricots(n = 185)
Fruit juices other than citrus, melon, and berry 100% fruit juices made from fruits other than citrus fruits, melons, and berries(n = 70)
Milk productsMilk and milk-based foods—regular fat (n = 56) All fluid, evaporated, condensed, and dry whole milk; regular yogurt; all fluid creams; cream
substitutes; cream cheese; and dips
Milk and milk-based foods—lower fat (n = 38) All fluid, evaporated, and dry reduced-fat and skim milks; buttermilk; and lowfat or nonfatyogurts
Cheese (n = 98) Natural, processed, and imitation cheeses; cottage cheese; cheese spreads; cheese dips; andcheese soups
Milk-based drinks and desserts—regular fat Milk-based drinks (e.g., malted milk, hot chocolate, eggnogs, cocoa, infant formulas, and(n = 125) meal-replacement drinks) with fat equivalent to that of whole milk; dairy desserts (e.g., ice
cream, frozen yogurt, ice milk, custard, and puddings) having more than 6% fat by weight
Milk-based drinks and desserts—lower fat Milk-based drinks made with reduced-fat or skim milk and dairy desserts having 6% or less fat(n = 136) by weight
Meat and beansRed meats—regular discretionary solid fat,3 Beef (e.g., battered and fried steak, barbecued short ribs, and pot roast), pork (e.g., fresh ham,regular cost4 (n = 59) loin, and spareribs), lamb (e.g., roast), game meats, and jerky—all with more than the median
amount of discretionary solid fat
Red meats—regular discretionary solid fat, Pork (e.g., skin, ground, chop, roast, cutlet, and bacon), beef (e.g., brisket, short ribs, necklow cost4 (n = 61) bones, regular ground beef, and corned beef), lamb (e.g., ground or chop), and organ meats—all
with more than the median amount of discretionary solid fat
Red meats—low discretionary solid fat, Lean beef (e.g., steak, veal, and oxtail), lean only pork (e.g., roast, steak, fresh ham, and loin),regular cost (n = 62) lamb (e.g., ribs and loin chop), and game meats—all with the median amount of discretionary
solid fat or less
Red meats—low discretionary solid fat, Lean pork (e.g., lean spareribs and smoked or cured roast), lean only beef (e.g., brisket),low cost (n = 74) lamb (e.g., shoulder chop), and game meats—all with the median amount of discretionary solid
fat or less
Poultry—regular discretionary solid fat, Coated and fried poultry (e.g., breast, leg, thigh, and drumstick) purchased without skin—allregular cost (n = 50) with more than the median amount of discretionary solid fat
Poultry—regular discretionary solid fat, Coated and fried dark meat (e.g., wing, thigh, and drumstick) purchased with skin; nuggets; andlow cost (n = 42) organ meats of chicken, turkey, and game birds purchased with skin—all with more than the
median amount of discretionary solid fat
Poultry—low discretionary solid fat, Roasted or broiled poultry (e.g., breast, thigh, and drumstick) purchased without skin—all withregular cost (n = 54) the median amount of discretionary solid fat or less
Poultry—low discretionary solid fat, Smoked or roasted white and dark meat mixture or dark meat (e.g., thigh and drumstick)low cost (n = 156) purchased with skin (but skin not consumed); turkey and game birds purchased with skin (but
skin not consumed); and canned chicken soups—all with the median amount of discretionarysolid fat or less
3Discretionary solid fat in meats is the fat that is solid at room temperature and is the excess fat from (1) the meat and beans group (including meats,poultry, fish, eggs, nuts, and seeds) beyond amounts that would be consumed if only the lowest fat forms were eaten and (2) solid fats added to thesefoods in preparation or at the table.4The top 66.66 percent of foods were placed in the regular-cost category; the bottom 33.33 percent of foods, in terms of cost, were placed in the lowestcost category.
Note: n refers to number of food codes in the food category.

10 The Low-Cost, Moderate-Cost, and Liberal Food Plans, 2007
Table 1. Food categories and examples of foods in each category, Low-Cost, Moderate-Cost, and Liberal Food Plans,2007 (cont’d)
Food category Examples of foods
Fish—regular discretionary solid fat, Fish, pan-fried or baked with solid fat (e.g., fresh tuna, swordfish, trout, salmon, ocean perch,regular cost (n = 60) and porgy) and battered and fried shellfish (e.g., scallops, oyster, shrimp, and crab)—all with
more than the median amount of discretionary solid fat
Fish—regular discretionary solid fat, Fish sticks or other fried and battered fish (e.g., mullet, smelt, haddock, herring, and catfish)—alllow cost (n = 54) with more than the median amount of discretionary solid fat
Fish—low discretionary solid fat, Broiled, steamed, or smoked fresh fish (e.g., tuna, salmon) and fresh shellfish (e.g., crab andregular cost (n = 37) clams)—all with the median amount of discretionary solid fat or less
Fish—low discretionary solid fat, Canned fish (e.g., tuna, sardines, and herring), canned shellfish (e.g., shrimp), and cannedlow cost (n = 54) seafood-based soups and chowders—all with the median amount of discretionary solid fat or less
Lunch meats, sausages, and bacon—regular fat Sausages, salami, frankfurters, bologna, sliced ham, bacon, and pastrami(n = 55)
Lunch meats, sausages, and bacon—lowfat Sausages, salami, frankfurters, bologna, sliced ham, bacon, and pastrami containing 25% less fat(n = 41) than regular fat form
Eggs and egg mixtures (n = 69) Fresh, frozen, and dried eggs; egg substitutes; meringues; and egg mixtures
Meat, poultry, and fish mixtures— Meat, poultry, and fish with grains or vegetables with more than the median amount ofregular discretionary solid fat (n = 345) discretionary solid fat
Meat, poultry, and fish mixtures— Meat, poultry, and fish with grains or vegetables with the median amount of discretionary solidlow discretionary solid fat (n = 355) fat or less
Dry beans, peas, lentil dishes, and mixtures Black, red, pinto, lima, white, mung, and kidney beans and all types of peas—all with or without(n = 113) other foods; soybean products (e.g., miso, tofu, and soybean-based meat substitutes)
Nuts and seeds (n = 74) Nuts, peanut butter and other nut butters, nut mixtures, carob, and seeds (e.g., sunflower, sesame,and pumpkin)
Other foodsFats, oils, salad dressings, sauces, and condiments Butter, margarine, vegetable oils (e.g., corn, olive, and sunflower), butter blends, salad oils,(n = 188) lard, shortenings, all salad dressings, mayonnaise, pickles, relishes, salsa, soy sauce,
catsup, tomato paste, and gravies and sauces
Coffee and tea (n = 81) Instant, ground, and fluid coffees and teas with or without caffeine and with or without sugar orsweeteners
Fruit drinks, soft drinks, and ades—regular calorie Fruit drinks, cola- and pepper-type soft drinks, ginger ale, root beer, fruit punches, ades (e.g.,(n = 89) lemonades and limeades), and other sodas containing sugar
Fruit drinks, soft drinks, and ades—low calorie Sugar-free or low-sugar drinks such as cola- and pepper-type soft drinks, ginger ale, root beer,(n = 35) fruit-flavored drinks, fruit punches, ades, and other sodas
Sugars and sweets (n = 215) All types of sugars, sweeteners, and syrups (e.g., honey, jams, jellies, marmalades, preserves,icings, gelatin desserts, marshmallow, and fudge); all types of candies and chocolates; andchewing gum
Note: n refers to number of food codes in the food category.

CNPP-20 11
The average nutrient profile per 100 grams and the average MyPyramid ounce or cupequivalents profile per 100 grams were calculated by using the foods consumed by allindividuals in the plan and the MyPyramid cup and ounce equivalence database provided byUSDA’s Agricultural Research Service. The constraints were dietary standards, MyPyramidfood consumption recommendations, and costs of the food plan market baskets (correspondingto the period of food consumption data, 2001-2002).
Similar to the methods of the previous food plans, as well as the recently revised Thrifty FoodPlan, and consistent with research on household discard of edible and spoiled food (USDA,1983a; USDA, 1983b), CNPP also added an allowance to both reported intake for each of the58 food categories and the dietary constraints in the model for each food plan to account forfood waste. Household discard of edible food could result from plate waste or spoilage. Theallowances factored into each food plan to account for waste were as follows: 10 percent forthe Low-Cost Food Plan, 20 percent for the Moderate-Cost Food Plan, and 30 percent for theLiberal Food Plan (USDA, 1983a; USDA, 1983b). These percentage factors to account forfood waste, while dated, are the only ones available that are applicable to households withvarying food expenditures.
Model Inputs
Average Consumption of Each of the Food CategoriesTo create acceptable market baskets, the optimization model minimizes deviations from thefood consumption habits of individuals in each food plan group. That is, the final marketbaskets are as close as possible to people’s original consumption habits, while still meetingdietary and cost constraints. To obtain acceptable market baskets, CNPP determined andentered the average consumption patterns of each of the 15 age-gender groups for the 58 foodcategories into each model for the Low-Cost, Moderate-Cost, and Liberal Food Plans. Forexample, the average consumption pattern of a child age 9-11 in the third quartile of foodexpenditure was entered into the model when the market basket was estimated for theModerate-Cost Food Plan for a child age 9-11.
Although the revised food plans incorporate average consumption, they do deviate fromaverage consumption to satisfy the dietary standards of each plan. This deviation occursbecause average consumption levels of many foods—especially fruits and vegetables—is farbelow recommended consumption levels; whereas, consumption of some other foods or foodcomponents—fats, added sugars, and sodium—is above recommendations. Few Americanshave a good diet as determined by the Healthy Eating Index (Basiotis et al., 2002).

12 The Low-Cost, Moderate-Cost, and Liberal Food Plans, 2007
Average Price of the Food CategoriesEach of the 4,152 foods in the Food Price Database was assigned to one of the 58 foodcategories. For each of the three food plans, the weighted average price per 100 grams ofeach of these food categories was then determined based on the average consumption byall people in the age-gender group within the corresponding expenditure group. Forexample, the food category “fruits other than citrus fruits, melons, and berries” includesapples, apricots, bananas, and cherries. The average price per 100 grams of food in thiscategory was based on the average price of these individual food items weighted by theirconsumption share. Apples and bananas received a greater weight proportionately becauseof more frequent consumption. The average price of the 58 food categories was calculatedfor each age-gender group in the second, third, and upper food-spending quartiles. Theprices for each food category differed among the food plan groups because consumption offood by individuals in each varied. For instance, the average price of the “fruits other thancitrus fruits, melons, and berries” was estimated for a female age 20 to 50 in the Moderate-Cost Food Plan by using the consumption patterns of 20- to 50-year old females in thethird quartile of food spending.
Nutrient Profile and MyPyramid Equivalents Profile of Each of theFood CategoriesThe 2001-2002 NHANES contains information about the nutrient content (including foodenergy, vitamins, minerals, and other food components, such as cholesterol and dietaryfiber) of each of the foods that participants reported consuming. Using this database, foreach food plan, CNPP calculated the weighted average nutrient content of each of the 58food categories per 100 grams. For example, the “poultry, low-discretionary solid fat andlow-cost group” consists of foods, such as roasted chicken drumstick without skin, boiledchicken leg, and canned chicken soup. The average nutrient profile of this food categorywas based on the average consumption of each food item by all people in the respectivespending quartiles. The average consumption by all people was used because sample sizesfor some age-gender groups were too small to produce reliable estimates, especially forinfrequently consumed foods.
For the purposes of nutrient analysis, CNPP assumed that foods made with a recipe thatincluded table salt, such as eggs and vegetable casseroles, were prepared without addedsalt. This assumption resulted in a reduced estimate of the sodium content of foods.However, the salt content of ready-to-eat or ready-to-heat foods, such as spaghetti sauce,canned goods, and baked goods, was held at the level given in the FNDDS, even if thesefoods were used in a recipe (e.g., spaghetti sauce used in a casserole). Sodium content as itoccurs naturally in foods, such as seafood and milk, was not altered.
The MyPyramid ounce or cup equivalents profile of each of the 58 food categories wasalso an input into the model for each food plan: the average weighted number ofequivalents of grains (whole and non-whole), vegetables (dark green, orange, legumes,starchy, and other vegetables), fruits (whole and 100 percent juice), milk, and meat and

CNPP-20 13
beans (meat, poultry, fish, dry beans, eggs, and nuts). Many food categories yieldedequivalents for only one MyPyramid food group; for example, cheese contributedequivalents to the milk group only. Other food categories contributed equivalents to morethan one MyPyramid food group; for example, mixed grains may contain equivalents ofgrains, vegetables, milk, and meat and beans. Again, the average consumption by all peoplein the respective spending quartiles, instead of the average consumption by people in eachage-gender group, was used because sample sizes for some age-gender groups were toosmall.
Model Constraints7
Dietary StandardsBefore the dietary standards were set for the market baskets of the Low-Cost, Moderate-Cost, and Liberal Food Plans for each of the 15 age-gender groups, the appropriate calorielevels for these market baskets needed to be determined. For the recent update of theThrifty Food Plan (Carlson et al., 2007), the median weight/height of each age-gendergroup and a low active physical activity level (as defined by the Institute of Medicine,Food and Nutrition Board, 2005) was used to set caloric levels.8 Essentially, for each age-gender group (the same groups as used in this update of the Low-Cost, Moderate-Cost, andLiberal Food Plans), these three variables were entered into an equation developed by theInstitute of Medicine (Institute of Medicine, Food and Nutrition Board, 2005). The yieldfrom the equation was a caloric level reflecting the energy requirement of a person at themedian weight, median height, and median age (for the group) at a low active physicalactivity level.
Because age-gender groups do not vary across the four USDA food plans—these groupingswere determined by nutrient requirements, not cost—the caloric levels of the marketbaskets of the Thrifty Food Plan were applied to the market baskets of the Low-Cost,Moderate-Cost, and Liberal Food Plans for each respective age-gender group. Although thecaloric levels of the Thrifty Plan were set based on a lower income sample, using the samecaloric level for each age-gender group across the four USDA food plans ensures that theplans vary only by food costs, which is the main intent of the food plans. Additionally, withthis approach, the caloric levels of the updated market baskets of the Low-Cost, Moderate-Cost, and Liberal Food Plans are similar to the caloric levels of the previous respectivemarket baskets.
7 Constraint is a technical term in mathematical optimization modeling that defines the area where a solution ispossible. The term does not mean that dietary standards are limiting or negative.
8The low active category in the Institute of Medicine 2005 classification of activity levels corresponds to themoderate activity level referred to in the 2005 Dietary Guidelines for Americans. This is 30 minutes ofmoderate-intensity activity per day.

14 The Low-Cost, Moderate-Cost, and Liberal Food Plans, 2007
In the previous three food plans, caloric levels were set at the 1989 Recommended EnergyAllowances, which were based on reference people of median height and weight, andhaving a moderate level of physical activity. However, the methodology used to determinecaloric need has changed, the population has gained body weight, and the definition ofhealthful weight has changed since the previous food plans were constructed.
The dietary standards that the market baskets of the Low-Cost, Moderate-Cost, and LiberalFood Plans had to satisfy were drawn from three main sources: (1) the 1997-2005 DietaryReference Intakes, which include Recommended Dietary Allowances (RDAs), AdequateIntakes (AIs), and Acceptable Macronutrient Distribution Ranges (AMDRs); (2) the 2005Dietary Guidelines for Americans; and (3) the 2005 MyPyramid Food Guidance System.Tables 2a-c show major differences in dietary standards between the old (2003) andrevised (2007) plans.
The 1997-2005 RDAs for various age-gender groups are the level of intake of essentialnutrients considered adequate to meet the nutrient needs of practically all (97 to 98percent) healthy Americans in the group (Institute of Medicine, Food and Nutrition Board,1997, 1998, 2000a, 2000b, 2002, 2004, 2005). The 1997-2005 AIs for various age-gendergroups are average daily intake levels that are assumed to be adequate for health. Theseintake levels are based on observed or experimentally determined approximations orestimates of nutrient intakes by a group of apparently healthy people and are used whenRDAs cannot be determined (Institute of Medicine, Food and Nutrition Board, 1997, 1998,2000a, 2000b, 2002, 2004, 2005). The 1997-2005 AMDRs for various age-gender groupsare a range of intakes for a particular energy source that is associated with a reduced riskof chronic disease while providing adequate intakes of essential nutrients (Institute ofMedicine, Food and Nutrition Board, 1997, 1998, 2000a, 2000b, 2002, 2004, 2005).The AMDRs are expressed as a percentage of total energy intake.
For the revised food plans, the market baskets for each age-gender group had to meet 100percent or more of the group’s 1997-2005 RDAs or AIs for vitamin A, vitamin C, vitaminB6, vitamin B12, thiamin, riboflavin, niacin, calcium, phosphorus, magnesium, iron, folate,zinc, copper, and fiber. The market baskets for each age-gender group also had to fallbelow the Tolerable Upper Intake Level (UL) for nutrients where such a limit was set(vitamin A, vitamin C, vitamin B6, vitamin E, calcium, phosphorus, iron, folate, zinc, andcopper). A UL is the highest amount of a nutrient that can be safely eaten on a continualbasis and not cause an adverse effect for most healthy people.
A solution could not be obtained for most market baskets to meet the RDA for vitamin Eor the AI for potassium without extreme variation from average consumption, such asobtaining most meat and bean recommendations in the form of nuts. Hence, these dietaryconstraints were relaxed in the models. This also had to be done for the recently updatedThrifty Food Plan. For vitamin E, the market baskets of the three food plans for childrenmet 95 to 100 percent of their vitamin E RDA; those for teenage males, 90 to 100 percent;those for teenage females, 63 to 85 percent; those for adult males, 70 to 83 percent; andthose for adult females, 60 to 76 percent of their vitamin E RDA.

CNPP-20 15
Table 2a. Dietary standards of the previous and revised market baskets of the Low-Cost, Moderate-Cost, and LiberalFood Plans
Constraint Previous market baskets Revised market baskets
RDAs/AIs/AMDRs1 foreach age-gender group 1989 RDA 1997-2005 RDA/AI/AMDR
Vitamins A, C, E, B6, and B12, 100% RDA 100% RDA or AI and less than UL where applicablethiamin, riboflavin, niacin, for all except vitamin E (63% or more of RDA for allcalcium, phosphorus, magnesium, three food plans)iron, folate, and zinc
Copper and potassium Not applicable 100% RDA or AI and less than UL where applicableexcept for potassium (70% or more of AI for all threefood plans)
Fiber No less than 100% of average consumption 100% AI (14 gm /1,000 Kcal)
Linoleic acid Not applicable AMDR: 5-10% of total calories
Alpha-linolenic acid Not applicable AMDR: 0.6-1.2% of total calories
Protein 100% RDA AMDR: 5-20% of total calories for children ages 1-3;10-30% of total calories for children ages 4-18;10-35% of total calories for adults
Carbohydrate 55% or more of total calories/day AMDR: 45-65% of total calories
Total fat 30% or less of total calories for adults AMDR: 30-40% of total calories for children ages 1-3;and children ages 5 and older; at average 25-35% of total calories for children ages 4-18;consumption for children ages 2 to 4; 20-35% of total calories for adultsunrestricted for children age 1
Dietary standards 1995 2005Saturated fat Less than 10% of total calories for adults Less than 10% of total calories
and children ages 5 and older; at averageconsumption for children ages 2 to 4;unrestricted for children age 1
Sodium No more than 100% of average consumption; Less than or equal to median consumptionunrestricted for children age 1
Cholesterol 300 mg or less/day; unrestricted for children age 1 300 mg or less/day
Pyramid Food Guide Pyramid MyPyramid Food Intake Pattern
Grain group Minimum of 6; maximum of 11 servings/day2 100% of ounce equivalents in assigned food pattern,based on calorie needs (table 2b)
Whole grain Not applicable At least 50% of total grains
Vegetable group Minimum of 3; maximum of 5 servings/day2 100% of cups in assigned food pattern,based on calorie needs (table 2b)
Vegetable subgroups Not applicable 100% of cups in assigned food pattern, for dark-green,orange, legumes, starchy, and other vegetables,based on calorie needs
Fruit group Minimum of 2; maximum of 4 servings/day2 100% of cups in assigned food pattern,based on calorie needs (table 2b)
Nonjuice fruit Not applicable At least 50% of total fruit
Milk group Minimum of 2; maximum of 3 servings/day2 2 cups for children ages 1-8; 3 cups for children ages 9and older and adults
Meat and beans group Minimum of 2; maximum of 3 (5 to 7 ounces) 100% of ounce equivalents in assigned food pattern,servings/day1 based on calorie needs (table 2b)
Oils Not applicable 100% of grams in assigned food pattern,based on calorie needs (table 2b)
1RDAs = Recommended Dietary Allowances, AIs = Adequate Intakes, and AMDRs = Acceptable Macronutrient Distribution Ranges.2Minimum and maximum servings varied by age-gender group. Maximum servings were specified to ensure that the minimum number of servings fromall Food Guide Pyramid food groups was included in the TFP market basket before the maximum number of servings of any one of the food groups wasexceeded. Serving sizes for children through 5 years were modified by reducing the serving size by one-third, except for servings of milk products.

16 The Low-Cost, Moderate-Cost, and Liberal Food Plans, 2007
Table 2b. MyPyramid food group standards for revised market baskets of the Low-Cost, Moderate-Cost, and LiberalFood Plans
Daily amount of food from each groupCalorie level 1,000 1,200 1,400 1,600 1,800 2,000 2,200 2,400 2,600 2,800 3,000 3,200
Food group
Fruits 1 c1 1 c 1.5 c 1.5 c 1.5 c 2 c 2 c 2 c 2 c 2.5 c 2.5 c 2.5 c
Vegetables 1 c 1.5 c 1.5 c 2 c 2.5 c 2.5 c 3 c 3 c 3.5 c 3.5 c 4 c 4 c
Grains 3 oz1 4 oz 5 oz 5 oz 6 oz 6 oz 7 oz 8 oz 9 oz 10 oz 10 oz 10 oz
Meat and beans 2 oz 3 oz 4 oz 5 oz 5 oz 5.5 oz 6 oz 6.5 oz 6.5 oz 7 oz 7 oz 7 oz
Milk 2 c 2 c 2 c 3 c 3 c 3 c 3 c 3 c 3 c 3 c 3 c 3 c
Oils 15 g1 17 g 17 g 22 g 24 g 27 g 29 g 31 g 34 g 36 g 44 g 51g
1 c = cups, oz = ounce equivalents, g = grams.Note: Recommendations for fruit, vegetable, and grain groups include food subgroup (e.g., whole fruit, dark-green vegetable, and whole grain)recommendations (see table 2a).
Table 2c. Assignment of food pattern forage-gender group, based on medianweight and height, NHANES 2001-2002
Age-gender Assigned calorie level
1 year, M/F 1,000
2-3 years, M/F 1,200
4-5 years, M/F 1,400
6-8 years, M/F 1,6001
9-11 years, M/F 2,000
12-13 years, F 2,200
12-13 years, M 2,400
14-18 years, F 2,200
14-18 years, M 3,000
19-50 years, F 2,200
19-50 years, M 2,800
51-70 years, F 2,200
51-70 years, M 2,600
71+ years, F 1,800
71+ years, M 2,200
M = Male; F = Female.
1The 6- to 8-year-olds need only 2 cups of milkand 2.5 oz equivalent of whole grains even thoughthey are assigned the 1,600 calorie pattern.

CNPP-20 17
For potassium, the market baskets of the three food plans for children met 70 to 90 percentof their potassium AI; those for teenage males, 96 to 100 percent; those for teenagefemales, 83 to 88 percent; those for adult males, 88 to 98 percent; and those for adultfemales, 78 to 87 percent of their potassium AI. In general, higher cost food plans did notcontain significantly more vitamin E or potassium. Levels of vitamin E and potassiumtended to be uniform across an age-gender group’s market baskets for all three food plans.
Regarding vitamin E, typical intakes as measured in food consumption surveys are far lessthan what is required by the new RDA standards. Mean usual intake for adult females is6.3 mg alpha-tocopherol (AT); for adult males, 8.2 mg AT (Moshfegh, Goldman, &Cleveland, 2005). Meeting the new RDA of 15 mg AT for adults, especially at lowercalorie intakes, would have required substantial changes from typical food intake patternsand would also require the regular intake of foods not commonly consumed, such assunflower and safflower oils. Changing typical food intake patterns was neither realisticnor practical. As for potassium, the same problem existed. To meet the potassium AI,substantial changes from typical food intake patterns would be required. Again, CNPPdid not consider this a realistic or practical alternative. Hence, CNPP relaxed these dietaryconstraints and developed market baskets for the Low-Cost, Moderate-Cost, and LiberalFood Plans that were as near as possible to the recommendations for vitamin E andpotassium without extreme deviations from typical consumption patterns. While not alwaysreaching the vitamin E RDA or potassium AI recommendations, vitamin E and potassiumlevels in the market baskets for all age-gender groups are higher than average consumptionof participants in NHANES 2001-2002 for the respective age-gender groups in expenditurequartiles. That is, the vitamin E and potassium levels in the Low-Cost Food Plan marketbasket for a child age 9 to 11 are higher than the average levels that children 9 to l1 areconsuming in the second from bottom food spending quartile. This same pattern heldfor all age-gender groups in the three food spending quartiles of interest.
The market baskets of the Low-Cost, Moderate-Cost, and Liberal Food Plans for eachage-gender group also had to fall within the AMDR for linoleic acid, alpha-linolenic acid,protein, carbohydrate, and total fat in order to be consistent with dietary standards. Forexample, the market baskets for adults derived 20 to 35 percent of total calories fromtotal fat; for children ages 4 to 8, 25 to 35 percent; and for children ages 1 to 3, 30 to40 percent.
The 2005 Dietary Guidelines for Americans (U.S. Department of Health and HumanServices [DHHS], & U.S. Department of Agriculture [USDA], 2005) provide science-based advice to promote health and to reduce risk for major chronic diseases through dietand physical activity. The Guidelines recommend that all healthy people ages 2 years andover consume less than 10 percent of calories per day from saturated fat and less than2,300 mg per day of sodium. For cholesterol, the Guidelines recommend that all healthypeople ages 2 years and over consume 300 mg or less per day. Although these Guidelinesfor saturated fat, sodium, and cholesterol apply to healthy people ages 2 years and over,CNPP also applied them to 1-year-olds, because this age group was assigned to the 1,000

18 The Low-Cost, Moderate-Cost, and Liberal Food Plans, 2007
calorie food pattern and this pattern uses these saturated fat, sodium, and cholesterolguidelines.
With the exception of sodium, these recommendations were met in the revised marketbaskets of the Low-Cost, Moderate-Cost, and Liberal Food Plans. Although all foodsprepared with a recipe were assumed to be done so without added salt, the new food plansdid not meet the sodium guideline for any of the baskets. Hence, similar to the recentlyupdated Thrifty Food Plan, age-gender groups’ market baskets were limited to no morethan the median sodium consumption by the group.
A similar situation existed with the previous market baskets of the Low-Cost, Moderate-Cost, and Liberal Food Plans: the sodium guideline at the time could not be met in themarket baskets, so the standard was set approximately to no more than mean sodiumconsumption for each age-gender group. Because the median amount of sodium consumedis always less than the mean amount of sodium consumed by each age-gender group, therevised food plans improve upon the 2003 food plans in this respect. Sodium levels in themarket baskets of the food plans ranged from 1,856 mg for 1-year-olds to 4,404 mg foradult males.
About 75 percent of sodium consumed comes from food-processing methods (DHHS &USDA, 2005). It was thus practically impossible to develop market baskets that metthe sodium recommendation. To do so would require substantial changes in food-manufacturing practices or require many foods, including bread and pasta, to be madefrom scratch without added salt. In addition, the sodium content of diets is closely tied toenergy intake, making it more difficult to achieve sodium intakes below the recommend-ation at higher energy intakes. The Dietary Guidelines recognize this reality and thereforerecommend selecting more fresh and less processed items, using less sodium-dense foods,and reducing salt in food preparation.
This revision of the market baskets of the Low-Cost, Moderate-Cost, and Liberal FoodPlans incorporates food intake recommendations of the MyPyramid Food GuidanceSystem. MyPyramid translates recommendations from the Dietary Guidelines forAmericans into the types and amounts of food people can eat to achieve a healthful diet.More important, MyPyramid specifies daily amounts from each of the major food groups(grain, vegetable, fruit, milk, and meat and beans) and oils that population groups need toeat to have a healthful diet. Although the MyPyramid system also sets limitations on theamount of discretionary calories allowed, setting direct limits on these calories was notnecessary in this food plan update because overall calories, nutrients, foods, and oils werestrictly controlled for in the analysis. Discretionary calories are the balance of caloriesremaining in a person’s estimated energy allowance after accounting for the number ofcalories needed to meet recommended nutrient intakes through consumption of foods inlowfat or no-added-sugar forms.
CNPP-20 19
Based on its estimated caloric need, each age-gender group was assigned to one of the 12MyPyramid food intake patterns, which range from 1,000 to 3,200 calories. The marketbaskets of the Low-Cost, Moderate-Cost, and Liberal Food Plans for each age-gendergroup had to meet the food group intake requirements for the five major food groups andfor oils for the corresponding calorie level. In addition, food subgroup requirements werealso included: at least 50 percent of the total amount from the grain group had to be wholegrains, at least 50 percent of the amount from the fruit group had to be nonjuice fruit, andall vegetable subgroups had to be incorporated at levels that were specified in MyPyramid.
Cost and Other ConstraintsA primary constraint satisfied by the revised market baskets of the Low-Cost, Moderate-Cost, and Liberal Food Plans was that they should cost no more than the respectiveprevious market baskets, adjusted for inflation. Accordingly, because 2001-2002consumption data underlie the 2007 revision of the market baskets, for each age-gendergroup for all three food plans, CNPP limited the cost of each group’s revised food planmarket basket to equal the average real cost of its previous market basket for the 2001-2002 period. This constant real-cost constraint was used to examine how a person couldachieve a nutritious diet based on current dietary standards. Historically, the Low-CostFood Plan represents food expenditures in the second from bottom quartile of foodspending; the Moderate-Cost Food Plan, food expenditures in the second from top quartileof food spending; and the Liberal Food Plan, food expenditures in the top quartile of foodspending. Data analysis confirmed that the cost of the Low-Cost Food Plan in 2001-02 foreach age-gender group fell within the second from bottom quartile of food spending in2001-02 for each respective age-gender group. Similarly, the cost of the Moderate-CostFood Plan fell within the second from the top quartile, while the cost of the Liberal FoodPlan fell within the top quartile of food spending for each age-gender group.
In addition, efforts were made to consider ease of food preparation and conveniencein the development of the market baskets. Foods, such as boxed macaroni and cheese,frozen fruits and vegetables, prepared sauces, ready-to-eat breads and cereals, cannedsoups, chicken parts, canned dry beans, boxed mashed potatoes, and stove-top meals, areincluded in the market baskets.
Based on data from NHANES 2001-2002, amounts of foods in the market baskets of theLow-Cost, Moderate-Cost, and Liberal Food Plans for each age-gender group also wereconstrained to fall within a range of average consumption for each of the 58 foodcategories. This was done to prevent the model from selecting huge quantities of certainfoods and to maintain a palatable diet. The lower bound was set slightly above zero formost food categories. The upper bounds varied by food category, depending on averageconsumption. Generally, the upper bounds were 3 to 10 times average consumption.Although this may seem high, average consumption was near zero for some food categories(e.g., whole grains). Thus, a tenfold increase did not result in an unreasonable level ofintake. For the meat and beans food group, each of the subgroups (beef, pork, veal, lamb,and game; chicken, turkey, and game birds; etc.) was constrained within a narrower rangeof average consumption to ensure that no one subgroup dominated the pattern.

20 The Low-Cost, Moderate-Cost, and Liberal Food Plans, 2007
Mathematical Model
For the past 30 years, a computerized quadratic mathematical optimization programmingmodel has been used in the development of the USDA food plans (appendix 2). For eachage-gender group, the model selects the optimal food plan that meets the dietary standardsand cost constraints, with as little change as possible from food consumption. The modelfor this revision of the Low-Cost, Moderate-Cost, and Liberal Food Plans was based on themodel of the 2003 food plans. This revised model accommodates all 58 food categories,dietary constraints, and serving specifications of MyPyramid. The mathematical model forthe 2007 food plans provides illustrative market baskets that can be developed into dailyfood plans that provide nutritionally adequate, healthful meals at three cost levels.
Food Plan Consumption Patterns
The mathematical optimization model produced 15 suggested consumption patterns (onefor each age-gender group) for each of the three food plans (the Low-Cost, Moderate-Cost,and Liberal Plans). Each pattern contained quantities of each of the 58 food categories inas-consumed form. The 58 food categories in as-consumed form for each of the three foodplans were then regrouped into 29 market basket groups in as-purchased form. The nextsection discusses these market basket groups in as-purchased form for the three food plans.Appendix 3 portrays the results in as-consumed form regrouped into USDA MyPyramidamounts consumed per day; the appendix shows that the suggested consumption patternsfor all three food plans meet the daily food intake recommendations of the MyPyramidFood Guidance System.
It should be noted that because there are differing dietary standards as well as foodpreferences for each age-gender group (the reason each group’s model was estimatedseparately), there is a degree of variability in the market basket food amounts from oneage-gender group to another for all three food plans. This was also the case for theprevious food plans as well as the recently updated Thrifty Food Plan. For example, DRIrequirements increase substantially for children ages 9 to 11, compared with children ages6 to 8. But unlike older individuals, the 9- to 11-year-olds have a stronger preference forfruit, compared with vegetables. The model, therefore, fulfills their greater nutrientrequirement with fruit rather than vegetables. Hence, the two groups have different marketbaskets. This does not need to make the formation of household-level baskets morechallenging because household members consume the same foods, but in differentquantities. For example, every household member needs to consume fruit in nonjuiceform, but children ages 9 to 11 will eat more fruit than is consumed by other householdmembers. These children will also consume fewer vegetables than do other householdmembers but still consume the recommended amount of vegetables. Future work willexamine this variability in food amounts between age-gender groups in more detail.

CNPP-20 21
Market Baskets or As-Purchased FormThe consolidation of categories, whereby similar foods were grouped and converted intomarket baskets or as-purchased (versus as-consumed) form, illustrates how households canpurchase foods in the marketplace in order to obtain the suggested consumption patterns inthe Low-Cost, Moderate-Cost, and Liberal Food Plans. The consolidation also providesbetter information for nutrition education needs. For example, CNPP combined “potatoproducts, regular fat” and “potato products, lowfat” into one market basket group of potatoproducts. Also, “citrus fruit, melon, and berry juices” and “fruit juices other than citrus,melon, and berry” were combined into one market basket group of fruit juices. The dietarystandards were still maintained when the 58 food categories were collapsed into 29 marketbasket groups. Table 3 lists the 29 market basket groups in as-purchased form and listsexamples of foods the groups contain.
The revised market baskets of the Low-Cost, Moderate-Cost, and Liberal Food Plansconsisting of the quantities in as-purchased form of the 29 market basket groups (in poundsper week) for each of the 15 age-gender groups are listed in table 4. For each of the threefood plans, the expenditure shares of these 29 market basket groups for the 15 age-gendergroups are listed in appendix 4.
Average Market Basket for Each Food PlanTo examine how the market baskets of the Low-Cost, Moderate-Cost, and Liberal FoodPlans differ from each other, CNPP calculated an average market basket for each plan.Average baskets were derived by weighting each age-gender group by its population size(according to the 2000 Census) and calculating a weighted mean for each food plan.Table 5 shows these average food plan market baskets (in pounds per week per person).9
The total amount of food in each average market basket increases, from that in the Low-Cost to the Moderate-Cost, to the Liberal Food Plan. The main reason for this is related tothe higher food waste in the more expensive plans; the waste factor was 10 percent for theLow-Cost Plan, compared with 30 percent for the Liberal Plan. Although CNPP assumedproportionate food waste across food categories, such waste is likely disproportionate.However, given the absence of complete data on food waste by food category, CNPPassumed proportionate waste across food categories in order to maintain consistency withprevious food plans.
Quantities of food for the grain, vegetable, fruit, milk, and meat and bean food groupsgenerally increase across the food plans. Again, this is likely because of the higher foodwaste factors applied across the plans. There is a small decrease in total meat and beansfrom the Moderate-Cost to Liberal Food Plans. Quantities of food in the “other food”group (e.g., fats, oils, sweets, soups, and frozen entrees) are greatest in the Low-CostFood Plan. Some of these other foods are inexpensive sources of calories, so after dietarystandards are met, their amounts increase in the Low-Cost Plan. Differences for foodsubgroups reflect that as the plans increase in cost, more food choices are available.
9 Components of the three market baskets are discussed in terms of pounds; therefore, fluids such as milkand soft drinks are weighted more prominently than are dry foods, and juice concentrates are weighted lessprominently than are their reconstituted forms.

22 The Low-Cost, Moderate-Cost, and Liberal Food Plans, 2007
Table 3. Food categories and examples of foods in the market baskets of the Low-Cost, Moderate-Cost, and LiberalFood Plans, 2007
Food category Examples of foods
GrainsWhole grain breads, rice, pasta, and pastries Breads, rolls, muffins, biscuits, bagels, waffles, tortillas, pancakes, rice, pasta, and doughnuts—(including whole grain flours) all made from whole grain; and buckwheat flour
Whole grain cereals (including hot cereal mixes) Whole grain sweetened or nonsweetened ready-to-eat cereals (e.g., frosted and shredded wheat),whole grain cooked breakfast cereals (e.g., oatmeal, buckwheat groats, and bulgur), and wholegrain babyfood cereal
Popcorn and other whole grain snacks Popcorn; and whole grain crackers, cookies, salty snacks, pretzels, breakfast bars, and granolabars
Non-whole grain breads, cereals, rice, pasta, Breads, bagels, biscuits, rolls, tortillas, muffins, and pancakes; cooked or ready-to-eat non-pies, pastries, snacks, and flours whole grain cereals; white rice and pasta; cakes and cake mixes, pies, cookies, and doughnuts;
corn-based snacks, chips, pretzels, and crackers—all made from non-whole grain; and refinedflour
VegetablesAll potato products Potatoes, instant mashed potatoes, potato puffs, French-fried potatoes, and potato chips
Dark-green vegetables Spinach, broccoli, kale, chard, collards, endive, and mustard greens
Orange vegetables Carrots, sweet potatoes, winter squash, pumpkin, and yams
Canned and dry beans, lentils, and peas (legumes) Black, lima, mung, pinto, red, white, navy, pink, and kidney beans; cowpeas; chickpeas;lentils; soybeans; soy flour; and soybean-based meat substitutes
Other vegetables Tomatoes and tomato products, sweet corn, onions, green peas, green beans, beets, Brusselssprouts, cabbage, cauliflower, celery, cucumber, eggplant, lettuce, mushrooms, okra, peppers,radishes, squash, and mixed vegetables
FruitsWhole fruits Oranges, bananas, apples, grapes, watermelon, grapefruit, pears, peaches, cherries,
strawberries, plums, apricots, cranberries, and blueberries
Fruit juices All fresh, canned, and frozen fruit juices and nectars
Milk productsWhole milk, yogurt, and cream All fluid, evaporated, condensed, and dry whole milk; regular yogurt; all fluid creams;
sour creams; cream cheeses; and cream soups
Lower fat and skim milk and lowfat yogurt All fluid, evaporated, and dry reduced-fat and skim milks; reduced-fat, lowfat, and nonfatyogurt; fluid and dry buttermilk; and soy beverages
All cheese (including cheese soup and sauce) Natural, processed, and imitation cheeses; cottage cheese; cheese spreads; cheese dips; andcheese soups
Milk drinks and milk desserts Milk-based drinks (e.g., malted milk, milk shakes, and eggnogs); chocolate or cocoa-baseddrinks; infant formulas; nondairy dessert toppings; and milk-based desserts (e.g., ice cream,frozen yogurt, fudgesicles, sherbets, puddings, and custards)

CNPP-20 23
Table 3. Food categories and examples of foods in the market baskets in the Low-Cost, Moderate-Cost, and LiberalFood Plans, 2007 (cont’d)
Food category Examples of foods
Meat and beansBeef, pork, veal, lamb, and game Beef, pork, veal, lamb, game meats, organ meats, meat-based soups, meat-based baby foods,
cured meat products, and processed meat products
Chicken, turkey, and game birds Chicken, turkey, duck, game birds, organ meats, chicken- or turkey-based soups, chicken- orturkey-based rolls, and canned chicken
Fish and fish products Finfish, shellfish, fish chowders, and reconstructed seafoods
Bacon, sausages, and luncheon meats Bacon, sausages, salami, frankfurters, bologna, pastrami, corned beef, turkey ham, and(including spreads) luncheon meats
Nuts, nut butters, and seeds Peanuts, almonds, walnuts, cashews, brazilnuts, and pine nuts; pumpkin, sunflower, andsesame seeds; and peanut butter and other nut butters made from these nuts and seeds
Eggs and egg mixtures Fresh, frozen, and dried eggs; egg substitutes; meringues; and egg dishes
Other foodsTable fats, oils, and salad dressings Butter, margarine, vegetable oils (e.g., corn, olive, palm, peanut, sunflower, safflower, and
soybean), shortenings, butter blends, lard, salad oils, all types of salad dressings, andmayonnaise
Gravies, sauces, condiments, and spices Gravies, soy sauce, barbecue sauce, duck sauce, white sauce, and other sauces; pickles,relishes, mustard, and olives; baking soda, vinegar, and baker’s yeast; and all spices
Coffee and tea Instant, ground, and fluid coffees and teas with or without caffeine and with or withoutsugars or sweeteners
Soft drinks, sodas, fruit drinks, and ades All carbonated soft drinks; fruit-flavored punches, cocktails, and drinks; breakfast drinks(including rice beverages) or rice beverages; energy drinks; and ades (e.g., lemonade and limeade)
Sugars, sweets, and candies All types of sugars, sweeteners, and syrups (e.g., honey, jams, jellies, marmalades, preserves,icings, gelatin desserts, marshmallow, and fudge); all types of candies and chocolates; andchewing gum
Soups (ready-to-serve and condensed) All canned ready-to-serve or condensed soups (e.g., chicken noodle or cream of mushroom)
Soups (dry) Instant and dry soup mixes and meat-flavored bouillons (e.g., chicken bouillon)
Frozen or refrigerated entrees (including pizza, Frozen meals, pizza, fish sticks, entrees, and babyfood dinner meals and junior foodsfish sticks, and frozen meals)

24 The Low-Cost, Moderate-Cost, and Liberal Food Plans, 2007
Table 4a. Low-Cost Food Plan market baskets, quantities of food purchased for a week, by age-gender group, 2007
ChildrenFood category 1 year 2-3 years 4-5 years 6-8 years 9-11 years
Total pounds 18.49 19.41 23.23 25.24 34.87
Pounds per weekGrainsWhole grain breads, rice, pasta, and pastries (including whole grain flours) 0.76 0.90 1.30 0.39 1.87Whole grain cereals (including hot cereal mixes) 0.11 0.16 0.38 0.23 0.21Popcorn and other whole grain snacks 0.03 0.15 0.01 0.47 0.05Non-whole grain breads, cereals, rice, pasta, pies, pastries, snacks, and flours 0.39 0.63 0.79 1.42 0.77
1.29 1.83 2.48 2.51 2.90
VegetablesAll potato products 0.16 0.33 0.56 0.42 0.58Dark-green vegetables 0.37 0.83 0.75 1.01 0.09Orange vegetables 0.11 0.41 1.02 0.62 0.76Canned and dry beans, lentils, and peas (legumes) 0.31 0.48 0.66 1.69 1.60Other vegetables 3.93 1.20 1.58 2.61 1.30
4.88 3.25 4.57 6.35 4.33
FruitsWhole fruits 1.56 3.10 3.88 2.82 8.65Fruit juices 1.27 0.46 1.54 1.73 1.51
2.82 3.56 5.42 4.55 10.16
Milk productsWhole milk, yogurt, and cream 7.85 1.06 0.27 0.18 0.37Lower fat and skim milk and lowfat yogurt 0.00 7.08 7.79 8.02 12.10All cheese (including cheese soup and sauce) 0.01 0.03 0.02 0.00 0.04Milk drinks and milk desserts 0.00 0.00 0.03 0.00 0.06
7.85 8.17 8.11 8.20 12.58
Meat and beansBeef, pork, veal, lamb, and game 0.32 0.30 0.31 2.09 0.53Chicken, turkey, and game birds 0.37 0.49 0.50 0.44 0.49Fish and fish products 0.18 0.83 0.54 0.34 0.55Bacon, sausages, and luncheon meats (including spreads) 0.00 0.01 0.04 0.18 0.02Nuts, nut butters, and seeds 0.09 0.14 0.41 0.18 0.79Eggs and egg mixtures 0.00 0.02 0.02 0.02 0.05
0.97 1.79 1.81 3.25 2.43
Other foodsTable fats, oils, and salad dressings 0.25 0.22 0.26 0.14 0.16Gravies, sauces, condiments, and spices 0.20 0.23 0.32 0.20 0.37Coffee and tea 0.00 0.00 0.00 0.00 0.00Soft drinks, sodas, fruit drinks, and ades (including rice beverages) 0.21 0.18 0.20 0.02 0.62
Soups (ready-to-serve and condensed) 0.01 0.15 0.00 0.01 1.22Soups (dry) 0.00 0.00 0.01 0.00 0.02Frozen or refrigerated entrees (including pizza, fish sticks, and frozen meals) 0.02 0.00 0.00 0.00 0.02
0.68 0.81 0.84 0.37 2.46
Notes: Food in as-purchased form, which includes uncooked grain products; raw, canned, and frozen vegetables; fruit juice concentrates; and meatwith bones. Components of the market baskets are discussed in terms of pounds; therefore, fluids such as milk are weighted more prominently thanare dry foods, and juice concentrates are weighted less prominently than are their reconstituted forms.For children age 1, all milk and yogurt were assigned to the whole milk, yogurt, and cream category, because dietary guidance recommendsconsumption of primarily whole milk products for these children.The numbers are rounded; thus, when summed, they may not equal the respective totals.

CNPP-20 25
Table 4a. Low-Cost Food Plan market baskets, quantities of food purchased for a week, by age-gender group, 2007(cont’d)
MalesFood category 12-13 years 14-18 years 19-50 years 51-70 years 71+ years
Total pounds 35.21 44.38 40.70 38.88 34.43
Pounds per weekGrainsWhole grain breads, rice, pasta, and pastries (including whole grain flours) 1.45 3.21 1.01 2.39 0.70Whole grain cereals (including hot cereal mixes) 0.15 0.19 0.57 0.47 1.73Popcorn and other whole grain snacks 0.97 0.05 0.38 0.05 0.03Non-whole grain breads, cereals, rice, pasta, pies, pastries, snacks, and flours 1.03 1.18 1.31 1.17 0.56
3.60 4.64 3.27 4.08 3.02
VegetablesAll potato products 1.20 2.00 2.26 1.36 1.99Dark-green vegetables 0.62 0.53 1.01 1.15 0.87Orange vegetables 0.43 0.55 0.91 0.90 0.71Canned and dry beans, lentils, and peas (legumes) 1.87 1.63 1.83 1.26 1.47Other vegetables 1.58 3.48 3.39 3.29 2.27
5.70 8.19 9.39 7.96 7.31
FruitsWhole fruits 3.93 6.27 6.04 6.98 4.75Fruit juices 2.21 1.37 1.68 1.83 1.72
6.15 7.63 7.71 8.81 6.46
Milk productsWhole milk, yogurt, and cream 1.31 1.37 1.15 0.49 0.65Lower fat and skim milk and lowfat yogurt 10.18 9.12 9.26 10.99 11.46All cheese (including cheese soup and sauce) 0.07 0.19 0.27 0.11 0.17Milk drinks and milk desserts 0.54 0.32 0.27 0.23 0.10
12.10 11.01 10.96 11.82 12.38
Meat and beansBeef, pork, veal, lamb, and game 0.82 0.71 1.00 0.79 1.03Chicken, turkey, and game birds 0.57 0.77 1.13 0.69 0.77Fish and fish products 0.49 0.06 0.24 0.60 0.10Bacon, sausages, and luncheon meats (including spreads) 0.12 0.13 0.19 0.09 0.06Nuts, nut butters, and seeds 0.63 0.80 0.62 0.80 0.81Eggs and egg mixtures 0.07 0.12 0.18 0.12 0.17
2.70 2.59 3.36 3.08 2.95
Other foodsTable fats, oils, and salad dressings 0.24 0.56 0.58 0.37 0.43Gravies, sauces, condiments, and spices 0.29 1.06 0.36 0.18 0.18Coffee and tea 0.00 0.00 0.00 0.01 0.01Soft drinks, sodas, fruit drinks, and ades (including rice beverages) 3.44 7.88 4.62 2.03 1.10Sugars, sweets, and candies 0.19 0.57 0.22 0.12 0.12Soups (ready-to-serve and condensed) 0.63 0.18 0.11 0.38 0.44Soups (dry) 0.01 0.02 0.01 0.01 0.01Frozen or refrigerated entrees (including pizza, fish sticks, frozen meals) 0.16 0.04 0.08 0.03 0.02
4.96 10.31 6.00 3.12 2.31
Notes: Food in as-purchased form, which includes uncooked grain products; raw, canned, and frozen vegetables; fruit juice concentrates; and meat withbones. Components of the market baskets are discussed in terms of pounds; therefore, fluids such as milk are weighted more prominently than are dryfoods, and juice concentrates are weighted less prominently than are their reconstituted forms.The numbers are rounded; thus, when summed, they may not equal the respective totals.

26 The Low-Cost, Moderate-Cost, and Liberal Food Plans, 2007
Table 4a. Low-Cost Food Plan market baskets, quantities of food purchased for a week, by age-gender group, 2007(cont’d)
FemalesFood category 12-13 years 14-18 years 19-50 years 51-70 years 71+ years
Total pounds 33.51 35.79 38.13 34.77 29.33
Pounds per weekGrainsWhole grain breads, rice, pasta, and pastries (including whole grain flours) 2.24 2.22 1.71 2.52 1.50Whole grain cereals (including hot cereal mixes) 0.17 0.09 0.22 0.09 0.26Popcorn and other whole grain snacks 0.02 0.03 0.03 0.02 0.00Non-whole grain breads, cereals, rice, pasta, pies, pastries, snacks, and flours 0.94 1.16 0.89 0.54 0.72
3.38 3.50 2.84 3.17 2.48
VegetablesAll potato products 0.80 1.62 1.08 0.82 0.64Dark-green vegetables 0.86 1.13 1.18 0.96 1.05Orange vegetables 0.74 0.61 0.68 0.86 0.72Canned and dry beans, lentils, and peas (legumes) 1.96 1.71 1.56 1.59 1.32Other vegetables 1.34 2.67 2.63 3.13 2.17
5.70 7.75 7.13 7.35 5.90
FruitsWhole fruits 5.99 4.84 6.59 5.21 3.50Fruit juices 0.90 1.72 1.43 1.45 1.57
6.90 6.56 8.02 6.66 5.07
Milk productsWhole milk, yogurt, and cream 1.43 0.80 0.81 1.14 0.67Lower fat and skim milk and lowfat yogurt 9.83 10.51 10.62 10.84 11.02All cheese (including cheese soup and sauce) 0.11 0.10 0.18 0.05 0.03Milk drinks and milk desserts 0.37 0.19 0.25 0.21 0.10
11.74 11.60 11.87 12.24 11.82
Meat and beansBeef, pork, veal, lamb, and game 0.46 0.69 0.86 0.70 0.78Chicken, turkey, and game birds 0.74 0.68 1.03 1.00 0.83Fish and fish products 0.54 0.36 0.44 0.42 0.04Bacon, sausages, and luncheon meats (including spreads) 0.07 0.06 0.09 0.01 0.02Nuts, nut butters, and seeds 0.70 0.53 0.76 0.73 0.79Eggs and egg mixtures 0.08 0.14 0.24 0.13 0.07
2.59 2.45 3.42 2.98 2.53
Other foodsTable fats, oils, and salad dressings 0.23 0.37 0.26 0.20 0.21Gravies, sauces, condiments, and spices 0.12 0.16 0.15 0.09 0.08Coffee and tea 0.00 0.00 0.00 0.00 0.01Soft drinks, sodas, fruit drinks, and ades (including rice beverages) 2.57 3.10 4.13 1.69 0.87Sugars, sweets, and candies 0.22 0.26 0.21 0.26 0.10Soups (ready-to-serve and condensed) 0.00 0.01 0.06 0.12 0.24Soups (dry) 0.04 0.01 0.02 0.00 0.01Frozen or refrigerated entrees (including pizza, fish sticks, frozen meals) 0.01 0.03 0.03 0.00 0.01
3.21 3.94 4.86 2.36 1.53
Notes: Food in as-purchased form, which includes uncooked grain products; raw, canned, and frozen vegetables; fruit juice concentrates; and meat withbones. Components of the market baskets are discussed in terms of pounds; therefore, fluids such as milk are weighted more prominently than are dryfoods, and juice concentrates are weighted less prominently than are their reconstituted forms.The numbers are rounded; thus, when summed, they may not equal the respective totals.
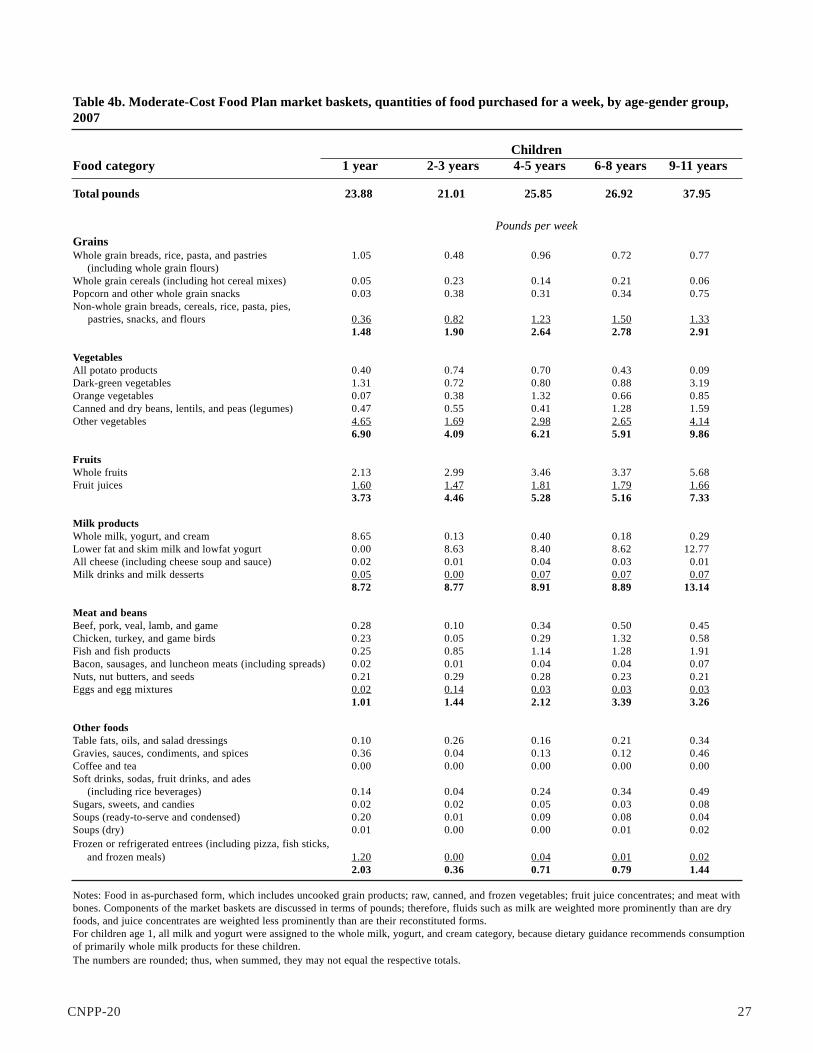
CNPP-20 27
Table 4b. Moderate-Cost Food Plan market baskets, quantities of food purchased for a week, by age-gender group,2007
ChildrenFood category 1 year 2-3 years 4-5 years 6-8 years 9-11 years
Total pounds 23.88 21.01 25.85 26.92 37.95
Pounds per weekGrainsWhole grain breads, rice, pasta, and pastries 1.05 0.48 0.96 0.72 0.77 (including whole grain flours)Whole grain cereals (including hot cereal mixes) 0.05 0.23 0.14 0.21 0.06Popcorn and other whole grain snacks 0.03 0.38 0.31 0.34 0.75Non-whole grain breads, cereals, rice, pasta, pies, pastries, snacks, and flours 0.36 0.82 1.23 1.50 1.33
1.48 1.90 2.64 2.78 2.91
VegetablesAll potato products 0.40 0.74 0.70 0.43 0.09Dark-green vegetables 1.31 0.72 0.80 0.88 3.19Orange vegetables 0.07 0.38 1.32 0.66 0.85Canned and dry beans, lentils, and peas (legumes) 0.47 0.55 0.41 1.28 1.59Other vegetables 4.65 1.69 2.98 2.65 4.14
6.90 4.09 6.21 5.91 9.86
FruitsWhole fruits 2.13 2.99 3.46 3.37 5.68Fruit juices 1.60 1.47 1.81 1.79 1.66
3.73 4.46 5.28 5.16 7.33
Milk productsWhole milk, yogurt, and cream 8.65 0.13 0.40 0.18 0.29Lower fat and skim milk and lowfat yogurt 0.00 8.63 8.40 8.62 12.77All cheese (including cheese soup and sauce) 0.02 0.01 0.04 0.03 0.01Milk drinks and milk desserts 0.05 0.00 0.07 0.07 0.07
8.72 8.77 8.91 8.89 13.14
Meat and beansBeef, pork, veal, lamb, and game 0.28 0.10 0.34 0.50 0.45Chicken, turkey, and game birds 0.23 0.05 0.29 1.32 0.58Fish and fish products 0.25 0.85 1.14 1.28 1.91Bacon, sausages, and luncheon meats (including spreads) 0.02 0.01 0.04 0.04 0.07Nuts, nut butters, and seeds 0.21 0.29 0.28 0.23 0.21Eggs and egg mixtures 0.02 0.14 0.03 0.03 0.03
1.01 1.44 2.12 3.39 3.26
Other foodsTable fats, oils, and salad dressings 0.10 0.26 0.16 0.21 0.34Gravies, sauces, condiments, and spices 0.36 0.04 0.13 0.12 0.46Coffee and tea 0.00 0.00 0.00 0.00 0.00Soft drinks, sodas, fruit drinks, and ades (including rice beverages) 0.14 0.04 0.24 0.34 0.49Sugars, sweets, and candies 0.02 0.02 0.05 0.03 0.08Soups (ready-to-serve and condensed) 0.20 0.01 0.09 0.08 0.04Soups (dry) 0.01 0.00 0.00 0.01 0.02Frozen or refrigerated entrees (including pizza, fish sticks, and frozen meals) 1.20 0.00 0.04 0.01 0.02
2.03 0.36 0.71 0.79 1.44
Notes: Food in as-purchased form, which includes uncooked grain products; raw, canned, and frozen vegetables; fruit juice concentrates; and meat withbones. Components of the market baskets are discussed in terms of pounds; therefore, fluids such as milk are weighted more prominently than are dryfoods, and juice concentrates are weighted less prominently than are their reconstituted forms.For children age 1, all milk and yogurt were assigned to the whole milk, yogurt, and cream category, because dietary guidance recommends consumptionof primarily whole milk products for these children.The numbers are rounded; thus, when summed, they may not equal the respective totals.

Table 4b. Moderate-Cost Food Plan market baskets, quantities of food purchased for a week, by age-gender group, 2007(cont’d)
MalesFood category 12-13 years 14-18 years 19-50 years 51-70 years 71+ years
Total pounds 37.43 44.04 45.00 41.20 38.99
Pounds per weekGrainsWhole grain breads, rice, pasta, and pastries (including whole grain flours) 0.29 2.25 2.39 1.74 0.82Whole grain cereals (including hot cereal mixes) 0.03 0.09 0.10 0.14 1.34Popcorn and other whole grain snacks 1.95 0.82 0.20 0.74 0.28Non-whole grain breads, cereals, rice, pasta, pies, pastries, snacks, and flours 1.35 1.89 2.04 1.30 0.88
3.62 5.05 4.74 3.92 3.32
VegetablesAll potato products 1.61 1.81 1.61 1.20 1.84Dark-green vegetables 0.50 1.07 1.12 1.10 2.95Orange vegetables 1.06 0.99 0.88 0.78 0.74Canned and dry beans, lentils, and peas (legumes) 2.21 3.11 2.64 1.61 1.51Other vegetables 2.99 3.10 3.39 3.59 2.86
8.37 10.08 9.64 8.28 9.90
FruitsWhole fruits 5.28 7.07 7.00 5.90 5.91Fruit juices 2.22 1.80 1.68 1.74 1.70
7.50 8.87 8.68 7.63 7.61
Milk productsWhole milk, yogurt, and cream 0.37 0.42 0.39 0.38 0.44Lower fat and skim milk and lowfat yogurt 12.94 12.12 12.33 12.82 12.03All cheese (including cheese soup and sauce) 0.08 0.11 0.13 0.06 0.11Milk drinks and milk desserts 0.17 0.20 0.15 0.14 0.15
13.55 12.85 13.00 13.41 12.73
Meat and beansBeef, pork, veal, lamb, and game 0.78 0.88 1.04 1.02 0.87Chicken, turkey, and game birds 0.71 2.07 2.95 3.79 2.22Fish and fish products 0.59 0.61 0.42 0.42 0.15Bacon, sausages, and luncheon meats (including spreads) 0.04 0.10 0.11 0.07 0.06Nuts, nut butters, and seeds 0.64 0.34 0.33 0.32 0.53Eggs and egg mixtures 0.08 0.12 0.17 0.16 0.10
2.85 4.13 5.03 5.78 3.92
Other foodsTable fats, oils, and salad dressings 0.25 0.44 0.47 0.31 0.39Gravies, sauces, condiments, and spices 0.17 0.26 0.46 0.21 0.21Coffee and tea 0.00 0.00 0.01 0.00 0.00Soft drinks, sodas, fruit drinks, and ades (including rice beverages) 0.97 1.93 2.64 1.40 0.62Sugars, sweets, and candies 0.06 0.14 0.13 0.11 0.07Soups (ready-to-serve and condensed) 0.00 0.24 0.15 0.12 0.21Soups (dry) 0.01 0.01 0.01 0.02 0.00Frozen or refrigerated entrées (including pizza, fish sticks, and frozen meals) 0.07 0.05 0.04 0.01 0.00
1.53 3.06 3.91 2.18 1.51
Notes: Food in as-purchased form, which includes uncooked grain products; raw, canned, and frozen vegetables; fruit juice concentrates; and meat withbones. Components of the market baskets are discussed in terms of pounds; therefore, fluids such as milk are weighted more prominently than are dryfoods, and juice concentrates are weighted less prominently than are their reconstituted forms.The numbers are rounded; thus, when summed, they may not equal the respective totals.

CNPP-20 29
Table 4b. Moderate-Cost Food Plan market baskets, quantities of food purchased for a week, by age-gender group,2007 (cont’d)
FemalesFood category 12-13 years 14-18 years 19-50 years 51-70 years 71+ years
Total pounds 37.56 36.49 38.94 38.53 34.58
Pounds per weekGrainsWhole grain breads, rice, pasta, and pastries (including whole grain flours) 1.30 1.53 1.09 2.67 2.11Whole grain cereals (including hot cereal mixes) 0.20 1.19 0.68 0.07 0.07Popcorn and other whole grain snacks 0.48 0.02 0.72 0.29 0.04Non-whole grain breads, cereals, rice, pasta, pies pastries, snacks, and flours 1.31 0.90 0.92 0.28 0.55
3.30 3.64 3.41 3.31 2.78
VegetablesAll potato products 1.04 1.26 1.49 1.19 0.89Dark-green vegetables 2.77 1.83 1.80 1.75 2.67Orange vegetables 0.84 0.68 1.59 0.90 0.72Canned and dry beans, lentils, and peas (legumes) 1.50 2.33 2.04 1.12 1.46Other vegetables 4.04 2.72 3.54 2.62 2.83
10.19 8.81 10.46 7.58 8.57
FruitsWhole fruits 5.63 5.07 5.14 7.80 4.93Fruit juices 1.79 1.64 1.50 1.57 1.61
7.41 6.71 6.64 9.38 6.55
Milk productsWhole milk, yogurt, and cream 0.76 0.58 0.40 0.06 0.22Lower fat and skim milk and lowfat yogurt 12.12 12.59 12.86 13.25 12.80All cheese (including cheese soup and sauce) 0.07 0.01 0.08 0.00 0.01Milk drinks and milk desserts 0.10 0.06 0.05 0.02 0.04
13.05 13.24 13.40 13.34 13.08
Meat and beansBeef, pork, veal, lamb, and game 0.47 0.78 0.86 0.45 0.75Chicken, turkey, and game birds 0.25 0.97 1.45 2.13 0.94Fish and fish products 1.13 0.26 0.32 0.56 0.13Bacon, sausages, and luncheon meats (including spreads) 0.03 0.01 0.02 0.00 0.01Nuts, nut butters, and seeds 0.12 0.24 0.58 0.54 0.79Eggs and egg mixtures 0.03 0.02 0.06 0.04 0.03
2.04 2.28 3.30 3.73 2.65
Other foodsTable fats, oils, and salad dressings 0.41 0.24 0.27 0.32 0.19Gravies, sauces, condiments, and spices 0.31 0.36 0.16 0.14 0.10Coffee and tea 0.00 0.00 0.00 0.00 0.00Soft drinks, sodas, fruit drinks, and ades (including rice beverages) 0.69 0.42 0.92 0.30 0.26Sugars, sweets, and candies 0.06 0.08 0.06 0.02 0.04Soups (ready-to-serve and condensed) 0.04 0.70 0.31 0.40 0.36Soups (dry) 0.00 0.00 0.00 0.01 0.00Frozen or refrigerated entrees (including pizza, fish sticks, and frozen meals) 0.05 0.01 0.02 0.00 0.00
1.57 1.81 1.75 1.18 0.96
Notes: Food in as-purchased form, which includes uncooked grain products; raw, canned, and frozen vegetables; fruit juice concentrates; and meat withbones. Components of the market baskets are discussed in terms of pounds; therefore, fluids such as milk are weighted more prominently than are dryfoods, and juice concentrates are weighted less prominently than are their reconstituted forms.The numbers are rounded; thus, when summed, they may not equal the respective totals.

30 The Low-Cost, Moderate-Cost, and Liberal Food Plans, 2007
Table 4c. Liberal Food Plan market baskets, quantities of food purchased for a week, by age-gender group, 2007
ChildrenFood category 1 year 2-3 years 4-5 years 6-8 years 9-11 years
Total pounds 22.37 22.39 32.07 33.47 51.34
Pounds per weekGrainsWhole grain breads, rice, pasta, and pastries (including whole grain flours) 0.00 0.01 1.38 0.84 1.37Whole grain cereals (including hot cereal mixes) 0.23 0.10 0.12 0.07 0.07Popcorn and other whole grain snacks 0.00 0.40 0.20 0.50 0.46Non-whole grain breads, cereals, rice, pasta, pies, pastries, snacks, and flours 0.37 0.69 0.93 1.20 1.46
0.59 1.20 2.63 2.60 3.36
VegetablesAll potato products 0.64 1.22 0.73 0.76 2.16Dark-green vegetables 1.11 0.47 0.53 0.63 2.75Orange vegetables 0.10 0.41 0.95 0.64 2.27Canned and dry beans, lentils, and peas (legumes) 0.45 1.33 1.06 1.72 1.24Other vegetables 2.94 1.88 1.59 2.50 4.05
5.24 5.31 4.87 6.24 12.47
FruitsWhole fruits 3.66 2.49 9.98 9.06 14.67Fruit juices 1.57 1.28 1.86 1.73 1.88
5.23 3.77 11.84 10.79 16.55
Milk productsWhole milk, yogurt, and cream 9.54 0.36 0.23 0.27 0.35Lower fat and skim milk and lowfat yogurt 0.00 9.07 9.29 9.16 13.82All cheese (including cheese soup and sauce) 0.01 0.03 0.04 0.03 0.05Milk drinks and milk desserts 0.03 0.05 0.06 0.11 0.11
9.58 9.52 9.62 9.57 14.34
Meat and beansBeef, pork, veal, lamb, and game 0.25 0.13 0.31 0.54 0.68Chicken, turkey, and game birds 0.17 0.10 0.31 0.99 0.53Fish and fish products 0.27 0.85 1.21 1.11 1.01Bacon, sausages, and luncheon meats (including spreads) 0.01 0.08 0.03 0.09 0.21Nuts, nut butters, and seeds 0.27 0.18 0.32 0.40 0.57Eggs and egg mixtures 0.01 0.13 0.02 0.01 0.04
0.98 1.48 2.21 3.14 3.04
Other foodsTable fats, oils, and salad dressings 0.13 0.34 0.17 0.20 0.21Gravies, sauces, condiments, and spices 0.36 0.38 0.39 0.27 0.23Coffee and tea 0.00 0.00 0.00 0.00 0.00Soft drinks, sodas, fruit drinks, and ades (including rice beverages) 0.12 0.29 0.23 0.41 0.93Sugars, sweets, and candies 0.12 0.06 0.03 0.05 0.10Soups (ready-to-serve and condensed) 0.01 0.00 0.05 0.15 0.08soups (dry) 0.01 0.00 0.01 0.01 0.02Frozen or refrigerated entrees (including pizza, fish sticks, and frozen meals) 0.01 0.04 0.02 0.04 0.03
0.75 1.12 0.90 1.13 1.59
Notes: Food in as-purchased form, which includes uncooked grain products; raw, canned, and frozen vegetables; fruit juice concentrates; and meat withbones. Components of the market baskets are discussed in terms of pounds; therefore, fluids such as milk are weighted more prominently than are dryfoods, and juice concentrates are weighted less prominently than are their reconstituted forms.For children age 1, all milk and yogurt were assigned to the whole milk, yogurt, and cream category, because dietary guidance recommends consumptionof primarily whole milk products for these children.The numbers are rounded; thus, when summed, they may not equal the respective totals.

CNPP-20 31
Table 4c. Liberal Food Plan market baskets, quantities of food purchased for a week, by age-gender group, 2007(cont’d)
MalesFood category 12-13 years 14-18 years 19-50 years 51-70 years 71+ years
Total pounds 43.50 49.01 50.36 48.87 46.94
Pounds per weekGrainsWhole grain breads, rice, pasta, and pastries (including whole grain flours) 0.37 2.59 1.34 2.23 1.92Whole grain cereals (including hot cereal mixes) 0.13 0.50 1.74 0.10 0.14Popcorn and other whole grain snacks 1.48 0.48 0.42 0.65 0.15Non-whole grain breads, cereals, rice, pasta, pies, pastries, snacks, and flours 2.07 1.47 1.72 1.45 0.95
4.04 5.04 5.22 4.43 3.16
VegetablesAll potato products 2.44 1.23 2.01 1.80 1.93Dark-green vegetables 0.84 1.06 1.58 1.97 4.70Orange vegetables 0.68 0.99 1.05 1.07 0.99Canned and dry beans, lentils, and peas (legumes) 2.93 2.70 2.96 2.51 2.82Other vegetables 4.13 5.51 4.66 4.20 3.08
11.01 11.48 12.26 11.55 13.52
FruitsWhole fruits 7.12 9.16 8.03 8.67 8.36Fruit juices 2.08 1.76 1.62 1.24 1.71
9.20 10.93 9.65 9.91 10.07
Milk productsWhole milk, yogurt, and cream 0.46 0.79 0.60 0.53 0.27Lower fat and skim milk and lowfat yogurt 13.67 13.34 13.06 13.40 13.32All cheese (including cheese soup & sauce) 0.08 0.09 0.22 0.09 0.05Milk drinks and milk desserts 0.14 0.16 0.24 0.48 0.21
14.36 14.36 14.12 14.50 13.85
Meat and beansBeef, pork, veal, lamb, and game 0.89 2.18 1.47 1.26 0.92Chicken, turkey, and game birds 0.23 0.25 1.66 1.54 2.64Fish and fish products 1.14 0.49 0.50 0.95 0.39Bacon, sausages, and luncheon meats (including spreads) 0.04 0.11 0.15 0.06 0.05Nuts, nut butters, and seeds 0.41 0.60 0.39 0.52 0.20Eggs and egg mixtures 0.27 0.11 0.18 0.17 0.08
2.99 3.73 4.36 4.51 4.28
Other foodsTable fats, oils, and salad dressings 0.34 0.38 0.50 0.52 0.51Gravies, sauces,condiments, and spices 0.42 0.44 0.50 0.22 0.30Coffee and tea 0.00 0.00 0.00 0.01 0.00Soft drinks, sodas, fruit drinks, and ades (including rice beverages) 0.79 1.77 3.30 2.85 0.56Sugars, sweets, and candies 0.08 0.35 0.16 0.13 0.06Soups (ready-to-serve and condensed) 0.23 0.52 0.25 0.20 0.62Soups (dry) 0.01 0.01 0.02 0.01 0.01Frozen or refrigerated entrees (including pizza, fish sticks, and frozen meals) 0.03 0.01 0.02 0.03 0.00
1.89 3.47 4.75 3.96 2.05
Notes: Food in as-purchased form, which includes uncooked grain products; raw, canned, and frozen vegetables; fruit juice concentrates; and meat withbones. Components of the market baskets are discussed in terms of pounds; therefore, fluids such as milk are weighted more prominently than are dryfoods, and juice concentrates are weighted less prominently than are their reconstituted forms.The numbers are rounded; thus, when summed, they may not equal the respective totals.

32 The Low-Cost, Moderate-Cost, and Liberal Food Plans, 2007
Table 4c. Liberal Food Plan market baskets, quantities of food purchased for a week, by age-gender group, 2007(cont’d)
FemalesFood category 12-13 years 14-18 years 19-50 years 51-70 years 71+ years
Total pounds 47.82 41.68 46.93 41.15 40.32
Pounds per weekGrainsWhole grain breads, rice, pasta, and pastries (including whole grain flours) 1.29 1.89 1.69 2.24 2.09Whole grain cereals (including hot cereal mixes) 0.21 0.36 0.72 0.08 0.08Popcorn and other whole grain snacks 0.44 0.04 0.03 0.75 0.02Non-whole grain breads, cereals, rice, pasta, pies, pastries, snacks, and flours 1.66 1.21 1.26 0.44 0.84
3.60 3.50 3.69 3.50 3.04
VegetablesAll potato products 2.41 1.94 1.96 1.50 1.07Dark-green vegetables 1.46 1.73 3.14 1.18 4.65Orange vegetables 0.80 0.87 0.89 0.88 0.94Canned and dry beans, lentils, peas (legumes) 2.52 2.27 2.37 1.31 1.83Other vegetables 2.91 3.94 3.82 3.20 2.99
10.10 10.74 12.18 8.08 11.47
FruitsWhole fruits 12.18 6.07 9.42 9.88 7.38Fruit juices 1.73 1.58 1.65 0.44 0.39
13.91 7.65 11.06 10.32 7.78
Milk productsWhole milk, yogurt, and cream 0.37 0.39 0.33 0.21 0.19Lower fat and skim milk and lowfat yogurt 13.79 14.19 13.62 14.37 13.89All cheese (including cheese soup and sauce) 0.08 0.28 0.09 0.01 0.00Milk drinks and milk desserts 0.18 0.10 0.17 0.06 0.04
14.42 14.97 14.22 14.66 14.13
Meat and beansBeef, pork, veal, lamb, and game 1.30 0.96 0.86 0.86 0.80Chicken, turkey, and game birds 1.48 0.31 0.72 0.78 0.74Fish and fish products 0.60 0.39 0.54 1.30 0.46Bacon, sausages, and luncheon meats (including spreads) 0.08 0.14 0.08 0.00 0.05Nuts, nut butters, and seeds 0.28 0.70 0.76 0.64 0.79Eggs and egg mixtures 0.04 0.07 0.08 0.10 0.03
3.77 2.57 3.05 3.69 2.87
Other foodsTable fats, oils, and salad dressings 0.44 0.38 0.37 0.26 0.20Gravies, sauces, condiments, and spices 0.32 0.39 0.37 0.17 0.11Coffee and tea 0.00 0.00 0.00 0.00 0.00Soft drinks, sodas, fruit drinks, and ades (including rice beverages) 0.98 1.05 1.64 0.27 0.09Sugars, sweets, and candies 0.10 0.13 0.09 0.04 0.02Soups (ready-to-serve and condensed) 0.15 0.25 0.22 0.17 0.60Soups (dry) 0.02 0.00 0.01 0.01 0.01Frozen or refrigerated entrees (including pizza, fish sticks, and frozen meals) 0.02 0.03 0.04 0.00 0.00
2.02 2.24 2.74 0.92 1.04
Notes: Food in as-purchased form, which includes uncooked grain products; raw, canned, and frozen vegetables; fruit juice concentrates; and meat withbones. Components of the market baskets are discussed in terms of pounds; therefore, fluids such as milk are weighted more prominently than are dryfoods, and juice concentrates are weighted less prominently than are their reconstituted forms.The numbers are rounded; thus, when summed, they may not equal the respective totals.

CNPP-20 33
Table 5. Average market baskets of the Low-Cost, Moderate-Cost, and Liberal Food Plans, pounds of food per week,2007
Food category Low-cost Moderate-cost Liberal
Total Pounds 35.72 38.39 44.66
GrainsWhole grain breads, rice, pasta, and pastries (including whole grain flours) 1.61 1.62 1.60Whole grain cereals (including hot cereal mixes) 0.35 0.33 0.64Popcorn and other whole grain snacks 0.15 0.45 0.34Non-whole grain breads, cereals, rice, pasta, pies pastries, snacks, and flours 0.97 1.21 1.25
3.08 3.61 3.83
VegetablesAll potato products 1.29 1.27 1.72Dark-green vegetables 0.97 1.58 2.12Orange vegetables 0.75 1.00 0.96Canned and dry beans, lentils, and peas (legumes) 1.52 1.86 2.23Other vegetables 2.74 3.24 3.76
7.28 8.95 10.80
FruitsWhole fruits 5.65 5.73 8.71Fruit juices 1.53 1.64 1.45
7.19 7.37 10.16
Milk productsWhole milk, yogurt, and cream 0.85 0.35 0.40Lower fat and skim milk and lowfat yogurt 10.02 12.13 13.00All cheese (including cheese soup and sauce) 0.14 0.07 0.10Milk drinks and milk desserts 0.20 0.09 0.18
11.22 12.64 13.68
Meat and beansBeef, pork, veal, lamb, and game 0.85 0.78 1.01Chicken, turkey, and game birds 0.87 1.87 1.01Fish and fish products 0.37 0.54 0.70Bacon, sausages, and luncheon meats (including spreads) 0.10 0.05 0.09Nuts, nut butters, and seeds 0.65 0.42 0.54Eggs and egg mixtures 0.15 0.09 0.11
2.99 3.75 3.46
Other foodsTable fats, oils, and salad dressings 0.34 0.32 0.37Gravies, sauces, condiments, and spices 0.25 0.25 0.34Coffee and tea 0.00 0.00 0.00Soft drinks, sodas, fruit drinks, and ades (including rice beverages) 2.96 1.15 1.62Sugars, sweets, and candies 0.18 0.08 0.11Soups (ready-to-serve and condensed) 0.18 0.23 0.24Soups (dry) 0.01 0.01 0.01Frozen or refrigerated entrees (including pizza, fish sticks, and frozen meals) 0.04 0.04 0.02
3.97 2.08 2.72
Notes: Food in as-purchased form, which includes uncooked grain products; raw, canned, and frozen vegetables; fruit juice concentrates; and meat withbones. Components of the market baskets are discussed in terms of pounds; therefore, fluids such as milk are weighted more prominently than are dryfoods, and juice concentrates are weighted less prominently than are their reconstituted forms.The numbers are rounded; thus, when summed, they may not equal the respective totals.
34 The Low-Cost, Moderate-Cost, and Liberal Food Plans, 2007
The following are some of the more noticeable differences among food subgroups:
GrainsGiven the dietary constraint that at least half of the recommended grains in market basketsof all three food plans had to be in the form of whole grains, approximately 67 percent ofthe grains in the three average baskets are whole grain breads, rice, pasta, and pastries;whole grain cereals; and popcorn and other whole grain snacks. Whole grain cerealscompose a larger amount and share in the Liberal Food Plan because such cereals tend tobe more expensive and are therefore limited by the price constraint.
VegetablesA variety of vegetables make up the vegetable group in the three average food plan marketbaskets, which is in line with the MyPyramid dietary constraint that a set amount ofvegetables from the dark-green, orange, starchy, other vegetable, and legumes subgroupshave to be in the baskets. Potato products account for a slightly higher share and dark-green vegetables a lower share in the Low-Cost Plan, compared with the Liberal Plan. Thisis likely because people in the second food spending quartile consume more potatoes andless dark-green vegetables, compared with people in the top quartile because potatoes arerelatively inexpensive sources of nutrients. It could also represent different preferences ofindividuals.
FruitsWhole fruits account for well over three-fourths (78 to 86 percent) of the fruit portion ofthe three average food plan market baskets; thus, the amount of fruit is consistent withMyPyramid recommendations that at least half of recommended fruit intake be in the formof whole fruit. The much higher than 50-percent share of whole fruits is likely due to wholefruit providing more fiber. The greater share of whole fruit in the Liberal Plan as comparedto the other two food plans reflects the taste preferences of the average person whoconsumes a higher cost diet.
Milk ProductsThe food category consisting of lower fat and skim milk and lowfat yogurt accounts formost (89 to 96 percent) of the milk portion of the three average market baskets, becausethese forms of milk products are lower in total and saturated fat. Milk products constitute alarge share of the three average baskets because these products are good sources of vitaminA, vitamin B12, riboflavin, calcium, phosphorus, magnesium, potassium, and zinc. Also,because milk products are mostly sold in fluid rather than dry form, they weigh more.
Meat and BeansMore expensive meat and bean subgroups (beef, pork, veal, and game, and fish and fishproducts) make up a higher amount and share of the Liberal Food Plan, compared with theLow-Cost Food Plan. Fish and fish products account for 20 percent of the meat and beansportion of the average Liberal market basket versus 12 percent for the Low-Cost basket.

CNPP-20 35
The remaining portions of the meat and beans group are dispersed among the various meatand beans subgroups for the average market baskets of the three plans. This is becauseconstraints were placed on the meat and beans subgroups so that model solutions wouldfall within a narrower range of average consumption to ensure a more palatable diet. Itshould also be noted that because this food category is in as-purchased form, it has a highrefuse factor, especially for the chicken, turkey, and game birds subgroup. While the actualamounts of chicken, turkey, and game birds appear high in the Moderate-Cost basket, therefuse factor for poultry is about 50 percent.
Other FoodsOther foods, particularly soft drinks, sodas, fruit drinks, and ades, compose a largeramount of the Low-Cost Food Plan than they do in the other two plans. These drinks areinexpensive sources of calories and have high consumer preference. Thus, after dietarystandards (MyPyramid Food Guidance System, 1997-2005 RDAs, AIs, and AMDRs, etc.)are met, the amount of this food category increases in the Low-Cost Plan. The actualamount of soft drinks, sodas, fruit drinks, and ades in the average basket of the Low-CostPlan translates to about three 16-ounce cans of soda per week, which is far less than currentconsumption.
Average Food Plan Market Baskets Versus Average Consumptionand Previous Market Baskets
To understand how reported diets would need to change to meet the dietary standards ofthe new Low-Cost, Moderate-Cost, and Liberal Food Plans, CNPP compared the averagemarket baskets for each plan (in pounds) with average consumption (in pounds) based onthe food expenditure quartile corresponding to each plan as reported in NHANES 2001-2002. Using the same technique that produced a weighted average market basket, CNPPcalculated a weighted average consumption basket for each food plan. Table 6 shows thepercentage difference between the average consumption baskets for people in the second,third, and top food spending quartiles and the average market baskets for the Low-Cost,Moderate-Cost, and Liberal Food Plans. The average food plan baskets contain morepounds of total food than do the average consumption baskets because fruit and vegetablesgenerally weigh more per calorie than meats and foods high in fat and sugar.
The average market baskets for all three food plans contain more grains (20 to 67 percentmore), vegetables (116 to 151 percent), fruits (118 to 168 percent), and milk products (131to 170 percent) than people are eating. The Low-Cost basket contains the same amount ofmeat and beans that people are eating; the Moderate-Cost basket, 10 percent more meatand beans; and the Liberal basket, 10 percent less. However, these differences vary widelyby meat and bean subgroup. The average market baskets of all three plans contain lessbeef, pork, veal, lamb, and game, and more fish and fish products, and nuts, nut butters,and seeds than do the baskets based on average consumption; these latter two foodcategories are relatively lower in fat. The average market baskets of all three food plans

36 The Low-Cost, Moderate-Cost, and Liberal Food Plans, 2007
have much less (58 to 77 percent) other foods such as fats, oils, and sweets than is the casefor corresponding baskets based on average consumption. Foods in this group are typicallyhigh in fat and calories. Having more vegetables, fruits, and milk products and less otherfoods in all three food plans, compared with average consumption levels, is not surprisingbecause the food plans represent a nutritious diet. As noted earlier, the Healthy EatingIndex, an indicator of the quality of Americans’ diet, shows that most people need toimprove their diet (Basiotis et al., 2002).
Table 6. Average market baskets of the Low-Cost, Moderate-Cost, and Liberal Food Plans versus correspondingaverage consumption
Low-Cost Moderate-Cost LiberalAverage Market Average Market Average Market
consumption basket Difference consumption basket Difference consumption basket Difference
Pounds per week Pounds per week Pounds per week
Grains 2.57 3.08 +20% 2.52 3.61 +44% 2.29 3.83 +67%
Vegetables 3.36 7.28 +116% 3.65 8.95 +145% 4.30 10.80 +151%
Fruit 2.80 7.19 +157% 3.37 7.37 +118% 3.80 10.16 +168%
Milk products 4.85 11.22 +131% 5.06 12.64 +150% 5.06 13.68 +170%
Meat and beans 2.99 2.99 0% 3.41 3.75 +10% 3.86 3.46 -10%
Other foods(fats, oils, sweets, etc.) 9.53 3.97 -58% 9.14 2.08 -77% 8.85 2.72 -69%
Total 26.10 35.72 27.15 38.39 28.16 44.66
Note: The numbers are rounded; thus, when summed, they may not equal the respective totals.
CNPP also compared the weighted average market baskets of the new and previous Low-Cost, Moderate-Cost, and Liberal Food Plans (table 7). Compared with their respectiveprevious market baskets, the new market baskets of the Low-Cost, Moderate-Cost, andLiberal Food Plans contain fewer pounds of grains (9 to 16 percent), more vegetables (28to 52 percent), more fruits (45 to 66 percent), more milk products (52 to 60 percent), lessmeat and beans (34 to 49 percent), and less other foods (fats, oils sweets, etc.) (34 to 57percent).
It should be noted that in the previous food plan market baskets, legumes were placed inthe meat and beans market basket group; in this update, they were placed in the vegetablesmarket basket group. If this change had not been made, there would be almost no changein the meat and beans group (in pounds) between the previous and updated Low-Cost andModerate-Cost Food Plans, and a lower decrease in the meat and beans group for theLiberal Food Plan. There would still be an increase in vegetables between the previousand updated plans; however, this increase would be less pronounced than what is shown intable 7. Also, frozen entrees in the previous food plans were allocated to their respectivemarket basket group (e.g., frozen fish sticks to meat and beans), while in this update, theywere placed in the other foods market basket group. However, frozen entrees are a verysmall portion of all the market baskets.

CNPP-20 37
The differences between the previous and new food plan market baskets reflect changesin dietary guidance over time. The 2005 Dietary Guidelines for Americans encourageincreased intakes of fruit, vegetables, and fat-free or lowfat milk and milk products. Thenew USDA food guidance system, MyPyramid, recommends more of these food groupsthan was the case with the 1992 Food Guide Pyramid, in part because of changes in therecommendations by the Food and Nutrition Board of the Institute of Medicine (Instituteof Medicine, Food and Nutrition Board, 1997, 1998, 2000a, 2000b, 2002, 2004, 2005).The increased amounts of these food groups inevitably resulted in decreases of the otherfood groups, especially those found in the “other foods” market basket group consistingof oils, candy, soda, and fruit drinks because foods in this group are less nutrient dense.
Table 7. Average market baskets of the Low-Cost, Moderate-Cost, and Liberal Food Plans versus previous baskets Low-Cost basket Moderate-Cost basket Liberal basket
Previous New Difference Previous New Difference Previous New Difference
Pounds per week Pounds per week Pounds per week
Grains 3.66 3.08 -16% 3.98 3.61 -9% 4.38 3.83 -13%
Vegetables 5.68 7.28 +28% 6.33 8.95 +41% 7.10 10.80 +52%
Fruit 4.32 7.19 +66% 5.07 7.37 +45% 6.46 10.16 +57%
Milk products 7.36 11.22 +52% 7.92 12.64 +60% 8.87 13.68 +54%
Meat and beans 4.77 2.99 -37% 5.69 3.75 -34% 6.72 3.46 -49%
Other foods(fats, oils, sweets, etc.) 6.04 3.97 -34% 4.88 2.08 -57% 5.96 2.72 -54%
Total 31.83 35.72 33.87 38.39 39.49 44.66
Notes: In the previous food plans: (1) legumes were placed in the meat and beans group; whereas now, they are in the vegetable group; and (2) frozenentrees were allocated to their respective food groups; whereas now, they are in the other food group.The numbers are rounded; thus, when summed, they may not equal the respective totals.
38 The Low-Cost, Moderate-Cost, and Liberal Food Plans, 2007
Future Cost Updates of the Food Plans
The method used to update the monthly costs of the previous market baskets of the Low-Cost, Moderate-Cost, and Liberal Food Plans, as well as the recently updated Thrifty FoodPlan, will be used to update the monthly costs of the revised market baskets for the threefood plans.10 This method, originally approved by an expert panel of economists, uses themonthly Consumer Price Indexes (CPIs) for specific food categories to update prices forthe food categories of food plan market baskets from one month to the next. Each of the29 food categories of a food plan has a corresponding CPI or set of corresponding CPIs thatare applied to update the appropriate cost of the food categories for the market basket foreach age-gender group. For food categories with more than one corresponding CPI, CNPPuses a weighted average of the appropriate CPIs. The following illustrates the overallconcept of matching food categories to CPIs: The CPI for breakfast cereal is used to updatethe cost of the category “whole grain cereals”; the CPI for potatoes is used to update thecategory “all potato products”; the CPI for cheese and related products is used to update thecategory “all cheese”; the CPI for poultry is used to update the category “chicken, turkey,and game birds.” This example illustrates the use of two CPIs for the category “lower fatand skim milk and lowfat yogurt.” CNPP uses a weighted average (based on expenditurepatterns) of the CPI for fresh milk other than whole and the CPI for other dairy and relatedproducts. After the CPIs are applied to each food category, the new costs of the foodcategories are summed to determine the new total cost of the food plan market basketfor each age-gender group for the month.
10To calculate the September 2007 food plan costs, the expenditure shares of the revised food plans’ marketbaskets will be applied to the costs of the August 2007 food plan market baskets. Future monthly cost updateswill be based on these new market basket expenditure shares and the previous month’s food plan costs.

CNPP-20 39
Conclusions
The Low-Cost, Moderate-Cost, and Liberal Food Plans represent nutritious diets at threecost levels. This report presents the 2007 revision of the market baskets of each of the threefood plans. The 2007 revision reflects recent changes in dietary guidance and incorporatesupdated information on food composition, consumption patterns, and food prices at thesame inflation-adjusted cost of the previous food plans. The new market baskets of theLow-Cost, Moderate-Cost, and Liberal Food Plans, however, do not meet the vitamin E,potassium, and sodium recommendations for most age-gender groups. To meet theprevailing recommendations for these nutrients would result in market baskets verydifferent from typical consumption habits (in the case of vitamin E and potassium) orwould require changes in food-manufacturing practices (in the case of sodium).
The new (2007) market baskets of the Low-Cost, Moderate-Cost, and Liberal Food Plansare now the official USDA baskets. Cost updates of the three food plans will be based onthe content of these baskets. Also, the list of foods and quantities specified in the marketbaskets may be used in nutrition and consumer education programs designed to help peopleeat a healthful diet at various cost levels.

40 The Low-Cost, Moderate-Cost, and Liberal Food Plans, 2007
References
Basiotis, P.P., Carlson, A., Gerrior, S.A., Juan, W.Y., & Lino, M. (Authors in alphabeticalorder.) (2002). The Healthy Eating Index: 1999-2000 (CNPP-12). U.S. Department ofAgriculture, Center for Nutrition Policy and Promotion.
Basiotis, P.P., Welsh, S.O., Cronin, F.J., Kelsay, J.L., & Mertz, W. (1987). Number of daysof food intake records required to estimate individual and group nutrient intakes withdefined confidence. The Journal of Nutrition, 117(9), 1638-1641.
Bowman, S.A. (1997). A methodology to price foods consumed: Development of a foodprice database. Family Economics and Nutrition Review, 10(1), 26-33.
Carlson, A., Lino, M., Juan, W.Y., Marcoe, K., Bente, L., Hiza, H., et al. (2007).Development of the CNPP Prices Database. U.S. Department of Agriculture, Center forNutrition Policy and Promotion. Manuscript in preparation.
Carlson, A., Lino, M., Juan, W.Y., Hanson, K., & Basiotis, P.P. (2007). Thrifty Food Plan,2006 (CNPP-19). U.S. Department of Agriculture, Center for Nutrition Policy andPromotion.
Carlson, A., Lino, M., Gerrior, S., & Basiotis, P.P. (2003). The Low-Cost, Moderate-Cost,and Liberal Food Plans: 2003 Administrative Report (CNPP-13). Center for NutritionPolicy and Promotion, U.S. Department of Agriculture.
Cofer, E., Grossman, E., & Clark, F. (1962). Family food plans and food costs. HomeEconomics Research Report No. 20. U.S. Department of Agriculture, Agricultural ResearchService.
Institute of Medicine, Food and Nutrition Board. (1997). Dietary Reference Intakes forCalcium, Phosphorus, Magnesium, Vitamin D, and Fluoride. Washington, DC: TheNational Academies Press.
Institute of Medicine, Food and Nutrition Board. (1998). Dietary Reference Intakes forThiamin, Riboflavin, Niacin, Vitamin B6, Folate, Vitamin B12, Pantothenic Acid, Biotin, andCholine. Washington, DC: The National Academies Press.
Institute of Medicine, Food and Nutrition Board. (2000a). Dietary Reference Intakes forVitamin C, Vitamin E, Selenium, and Carotenoids. Washington, DC: The NationalAcademies Press.

CNPP-20 41
Institute of Medicine, Food and Nutrition Board. (2000b). Dietary Reference Intakes forVitamin A, Vitamin K, Arsenic, Boron, Chromium, Copper, Iodine, Iron, Manganese,Molybdenum, Nickel, Silicon, Vanadium, and Zinc. Washington, DC: The NationalAcademies Press.
Institute of Medicine, Food and Nutrition Board. (2002). Dietary Reference Intakes forEnergy, Carbohydrate, Fiber, Fatty Acids, Cholesterol, Protein, and Amino Acids.Washington, DC: The National Academies Press.
Institute of Medicine, Food and Nutrition Board. (2004). Dietary Reference Intakes forWater, Potassium, Sodium, Chloride, and Sulfate. Washington, DC: The NationalAcademies Press.
Institute of Medicine, Food and Nutrition Board. (2005). Dietary Reference Intakes forEnergy, Carbohydrate, Fiber, Fatty Acids, Cholesterol, Protein, and Amino Acids.Washington, DC: The National Academies Press.
Lino, M. (2007). Expenditures on Children by Families, 2006. U.S. Department ofAgriculture, Center for Nutrition Policy and Promotion. Miscellaneous Publication No.1528-2006.
Moshfegh, A., Goldman, J., & Cleveland, L. (2005). What We Eat in America, NHANES2001-2002: Usual Nutrient Intakes from Food Compared to Dietary Reference Intakes.U.S. Department of Agriculture, Agricultural Research Service.
Nielsen Homescan™ [Data file]. (2005). Purchase and other information available fromNielsen Web site, http://www.acnielsen.com/products/reports/homescan/.
U.S. Department of Agriculture. (1975). Food Yields: Summarized by Different Stages ofPreparation. USDA Agriculture Handbook No. 102.
U.S. Department of Agriculture. (2005). National Nutrient Database for StandardReference (Release 18). Retrieved August 31, 2005, from http://www.ars.usda.gov/Services/docs.htm?docid=8964.
U.S. Department of Agriculture, Agricultural Research Service, Food Surveys ResearchGroup. (2004). FNDDS USDA Food and Nutrient Database for Dietary Studies, 1.0.Beltsville, MD: Author.
U.S. Department of Agriculture, Consumer Nutrition Division, Human NutritionInformation Service. (1983a). The Thrifty Food Plan, 1983. CND(Adm.) No. 365.Hyattsville, MD.

42 The Low-Cost, Moderate-Cost, and Liberal Food Plans, 2007
U.S. Department of Agriculture, Consumer Nutrition Division, Human NutritionInformation Service. (1983b). Measures of Food Used and Food Eaten In U.S.Households. CND(Adm.) No. 369. Hyattsville, MD.
U.S. Department of Health and Human Services, & U.S. Department of Agriculture.(2005). Dietary Guidelines for Americans, 2005 (6th ed.). Washington, DC: U.S.Government Printing Office.

CNPP-20 A1-1
Appendix 1
Food Group Database Documentation
Food categories developed for the 2007 Food Plans are based mainly on the classificationof the previous food plans’ food categories used in the 1989-91 CSFII, with modificationssuitable to meet the recommendations from the 1997-2005 Dietary Reference Intakes, the2005 Dietary Guidelines for Americans, food intake patterns of MyPyramid, and food planmodels. In addition, criteria used in the development of the previous food plans and theMyPyramid food groups were considered in categorizing foods. Within major foodcategories, individual foods were placed in the same food category when they had similarnutritive values for certain nutrients, such as the content of total fat and discretionary solidfat or calories from the sum of discretionary solid fat and added sugars. The cost of thefoods was also used in grouping meat products.
Except for alcoholic beverages, foods reported consumed by all individuals 1 year old andolder are grouped into 58 categories in the food category database, totaling 4,152 individualfoods. The consumption data are from the 2001-2002 National Health and NutritionExamination Survey (NHANES). Foods included in each category and criteria used toassign a food to a particular food category are described below.
Grains
Breads, yeast and quick—whole grain; Breads, yeast and quick—non-whole grain:This category consists of breads, rolls, muffins, bagels, tortillas, taco shells, pancakes,waffles, biscuits, and cornbread. Breads or bread products with 50 percent or more ofounce equivalents from whole grain were placed in the whole grain category for thepurposes of food group classification; all remaining breads and bread products wereplaced in the non-whole grain category.
Breakfast cereal—whole grain, regular calories; Breakfast cereals—whole grain, lowcalories: Breakfast cereals containing 50 percent or more ounce equivalents from wholegrain per 100 grams (e.g., oatmeal, oats, bulgur, buckwheat, and certain ready-to-eatcereals) were placed in the whole grain category. This breakfast cereal group is subdividedinto regular and low calorie based on the amount of discretionary solid fat and added sugars(SFAS). Cereals with 15 percent or more of calories from SFAS were placed in the regularcalories SFAS group, and cereals with less than 15 percent of calories from SFAS wereplaced in the low calories SFAS group. The 15-percent cutoff is primarily based on thesugar content of sugar-coated cereals.
Breakfast cereal—non-whole grain: Breakfast cereals with less than 50 percent of ounceequivalents from whole grain (e.g., cream of wheat, grits, oat bran, wheat germ, corn flakes,and Rice Krispies®) were placed in the non-whole grain category.

A1-2 The Low-Cost, Moderate-Cost, and Liberal Food Plans, 2007
Rice and pasta—whole grain; Rice and pasta—non-whole grain: This category consistsof all types of rice and pasta products, such as macaroni, noodles, and spaghetti. Productswith 50 percent or more of ounce equivalents from whole grain were placed in the wholegrain category. Products with less than 50 percent of ounce equivalents from whole grainwere placed in the non-whole grain category.
Cakes, pies, and other sweet bakery products—whole grain; Cakes, pies, and othersweet bakery products—non-whole grain: This category consists of cakes, cookies,pies, pastries, doughnuts, sweet rolls, croissants, graham crackers, breakfast and mealreplacement bars, and other sweet products. Products with 50 percent or more of ounceequivalents from whole grain were placed in the whole grain category. Products with lessthan 50 percent of ounce equivalents from whole grain were placed in the non-whole graincategory.
Grain-based snacks—whole grain; Grain-based snacks—non-whole grain: This categoryconsists of crackers, popcorn, pretzels, and corn- or wheat-based salty snacks. Productswith 50 percent or more of ounce equivalents from whole grain were placed in the wholegrain category. Products with less than 50 percent of ounce equivalents from whole grainwere placed in the non-whole grain category.
Grain mixtures—regular fat; Grain mixtures—lowfat: This category consists of tacos,enchiladas, chimichangas, pizzas, pasta with meat and/or vegetables, egg rolls, lasagna, andrice with meat and/or vegetables. Generally, mixtures were placed in the regular or lowfatcategory based on food descriptors. However, in some cases, a food code was reviewedand the mixture was placed in a particular category based on the fat content of its recipecomponents. Six percent was selected as the cutoff value for regular versus lowfat bylooking at the fat content of fried or high-fat grain mixtures such as tacos, nachos, burritos,pizza, and pasta with cheese. Pizza without cheese contains 6.25 percent fat; rice disheswith beans, macaroni salads, meatless lasagna, and lo mein with meat contain 4.5 to6 percent fat. Because pizza is considered a higher fat food, and those foods with a fatcontent of 4.5 to 6 percent are considered lower fat foods, mixtures with a fat content lessthan 6 percent by weight were placed in the lowfat category and mixtures with a fat contentof 6 percent or more by weight were placed in the regular fat category.
Vegetables and Fruits
Potato products—regular fat; Potato products—lowfat: This category consists of freshand processed white potatoes, french fries, hash browns, home fries, potato chips, andpotato sticks. The regular fat category consists of cooked, boiled, baked, scalloped, mashed,and stuffed potatoes; and potato salad, German style. The high fat category consists ofpotato chips; french fried potatoes; hash browns; potato puffs; potato patties; potatopancakes; potato puddings and salads; and mashed potatoes with added fat, egg, and/orcheese.

CNPP-20 A1-3
Dark-green vegetables—added fat; Dark-green vegetables—no added fat: This categoryconsists of vegetables such as broccoli, chard, collard greens, mustard greens, kale, andspinach; juices from these vegetables are also included. The Food and Nutrient Databasefor Dietary Studies (FNDDS) was used to determine whether fat was added to the vegetableduring cooking. If fat was added, the vegetable was placed in the added-fat category; if nofat was added, the vegetable was placed in the no-added-fat category.
Orange vegetables—added fat; Orange vegetables—no added fat: This category consistsof vegetables such as carrots, pumpkin, winter squash, and sweet potatoes; juices from thesevegetables are also included. The FNDDS was used to determine whether fat was added tothe vegetable during cooking. If fat was added, the vegetable was placed in the added-fatcategory; if no fat was added, the vegetable was placed in the no-added-fat category.
Tomatoes—added fat; Tomatoes—no added fat: This category consists of all fresh andcanned tomato products, such as raw tomatoes, canned tomato sauce, tomato puree, tomatopaste, tomato soup, and tomato juice. The FNDDS was used to determine whether fat wasadded to the tomatoes during cooking. If fat was added, the tomato food items were placedin the added-fat category; if no fat was added, the tomato food items were placed in theno-added-fat category.
Other vegetables—added fat; Other vegetables—no added fat: This category consists ofvegetables such as beans, beets, cabbage, cauliflower, corn, cassava, eggplant, green peas,lettuce, bell peppers, snow peas, turnips, and Brussels sprouts; juices from these vegetablesare also included. The FNDDS was used to determine whether fat was added to the vegetableduring cooking. If fat was added, the vegetable was placed in the added-fat category; ifno fat was added, the vegetable was placed in the no-added-fat category.
Mixed vegetables—added fat; Mixed vegetables—no added fat: This category consistsof mixed vegetable groups and/or vegetables in combination with other foods. Creamedpeas and carrots; carrots in tomato sauce; cucumber salad with creamy dressing; mixedvegetables containing corn, lima beans, and peas; batter-dipped fried vegetables; andvegetable casseroles with cheese are examples of foods in this category. The FNDDS wasused to determine whether fat was added to the vegetable during cooking. If fat was added,the vegetable was placed in the added-fat category; if no fat was added, the vegetable wasplaced in the no-added-fat category.
Citrus fruits, melons, and berries; Citrus fruit, melon, and berry juices: This categoryconsists of fresh, canned, frozen, and dried citrus fruits (e.g., limes, lemons, grapefruits,oranges, tangelos, and tangerines); fresh, canned, frozen, and dried melons (e.g., cantaloupe,honeydew, and watermelon); and fresh, canned, frozen, and dried berries (e.g., blackberries,blueberries, cranberries, raspberries, and strawberries). Fruit juices from these fruits areincluded in the citrus fruit, melon and berry juices category.

A1-4 The Low-Cost, Moderate-Cost, and Liberal Food Plans, 2007
Fruits other than citrus fruits, melons, and berries; Fruit juices other than citrus, melon,and berry: This category consists of fresh, canned, frozen, and dried fruits other than citrusfruits, melons, and berries, such as apples, apricots, bananas, cherries, grapes, papayas,peaches, pears, and plums. Fruit juices made from these fruits are included in the juicescategory.
Milk Products
Milk and milk-based foods—regular fat: This category consists of all fluid, evaporated,condensed, and dry whole milk (fat content 3 percent or higher by weight) as well as regularyogurt, coffee creams, cream substitutes, whipping creams, sour creams and dips, andneufchatel/cream cheese and dips. For dry milk, the fat content was equivalent to wholemilk after reconstitution.
Milk and milk-based foods—lower fat: This category consists of all fluid, evaporated,and dry reduced-fat milk (fat content 2 percent by weight), light milk (fat content 0.5 to 1percent by weight), and skim (fat-free) milk as well as lowfat or nonfat yogurt (fat contentless than 1.55 percent by weight). For dry milk, the fat content was equivalent to reduced-fat, light, or skim milk after reconstitution.
Cheese: This category consists of natural, processed, and imitation cheeses; cottage cheese;cheese spreads; cheese dips; and cheese soups. These foods were not subclassified into aregular and a lowfat category, because the average amount of lowfat cheese reported ashaving been consumed was too low to be separated out and to be used in the mathematicalmodel.
Milk-based drinks and desserts—regular fat; Milk-based drinks and desserts—lower fat:This category consists of milk-based drinks, such as flavored milk, malted milk, eggnogs,cocoa, hot chocolate, infant formulas, meal replacement drinks, soy-based drinks, andmilk-based dry mixes; dairy desserts made with ice milk, ice cream, and frozen yogurt; andsherbet, puddings, and custard. Milk-based drinks with a fat content equivalent to that ofwhole milk (fat content 3 percent or higher by weight) and dairy desserts having more than6 percent fat content by weight were placed in the regular fat category. Milk-based drinkswith a fat content equivalent to that of reduced-fat or skim milk (fat content less than3 percent by weight) and dairy desserts having 6 percent or less fat content by weightwere placed in the lower fat category. For dry milk-based drinks, the fat level of wholemilk powder was used as the basis for placing the dry mixes into the regular or lower fatcategory. Whole milk powder has a fat content of 26.7 percent; thus, milk-based dry drinkmixes having less fat than 26.7 percent were placed in the lower fat category.

CNPP-20 A1-5
Meat and Beans
Red meats—regular discretionary solid fat, regular cost; Red meats—regulardiscretionary solid fat, low cost: This category consists of beef, pork, veal, and lamb;game meats; and organ meats, such as liver and kidney. Red meats with discretionary solidfat content of more than the median amount (5.9 grams per 100 grams of cooked form) wereplaced in the regular discretionary solid fat category. Discretionary solid fat in red meat isthe excess fat from the lean meat fat composite standard, which includes natural fat as wellas cooking fats. To determine regular cost versus low cost, CNPP arranged each food in theregular discretionary solid fat red meat category in descending order in terms of its averagecost per 100 grams of edible forms. The top 66.66 percent of foods were placed in theregular-cost category, and the bottom 33.34 percent of foods, in terms of cost, were placedin the low-cost category.
Red meats—low discretionary solid fat, regular cost; Red meats—low discretionary solidfat, low cost: This category consists of beef, pork, veal, lamb, and game meats. Red meatswith a discretionary solid fat content that was equal to or less than the median amount(5.9 grams per 100 grams of cooked form) were considered low discretionary solid fat.Discretionary solid fat in red meat is the excess fat from the lean meat fat compositestandard, which includes natural fat as well as cooking fats. To determine regular costversus low cost, CNPP arranged each food in the low discretionary solid fat red meatcategory in descending order in terms of its average cost per 100 grams of edible forms.The top 66.66 percent of foods were placed in the regular-cost category, and the bottom33.34 percent of foods, in terms of cost, were placed in the low-cost category.
Poultry—regular discretionary solid fat, regular cost; Poultry—regular discretionarysolid fat, low cost: This category consists of cooked and processed chicken, turkey, duck,Cornish game hen, game birds, and organ meats (e.g., liver and giblets). Poultry productswith a discretionary solid fat content of more than the median amount (3.3 grams per100 grams of cooked form) are included in the regular discretionary solid fat group.Discretionary solid fat in poultry is the excess fat from the lean meat fat compositestandard, which includes natural fat as well as cooking fats. To determine regular costversus low cost, CNPP arranged each food in the regular discretionary solid fat poultrycategory in descending order in terms of its average cost per 100 grams of edible forms.The top 66.66 percent of foods were placed in the regular-cost category, and the bottom33.34 percent of foods, in terms of cost, were placed in the low-cost category.
Poultry—low discretionary solid fat, regular cost; Poultry—low discretionary solid fat,low cost: This category consists of cooked and processed chicken, turkey, duck, Cornishgame hen, game birds, and organ meats (e.g., liver and giblets) with a discretionary solid fatcontent equal to or less than the median amount (3.3 grams per 100 grams of cooked form).Discretionary solid fat in poultry is the excess fat from the lean meat fat compositestandard, which includes natural fat as well as cooking fats. To determine regular costversus low cost, CNPP arranged each food in the low discretionary solid fat poultry

A1-6 The Low-Cost, Moderate-Cost, and Liberal Food Plans, 2007
category in descending order in terms of its average cost per 100 grams of edible forms.The top 66.66 percent of foods were placed in the regular-cost category, and the bottom33.34 percent of foods, in terms of cost, were placed in the low-cost category.
Fish—regular discretionary solid fat, regular cost; Fish—regular discretionary solid fat,low cost: This category consists of raw, cooked, and processed fish and shellfish with morethan the median amount (2.8 grams per 100 grams edible form) of discretionary solid fat.Discretionary solid fat in fish is the excess fat from the lean meat fat composite standard,which only includes cooking fats. To determine regular cost versus low cost, CNPParranged each food in the regular discretionary solid fat fish category in descending orderin terms of its average cost per 100 grams of edible form. The top 66.66 percent of foodswere placed in the regular-cost category, and the bottom 33.34 percent of foods, in termsof cost, were placed in the low-cost category.
Fish—low discretionary solid fat, regular cost; Fish—low discretionary solid fat, lowcost: This category consists of raw, cooked, and processed fish and shellfish, with equalto or less than the median amount (2.8 grams per 100 grams edible form) of discretionarysolid fat. Discretionary solid fat in fish is the excess fat from the lean meat fat compositestandard, which only includes cooking fats. To determine regular cost versus low cost,CNPP arranged each food in the low discretionary solid fat fish category in descendingorder in terms of its average cost per 100 grams of edible form. The top 66.66 percent offoods were placed in the regular-cost category, and the bottom 33.34 percent of foods, interms of cost, were placed in the low-cost category.
Lunch meats, sausages, and bacon—regular fat; Lunch meats, sausages, and bacon—lowfat: This category consists of sausage, bacon, and luncheon meat-type foods, such asfrankfurters. Foods with the descriptor “lowfat” or which contain 25 percent less fat byweight than their original form were placed in the lowfat category. The 25-percent cutoffvalue is based on the Food and Drug Administration definition of regular- versus reduced-fat meat. For some foods, fat comparisons were not possible, so a cutoff of a fat content of20 percent or more by weight was used to classify foods into regular and lowfat products.
Eggs and egg mixtures: This category consists of eggs, egg substitutes, eggs withvegetables and/or meat, egg drop soup, and meringues. Foods in this category are notsubdivided based on fat content because egg-based products have similar fat contents.
Meat, poultry, and fish mixtures—regular discretionary solid fat; Meat, poultry, and fishmixtures—low discretionary solid fat: This category consists of beef, veal, pork, lamb,chicken, turkey, and fish with vegetables and/or grain mixture products. Mixtures wereplaced in the regular discretionary solid fat category based on having more than the medianamount (2.7 grams per 100 grams of edible form); mixtures with equal to or less than themedian amount of discretionary solid fat per 100 grams of edible forms were placed in thelow discretionary solid fat group. Discretionary solid fat in meat, poultry, and fish mixturesis the excess fat from the lean meat fat composite standard, which includes natural fat aswell as cooking fats.
CNPP-20 A1-7
Dry beans, peas, lentil dishes, and mixtures: This category consists of black, white, lima,pinto, red, mung, and kidney beans; lentils; and different types of peas cooked alone orwith other foods. Soybean products (e.g., miso, tofu, and soy meal) and soybean-basedmeat substitutes (e.g., textured protein products and soyburger) were also placed in thisfood category.
Nuts and seeds: This category consists of all ground and tree nuts, such as almonds,cashews, peanuts, coconut, and walnuts; seeds, such as sunflower, pumpkin, and sesame;and nut butters, such as peanut butter.
Other Foods
Fats, oils, salad dressings, sauces, and condiments: This category consists of table fats,such as butter, margarine, vegetable oil, and butter blends; fat-free butter replacements;cooking fats, such as lard, shortening, corn oil, olive oil, peanut oil, rapeseed oil, saffloweroil, soybean oil, and sunflower oil; salad dressings; and condiments, sauces, gravies, andseasonings.
Coffee and tea: This category consists of instant, ground, and fluid coffees and teas withor without caffeine and with or without sugar or sweeteners.
Fruit drinks, soft drinks, and ades—regular calorie: Fruit drinks, soft drinks, and ades—low calorie: This category consists of fruit juice drinks, cola- and pepper-type soft drinks,root beer, ginger ale, cream soda, and lemonade. All drinks that are sugar-free or aredescribed in the food descriptors as low calorie are included in the low calorie category.Drinks containing sugar are included in the regular calorie category.
Sugars and sweets: This category consists of all types of sugars, sweeteners, and syrupssuch as honey, jams, jellies, marmalades, preserves, icings, gelatin desserts, marshmallow,and fudge; all types of candies and chocolates; and chewing gum.

CNPP-20 A2-1
Appendix 2
Description of the Optimization Model for the Low-Cost,Moderate-Cost, and Liberal Food Plans
The model for the Low-Cost, Moderate-Cost, and Liberal Food Plans is a mathematicalprogramming model that solves for a food plan that meets the nutritional requirements ofa healthful diet for groups of individuals distinguished by age and gender. The food planis in terms of average daily consumption for a set of food groups, with each food groupconsisting of a share of more detailed food items. The share is based on the consumptionof foods within each food group by the age-gender group.
Nutritional requirements are imposed as upper and lower bounds on the sum total ofnutrients consumed and on meeting the recommendations of MyPyramid, given data onthe nutrient contents of the foods consumed in the groups by all individuals. The budgetconstraint for each age-gender group is calculated from the cost of the previous food plans,inflated to 2001-2002 by the Consumer Price Indexes for food. Prices for each food groupare based on consumption of foods within the group by each age-gender group.
Finally, consumption constraints are placed on all food groups to prevent the solution fromcontaining an unreasonable amount of food from a single group. These constraints alsoforce a more varied diet than the model would otherwise contain. Lower bounds on all foodgroups are also required to prevent taking the log of 0. The objective function is designedto minimize the change in consumption of the food groups from average consumption byage-gender group that is required to meet the nutritional and cost constraints. Averageconsumption of each food group by each age-gender group is taken from National Healthand Nutrition Examination Survey 2001-2002.
The model is a constrained nonlinear optimization, with linear constraints and a nonlinearobjective function. The model is programmed in the General Algebraic Modeling Systemand solved sequentially with both the Minos and Conopt solvers.1
1 For more information on these and other solvers, see www.gams.com.

A2-2 The Low-Cost, Moderate-Cost, and Liberal Food Plans, 2007
Optimization Model of the Low-Cost, Moderate-Cost, and Liberal Food Plans
Minimize the objective function:*∑ (FBS)f (1n (FP)f - 1n (Current)f )
2 f
Subject to:
∑ (FP)f (p)f ≤ Set Cost Limit f
∑ (Quantity of nutrient group in FPf ) f
∑ (Amount of total fat in FPf ) f
∑ (Amount of saturated fat in FPf ) < 10% of total kilocalories f
∑ (Amount of linoleic acid in FPf ) f
∑ (Amount of α-linolenic acid in FPf ) f
∑ (Amount of carbohydrates in FPf ) f
∑ (mg of cholesterol in FPf ) ≤ 300 mg f
∑ (grams of fiber in FPf ) ≥ 14 g/1,000 calories f
∑ (mg of sodium in FPf ) ≤ median consumption of sodium for age-gender group or upper limit, whichever is higher f
∑ (Calories in FPf ) = IOM equation for median height and weight at low activity level ± 5 percent f
∑ (Number of MyPyramid group servings in FPf ) ≥ Recommended for calorie pattern f
(FP)f > 0(FP)f ≤ (Upper Limit) (Current)f
Where:FBSf = Food Budget Share =
f = food group (58 food groups)pf = price of food group fFPf = amount of food for 1 day in food group f at Food Plan level in gramsCurrentf = amount of food for 1 day in food group f at Current Consumption level in gramsNutrient group = protein, thiamin, riboflavin, niacin, folate, calcium, copper, phosphorus, potassium,
magnesium, iron, zinc, vitamins A, E, C, B6, B12Upper Limit = mutiplier set on a case-by-case basis to allow the model to meet both the MyPyramid
requirements and prevent an unreasonable amount of any one food groupRDA = Recommended Dietary AllowancesAI = Adequate IntakesAMDR = Acceptable Macronutrient Distribution Ranges
*The objective function states that the food plan basket should be as close to current consumption as possible. The food budget share(FBS) weight gives higher priority to food groups on which consumers spend more of their budgets. The food plan objective functionis constructed to minimize the distance between optimal food consumption and current consumption while simultaneously meeting the14 group constraints listed under “Subject to.”
> lower limit set by AMDR for age group≤ upper limit set by AMDR for age group
≥ 45% of total calories≤ 65% of total calories
≥ 5% of total calories≤ 10% of total calories
≥ 0.6% of total calories≤ 1.2% of total calories
pf (Current)f ∑ pf (Current)f f
≥ 1997-2005 RDA/AI/AMDR≤ upper limit if applicable
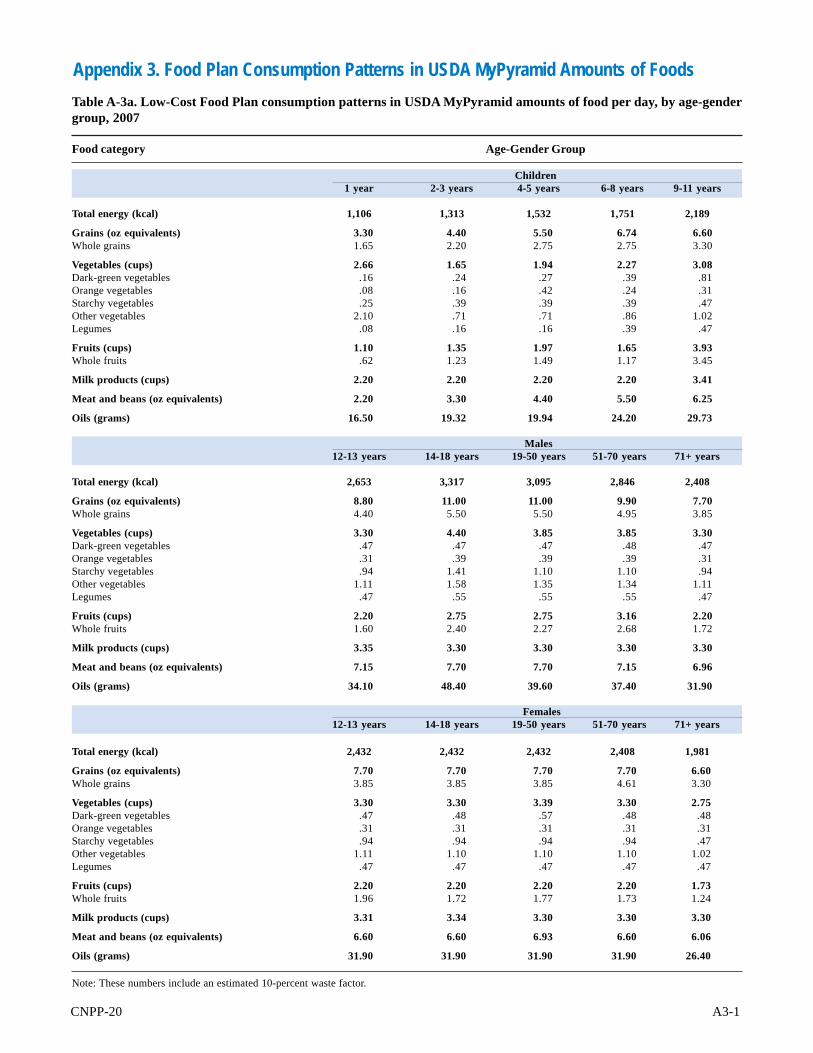
CNPP-20 A3-1
Table A-3a. Low-Cost Food Plan consumption patterns in USDA MyPyramid amounts of food per day, by age-gendergroup, 2007
Food category Age-Gender Group
Children1 year 2-3 years 4-5 years 6-8 years 9-11 years
Total energy (kcal) 1,106 1,313 1,532 1,751 2,189
Grains (oz equivalents) 3.30 4.40 5.50 6.74 6.60Whole grains 1.65 2.20 2.75 2.75 3.30
Vegetables (cups) 2.66 1.65 1.94 2.27 3.08Dark-green vegetables .16 .24 .27 .39 .81Orange vegetables .08 .16 .42 .24 .31Starchy vegetables .25 .39 .39 .39 .47Other vegetables 2.10 .71 .71 .86 1.02Legumes .08 .16 .16 .39 .47
Fruits (cups) 1.10 1.35 1.97 1.65 3.93Whole fruits .62 1.23 1.49 1.17 3.45
Milk products (cups) 2.20 2.20 2.20 2.20 3.41
Meat and beans (oz equivalents) 2.20 3.30 4.40 5.50 6.25
Oils (grams) 16.50 19.32 19.94 24.20 29.73
Males12-13 years 14-18 years 19-50 years 51-70 years 71+ years
Total energy (kcal) 2,653 3,317 3,095 2,846 2,408
Grains (oz equivalents) 8.80 11.00 11.00 9.90 7.70Whole grains 4.40 5.50 5.50 4.95 3.85
Vegetables (cups) 3.30 4.40 3.85 3.85 3.30Dark-green vegetables .47 .47 .47 .48 .47Orange vegetables .31 .39 .39 .39 .31Starchy vegetables .94 1.41 1.10 1.10 .94Other vegetables 1.11 1.58 1.35 1.34 1.11Legumes .47 .55 .55 .55 .47
Fruits (cups) 2.20 2.75 2.75 3.16 2.20Whole fruits 1.60 2.40 2.27 2.68 1.72
Milk products (cups) 3.35 3.30 3.30 3.30 3.30
Meat and beans (oz equivalents) 7.15 7.70 7.70 7.15 6.96
Oils (grams) 34.10 48.40 39.60 37.40 31.90
Females12-13 years 14-18 years 19-50 years 51-70 years 71+ years
Total energy (kcal) 2,432 2,432 2,432 2,408 1,981
Grains (oz equivalents) 7.70 7.70 7.70 7.70 6.60Whole grains 3.85 3.85 3.85 4.61 3.30
Vegetables (cups) 3.30 3.30 3.39 3.30 2.75Dark-green vegetables .47 .48 .57 .48 .48Orange vegetables .31 .31 .31 .31 .31Starchy vegetables .94 .94 .94 .94 .47Other vegetables 1.11 1.10 1.10 1.10 1.02Legumes .47 .47 .47 .47 .47
Fruits (cups) 2.20 2.20 2.20 2.20 1.73Whole fruits 1.96 1.72 1.77 1.73 1.24
Milk products (cups) 3.31 3.34 3.30 3.30 3.30
Meat and beans (oz equivalents) 6.60 6.60 6.93 6.60 6.06
Oils (grams) 31.90 31.90 31.90 31.90 26.40
Note: These numbers include an estimated 10-percent waste factor.
Appendix 3. Food Plan Consumption Patterns in USDA MyPyramid Amounts of Foods

A3-2 The Low-Cost, Moderate-Cost, and Liberal Food Plans, 2007
Table A-3b. Moderate-Cost Food Plan consumption patterns in USDA MyPyramid amounts of food per day, by age-gender group, 2007
Food category Age-Gender Group
Children1 year 2-3 years 4-5 years 6-8 years 9-11 years
Total energy (kcal) 1,206 1,433 1,672 1,910 2,388
Grains (oz equivalents) 3.60 4.80 6.00 7.29 8.24Whole grains 1.80 2.40 3.00 3.00 3.60
Vegetables (cups) 3.07 1.80 2.50 2.79 4.78Dark-green vegetables .42 .26 .26 .34 1.42Orange vegetables .09 .18 .54 .26 .44Starchy vegetables .26 .43 .43 .43 .51Other vegetables 2.24 .77 1.11 1.34 1.91Legumes .09 .17 .17 .43 .51
Fruits (cups) 1.20 1.56 1.80 1.80 2.40Whole fruits .71 1.14 1.31 1.31 1.91
Milk products (cups) 2.41 2.40 2.40 2.40 3.60
Meat and beans (oz equivalents) 2.40 3.60 4.90 6.00 6.60
Oils (grams) 18.00 22.00 20.40 26.40 32.40
Males12-13 years 14-18 years 19-50 years 51-70 years 71+ years
Total energy (kcal) 2,866 3,582 3,343 3,136 2,627
Grains (oz equivalents) 9.60 12.00 13.19 10.80 8.40Whole grains 4.80 6.00 6.00 6.07 4.20
Vegetables (cups) 4.35 4.80 4.23 4.49 4.36Dark-green vegetables .51 .52 .51 .82 1.17Orange vegetables .34 .43 .47 .43 .34Starchy vegetables 1.03 1.54 1.20 1.20 1.03Other vegetables 1.96 1.71 1.46 1.46 1.32Legumes .51 .60 .60 .60 .51
Fruits (cups) 2.70 3.40 3.00 2.40 2.40Whole fruits 2.09 2.91 2.52 1.92 1.91
Milk products (cups) 3.60 3.60 3.60 3.60 3.60
Meat and beans (oz equivalents) 7.80 8.40 8.40 7.80 7.20
Oils (grams) 41.48 52.80 43.20 40.80 34.80
Females12-13 years 14-18 years 19-50 years 51-70 years 71+ years
Total energy (kcal) 2,627 2,627 2,653 2,653 2,171
Grains (oz equivalents) 8.40 8.40 8.40 8.40 7.20Whole grains 4.20 4.20 5.24 7.05 4.85
Vegetables (cups) 4.09 3.83 4.07 3.93 4.15Dark-green vegetables 1.00 .75 .67 .85 1.67Orange vegetables .34 .34 .67 .34 .34Starchy vegetables 1.03 1.03 1.03 1.03 .51Other vegetables 1.21 1.20 1.20 1.20 1.11Legumes .51 .51 .51 .51 .51
Fruits (cups) 2.83 2.40 2.40 2.40 1.80Whole fruits 2.34 1.92 1.92 1.94 1.32
Milk products (cups) 3.60 3.60 3.60 3.60 3.60
Meat and beans (oz equivalents) 7.20 7.20 7.20 7.20 6.29
Oils (grams) 34.80 34.80 34.80 34.80 28.80
Note: These numbers include an estimated 20-percent waste factor.
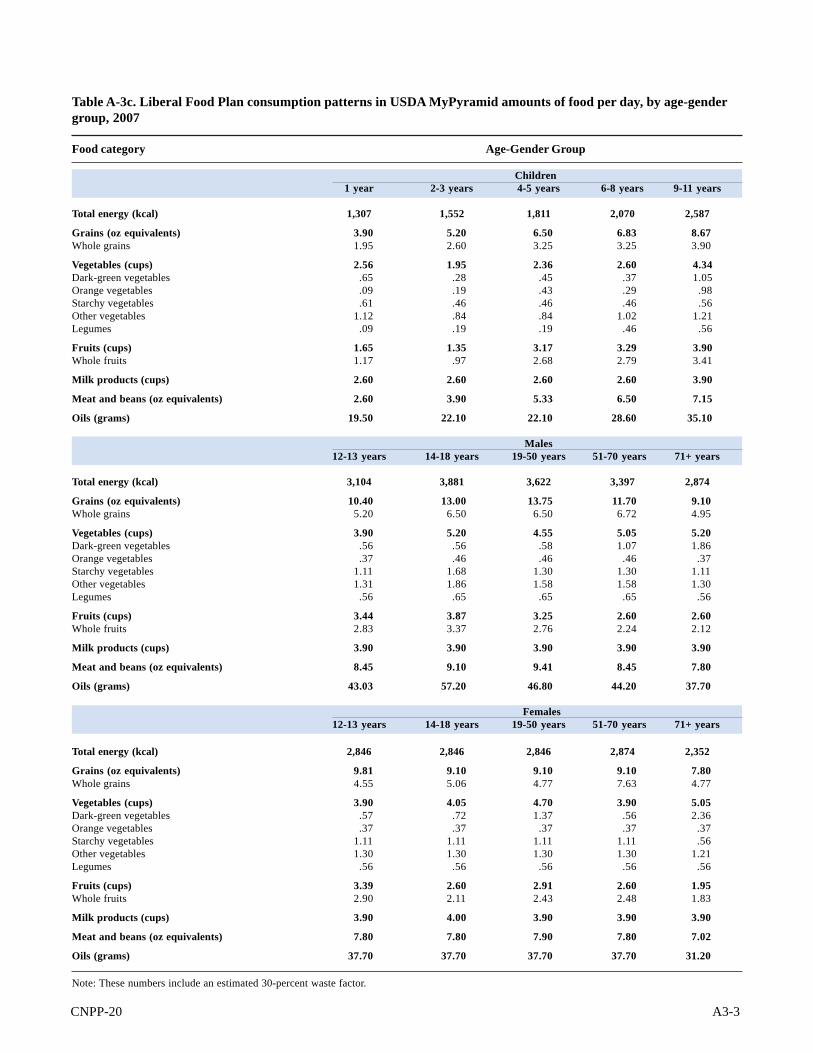
CNPP-20 A3-3
Table A-3c. Liberal Food Plan consumption patterns in USDA MyPyramid amounts of food per day, by age-gendergroup, 2007
Food category Age-Gender Group
Children1 year 2-3 years 4-5 years 6-8 years 9-11 years
Total energy (kcal) 1,307 1,552 1,811 2,070 2,587
Grains (oz equivalents) 3.90 5.20 6.50 6.83 8.67Whole grains 1.95 2.60 3.25 3.25 3.90
Vegetables (cups) 2.56 1.95 2.36 2.60 4.34Dark-green vegetables .65 .28 .45 .37 1.05Orange vegetables .09 .19 .43 .29 .98Starchy vegetables .61 .46 .46 .46 .56Other vegetables 1.12 .84 .84 1.02 1.21Legumes .09 .19 .19 .46 .56
Fruits (cups) 1.65 1.35 3.17 3.29 3.90Whole fruits 1.17 .97 2.68 2.79 3.41
Milk products (cups) 2.60 2.60 2.60 2.60 3.90
Meat and beans (oz equivalents) 2.60 3.90 5.33 6.50 7.15
Oils (grams) 19.50 22.10 22.10 28.60 35.10
Males12-13 years 14-18 years 19-50 years 51-70 years 71+ years
Total energy (kcal) 3,104 3,881 3,622 3,397 2,874
Grains (oz equivalents) 10.40 13.00 13.75 11.70 9.10Whole grains 5.20 6.50 6.50 6.72 4.95
Vegetables (cups) 3.90 5.20 4.55 5.05 5.20Dark-green vegetables .56 .56 .58 1.07 1.86Orange vegetables .37 .46 .46 .46 .37Starchy vegetables 1.11 1.68 1.30 1.30 1.11Other vegetables 1.31 1.86 1.58 1.58 1.30Legumes .56 .65 .65 .65 .56
Fruits (cups) 3.44 3.87 3.25 2.60 2.60Whole fruits 2.83 3.37 2.76 2.24 2.12
Milk products (cups) 3.90 3.90 3.90 3.90 3.90
Meat and beans (oz equivalents) 8.45 9.10 9.41 8.45 7.80
Oils (grams) 43.03 57.20 46.80 44.20 37.70
Females12-13 years 14-18 years 19-50 years 51-70 years 71+ years
Total energy (kcal) 2,846 2,846 2,846 2,874 2,352
Grains (oz equivalents) 9.81 9.10 9.10 9.10 7.80Whole grains 4.55 5.06 4.77 7.63 4.77
Vegetables (cups) 3.90 4.05 4.70 3.90 5.05Dark-green vegetables .57 .72 1.37 .56 2.36Orange vegetables .37 .37 .37 .37 .37Starchy vegetables 1.11 1.11 1.11 1.11 .56Other vegetables 1.30 1.30 1.30 1.30 1.21Legumes .56 .56 .56 .56 .56
Fruits (cups) 3.39 2.60 2.91 2.60 1.95Whole fruits 2.90 2.11 2.43 2.48 1.83
Milk products (cups) 3.90 4.00 3.90 3.90 3.90
Meat and beans (oz equivalents) 7.80 7.80 7.90 7.80 7.02
Oils (grams) 37.70 37.70 37.70 37.70 31.20
Note: These numbers include an estimated 30-percent waste factor.
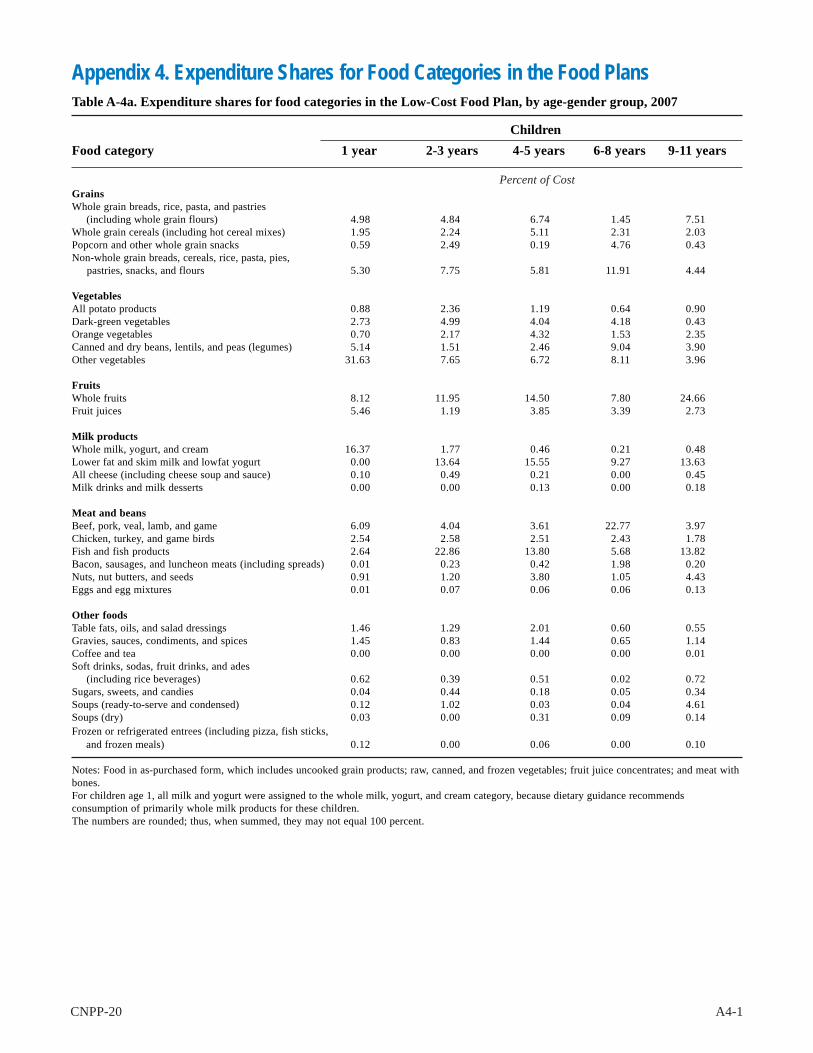
CNPP-20 A4-1
Table A-4a. Expenditure shares for food categories in the Low-Cost Food Plan, by age-gender group, 2007
ChildrenFood category 1 year 2-3 years 4-5 years 6-8 years 9-11 years
Percent of CostGrainsWhole grain breads, rice, pasta, and pastries (including whole grain flours) 4.98 4.84 6.74 1.45 7.51Whole grain cereals (including hot cereal mixes) 1.95 2.24 5.11 2.31 2.03Popcorn and other whole grain snacks 0.59 2.49 0.19 4.76 0.43Non-whole grain breads, cereals, rice, pasta, pies, pastries, snacks, and flours 5.30 7.75 5.81 11.91 4.44
VegetablesAll potato products 0.88 2.36 1.19 0.64 0.90Dark-green vegetables 2.73 4.99 4.04 4.18 0.43Orange vegetables 0.70 2.17 4.32 1.53 2.35Canned and dry beans, lentils, and peas (legumes) 5.14 1.51 2.46 9.04 3.90Other vegetables 31.63 7.65 6.72 8.11 3.96
FruitsWhole fruits 8.12 11.95 14.50 7.80 24.66Fruit juices 5.46 1.19 3.85 3.39 2.73
Milk productsWhole milk, yogurt, and cream 16.37 1.77 0.46 0.21 0.48Lower fat and skim milk and lowfat yogurt 0.00 13.64 15.55 9.27 13.63All cheese (including cheese soup and sauce) 0.10 0.49 0.21 0.00 0.45Milk drinks and milk desserts 0.00 0.00 0.13 0.00 0.18
Meat and beansBeef, pork, veal, lamb, and game 6.09 4.04 3.61 22.77 3.97Chicken, turkey, and game birds 2.54 2.58 2.51 2.43 1.78Fish and fish products 2.64 22.86 13.80 5.68 13.82Bacon, sausages, and luncheon meats (including spreads) 0.01 0.23 0.42 1.98 0.20Nuts, nut butters, and seeds 0.91 1.20 3.80 1.05 4.43Eggs and egg mixtures 0.01 0.07 0.06 0.06 0.13
Other foodsTable fats, oils, and salad dressings 1.46 1.29 2.01 0.60 0.55Gravies, sauces, condiments, and spices 1.45 0.83 1.44 0.65 1.14Coffee and tea 0.00 0.00 0.00 0.00 0.01Soft drinks, sodas, fruit drinks, and ades (including rice beverages) 0.62 0.39 0.51 0.02 0.72Sugars, sweets, and candies 0.04 0.44 0.18 0.05 0.34Soups (ready-to-serve and condensed) 0.12 1.02 0.03 0.04 4.61Soups (dry) 0.03 0.00 0.31 0.09 0.14Frozen or refrigerated entrees (including pizza, fish sticks, and frozen meals) 0.12 0.00 0.06 0.00 0.10
Notes: Food in as-purchased form, which includes uncooked grain products; raw, canned, and frozen vegetables; fruit juice concentrates; and meat withbones.For children age 1, all milk and yogurt were assigned to the whole milk, yogurt, and cream category, because dietary guidance recommendsconsumption of primarily whole milk products for these children.The numbers are rounded; thus, when summed, they may not equal 100 percent.
Appendix 4. Expenditure Shares for Food Categories in the Food Plans

A4-2 The Low-Cost, Moderate-Cost, and Liberal Food Plans, 2007
Table A-4a. Expenditure shares for food categories in the Low-Cost Food Plan, by age-gender group, 2007 (cont’d)
MalesFood category 12-13 years 14-18 years 19-50 years 51-70 years 71+ years
Percent of CostGrainsWhole grain breads, rice, pasta, and pastries (including whole grain flours) 5.80 10.90 3.23 7.96 2.36Whole grain cereals (including hot cereal mixes) 1.36 1.54 3.95 4.51 15.12Popcorn and other whole grain snacks 9.22 0.43 3.18 0.35 0.29Non-whole grain breads, cereals, rice, pasta, pies, pastries, snacks, and flours 6.22 4.98 4.74 4.93 2.55
VegetablesAll potato products 2.41 4.97 2.78 3.57 2.98Dark-green vegetables 2.50 1.81 4.20 4.72 3.47Orange vegetables 1.30 1.13 2.39 2.55 2.08Canned and dry beans, lentils, and peas (legumes) 3.83 5.84 5.46 3.79 4.45Other vegetables 7.18 9.83 9.09 9.32 7.08
FruitsWhole fruits 10.39 14.90 15.31 15.97 12.71Fruit juices 4.19 2.19 2.62 3.02 3.13
Milk productsWhole milk, yogurt, and cream 1.52 1.54 1.30 0.66 0.92Lower fat and skim milk and lowfat yogurt 10.43 7.96 8.92 10.79 13.53All cheese (including cheese soup and sauce) 0.77 1.70 2.47 0.95 1.78Milk drinks and milk desserts 1.68 0.67 0.84 0.63 0.42
Meat and beansBeef, pork, veal, lamb, and game 7.59 5.33 7.02 6.40 8.69Chicken, turkey, and game birds 1.97 3.13 4.86 3.50 3.73Fish and fish products 6.71 0.43 1.86 5.37 1.29Bacon, sausages, and luncheon meats (including spreads) 0.91 1.07 1.38 0.80 0.54Nuts, nut butters, and seeds 3.97 3.77 5.01 4.27 6.85Eggs and egg mixtures 0.16 0.23 0.38 0.26 0.39
Other foodsTable fats, oils, and salad dressings 1.25 1.13 1.74 0.96 1.46Gravies, sauces, condiments, and spices 0.82 2.68 1.12 0.70 0.58Coffee and tea 0.01 0.05 0.15 0.21 0.18Soft drinks, sodas, fruit drinks, and ades (including rice beverages) 3.53 8.32 4.23 2.03 1.09Sugars, sweets, and candies 1.18 2.50 0.91 0.49 0.42Soups (ready-to-serve and condensed) 2.37 0.72 0.36 1.05 1.69Soups (dry) 0.11 0.10 0.11 0.14 0.14Frozen or refrigerated entrees (including pizza, fish sticks, and frozen meals) 0.63 0.17 0.41 0.09 0.07
Notes: Food in as-purchased form, which includes uncooked grain products; raw, canned, and frozen vegetables; fruit juice concentrates; and meat withbones.The numbers are rounded; thus, when summed, they may not equal 100 percent.

CNPP-20 A4-3
Table A-4a. Expenditure shares for food categories in the Low-Cost Food Plan, by age-gender group, 2007 (cont’d)
FemalesFood category 12-13 years 14-18 years 19-50 years 51-70 years 71+ years
Percent of CostGrainsWhole grain breads, rice, pasta, and pastries (including whole grain flours) 8.63 8.39 6.03 11.64 6.91Whole grain cereals (including hot cereal mixes) 1.66 0.83 1.74 0.88 4.07Popcorn and other whole grain snacks 0.24 0.33 0.25 0.18 0.00Non-whole grain breads, cereals, rice, pasta, pies pastries, snacks, and flours 4.59 6.47 4.17 2.88 4.25
VegetablesAll potato products 4.85 2.82 2.53 3.64 1.17Dark-green vegetables 4.40 5.05 4.95 4.02 5.84Orange vegetables 2.30 1.86 2.11 2.26 2.65Canned and dry beans, lentils, and peas (legumes) 6.36 8.47 4.87 4.80 3.43Other vegetables 5.76 11.49 8.80 9.40 7.95
FruitsWhole fruits 17.33 13.67 17.99 14.26 11.53Fruit juices 1.66 2.97 2.56 2.85 3.88
Milk productsWhole milk, yogurt, and cream 1.66 1.01 1.34 1.75 1.23Lower fat and skim milk and lowfat yogurt 10.43 11.80 11.04 12.86 16.53All cheese (including cheese soup and sauce) 1.12 1.01 1.80 0.48 0.42Milk drinks and milk desserts 0.96 0.70 1.09 0.83 0.52
Meat and beansBeef, pork, veal, lamb, and game 3.78 5.81 7.59 5.69 8.58Chicken, turkey, and game birds 3.27 3.04 3.99 4.92 4.86Fish and fish products 8.83 2.51 2.52 5.34 0.87Bacon, sausages, and luncheon meats (including spreads) 0.75 0.48 0.93 0.05 0.22Nuts, nut butters, and seeds 4.67 4.35 5.92 5.95 9.72Eggs and egg mixtures 0.20 0.33 0.60 0.31 0.24
Other foodsTable fats, oils, and salad dressings 0.75 0.92 0.71 0.48 0.75Gravies, sauces, condiments, and spices 0.44 0.84 0.57 0.64 0.48Coffee and tea 0.05 0.15 0.16 0.11 0.50Soft drinks, sodas, fruit drinks, and ades (including rice beverages) 2.76 3.33 4.15 1.95 1.14Sugars, sweets, and candies 1.63 1.08 1.05 1.32 0.53Soups (ready-to-serve and condensed) 0.02 0.05 0.20 0.44 1.32Soups (dry) 0.84 0.13 0.14 0.04 0.31Frozen or refrigerated entrees (including pizza, fish sticks, and frozen meals) 0.08 0.11 0.18 0.02 0.10
Notes: Food in as-purchased form, which includes uncooked grain products; raw, canned, and frozen vegetables; fruit juice concentrates; and meat withbones.The numbers are rounded; thus, when summed, they may not equal 100 percent.
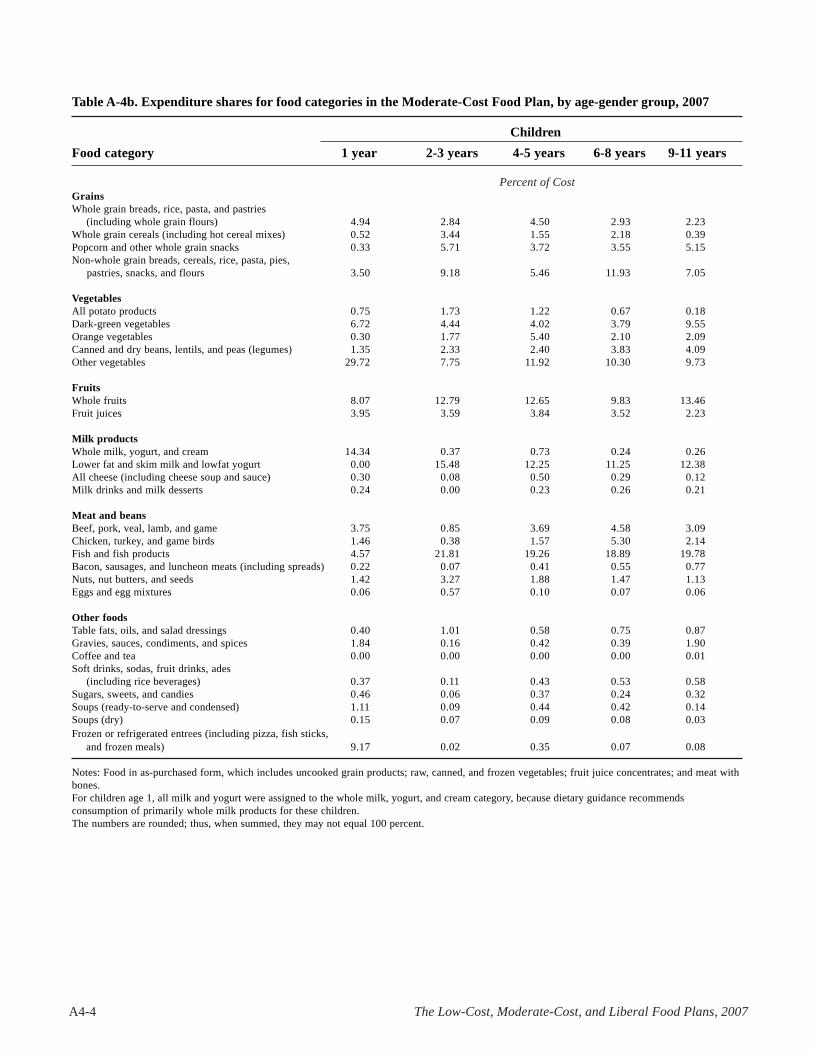
A4-4 The Low-Cost, Moderate-Cost, and Liberal Food Plans, 2007
Table A-4b. Expenditure shares for food categories in the Moderate-Cost Food Plan, by age-gender group, 2007
ChildrenFood category 1 year 2-3 years 4-5 years 6-8 years 9-11 years
Percent of CostGrainsWhole grain breads, rice, pasta, and pastries (including whole grain flours) 4.94 2.84 4.50 2.93 2.23Whole grain cereals (including hot cereal mixes) 0.52 3.44 1.55 2.18 0.39Popcorn and other whole grain snacks 0.33 5.71 3.72 3.55 5.15Non-whole grain breads, cereals, rice, pasta, pies, pastries, snacks, and flours 3.50 9.18 5.46 11.93 7.05
VegetablesAll potato products 0.75 1.73 1.22 0.67 0.18Dark-green vegetables 6.72 4.44 4.02 3.79 9.55Orange vegetables 0.30 1.77 5.40 2.10 2.09Canned and dry beans, lentils, and peas (legumes) 1.35 2.33 2.40 3.83 4.09Other vegetables 29.72 7.75 11.92 10.30 9.73
FruitsWhole fruits 8.07 12.79 12.65 9.83 13.46Fruit juices 3.95 3.59 3.84 3.52 2.23
Milk productsWhole milk, yogurt, and cream 14.34 0.37 0.73 0.24 0.26Lower fat and skim milk and lowfat yogurt 0.00 15.48 12.25 11.25 12.38All cheese (including cheese soup and sauce) 0.30 0.08 0.50 0.29 0.12Milk drinks and milk desserts 0.24 0.00 0.23 0.26 0.21
Meat and beansBeef, pork, veal, lamb, and game 3.75 0.85 3.69 4.58 3.09Chicken, turkey, and game birds 1.46 0.38 1.57 5.30 2.14Fish and fish products 4.57 21.81 19.26 18.89 19.78Bacon, sausages, and luncheon meats (including spreads) 0.22 0.07 0.41 0.55 0.77Nuts, nut butters, and seeds 1.42 3.27 1.88 1.47 1.13Eggs and egg mixtures 0.06 0.57 0.10 0.07 0.06
Other foodsTable fats, oils, and salad dressings 0.40 1.01 0.58 0.75 0.87Gravies, sauces, condiments, and spices 1.84 0.16 0.42 0.39 1.90Coffee and tea 0.00 0.00 0.00 0.00 0.01Soft drinks, sodas, fruit drinks, ades (including rice beverages) 0.37 0.11 0.43 0.53 0.58Sugars, sweets, and candies 0.46 0.06 0.37 0.24 0.32Soups (ready-to-serve and condensed) 1.11 0.09 0.44 0.42 0.14Soups (dry) 0.15 0.07 0.09 0.08 0.03Frozen or refrigerated entrees (including pizza, fish sticks, and frozen meals) 9.17 0.02 0.35 0.07 0.08
Notes: Food in as-purchased form, which includes uncooked grain products; raw, canned, and frozen vegetables; fruit juice concentrates; and meat withbones.For children age 1, all milk and yogurt were assigned to the whole milk, yogurt, and cream category, because dietary guidance recommendsconsumption of primarily whole milk products for these children.The numbers are rounded; thus, when summed, they may not equal 100 percent.

CNPP-20 A4-5
Table A-4b. Expenditure shares for food categories in the Moderate-Cost Food Plan, by age-gender group, 2007(cont’d)
MalesFood category 12-13 years 14-18 years 19-50 years 51-70 years 71+ years
Percent of CostGrainsWhole grain breads, rice, pasta, and pastries (including whole grain flours) 1.23 6.09 10.99 5.20 2.51Whole grain cereals (including hot cereal mixes) 0.16 0.53 0.63 0.97 10.17Popcorn and other whole grain snacks 15.24 5.32 1.17 4.84 1.96Non-whole grain breads, cereals, rice, pasta, pies, pastries, snacks, and flours 7.92 7.67 8.61 4.71 4.18
VegetablesAll potato products 1.88 4.16 1.97 2.88 2.20Dark-green vegetables 1.73 3.35 3.37 3.76 11.31Orange vegetables 2.65 2.03 2.12 1.90 1.75Canned and dry beans, lentils, and peas (legumes) 6.08 11.91 7.96 3.85 3.92Other vegetables 7.62 6.66 8.53 8.70 9.93
FruitsWhole fruits 12.41 12.73 12.69 10.91 12.48Fruit juices 2.84 2.14 2.25 2.53 2.52
Milk productsWhole milk, yogurt, and cream 0.39 0.38 0.49 0.47 0.48Lower fat and skim milk and lowfat yogurt 11.63 8.77 10.57 11.64 10.31All cheese (including cheese soup and sauce) 0.64 0.79 0.93 0.47 0.96Milk drinks and milk desserts 0.27 0.49 0.36 0.51 0.78
Meat and beansBeef, pork, veal, lamb, and game 6.41 5.42 6.25 7.76 6.32Chicken, turkey, and game birds 1.60 6.97 10.13 16.74 8.98Fish and fish products 10.24 7.76 2.50 5.27 1.68Bacon, sausages, and luncheon meats (including spreads) 0.30 0.80 0.76 0.75 0.63Nuts, nut butters, and seeds 5.00 1.38 1.84 2.19 3.92Eggs and egg mixtures 0.16 0.19 0.28 0.35 0.20
Other foodsTable fats, oils, and salad dressings 0.93 0.98 1.15 0.60 0.87Gravies, sauces, condiments, and spices 0.85 0.42 1.20 0.48 0.48Coffee and tea 0.05 0.02 0.15 0.07 0.04Soft drinks, sodas, fruit drinks, and ades (including rice beverages) 1.12 1.64 1.95 1.23 0.54Sugars, sweets, and candies 0.45 0.52 0.48 0.41 0.20Soups (ready-to-serve and condensed) 0.00 0.62 0.39 0.40 0.64Soups (dry) 0.02 0.10 0.03 0.35 0.06Frozen or refrigerated entrees (including pizza, fish sticks, and frozen meals) 0.19 0.15 0.23 0.04 0.01
Notes: Food in as-purchased form, which includes uncooked grain products; raw, canned, and frozen vegetables; fruit juice concentrates; and meat withbones.The numbers are rounded; thus, when summed, they may not equal 100 percent.
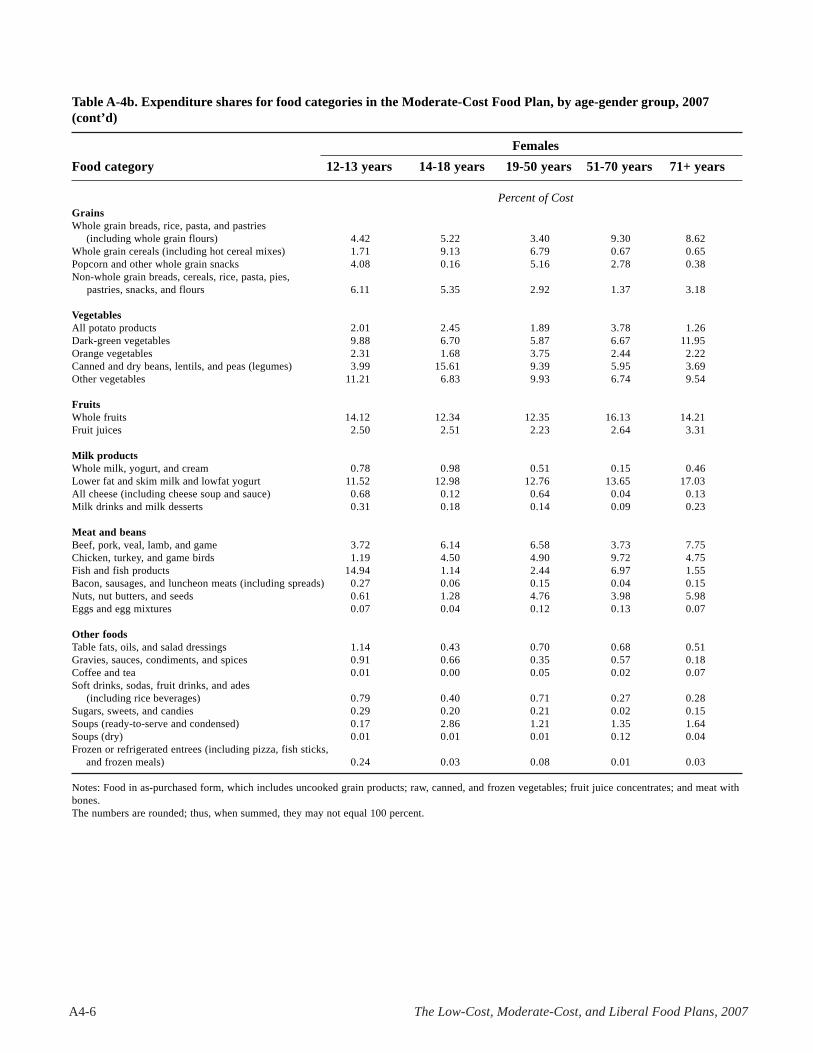
A4-6 The Low-Cost, Moderate-Cost, and Liberal Food Plans, 2007
Table A-4b. Expenditure shares for food categories in the Moderate-Cost Food Plan, by age-gender group, 2007(cont’d)
FemalesFood category 12-13 years 14-18 years 19-50 years 51-70 years 71+ years
Percent of CostGrainsWhole grain breads, rice, pasta, and pastries (including whole grain flours) 4.42 5.22 3.40 9.30 8.62Whole grain cereals (including hot cereal mixes) 1.71 9.13 6.79 0.67 0.65Popcorn and other whole grain snacks 4.08 0.16 5.16 2.78 0.38Non-whole grain breads, cereals, rice, pasta, pies, pastries, snacks, and flours 6.11 5.35 2.92 1.37 3.18
VegetablesAll potato products 2.01 2.45 1.89 3.78 1.26Dark-green vegetables 9.88 6.70 5.87 6.67 11.95Orange vegetables 2.31 1.68 3.75 2.44 2.22Canned and dry beans, lentils, and peas (legumes) 3.99 15.61 9.39 5.95 3.69Other vegetables 11.21 6.83 9.93 6.74 9.54
FruitsWhole fruits 14.12 12.34 12.35 16.13 14.21Fruit juices 2.50 2.51 2.23 2.64 3.31
Milk productsWhole milk, yogurt, and cream 0.78 0.98 0.51 0.15 0.46Lower fat and skim milk and lowfat yogurt 11.52 12.98 12.76 13.65 17.03All cheese (including cheese soup and sauce) 0.68 0.12 0.64 0.04 0.13Milk drinks and milk desserts 0.31 0.18 0.14 0.09 0.23
Meat and beansBeef, pork, veal, lamb, and game 3.72 6.14 6.58 3.73 7.75Chicken, turkey, and game birds 1.19 4.50 4.90 9.72 4.75Fish and fish products 14.94 1.14 2.44 6.97 1.55Bacon, sausages, and luncheon meats (including spreads) 0.27 0.06 0.15 0.04 0.15Nuts, nut butters, and seeds 0.61 1.28 4.76 3.98 5.98Eggs and egg mixtures 0.07 0.04 0.12 0.13 0.07
Other foodsTable fats, oils, and salad dressings 1.14 0.43 0.70 0.68 0.51Gravies, sauces, condiments, and spices 0.91 0.66 0.35 0.57 0.18Coffee and tea 0.01 0.00 0.05 0.02 0.07Soft drinks, sodas, fruit drinks, and ades (including rice beverages) 0.79 0.40 0.71 0.27 0.28Sugars, sweets, and candies 0.29 0.20 0.21 0.02 0.15Soups (ready-to-serve and condensed) 0.17 2.86 1.21 1.35 1.64Soups (dry) 0.01 0.01 0.01 0.12 0.04Frozen or refrigerated entrees (including pizza, fish sticks, and frozen meals) 0.24 0.03 0.08 0.01 0.03
Notes: Food in as-purchased form, which includes uncooked grain products; raw, canned, and frozen vegetables; fruit juice concentrates; and meat withbones.The numbers are rounded; thus, when summed, they may not equal 100 percent.

CNPP-20 A4-7
Table A-4c. Expenditure shares for food categories in the Liberal Food Plan, by age-gender group, 2007
ChildrenFood category 1 year 2-3 years 4-5 years 6-8 years 9-11 years
Percent of CostGrainsWhole grain breads, rice, pasta, and pastries (including whole grain flours) 0.00 0.04 5.07 2.41 3.37Whole grain cereals (including hot cereal mixes) 3.72 1.17 1.07 0.50 0.37Popcorn and other whole grain snacks 0.00 5.61 1.90 3.67 2.86Non-whole grain breads, cereals, rice, pasta, pies pastries, snacks, and flours 4.59 7.25 5.82 6.58 6.91
VegetablesAll potato products 2.38 2.29 1.09 0.85 1.95Dark-green vegetables 6.51 2.60 2.22 2.00 7.55Orange vegetables 0.41 1.74 3.34 1.45 4.97Canned and dry beans, lentils, and peas (legumes) 3.71 6.15 5.78 6.45 3.44Other vegetables 18.30 11.46 5.05 6.82 8.80
FruitsWhole fruits 21.09 9.69 25.25 22.25 18.68Fruit juices 4.47 3.08 3.29 2.50 2.30
Milk productsWhole milk, yogurt, and cream 16.35 0.64 0.34 0.24 0.27Lower fat and skim milk and lowfat yogurt 0.00 18.44 11.66 8.98 9.76All cheese (including cheese soup and sauce) 0.14 0.44 0.40 0.22 0.33Milk drinks and milk desserts 0.41 0.19 0.46 0.39 0.29
Meat and beansBeef, pork, veal, lamb, and game 3.54 1.21 3.06 3.93 4.27Chicken, turkey, and game birds 0.85 0.62 1.58 2.34 1.54Fish and fish products 6.89 19.44 17.39 22.34 15.31Bacon, sausages, and luncheon meats (including spreads) 0.10 0.87 0.27 0.60 1.44Nuts, nut butters, and seeds 2.44 1.49 1.84 2.26 2.75Eggs and egg mixtures 0.03 0.42 0.06 0.02 0.07
Other foodsTable fats, oils, and salad dressings 0.81 1.96 0.67 0.72 0.60Gravies, sauces, condiments, and spices 1.45 1.55 1.17 0.95 0.45Coffee and tea 0.00 0.00 0.00 0.00 0.00Soft drinks, sodas, fruit drinks, and ades (including rice beverages) 0.40 0.66 0.47 0.59 0.98Sugars, sweets, and candies 1.14 0.72 0.19 0.31 0.41Soups (ready-to-serve and condensed) 0.06 0.02 0.20 0.45 0.17Soups (dry) 0.18 0.06 0.18 0.06 0.06Frozen or refrigerated entrees (including pizza, fish sticks, and frozen meals) 0.02 0.19 0.19 0.13 0.11
Notes: Food in as-purchased form, which includes uncooked grain products; raw, canned, and frozen vegetables; fruit juice concentrates; and meat withbones.For children age 1, all milk and yogurt were assigned to the whole milk, yogurt, and cream category, because dietary guidance recommendsconsumption of primarily whole milk products for these children.The numbers are rounded; thus, when summed, they may not equal 100 percent.
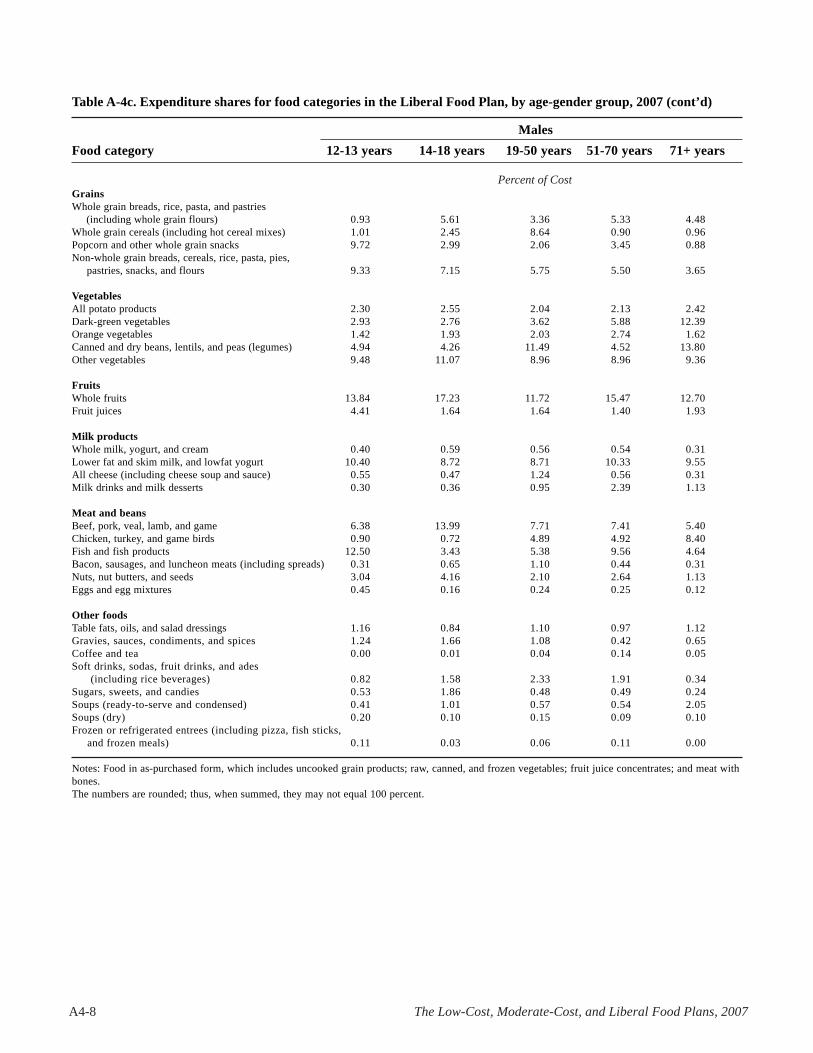
A4-8 The Low-Cost, Moderate-Cost, and Liberal Food Plans, 2007
Table A-4c. Expenditure shares for food categories in the Liberal Food Plan, by age-gender group, 2007 (cont’d)
MalesFood category 12-13 years 14-18 years 19-50 years 51-70 years 71+ years
Percent of CostGrainsWhole grain breads, rice, pasta, and pastries (including whole grain flours) 0.93 5.61 3.36 5.33 4.48Whole grain cereals (including hot cereal mixes) 1.01 2.45 8.64 0.90 0.96Popcorn and other whole grain snacks 9.72 2.99 2.06 3.45 0.88Non-whole grain breads, cereals, rice, pasta, pies, pastries, snacks, and flours 9.33 7.15 5.75 5.50 3.65
VegetablesAll potato products 2.30 2.55 2.04 2.13 2.42Dark-green vegetables 2.93 2.76 3.62 5.88 12.39Orange vegetables 1.42 1.93 2.03 2.74 1.62Canned and dry beans, lentils, and peas (legumes) 4.94 4.26 11.49 4.52 13.80Other vegetables 9.48 11.07 8.96 8.96 9.36
FruitsWhole fruits 13.84 17.23 11.72 15.47 12.70Fruit juices 4.41 1.64 1.64 1.40 1.93
Milk productsWhole milk, yogurt, and cream 0.40 0.59 0.56 0.54 0.31Lower fat and skim milk, and lowfat yogurt 10.40 8.72 8.71 10.33 9.55All cheese (including cheese soup and sauce) 0.55 0.47 1.24 0.56 0.31Milk drinks and milk desserts 0.30 0.36 0.95 2.39 1.13
Meat and beansBeef, pork, veal, lamb, and game 6.38 13.99 7.71 7.41 5.40Chicken, turkey, and game birds 0.90 0.72 4.89 4.92 8.40Fish and fish products 12.50 3.43 5.38 9.56 4.64Bacon, sausages, and luncheon meats (including spreads) 0.31 0.65 1.10 0.44 0.31Nuts, nut butters, and seeds 3.04 4.16 2.10 2.64 1.13Eggs and egg mixtures 0.45 0.16 0.24 0.25 0.12
Other foodsTable fats, oils, and salad dressings 1.16 0.84 1.10 0.97 1.12Gravies, sauces, condiments, and spices 1.24 1.66 1.08 0.42 0.65Coffee and tea 0.00 0.01 0.04 0.14 0.05Soft drinks, sodas, fruit drinks, and ades (including rice beverages) 0.82 1.58 2.33 1.91 0.34Sugars, sweets, and candies 0.53 1.86 0.48 0.49 0.24Soups (ready-to-serve and condensed) 0.41 1.01 0.57 0.54 2.05Soups (dry) 0.20 0.10 0.15 0.09 0.10Frozen or refrigerated entrees (including pizza, fish sticks, and frozen meals) 0.11 0.03 0.06 0.11 0.00
Notes: Food in as-purchased form, which includes uncooked grain products; raw, canned, and frozen vegetables; fruit juice concentrates; and meat withbones.The numbers are rounded; thus, when summed, they may not equal 100 percent.
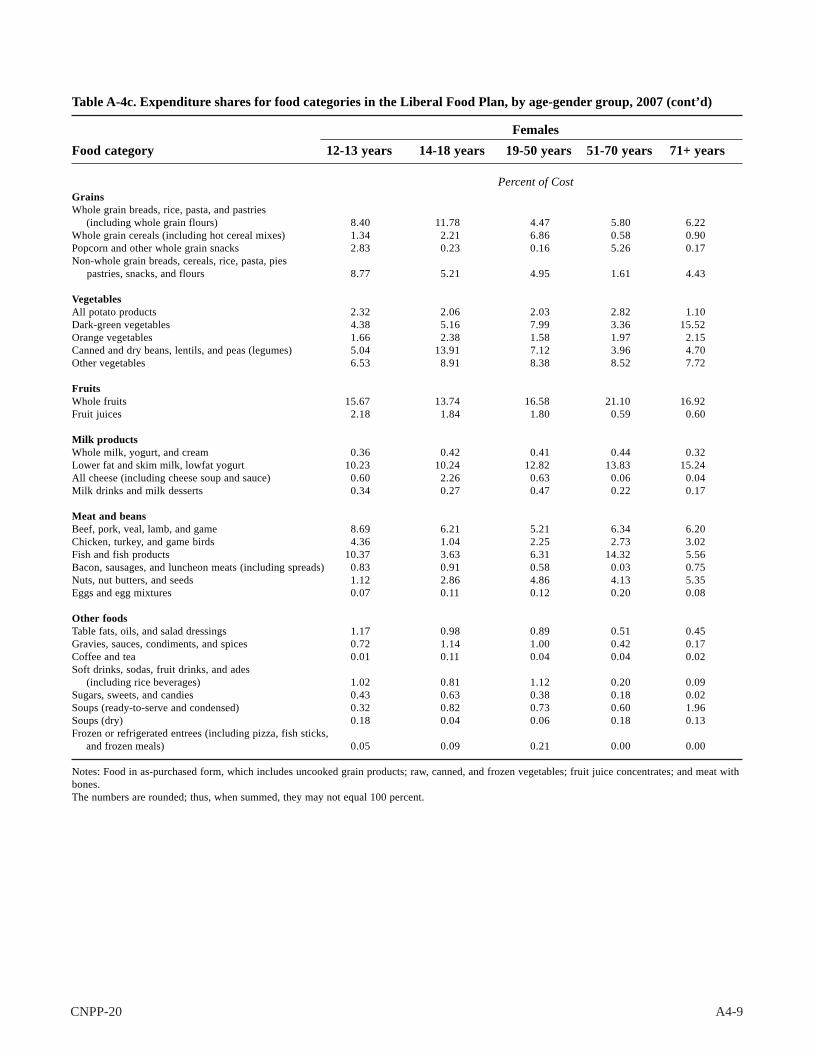
CNPP-20 A4-9
Table A-4c. Expenditure shares for food categories in the Liberal Food Plan, by age-gender group, 2007 (cont’d)
FemalesFood category 12-13 years 14-18 years 19-50 years 51-70 years 71+ years
Percent of CostGrainsWhole grain breads, rice, pasta, and pastries (including whole grain flours) 8.40 11.78 4.47 5.80 6.22Whole grain cereals (including hot cereal mixes) 1.34 2.21 6.86 0.58 0.90Popcorn and other whole grain snacks 2.83 0.23 0.16 5.26 0.17Non-whole grain breads, cereals, rice, pasta, pies pastries, snacks, and flours 8.77 5.21 4.95 1.61 4.43
VegetablesAll potato products 2.32 2.06 2.03 2.82 1.10Dark-green vegetables 4.38 5.16 7.99 3.36 15.52Orange vegetables 1.66 2.38 1.58 1.97 2.15Canned and dry beans, lentils, and peas (legumes) 5.04 13.91 7.12 3.96 4.70Other vegetables 6.53 8.91 8.38 8.52 7.72
FruitsWhole fruits 15.67 13.74 16.58 21.10 16.92Fruit juices 2.18 1.84 1.80 0.59 0.60
Milk productsWhole milk, yogurt, and cream 0.36 0.42 0.41 0.44 0.32Lower fat and skim milk, lowfat yogurt 10.23 10.24 12.82 13.83 15.24All cheese (including cheese soup and sauce) 0.60 2.26 0.63 0.06 0.04Milk drinks and milk desserts 0.34 0.27 0.47 0.22 0.17
Meat and beansBeef, pork, veal, lamb, and game 8.69 6.21 5.21 6.34 6.20Chicken, turkey, and game birds 4.36 1.04 2.25 2.73 3.02Fish and fish products 10.37 3.63 6.31 14.32 5.56Bacon, sausages, and luncheon meats (including spreads) 0.83 0.91 0.58 0.03 0.75Nuts, nut butters, and seeds 1.12 2.86 4.86 4.13 5.35Eggs and egg mixtures 0.07 0.11 0.12 0.20 0.08
Other foodsTable fats, oils, and salad dressings 1.17 0.98 0.89 0.51 0.45Gravies, sauces, condiments, and spices 0.72 1.14 1.00 0.42 0.17Coffee and tea 0.01 0.11 0.04 0.04 0.02Soft drinks, sodas, fruit drinks, and ades (including rice beverages) 1.02 0.81 1.12 0.20 0.09Sugars, sweets, and candies 0.43 0.63 0.38 0.18 0.02Soups (ready-to-serve and condensed) 0.32 0.82 0.73 0.60 1.96Soups (dry) 0.18 0.04 0.06 0.18 0.13Frozen or refrigerated entrees (including pizza, fish sticks, and frozen meals) 0.05 0.09 0.21 0.00 0.00
Notes: Food in as-purchased form, which includes uncooked grain products; raw, canned, and frozen vegetables; fruit juice concentrates; and meat withbones.The numbers are rounded; thus, when summed, they may not equal 100 percent.

www.cnpp.usda.gov