DEPARTMENT OF AGRICULTURE - gov.za
204
Annual report Annual report 2005/06 2005/06 DEPARTMENT OF AGRICULTURE
Transcript of DEPARTMENT OF AGRICULTURE - gov.za

Annual reportAnnual report2005/062005/06
DEPARTMENT OF AGRICULTURE

2006
Published by Department of Agriculture
Design and layout by Directorate Agricultural Information Services
Obtainable from Resource Centre Directorate Agricultural Information Services Private Bag X144 Pretoria 0001
Printed in the Republic of South Africa by Government Printer, Pretoria
ISBN 0-621-36747-8
RP 156/2006

Foreword by the Minister
In his State of the Nation Address in 2006, President Thabo Mbeki emphasised the importance of the Age of Hopethat our nation and country is now entering. This Age of Hope extends to all farmers and farmer organisations, eproducers, workers, consumers, land owners and landless communities, by highlighting our promises of addressing skewed land ownership patterns and ensuring safe and sustainable food production. During the past two years the Department of Agriculture has shifted its emphasis to a greater focus on improving service delivery infrastructure, increasing our capacities and speeding up the pace of delivery in pursuit of our vision of “a united and prosperous agricultural sector” as set out in 2001 in The strategic plan for South African agriculture.
There is reason for the agricultural sector to celebrate the Age of Hope. One of the highlights of the past year was the Summit on Land and Agrarian Reform held in Johannesburg in July 2005. The message of hope was expressed by the delegates at the summit in proclaiming that “genuine progress gives us hope for the future”. The hope of mil-lions of our rural people for the future growth of the rural economy, agrarian reform and poverty eradication in agri-culture is a complex tapestry of economic, social and cultural factors, which continues to direct the actions of this
Ms Thoko Didiza (MP)
MINISTER FOR AGRICULTURE AND LAND AFFAIRS

department. Progress over the past decade in providing access to agricultural land was reviewed and dialogue encouraged among key partners and stakeholders on the best way to accelerate access to land. The call to improve support services to newly settled farmers posed a great challenge to the department to improve support services in order to contribute to the broader goals of job creation and poverty reduction.
Signifi cant progress has been made in the implementation of the Comprehensive Agricultural Support Programme (CASP), launched in 2004. Since then an amount of R450 million has been allocated to CASP, facilitating, inter alia, the establishment of 12 co-operatives in three rural development nodes. The further implementation of CASP still remains a major challenge to our strategy to promote agricultural production among previously disadvantaged indi-viduals and communities. Post-settlement support is of vital importance in the improvement of the production ca-pacity of emerging farmers.
To improve access to fi nance, the department worked together with the fi nancial sector in launching the Micro-ag-ricultural Financial Institutions of South Africa (Mafi sa) in May 2005. The scheme is administered by the Land Bank and provides micro and retail agricultural fi nancial services to economically active, poor rural households, small farmers and agribusinesses. An amount of R1 billion over a fi ve-year period was made available and approximately 10 million potential benefi ciaries will be able to apply for fi nancial services.
The plight of the food insecure has never been more important than it is today. It has been recognised that a more integrated approach should be followed and in response, the Integrated Food Security and Nutrition Strategy was developed and endorsed by Cabinet as a priority Social Cluster programme. Agricultural development becomes critical in providing vulnerable communities with the hope for a better life, free from poverty, hunger and unemploy-ment. This will be achieved through the implementation of the Household Food Production Programme (HFPP).
The Food Insecurity and Vulnerability Information Mapping System (FIVIMS) was fi nalised and piloted in the Sekhu-khune nodal point in Limpopo Province. The programme deals with vulnerable groups, household food security and post settlement support. It was introduced to the public at the World Food Day celebrations in Kimberley during October 2005.
Finalising the Agricultural Broad-based Black Economic Empowerment (AgriBEE) framework and Charter in 2005 was a major challenge for the department. Following a broad, inclusive and transparent consultation process, it culminated in a national AgriBEE indaba in Midrand during December 2005. The indaba marked a key achievement in our quest to comply with the Broad-Based Black Economic Empowerment Act, Act No. 53 of 2003. The AgriBEE Charter and Scorecard were fi nalised and upon the signing of the Agricultural Sector Charter all initiatives will be-come fully operational and proposed AgriBEE systems will be implemented.
The national LandCare Programme was rolled out to all provinces. A total amount of R40 million was allocated to the programme. Of 89 projects that were approved, 45 are in the nodal areas and benefi ted 53 206 people. The agritourism project, an extension of the LandCare Programme, was launched in Pretoria during December 2005. Altogether 56 agritourism projects have been identifi ed and will be implemented in 21 nodal areas. These projects will be extended with support from the Independent Development Trust, creating approximately 2 500 jobs.
The department applied rigorous sanitary and phytosanitary measures to ensure that the agricultural industry makes inroads into new and existing international markets. To this end, South Africa managed to increase citrus exports to Japan, utilising market opportunities created by the citrus crop failure in the USA. We also managed to obtain an export permit for exporting citrus to Iran. We will continue to engage with trade partners to address concerns and promote sound agricultural trade export.
Outbreaks of avian infl uenza and Classical Swine fever were contained successfully. South Africa was then de-clared free from avian infl uenza. We also managed to curb the outbreak of Classical Swine fever. These outbreaks were swiftly and effectively contained, largely because of the high level of co-operation and quick action taken by the department, provincial departments of agriculture and stakeholders in the areas affected.
However, the country has to remain alert in order to prevent further outbreaks of the disease. We are also prepared to offer diplomatic and technical assistance to other African states in combating the scourge of the avian infl uenza virus.
Critical factors for the effective growth and transformation of the agricultural sector are skills development and the broadening of access to agricultural education and training at all levels. The inadequacies in the current education system were addressed by means of the development of the Agricultural Education and Training (AET) Strategy by

the department and its partners to restructure and reorient the system and meet the education needs of small-scale and emerging farmers. The strategy was launched in September 2005 after extensive consultation with various stakeholders within and outside the agricultural sector.
As a catalyst and foundation for economic development, land and agrarian reform is well positioned to contribute towards the Accelerated and Shared Growth Initiative of South Africa (ASGISA). The sector can make a meaningful and substantive impact on the eradication of poverty and advancement of economic growth to improve the quality of life of all South Africans, particularly those in rural areas. During 2006, departmental programmes will be aligned with the broader aspirations of ASGISA.
It is clear that we cannot achieve the gains we pursue in the agricultural sector without galvanising our resources to address the organisation and capacity of the department, while strengthening the partnerships we have established through the process of developing The strategic plan for South African agriculture of November 2001.e Within the agricultural sector, this shared growth will continue to be guided by the sector plan’s strategic imperatives of in-creasing productivity and competitiveness, increasing employment, addressing poverty and ensuring sustainability. All these imperatives are in line with the Millennium Development Goals of the United Nations.
I would like to extend my sincere thanks to all people within the agricultural sector, as well as to our partners, for their efforts and commitment in realising the potential of the sector to ensure a safe, sustainable and prosperous agrar-ian future for all South Africa’s citizens.
MINISTER FOR AGRICULTURE AND LAND AFFAIRS


The Honourable MinisterFORFOR
Agriculture and Land Affairs
Ms Thoko Didiza
Dear Minister
I have the pleasure of presenting the annual report of the Department of Agriculture for the period 1 April 2005 to 31 March 2006.
Mr Masiphula Mbongwa
DIRECTOR-GENERAL: DEPARTMENT OF AGRICULTURE


Contents
Acronyms and Acts
PART 1: General information .................................................................................................................... 1
PART 2: Programme performance ............................................................................................................ 17
Administration
– Administration and Governance
– Financial Management
Farmer Support and Development
Agricultural Trade and Business Development
Economic Research and Analysis
Agricultural Production
Sustainable Resources Management and Use
National Regulatory Services
Communication and Information Management
Programme Planning, Monitoring and Evaluation
PART 3: Report of the Audit Committee .................................................................................................. 65
PART 4: Annual fi nancial statements ....................................................................................................... 67
PART 5: Human resources management ................................................................................................. 163


AADP African Agricultural Development ProgrammeABET Adult Basic Education and TrainingADA Agricultural Debt AccountADMA Agricultural Debt Management ActAET Agricultural Education and TrainingAGIS Agricultural Geo-referenced Information
SystemAgriBEE Agricultural Broad-based Black Economic
EmpowermentAgriSETA Agricultural Sector Education and Training
AuthorityAH Animal HealthAI avian infl uenzaAPHIS Animal and Plant Health Inspection ServicesARC Agricultural Research CouncilARC AII ARC-Animal Improvement InstituteARC GCI ARC-Grain Crops InstituteARC ISCW ARC-Institute for Soil, Climate and WaterASGISA Accelerated and Shared Growth Initiative of
South AfricaASRDC Agriculture and Sustainable Rural
Development Committee ATF Agricultural Trade ForumAusAID Australian Aid for DevelopmentBEE Black Economic EmpowermentBSE bovine spongiform encephalopathy CAADP Comprehensive African Agricultural
Development PlanCABI Commonwealth Agricultural Bureau
InternationalCASP Comprehensive Agricultural Support
ProgrammeCMA Catchment Management AgencyCPAC Central Primary Agricultural Co-operativeCSF Classical Swine feverDBSA Development Bank of Southern AfricaDEXCO Departmental Executive CommitteeDG Director-GeneralDITC Departmental Information Technology
CommitteeD: LUSM Directorate Land Use and Soil ManagementDoA Department of AgricultureDORA Division of Revenue Act dti Department of Trade and IndustryDWAF Department of Water Affairs and ForestryEPWP Expanded Public Works ProgrammeEU European UnionFAO Food and Agriculture Organization FANR Food, Agriculture and Natural Re sourcesFARA Forum for Agricultural Research in AfricaFET Further Education and TrainingFICOSA Financial Co-operatives of South AfricaFINREC Financial Record System for Farms and
Enterprises
FIVIMS Food Insecurity and Vulnerability InformationMapping System
FMD foot-and-mouth diseaseFNB First National BankFoodBEV Food and Beverages FSQA Food Safety and Quality AssuranceFTA free trade agreementGADI Grootfontein Agricultural Development
InstituteGCIS Government Communication and Information
SystemGDP Gross Domestic ProductGMO genetically modifi ed organismGOPC Governance and Operational Policy
CommitteeGR Genetic ResourcesHET Higher Education and TrainingHFPP Household Food Production ProgrammeHFSP Household Food Security ProgrammeHOA home owner’s allowanceICT information and communication technologyIDP Integrated Development PlanIFSNP Integrated Food Security and Nutrition
ProgrammeILRI International Livestock Research InstituteINTERGIS Integrated Registration and Genetic
Information SystemIPGRI International Plant Genetic Resources
InstituteIPR intellectual property right ISPM international standards for phytosanitary
measuresISRDP Integrated Sustainable Rural Development
ProgrammeIT information technologyITCA Intergovernmental Technical Committee for
AgricultureJMC Joint Ministerial CommitteeJWG Joint Working GroupKIMS Knowledge and Information Management
Systems KRA key result areaKZN KwaZulu-NatalLIMS laboratory information management systemLOGIS logistical information systemLRAD Land Redistribution for Agricultural
DevelopmentLUSM Land Use and Soil ManagementMafi sa Micro-agricultural Financial Institutions of
South AfricaM&E monitoring and evaluationMinMec Ministers and Members of Executive CouncilsMoU Memorandum of UnderstandingMPCC multipurpose community centre
Acronyms and Acts
ACRONYMSACRONYMS

ACTSACTS
• Agricultural Debt Management Act, 2001 (Act No. 45 of 2001)• Agricultural Pests Act, 1983 (Act No. 36 of 1983)• Agricultural Research Act, 1990 (Act No. 86 of 1990)• Animal Health Act, 2002 (Act No. 7 of 2002)• Appropriation Act, 2005 (Act No. 4 of 2005)• Broad-Based Black Economic Empowerment Act, 2003 (Act No. 53 of 2003)• Disaster Management Act, 2002 (Act No. 57 of 2002)• Division of Revenue Act, 2004 (Act No. 5 of 2004)• Fertilizers, Farm Feeds, Agricultural Remedies and Stock Remedies Act, 1947 (Act No. 36 of 1947)• Genetically Modifi ed Organisms Act, 1997 (Act No. 15 of 1997)• Intergovernmental Relations Framework Act, 2005 (Act No. 13 of 2005)• Land and Agricultural Development Bank Act, 2002 (Act No.15 of 2002)• Land Bank Act, 1912 (Act No. 18 of 1912)• Land Bank Act, 1944 (Act No. 13 of 1944) • Liquor Products Act, 1989 (Act No. 60 of 1989)• Marketing of Agricultural Products Act, 1996 (Act No. 47 of 1996)• Meat Safety Act, 2000 (Act No. 40 of 2000)• Onderstepoort Biological Products Incorporation Act, 1999 (Act No. 19 of 1999)• Perishable Products Export Control Act, 1983 (Act No. 9 of 1983)• Plant Improvement Act, 1976 (Act No. 53 of 1976)• Public Finance Management Act, 1999 (Act No.1 of 1999)• South African Abattoir Corporation Act Repeal Act, 2005 (Act No. 17 of 2005)
MRL Maximum Residue LimitNAMPO National Maize Producers’ Organisation (now
called GPO = Grain Producers’ Organisation)NAFU National African Farmers’ UnionNARF National Agricultural Research ForumNBS Natal Building SocietyNCOP National Council of ProvincesNEPAD New Partnership for Africa’s DevelopmentNIFAL National Intergovernmental Forum for
Agriculture and LandNQF National Qualifi cations FrameworkNRS National Regulatory ServicesOECD Organisation for Economic Co-operation and
DevelopmentOBP Onderstepoort Biological ProductsOIE Offi ce International des EpizootiesOHS Occupational Health and SafetyPDA Provincial Department of AgriculturePDI previously disadvantaged individualPIMSA Project Information Management System for
AgriculturePPECB Perishable Products Export Control BoardPRRS porcine reproductive and respiratory
syndromeQMS Quality Management SystemRAMP Repairs and Maintenance ProgrammeR&D research and developmentRDP Reconstruction and Development
ProgrammeRSA Republic of South AfricaSC Steering CommitteeSAAU South African Agricultural UnionSABC South African Broadcasting CorporationSABS South African Bureau of StandardsSACU South African Customs Union
SADC South African Development CommunitySADC-FANR South African Development Community-
Food, Agriculture and Natural ResourcesSAMDI South African Management and Development
InstituteSANAS South African National Accreditation SchemeSA PIP South African Pesticide Initiative ProgrammeSASOL South African Synthetic Oil and LubricantsSECO Swiss State Secretariat for Economic AffairsSETA Sector Education and Training Authority SITA State Information Technology AgencySMME small, medium and micro enterprisesSPFS Special Programme on Food SecuritySPOT Satellite Pour l’Observation de la Terre
(commercial earth observation satellite)SPS sanitary and phytosanitarySTC Science and Technology CommitteeSUAR sustainable use of agricultural resourcesTAP Technical Assistance ProgrammeTCP Technical Co-operation ProgrammeUNISA University of South AfricaUP University of PretoriaURP Urban Renewal ProgrammeUSA United States of America USAID United States Agency for International
DevelopmentUSDA United States Department of AgricultureWFP World Food ProgrammeWfW Working for WaterWRC Water Research CommissionWTO World Trade OrganisationWTO SPS World Trade Organisation Agreement on the
Application of Sanitary and PhytosanitaryWUID Water Use and Irrigation Development

GGeneral informationeneral information

General information2
Director-General’s overview
During the past year the Department of Agriculture continued to ensure that all activities and projects undertaken were aligned with our strategic objectives and priorities within the legislative mandate. We were guided by the Stra-tegic plan for the Department of Agriculture 2005 (shortly referred to as the5 Strategic plan 2005), as approved by 55Parliament in April 2005.
In refl ecting on what we have achieved in the 2005/06 fi nancial year and the challenges we faced in meeting certain targets we had set for ourselves, it became clear that the focus should be on the eight departmental priority areas set in the Strategic plan 2005 and how to improve effective service delivery in these areas. Government’s ASGISA 5Programme provides an additional, more recent focus area.
AFRICAN AGRICULTURAL DEVELOPMENT PROGRAMME (AADP)
In contributing towards regional stability and the sustainable development of the economies of African countries, South Africa experienced an increased demand by individual African countries for technical assistance and support
Masiphula Mbongwa
DIRECTOR-GENERAL: AGRICULTURE

DoA Annual report 2005/06 3
in the fi eld of agriculture. Given the increased demand, we have realised that these requests can no longer be man-aged through normal bilateral arrangements but rather through a technical assistance programme (TAP), namely the AADP. An investment by South Africa in the form of a TAP is considered to be an important enabler for re-gional development, which has the potential for long-term benefi ts for South Africa and implementation of interna-tional priorities determined by Cabinet. Our objective is to contribute towards improved economic conditions on the continent through engagement with the New Partnership for Africa’s Development (NEPAD), thereby providing the opportunity to focus on strengthening relations with other African countries, promoting trade both bilaterally and multi-laterally.
We have maintained close relationships with the Food and Agriculture Organization (FAO) of the United Nations. A regional meeting took place in Mali in January 2006 and we are working with the FAO Africa Regional Offi ce, NEPAD Secretariat and the Forum for Agricultural Research in Africa (FARA) to ensure follow-up on the resolutions of the meeting.
AGRICULTURAL BROAD-BASED BLACK ECONOMIC EMPOWERMENT (AGRIBEE)
Following an extensive consultation process with agricultural stakeholders, the draft AgriBEE Charter was launched at a national indaba in Midrand, Johannesburg during December 2005. From the beginning of 2006, stakeholders started a process of communicating the draft charter to their constituents, in collaboration with provinces. The AgriBEE Charter and Scorecard were completed in early 2006 and submitted to the Minister for approval. The char-ter builds upon the draft that was widely accepted at the indaba. Improvements were made by the inclusion of the key recommendations of the indaba and it was aligned with two BEE codes of good practice. The charter signifi es a key joint initiative to address real transformation of the sector in a practical and fi rm but balanced way.
The implementation plans for the cotton and fruit industries were completed and it is expected that the implementa-tion plan for the grain strategy will be fi nalised in the coming fi nancial year. All these processes will be subjected to monitoring and evaluation systems for benchmarking and reviewing of broad-based BEE activities within the sector, to ensure the broadening of access to agriculture.
COMPREHENSIVE AGRICULTURAL SUPPORT PROGRAMME (CASP)
Launched by the Minister for Agriculture and Land Affairs in 2004, CASP aims to promote agricultural production and provide post-settlement support to emerging farmers. The department continued to direct the process of capacitat-ing the provinces with regard to planning, implementation, information dissemination and reporting, in order to achieve the desired output. CASP includes improved access to fi nancing and credit for small-scale farmers and co-operatives, as well as the six pillars of nonfi nancial support services, namely information and knowledge man-agement, technical and advisory assistance, training and capacity building, market and business development, on/off-farm infrastructure services and regulatory services.
During the 2005/06 fi nancial year, an amount of R250 million was allocated to CASP. To date 53 205 farmers were assisted through CASP in the nine provinces and 21 017 households were benefi ciaries. The progress in the CASP implementation can be attributed to a number of interventions:
• The department’s top management team and representatives from the National Treasury visited the provinces to provide assistance.
• The CASP Secretariat regularly interacted with provincial offi cials through visits and workshops which aimed at aligning programmes so as to fast-track implementation.
• Implementation plans were discussed at the National Intergovernmental Forum for Agriculture and Land (NIFAL), previously known as MinMec.
An agricultural micro-fi nance scheme was developed to create access to fi nance for farmers, especially benefi ciar-ies of the state-directed Land Restitution, Redistribution and Land Tenure Reform Programme. The scheme was launched as Mafi sa in 2005, as a pilot in the Limpopo, Eastern Cape and KwaZulu-Natal provinces and will be rolled out to the other provinces in 2006. Steering committees in the provinces are being established that will be respon-sible for facilitating implementation.
Livestock farming by black emerging farmers is often characterised by poor productivity and overstocking, which subsequently leads to overgrazing. In addressing this challenge, the department developed a Livestock Develop-

General information4
ment Strategy, which will enhance support to rural poor farmers in realising the economic value of their assets. The successful Mount Ayliff goat project offers an opportunity for upscaling goat production in other suitable areas.
INTEGRATED FOOD SECURITY AND NUTRITION PROGRAMME (IFSNP)
The IFSNP is part of government’s broader strategy to eradicate hunger and malnutrition and to increase food pro-duction. As the lead department within the Social Cluster for the implementation of IFSNP, the department assisted with the development of technology and training modules, as well as the dissemination of information with the aim of providing assistance by increasing levels of household food production. This was done in collaboration with other government departments and relevant stakeholders, including nongovernmental organisations, schools and communities.
The Food Insecurity and Vulnerability Mapping System (FIVIMS) pilot survey was completed in the Sekhukhune nodal point in the Limpopo Province. The outcome of this survey will be used to create a model for food insecurity and determine a programme of action for the Social Cluster. Guidelines were completed for the Household Food Security Programme (HFSP).
As part of the Mechanisation Programme, priority was given to the promotion of small-scale mechanisation support to food security projects. The programme aims to increase food crop productivity among smallholder and resource-poor farmers and food producers in rural development nodes in order to improve food security and reduce poverty. During the period under review, 330 power hoes were handed over to municipalities in presidential nodes.
KNOWLEDGE AND INFORMATION MANAGEMENT SYSTEMS (KIMS)
This priority area is regarded as a key enabler in establishing a knowledge-directed agricultural sector. KIMS plays a major role in realising the department’s aim of effi cient and effective functioning and improved service delivery, as well as in improving access to information for our stakeholders.
Value-added services within the department’s knowledge portal continue to increase and the broader community is starting to use this resource more productively. A number of innovations were developed during the period under review to improve stakeholders’ access to information.
Reliable, up-to-date statistical information on the performance of the agricultural sector was provided monthly and quarterly. This included quarterly monitoring of the economic performance of the sector and monthly forecasts on the production of fi eld crops on a provincial basis. Statistics were made available to Statistics SA and the Reserve Bank for incorporation into the country’s national accounting system. Overviews of economic changes and the im-pact on the sector were published on a regular basis. The department also launched a project information manage-ment system, PIMSA, which will provide clients with real-time information on agricultural and related pro jects.
Marketing information booklets in all offi cial languages were developed, printed and distributed. These booklets cover the basics of agricultural marketing and are targeted at developing farmers in all provinces, through the Multi-purpose Community Centres (MPCCs). A web-based integrated agricultural marketing information system was developed to provide agricultural marketing information to farmers in rural development nodes.
An electronic database on multilateral science and R&D organisations was developed with the assistance of the Directorate Information and Communication Technology. It was published on both the departmental Intranet and the Internet and is currently available online.
The need to fast-track the development of knowledge and skills required in the sector value chain and to ensure that the skills development systems, including the SETAs, are well-resourced and that delivery will be in accordance with the skills demand, has been a high priority for the department during the period under review. The Agricultural Education and Training (AET) Strategy was developed to address human resource challenges in the agricultural sector. This strategy embraces agriculture as one of the major economic areas in which a great number of rural communities can participate.
In collaboration with the AgriSETA, 16 000 farmworkers benefi ted from adult basic education and training (ABET) during 2005/06. A total of 12 farming qualifi cations ranging from NQF levels 1 to 5, were developed.
DoA Annual report 2005/06 5
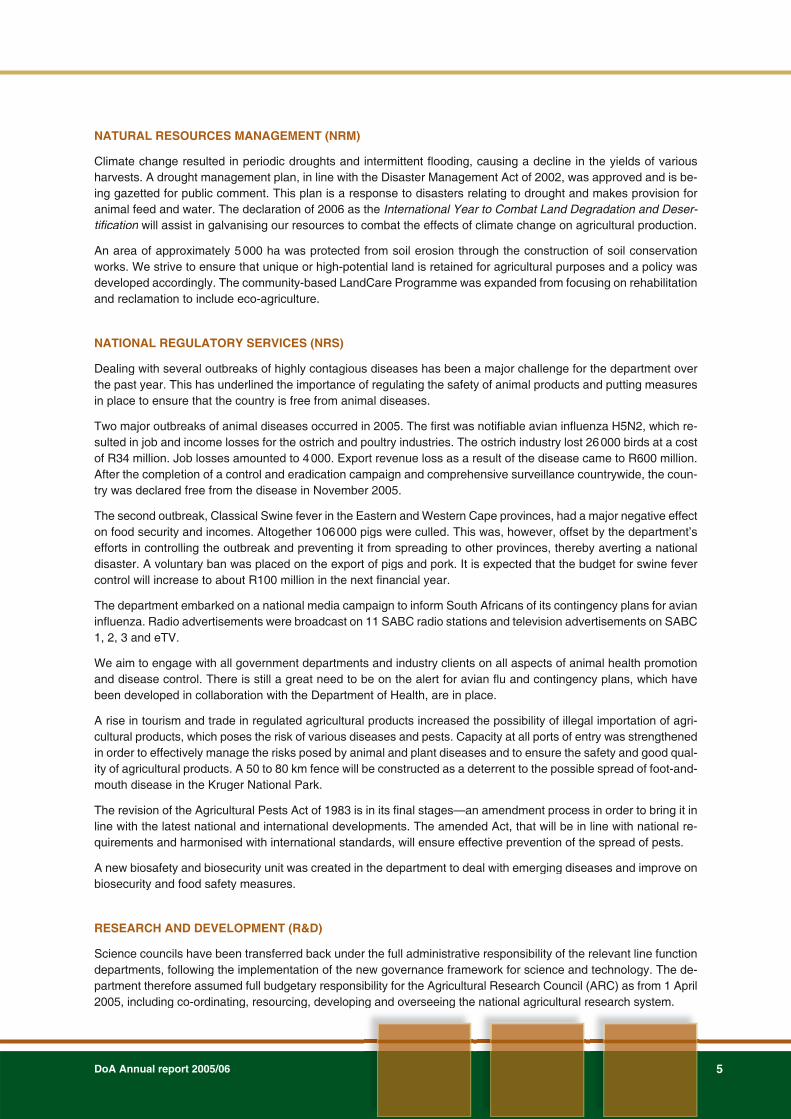
NATURAL RESOURCES MANAGEMENT (NRM)
Climate change resulted in periodic droughts and intermittent fl ooding, causing a decline in the yields of various harvests. A drought management plan, in line with the Disaster Management Act of 2002, was approved and is be-ing gazetted for public comment. This plan is a response to disasters relating to drought and makes provision for animal feed and water. The declaration of 2006 as the International Year to Combat Land Degradation and Deser-tifi cation will assist in galvanising our resources to combat the effects of climate change on agri cultural production.n
An area of approximately 5 000 ha was protected from soil erosion through the construction of soil conservation works. We strive to ensure that unique or high-potential land is retained for agricultural purposes and a policy was developed accordingly. The community-based LandCare Programme was expanded from focusing on rehabilitation and reclamation to include eco-agriculture.
NATIONAL REGULATORY SERVICES (NRS)
Dealing with several outbreaks of highly contagious diseases has been a major challenge for the department over the past year. This has underlined the importance of regulating the safety of animal products and putting measures in place to ensure that the country is free from animal diseases.
Two major outbreaks of animal diseases occurred in 2005. The fi rst was notifi able avian infl uenza H5N2, which re-sulted in job and income losses for the ostrich and poultry industries. The ostrich industry lost 26 000 birds at a cost of R34 million. Job losses amounted to 4 000. Export revenue loss as a result of the disease came to R600 million. After the completion of a control and eradication campaign and comprehensive surveillance countrywide, the coun-try was declared free from the disease in November 2005.
The second outbreak, Classical Swine fever in the Eastern and Western Cape provinces, had a major negative effect on food security and incomes. Altogether 106 000 pigs were culled. This was, however, offset by the department’s efforts in controlling the outbreak and preventing it from spreading to other provinces, thereby averting a national disaster. A voluntary ban was placed on the export of pigs and pork. It is expected that the budget for swine fever control will increase to about R100 million in the next fi nancial year.
The department embarked on a national media campaign to inform South Africans of its contingency plans for avian infl uenza. Radio advertisements were broadcast on 11 SABC radio stations and television advertisements on SABC 1, 2, 3 and eTV.
We aim to engage with all government departments and industry clients on all aspects of animal health promotion and disease control. There is still a great need to be on the alert for avian fl u and contingency plans, which have been developed in collaboration with the Department of Health, are in place.
A rise in tourism and trade in regulated agricultural products increased the possibility of illegal importation of agri-cultural products, which poses the risk of various diseases and pests. Capacity at all ports of entry was strengthened in order to effectively manage the risks posed by animal and plant diseases and to ensure the safety and good qual-ity of agricultural products. A 50 to 80 km fence will be constructed as a deterrent to the possible spread of foot-and-mouth disease in the Kruger National Park.
The revision of the Agricultural Pests Act of 1983 is in its fi nal stages—an amendment process in order to bring it in line with the latest national and international developments. The amended Act, that will be in line with national re-quirements and harmonised with international standards, will ensure effective prevention of the spread of pests.
A new biosafety and biosecurity unit was created in the department to deal with emerging diseases and improve on biosecurity and food safety measures.
RESEARCH AND DEVELOPMENT (R&D)
Science councils have been transferred back under the full administrative responsibility of the relevant line function departments, following the implementation of the new governance framework for science and technology. The de-partment therefore assumed full budgetary responsibility for the Agricultural Research Council (ARC) as from 1 April 2005, including co-ordinating, resourcing, developing and overseeing the national agricultural research system.

General information6
The Research and Development Strategy was drafted in 2005 and presented to the National Agricultural Research Forum (NARF). The aim in formulating this strategy was to provide guidelines for agricultural research, and promote the development and transfer of technology. The implementation of the strategy will further strengthen the depart-ment’s efforts to mobilise additional resources for agricultural research. In the 2005/06 fi nancial year, additional projects to an amount of R41 million, involving the ARC were approved as a means to boost efforts towards the development of appropriate production technologies.
ACCELERATED AND SHARED GROWTH INITIATIVE OF SOUTH AFRICA (ASGISA)
In our endeavour to contribute towards ASGISA, the department started a process of developing detailed business plans for identifi ed ASGISA projects. Five key areas, in which our contribution can be maximised, have been identi-fi ed. These include livestock development, establishment of new and the rehabilitation of existing irrigation schemes, biofuels, land rehabilitation and the development of agricultural development corridors. Through programmes such as CASP, Mafi sa and AgriBEE assistance will be provided to the emerging farming sector.
CONCLUSION
In conclusion, we realise that there are major challenges facing us in the year ahead. However, with the policies, strategies and programmes that we have established, we will surely succeed in contributing towards poverty eradi-cation and in providing support to emerging farmers to ensure that their businesses become commercially viable in the long term.
I would like to use this opportunity to thank the Minister for her effective leadership, and the Deputy Minister and the chairpersons of the Parliamentary committees for their expertise and guidance. I also want to extend my apprecia-tion to the leadership and staff of all the agriculture state-owned enterprises, the agribusiness community and farmer organisations that assist us in ensuring that we meet our commitments to the South African agricultural public. Finally, I thank my management team and all the staff members in the department for their commitment to the development of the agricultural sector and their willingness to take on ever-increasing work volumes with char-acteristic optimism and effi ciency.
Masiphula Mbongwa
DIRECTOR-GENERAL: AGRICULTURE

DoA Annual report 2005/06 7
Economic overview
This report gives an overview of the major macro-economic trends of the agriculture sector for the period 1 April 2005 to 31 March 2006. Aggregates are compared with the period 1 April 2004 to 31 March 2005.
GROSS FARM INCOME
Gross income refers to the agricultural production that is marketed at basic prices. It also includes production for own consumption valued at the same prices.
Gross income from all agricultural products amounted to R68 515 million for the year ended 31 March 2006. The fact that this is lower than the previous year can largely be attributed to the decrease of 10,7 % in the gross income from horticultural products. Animal products contributed 48,7 %, horticultural products 28,6 % and fi eld crops 22,7 % to the gross farm income.
The gross income from animal products amounted to R33 334 million—an increase of 5,3 %. The gross income from the slaughtering of cattle and calves increased by 16,5 % and that from the slaughtering of sheep by 8,1 %. These increases can largely be attributed to the increases in the prices that producers received for slaughtered stock. Income from milk decreased by 8,2 %.
The income from horticultural products decreased by 10,7 % to R19 619 million. The income from deciduous and other summer fruit decreased by 27,7 %, mainly as a result of a decrease in production. However, the gross income from vegetables increased by 8,8 % to R7 069 million. The average producer price of vegetables decreased signifi -cantly during the year under review.
The gross income from fi eld crops decreased by 5,0 % to R15 563 million. The decrease resulted from decreases of 41,9 % in the income from tobacco, 10,5 % in the income of sunfl owers and 5 % in the income from maize. The reason for these decreases is mainly the result of a decrease of 15,3 % in the producer prices of fi eld crops.
�������������� ��������������������������������������������� !
�����
�����
������
������
�����
�����
�����
������
�"������#
����������$ %�����&��&��������&��$ �#���������&��$
����� ������
INTERMEDIATE EXPENDITURE
Intermediate expenditure refers to the value of the goods and services that were purchased to be consumed as inputs during the process of production. Intermediate expenditure increased by 5,4 % to R41 958 million. Expendi-ture on farm feeds remained the biggest expenditure item, accounting for 28,4 % of the total expenditure. This was followed by 12 % for fuel, 11,6 % for farm services and 10,5 % for maintenance of machinery and equipment. Large increases occurred in the expenditure on fuel, which increased by 27,2 %, while the price paid by farmers for ferti-liser increased by 8,3 %.
General information8
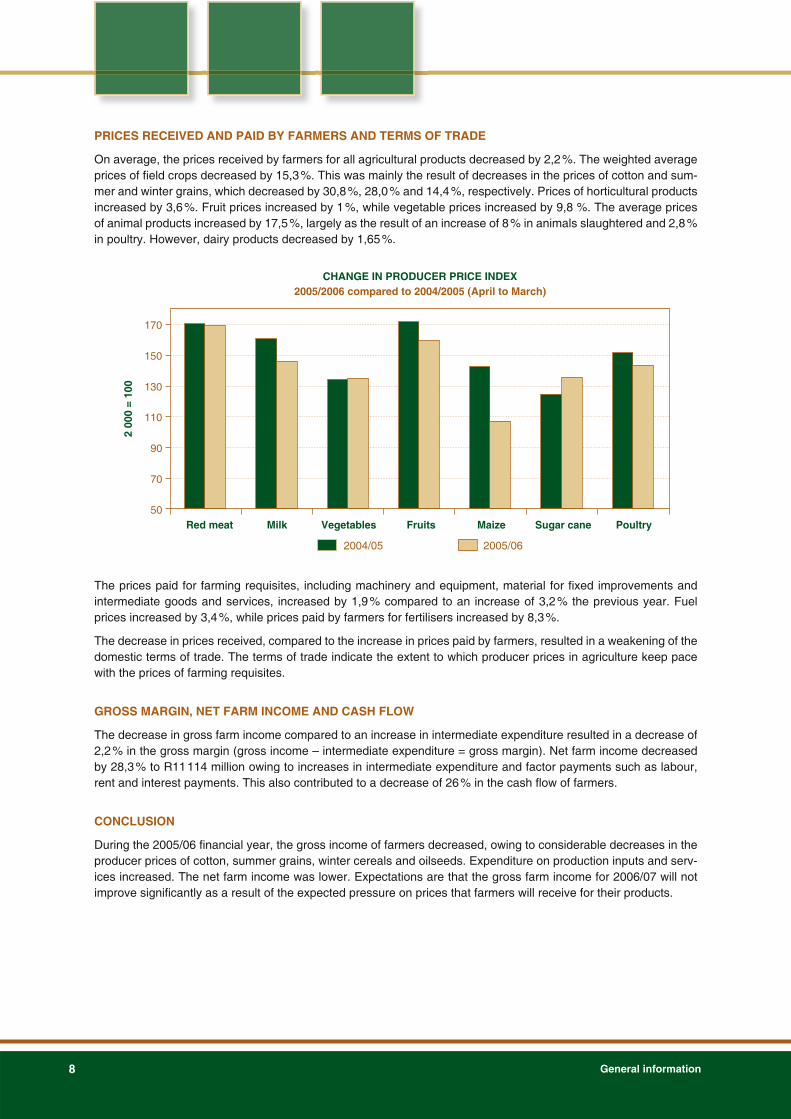
PRICES RECEIVED AND PAID BY FARMERS AND TERMS OF TRADE
On average, the prices received by farmers for all agricultural products decreased by 2,2 %. The weighted average prices of fi eld crops decreased by 15,3 %. This was mainly the result of decreases in the prices of cotton and sum-mer and winter grains, which decreased by 30,8 %, 28,0 % and 14,4 %, respectively. Prices of horticultural products increased by 3,6 %. Fruit prices increased by 1 %, while vegetable prices increased by 9,8 %. The average prices of animal products increased by 17,5 %, largely as the result of an increase of 8 % in animals slaughtered and 2,8 % in poultry. However, dairy products decreased by 1,65 %.
�%��� ���'��()� ��'�� ��( *��������������������������������������������� !
��
��
��
���
���
���
���
�������� ��+ ,�-���.��$ ��&��$ ��/� �&-�����#� '�&���0
������1�2��
����� ������
The prices paid for farming requisites, including machinery and equipment, material for fi xed improvements and intermediate goods and services, increased by 1,9 % compared to an increase of 3,2 % the previous year. Fuel prices increased by 3,4 %, while prices paid by farmers for fertilisers increased by 8,3 %.
The decrease in prices received, compared to the increase in prices paid by farmers, resulted in a weakening of the domestic terms of trade. The terms of trade indicate the extent to which producer prices in agriculture keep pace with the prices of farming requisites.
GROSS MARGIN, NET FARM INCOME AND CASH FLOW
The decrease in gross farm income compared to an increase in intermediate expenditure resulted in a decrease of 2,2 % in the gross margin (gross income – intermediate expenditure = gross margin). Net farm income decreased by 28,3 % to R11 114 million owing to increases in intermediate expenditure and factor payments such as labour, rent and interest payments. This also contributed to a decrease of 26 % in the cash fl ow of farmers.
CONCLUSION
During the 2005/06 fi nancial year, the gross income of farmers decreased, owing to considerable decreases in the producer prices of cotton, summer grains, winter cereals and oilseeds. Expenditure on production inputs and serv-ices increased. The net farm income was lower. Expectations are that the gross farm income for 2006/07 will not improve signifi cantly as a result of the expected pressure on prices that farmers will receive for their products.

DoA Annual report 2005/06 9
The Ministry
The purpose of the offi ce of the Minister is to provide leadership and set national policy on agricultural development and land reform.
This is done through:
• Issuing policy directives [Cabinet memoranda, draft legislation, regulations, policy discussion documents, meet-ings (MinMec, management), public statements (including speeches)]
• Providing leadership and motivation to management, staff and partners in agricultural development and land reform
• Executing constitutional and legislative mandates.
PUBLIC ENTITIES REPORTING TO THE MINISTER
The following public entities report directly to the Minister:
• The Agricultural Research Council
• The Land and Agricultural Development Bank
• The National Agricultural Marketing Council
• Onderstepoort Biological Products
• The Perishable Products Export Control Board
• Ncera Farms
BILLS SUBMITTED TO THE LEGISLATURE
The following Bills were submitted to the legislature during the period under review:
• South African Abattoir Corporation Act Repeal Act of 2005 was fi nalised by Parliament in September 2005 and sent to the President for assent.
• Genetically Modifi ed Organisms Amendment Bill is still in full consideration by the Portfolio Committee for Agri-culture and Land Affairs.
MINISTERIAL VISITS TO FOREIGN COUNTRIES
The Minister travelled extensively during the period under review and undertook 12 visits to the following foreign countries for various purposes:
Angola (18–22 April 2005) Attendance of the 1st session of the Joint Ministerial Committee (JMC) be-tween South Africa and Angola
Ghana (5–6 May 2005) Representing the department during the NEPAD: Implementing the Com-prehensive African Agricultural Development Programme (CAADP) Agenda Continental Wrap-up meeting
France (22 –27 May 2005) Attendance of the 73rd General Session of the World Organisation for Ani-mal Health (OIE)
Italy (23–26 May 2005) Participating in the 31st Session of the Committee on World Food Security
Lesotho (8–10 June 2005) Attendance of the SADC Integrated Committee of Ministers meeting
China (11–13 July 2005) Attendance of the WTO Mini-Ministerial event
Botswana (20–21 July 2005) Attendance of a restructuring process meeting with the Directorate Food, Agriculture and Natural Resources (FANR)

General information10
Pakistan (9–10 September 2005) Attendance of the G20 Senior Offi cials meeting and the Ministerial meeting
Namibia (28–29 September 2005) Offi cial Ministerial visit to discuss bilateral issues between the two coun-tries
Italy (16–26 November 2005) Attendance of the United Nations Food and Agriculture Organization’s Council and Conference meeting
Mali (30 January to 2 February 2006) Participating in the FAO Regional Conference meeting
Brazil (7 March to 10 March 2006) Participating in the international conference on Agrarian and Rural Develop-ment meeting

DoA Annual report 2005/06 11
Mission statement
VISION
The vision of the Department of Agriculture is that of a united and prosperous agricultural sector.
MISSION
The Department of Agriculture aims to lead and support sustainable agriculture and promote rural development through:
• Ensuring access to suffi cient, safe and nutritious food• Eliminating skewed participation and inequity in the sector• Maximising growth, employment and income in agriculture• Enhancing the sustainable management of natural agricultural resources and ecological systems• Ensuring effective and effi cient governance • Ensuring knowledge and information management.
OBJECTIVES
To fulfi l its mandate and meet its commitment to the National Strategy for Agricultural Development, the department has set a number of medium-term strategic objectives. These are to:
• Guide and support equitable access to resources for agricultural development• Enhance the economic performance of the sector• Ensure sustainable natural resource management and use• Promote and support the participation of black people, women, youth and the disabled in agriculture• Ensure consumer confi dence in agricultural products and services• Achieve departmental service excellence.
DEPARTMENTAL VALUES STATEMENT
The departmental values are underpinned by the ethos of “Vuk’uzenzele”. This concept builds on the meaning of the word through its direct interpretation of “self-reliance” in capturing the spirit of South Africans at home and in foreign countries, expressed by President Mbeki in his State of the Nation Address in 2002, as people who want to “lend a hand in the national effort to build a better life”.
Recognising that being in the public service is indeed already a privilege to be able to serve the nation and having adopted the principles of Batho Pele—the challenge is now to respond comprehensively to the call for action. The six departmental values that support the above context are therefore:
Bambanani We believe that the sum of our collective efforts will and should be greater than the total of our individual efforts.
Drive We are purposeful and energised in all that we do.
Excellence We are committed to exceeding our customers’ expectations for quality, responsiveness and pro-fessional excellence.
Innovation We motivate and reward creativity, innovation and new knowledge generation that support out-standing performance.
Integrity We maintain the highest standards of ethical behaviour, honesty and professional integrity.
Maak ’n plan We will always fi nd a way to make it happen.

General information12
The departmental management is committed to ensuring the creation of an environment within which all the staff members can live through these values.
KEY CLIENTS
• Provincial departments of agriculture• Public entities working in the agricultural sector• Consumers of agricultural products• Processors, traders and exporters of agricultural products• Producers of agricultural products• Agricultural services providers• International organisations working in agriculture.
KEY PRODUCTS AND SERVICES
The key products and services of the department are:
National leadership
Provide leadership in terms of policy, legislation, setting strategic priorities, advice, norms and standards, informa-tion, monitoring and evaluation, supervision and reporting.
National regulatory services
Provide services with respect to national legislation, regulations, controls, auditing services and inspection servic-es.
National co-ordination services
Facilitate provincial and public entities co-ordination, international agreements, professional networks, public, pri-vate and community partnerships, and agricultural human resource development.
National agricultural risk management
Manage early warning systems, disaster management policy, response, recovery, mitigation and preparedness, pest control and plant and diseases control.

DoA Annual report 2005/06 13
Top management
Phil Mohlahlane
DEPUTY DIRECTOR-GENERALAgricultural Economics and Business Development
Vangile Titi
DEPUTY DIRECTOR-GENERALPlanning, Monitoring, Evaluation and Communication
Njabulo Nduli
DEPUTY DIRECTOR-GENERALAgricultural Production and Resources Management
Luvuyo Mabombo
CHIEF OPERATING OFFICEROperations Management and Governance
Masiphula Mbongwa
DIRECTOR-GENERAL

General information14
Legislative mandate
The department derives its core mandate from Section 27(1)(b) of the Constitution. It is currently responsible for about 30 pieces of legislation. Underpinning the scope of the mandate of the Department of Agriculture, is the un-derstanding of agriculture as being inclusive of all economic activities, from the provision of farming inputs and farming to adding value to all agricultural activities. In view of the reality that the agricultural sector is continuously subjected to changes in the production and marketing environment, the policy and legislative environment that governs the sector has to be adjusted continuously through amendments and the replacement of some pieces of legislation.
The Department of Agriculture is primarily responsible for all agriculture-related legislation. The following list of Acts refl ects the legislative mandate of the department:
Performing Animals Protection Act, 1935 (Act No. 24 of 1935)Fertilizers, Farm Feeds, Agricultural Remedies and Stock Remedies Act, 1947 (Act No. 36 of 1947)Animal Protection Act, 1962 (Act No. 71 of 1962)Fencing Act, 1963 (Act No. 31 of 1963)Subdivision of Agricultural Land Act, 1970 (Act No. 70 of 1970)Plant Breeders’ Rights Act, 1976 (Act No. 15 of 1976)Plant Improvement Act, 1976 (Act No. 53 of 1976)Veterinary and Para-veterinary Professions Act, 1982 (Act No. 19 of 1982)Perishable Products Export Control Act, 1983 (Act No. 9 of 1983)Agricultural Pests Act, 1983 (Act No. 36 of 1983)Conservation of Agricultural Resources Act, 1983 (Act No. 43 of 1983)Animal Diseases Amendment Act, 1991 (Act No. 18 of 1991)Liquor Products Act, 1989 (Act No. 60 of 1989)Agricultural Research Act, 1990 (Act No. 86 of 1990)Agricultural Product Standards Act, 1990 (Act No. 119 of 1990)Agricultural Produce Agents Act, 1992 (Act No. 12 of 1992)Groot Constantia Trust Act, 1993 (Act No. 58 of 1993)Societies for the Prevention of Cruelty to Animals Act, 1993 (Act No. 169 of 1993)Marketing of Agricultural Products Act, 1996 (Act No. 47 of 1996)Agriculture Laws Extension Act, 1996 (Act No. 87 of 1996)Genetically Modifi ed Organisms Act, 1997 (Act No. 15 of 1997)Animal Improvement Act, 1998 (Act No. 62 of 1998)Agricultural Laws Rationalisation Act, 1998 (Act No. 72 of 1998)Onderstepoort Biological Products Incorporation Act, 1999 (Act No. 19 of 1999)Meat Safety Act, 2000 (Act No. 40 of 2000)Agricultural Debt Management Act, 2001 (Act No. 45 of 2001)Animal Identifi cation Act, 2002 (Act No. 6 of 2002)Land and Agricultural Development Bank Act, 2002 (Act No. 15 of 2002)KwaZulu Cane Growers’ Association Act Repeal Act, 2002 (Act No. 24 of 2002)South African Abattoir Corporation Act Repeal Act, 2005 (Act No. 17 of 2005)
Statutory bodies
The Department of Agriculture administers the following statutory bodies:
• Perishable Products Export Control Board• Agricultural Research Council• National Agricultural Marketing Council • Onderstepoort Biological Products • Land and Agricultural Development Bank• Ncera Farms

DoA Annual report 2005/06 15
PERISHABLE PRODUCTS EXPORT CONTROL BOARD
The board was established in terms of Section 2 of the Perishable Products Export Control Act of 1983 and has the following functions:
• Controls the export shipment of perishable products from the Republic of South Africa and the order of shipment of these at all ports.
• Makes recommendations on the handling of perishable products when moved to and from railway trucks and other vehicles or cold stores.
• Promotes uniform freight rates for the export of perishable products, with due allowance for particular perishable products, port of export and means of conveyance, etc.
Accountability arrangements
In terms of Section 16 of the Perishable Products Export Control Act of 1983, the board must furnish the Minister and all registered exporters with a report on its activities within six months after the end of each fi nancial year.
AGRICULTURAL RESEARCH COUNCIL
The council was established in terms of Section 2 of the Agricultural Research Act of 1990 and has the following functions:
• Establishes and controls facilities in the fi elds of research, development and the transfer of technology which the council may determine from time to time.
• Promotes co-operation between the Republic of South Africa and other countries with regard to research, de-velopment and the transfer of technology to other countries, etc.
Accountability arrangements
In terms of Section 22(3) of the Agricultural Research Act of 1990, the council shall furnish the Minister with an an-nual report of its activities at the end of each fi nancial year.
NATIONAL AGRICULTURAL MARKETING COUNCIL
The council was established in term of Section 3 of the Marketing of Agricultural Products Act of 1996 and has the following functions:
• Prepares and submits to the Minister for consideration statutory measures and changes to statutory meas-ures.
• Monitors the application of statutory measures and reports on this to the Minister. Evaluates and reviews these measures at least every two years.
Accountability arrangements
The accounting offi cer shall, in terms of Section 8(A)(4)(c) of the Marketing of Agricultural Products Act of 1996, furnish the Minister with a year-end fi nancial statement within four months after the end of each fi nancial year.
ONDERSTEPOORT BIOLOGICAL PRODUCTS
Onderstepoort Biological Products (OBP) was established in accordance with Section 2 of the Onderstepoort Bio-logical Products Incorporation Act of 1999.
The OBP manufactures and distributes vaccines and other biological products pertaining to animals.
Accountability arrangements
The OBP, as a national government business enterprise, is, in terms of Section 55 of the Public Finance Manage-ment Act of 1999, entitled to submit to the Minister the audited fi nancial statements and annual report within fi ve months of the end of the fi nancial year.
General information16
LAND AND AGRICULTURAL DEVELOPMENT BANK (trading as THE LAND BANK)
The bank was established in terms of Section 3 of the Land Bank Act of 1912, continued to exist in terms of Section 3 of the Land Bank Act of 1944 and currently exists under the name of the Land and Agricultural Development Bank of South Africa, in terms of the Land and Agricultural Development Bank Act of 2002, despite the repeal of these Acts.
The functions of the Land and Agricultural Development Bank are as follows:
• Promotes equitable ownership of agricultural land, in particular the increase of ownership of agricultural land by historically disadvantaged persons.
• Provides wholesale as well as retail fi nancing for commercial and developing farming sectors and other agricul-ture-related businesses.
• Administers the agricultural credit scheme, Mafi sa, on behalf of the department.
Accountability arrangements
In terms of Section 35(3) of the Land and Agricultural Development Bank Act of 2002, the board must ensure that budgets, annual reports and an audited fi nancial statement are submitted in accordance with the provision of the Public Finance Management Act of 1999.
NCERA FARMS (PTY) LTD
Ncera Farms is a public company listed under Schedule 3B of the Public Finance Management Act of 1999, with the department as the sole shareholder. Ncera Farms is situated at Kidd’s Beach near East London in the Eastern Cape on state-owned land of approximately 3 102 ha.
The primary function of Ncera Farms is to assist small and emerging farmers through the provision of various serv-ices such as advice, extension services, training and ploughing.
Accountability arrangements
The board of directors of the company is accountable to the department and reports to the Minister for Agriculture and Land Affairs as the executive authority.

PProgrammerogrammeperformanceperformance

Programme performance18
Programme performance
VOTED FUNDSVOTED FUNDS
Appropriation Main appropriation Adjustedappropriation
Actual amount spent Under-expenditure
ENE R1 684 738 000 R1 967 768 000 R1 878 008 000 R89 760 000
Responsible Minister
Administering department
Accounting Offi cer
Minister for Agriculture and Land Affairs
Department of Agriculture
Director-General of Agriculture
AIMAIM
The Department of Agriculture aims to lead and support sustainable agriculture and promote rural development through ensuring access to suffi cient, safe and nutritious food; eliminating skewed participation and inequity in agri-culture; maximising growth, employment and income in the sector; improving the sustainable management of natu-ral agricultural resources and ecological systems; ensuring effective and effi cient governance; and ensuring accu-rate knowledge and information management.
KEY MEASURABLE OBJECTIVES, PROGRAMMES AND ACHIEVEMENTSKEY MEASURABLE OBJECTIVES, PROGRAMMES AND ACHIEVEMENTS
The strategic role of the department is to facilitate the transformation objectives for agricultural development, food security and growth of the sector and the sustainable use of natural resources.
To achieve this, the department provides support for the growth and transformation of the agricultural sector, pov-erty eradication and rural development, and for establishing farmer support programmes. These include access to technology, markets, fi nance, information and training. The department also seeks to mitigate risks by formulatingstrategies for disaster management, quality assurance, food safety, and plant and animal health.
The activities of the Department of Agriculture are organised into nine programmes:
Programme 1 Administration provides the department with political and strategic leadership and manage-ment.
Programme 2 Farmer Support and Development promotes stability, competitiveness, growth and transforma-tion in the agricultural sector by developing policies for farmer settlement, food security, rural development, co-operative development and agricultural risk and disaster management.
Measurable objective Improve emerging farmers’ access to and sustained participation in agri cul-ture through appropriate policies and targeted programmes that will ensure viable farm businesses.
Programme 3 Agricultural Trade and Business Development develops policies on access to national and international markets and promotes broad-based black economic empowerment (BEE) in the sector.
Measurable objective Improve the development of agribusiness, competitive markets and the international trade environment through providing better opportunities and more equitable access in order to maximise growth, employment and equity in the sector.
Programme 4 Economic Research and Analysis provides information for developing and monitoring the agri-cultural sector.

DoA Annual report 2005/06 19
Measurable objective Provide timely, accurate and pertinent agricultural economic and statistical information quarterly to inform decision making on production by all par-ticipants in the agricultural sector.
Programme 5 Agricultural Production promotes agricultural research, productivity and sustainability, and monitors and controls genetically modifi ed organisms.
Measurable objective Provide information and technology on agricultural production systems to increase agricultural productivity and profi tability.
Programme 6 Sustainable Resources Management and Use develops, implements and monitors policies on managing and using land and water resources in agriculture.
Measurable objective Conserve natural agricultural resources through developing, implementing and monitoring policies and norms and standards aimed at promoting the sustainable use of agricultural resources.
Programme 7 National Regulatory Services develops and monitors risk management policies for controllinganimal and plant diseases and for food safety.
Measurable objective Reduce the occurrence of animal and plant diseases through develop-ment, implementation and monitoring of policies that ensure proper main-tenance of and improvement in management systems for animal and plant disease control.
Programme 8 Communication and Information Management manages and co-ordinates communication, education and international relations.
Measurable objective Provide for effective internal and external communication and informationmanagement through a communication strategy.
Programme 9 Programme Planning, Monitoring and Evaluation consolidates and supports strategic and operational management in the department.
Measurable objective Improve organisational performance by supporting operational units to im-plement and monitor the department’s strategic plan and by undertaking programme evaluation and impact assessments.
ACHIEVEMENTSACHIEVEMENTS
Highlights of the department’s achievements during 2005/06 in relation to key measurable objectives include the following:
Programme Highlights of achievements
1: Administration Financial and administrative support services were rendered in terms of predeter-mined service standards.
2: Farmer Support and Development
As part of CASP support services, a total of 542 projects were managed and 89000 benefi ciaries were assisted.
Altogether 84 agricultural co-operatives were established in the nine provinces.
A FIVIMS pilot project was completed in the pilot area of Sekhukhune.
A drought management plan was developed, approved, gazetted for public com-ment and workshops were held in three provinces for broader inputs.
3: Agricultural Trade and BusinessDevelopment
Altogether 42 200 agricultural marketing information booklets were distributed to all provinces and some municipalities. These booklets are available in all offi cial languages spoken in South Africa.
The draft AgriBEE Charter was completed and submitted to the Minister for con-sideration and approval.
A report was completed on African trade potential.

Programme performance20
Programme Highlights of achievements
4: Economic Research andAnalysis
To improve the accuracy of crop estimates, a new producer independent crop estimate system was developed and implemented in the Free State, North West, Mpumalanga and Gauteng provinces. This new system, which is partially fundedby the Maize Trust, will complement the existing point frame sampling system.Preliminary results from the new system are very promising.
The DoA co-operated with the OECD in a study to review the agricultural policies of South Africa. The report was fi nalised after a peer review process at the OECD, which turned out to be a resounding success from a developing country perspec-tive.
5: Agricultural Production The goat-milk production scheme was developed and expanded for implementa-tion to all provinces. In addition, a Goat Productivity Improvement Programme was developed as part of contributions to ASGISA for implementation in 2006/07.
Norms and standards for extension and advisory services were implemented in all provinces and printed copies were distributed to each extension offi cer.
The Plant Improvement Act was reviewed and recommendations are to be imple-mented in 2006/07. In addition, production guidelines on various crops were pub-lished.
The GMO Amendment Bill was approved by Cabinet and Parliament.
6: Sustainable ResourcesManagement and Use
Tools have been secured to improve data capturing for fi xed point monitoring and surveillance systems, potential areas of livestock production, changes in land use and possible management of LandCare and CASP projects.
The SPOT 5 imagery system was piloted in priority areas for the Soil Protection Strategy (highly erodible Mthatha catchment in the eastern Cape and high-poten-tial soils in KwaZulu-Natal Midlands and Limpopo).
As part of the Mechanisation Programme 330 power hoes were handed over to municipalities in presidential nodes, following the signing of an MoU between the DoA and the Department of Provincial and Local Government.
7: National Regulatory Services A task team was established with various stakeholders to develop food control legislation. The process is still in its initial stages.
Involvement in SADC workshops regarding the harmonisation of phytosanitary regulations in the seed trade continued.
The plant health policy of South Africa was approved and published.
Following a successful control and eradication campaign and countrywide sur-veillance, South Africa was declared free from avian infl uenza, thereby averting a devastating threat to the poultry industry.
Safeguarding the internationally recognised status of the FMD free zone was achieved without vaccination by means of the intensifi cation of surveillance ac-tivities and by implementing the national contingency plan. An intensive aware-ness strategy was implemented.
Eastern Cape small-scale farmers were trained on the quality aspects of table potatoes. These farmers are marketing their potatoes at the Mthatha Fresh Prod-uce Market.
Six line function training manuals were completed and the existing standard op-erating procedures were restructured.
8: Communication and InformationManagement
Agricultural information in a wide range of media was disseminated—10 issues ofAgriNews published, 32 InfoPaks reprinted, radio programmes broadcast on com-smercial and public broadcasting services and daily updating of website informa-tion.
The launch of the Agricultural Education and Training Strategy culminated in the signing of a statement of intent by all the stakeholders in Agricultural Education and Training on 30 September 2005. The stakeholders who signed are the Min-

DoA Annual report 2005/06 21
Programme Highlights of achievements
8: Communication and InformationManagement (cont.)
ister for Agriculture and Land Affairs, Chairperson of the Board of FoodBEV SETA, Presidents of AgriSA and NAFU, Chairpersons of the Association of Principals of Agricultural Colleges, Association of Agricultural Teachers of South Africa and Higher Education South Africa. The strategy brings about one agenda for Agricul-tural Education and Training for the fi rst time in the history of South African agri-cultural education.
The number of farmers and farmworkers trained in small-stock management in-creased from 200 in 2004/05 to 614 in 2005/06.
Various protocols on the import and export of agricultural commodities between South Africa and China were completed and are ready for signing. This opens an opportunity for South African farmers to benefi t from the huge Chinese market.
9: Programme Planning, Monitoringand Evaluation
PIMSA was launched nationally.
The M&E system for organisational performance was established.
OVERVIEW OF THE SERVICE DELIVERY ENVIRONMENTOVERVIEW OF THE SERVICE DELIVERY ENVIRONMENT
The department operates in an environment with linkages across the agricultural sector and the broader economy, both of which infl uence and are, in turn, infl uenced by developments within this environment. While some external changes can be anticipated and accommodated to a certain extent, it is not possible to plan for every contingency, particularly when changes arise in cases where the department has limited infl uence.
During the year under review, the department had to contend with challenges such as outbreaks of animal and plant diseases, widespread drought and severe skills development backlogs throughout the agricultural sector. In many cases, these developments necessitated a reprioritisation of funding and other resources, requiring the department to provide additional resources in some areas, while still attending to the original objectives to which we were com-mitted in the Strategic plan 2005.
During the period under review, the department had a great impact on service delivery in the following areas.
Risk management and assessment for animal disease control
• InfoPaks were distributed on Classical Swine fever and skin conditions in dogs. These will assist farmers in cop-ing better and will promote understanding of the diseases during outbreaks. With such information, outbreaks can even be avoided, as farmers will have improved and informed disease control mechanisms.
• Regulations for a new animal health policy, with inputs from the provinces, have been completed. The latter in-puts to the policy will be included before dissemination to the targeted audience.
Training of marking operators
A marking operators’ course was presented to black marking operators as a contribution towards black economic empowerment.
Permits, registrations, certifi cates, protocols
The department concentrated on the following services in order to promote participation of South African agriculture in the global environment:
• Export of table potatoes to Zambia. An agreement was concluded with our Zambian counterparts.
• Verifi cation of the good agricultural practices for effective control of regulated pests for enhanced trade relations between South Africa and the USA was completed.
• Negotiations took place for the visit of a USDA APHIS expert to evaluate the application of the good agriculturalpractices documents.
• Training of exporters on phytosanitary certifi cation was undertaken.

Programme performance22
Mafi sa and mentorship
The LRAD database was completed and offi cials have been trained to provide mentorship for the benefi ciaries. The Mpumalanga Province has been identifi ed for the roll-out of a mentorship policy.
Inspections
Numerous policies and InfoPaks on pesticides such as the pesticide policy, were issued during the period under review, as well as an operational manual for the African Stockpile system and a policy document for accreditation of analytical laboratories. Implementation and maintenance of the Wine on Line system, food control system, provin-cial audits, policies on stock remedies, animal feeds and also export certifi cation supervisory services were com-pleted.
Soil conservation and water management
A number of projects were completed and are operational:
• KwaZulu-Natal dipping tank project: 48 boreholes were drilled
• Access roads project in Rust de Winter, Limpopo Province
• Sigeni water runoff control project in KwaZulu-Natal
• Sekgopo water runoff control project
• School Food Gardens project: 25 boreholes were drilled.
Foot-and-mouth disease (FMD) border fencing
The Punda Maria project is in progress and will provide assistance in border control for animal disease manage-ment. At Phalaborwa the existing damaged FMD border fence was removed and replaced by a new fence.
Issuing market access import and export permits
All import and export permits due were issued on time.
Seed testing and auditing services
Altogether 294 samples were tested for purity and for germination. These consisted of 93 trade control samples and 201 import samples.
Plant quarantine and plant health diagnostic services
Registration and approval for the participation of production units and packhouses for citrus exports through special programmes (China, EU, Japan, South Korea and the USA) for the 2005 export season was a major achievement.
Project management system
The Directorate Water Use and Irrigation Development effectively installed a project management system during the year under review. This system enables the directorate to plan, implement and report on projects in detail. It also provides the required output to PIMSA and other reports. The effective use of information and available tools has resulted in improved planning and implementation of projects.
CONSTRAINTSCONSTRAINTS
The following constraints that had an adverse impact on service delivery were identifi ed.
Lack of human resources
During 2005/06, a lack of suffi cient human resources impacted negatively on the department’s capacity to render services. This was mainly as a result of the high vacancy rate and severe skills development backlog in the agricul-tural sector.

DoA Annual report 2005/06 23
Information technology services
With regard to information technology services, the following problems were identifi ed:
• SITA was appointed to develop an agricultural marketing information system. However, a new service provider had to be appointed to complete the system after SITA’s contract was terminated as a result of a lack of com-mitment to complete the project on time. The appointment of a new contractor impacted negatively on the planned timely conclusion of the project.
• Combud system—problems were experienced with the use of the programme and understanding commercial production systems, especially with regard to the capturing of the correct data on the Combud system, which is used mainly by economists.
• The implementation and stabilisation of the Wine on Line/LIMS interface took longer than expected, which re-sulted in an increase in costs and diffi culty to remain within the approved budgets.
Legal services
With respect to legal services the following adversely affected performance:
• The lack of legal experts who are literate in the other offi cial languages
• The harmonisation of amendments with existing legislation, especially with regard to genetic resources.
OVERVIEW OF THE ORGANISATIONAL ENVIRONMENTOVERVIEW OF THE ORGANISATIONAL ENVIRONMENT
At the end of 2005 the department’s organisational structure was reviewed in order to align it with our strategic objectives, strategies and programmes. This led to the restructuring of the macro-organisational structure with an emphasis on strengthening the department’s capacity to provide an overview of the implementation of national programmes, including programmes under ASGISA.
The new, improved structure became effective on 1 April 2006. The aims of the restructuring were to enhance the organisation’s performance, increase the level of resource utilisation, improve service delivery, ensure better co-ordination between different parts of the organisation, and to assist in adapting to the changing needs of our clients. Further objectives of the process were to streamline activities, focusing on client needs, and to increase account-ability so that personnel can be held directly accountable for their performance. Another important consideration was fl exibility—to be able to respond quicker to future demands and to adapt to changing environmental infl uences.
The fi rst phase of the restructuring process involved the macro-organisational structure. Refi nement investigations will be conducted into the organisational units during the second phase in 2006/07.
Amendments included the reorganisation of the Branch Agricultural Production and Resources Management into two programmes to deal with all emerging diseases and to improve biosecurity and food safety measures. The Subprogramme International, Intergovernmental and Stakeholder Relations was created. It includes International Relations and Intergovernmental Relations (to give effect to the Intergovernmental Relations Framework Act of 2005) and Stakeholder Relations (to promote and facilitate relations with stakeholders to improve service delivery). To facilitate the alignment of the organisational structure with the budget structure, the current ‘’branches’’ will be renamed “programmes” to consolidate budget control and performance within a programme.
STRATEGIC OVERVIEW AND KEY POLICY DEVELOPMENTSSTRATEGIC OVERVIEW AND KEY POLICY DEVELOPMENTS
The most important challenge for the agricultural sector was to provide suffi cient and affordable food. This was not only important in the international and regional context, but also at household level. The importance of agriculturemanifests in its contribution to the GDP, its backward and forward linkages in the economy, its share of the labour force, and its contribution as an earner of foreign exchange.
Since 1994, agriculture has provided more and better opportunities for participants in the sector through increased access to foreign markets, smallholder participation in value chains (emerging farmers now have access to equity ownership in AgriBEE, enabling them to increase production), institutional change, and greater co-operation among the major role players in the sector. Furthermore, deregulation of local and international markets and preferential trade agreements with a number of countries and trading blocs have created signifi cant trade opportunities forSouth African agriculture and farmers.

Programme performance24
Another important challenge for the department has been ensuring that animal and plant products are disease-free,therefore improving public health. This still remains a priority as it has a direct bearing on agriculture’s ability to provide safe and nutritious food to the South African public, as well as the country’s ability to take advantage of trade opportunities.
In order for agriculture to provide for national and household food security, it is critical that the problem of land deg-radation—the most serious threat to agricultural biodiversity—be addressed. To this end, the department continued with the implementation of the LandCare Programme that promotes sustainable land use practices in commercial and subsistence farming areas. The Agricultural Geo-referenced Information System (AGIS) provides tools for identifying areas that are affected and also indicates how sensitive the natural resource base is to degradation.
Agricultural credit scheme
Mafi sa is a government intervention to spread micro-credit and saving services to economically active, poor, rural people and households, small farmers and agribusinesses. The objectives of the scheme are to contribute to stimulating the extension of fi nancial markets and economic growth, to improve national household food security, to increase employment in the rural areas (thereby reducing migration to urban centres) and to reduce poverty and inequalities in land and enterprise ownership. The scheme focuses particularly on women, youth and the disabled.
The credit scheme was launched in Limpopo, Eastern Cape and KwaZulu-Natal and was then rolled out to the other provinces. Provincial steering committees are responsible for implementation. Institutions will be participating in the scheme as fi nancial intermediaries, once their capacity for outreach has been established.
Comprehensive Agricultural Support Programme
Over the past number of years, considerable resources have been directed at providing access to land for agricul-tural production to previously disadvantaged individuals. However, farmer support and advisory services have not kept pace with the disbursement of land grants. CASP is a central focus for the department, targeting the benefi ci-aries of land and agrarian reform. The programme is a response to the lack of adequate provision for agricultural development.
Provincial departments of agriculture, as implementing agents for the support programme, initially focused on pro-viding infrastructure; however, it became clear that to achieve the intended results a full roll-out of the programme was needed. In the fi rst years, signifi cant underspending and roll-overs also indicated that provincial departments were facing capacity constraints. Recommendations to improve the provision of agricultural support include review-ing grant conditions, business processes relating to the identifi cation and approval of projects, business plans and timeframes for reporting.
Agricultural BEE framework
The AgriBEE framework is the department’s contribution to improving equitable access to and participation in agri-cultural opportunities, deracialising land and enterprise ownership and unlocking the full entrepreneurial potential in the sector. The framework was developed in collaboration with agricultural stakeholders.
Business models are being tested with selected commodity groups and local development organisations on how best to integrate emerging participants into mainstream agriculture. Evaluation and monitoring systems for AgriBEEactivities are being established by means of implementation and monitoring workshops at the national, provincial, regional and local levels. Selected service providers will conduct training workshops on the impact and relevance of AgriBEE on local municipality delivery levels and the agricultural sector.
DEPARTMENTAL REVENUE, EXPENDITURE AND OTHER SPECIFIC TOPICSDEPARTMENTAL REVENUE, EXPENDITURE AND OTHER SPECIFIC TOPICS
Collection of departmental revenue
The department’s collected revenue is in line with its annual budget for the sale of goods and services. The sale of scrap, which had an additional infl ow of R8,201 million, was not included in the budget. A transfer of R300 000 as a donation, not budgeted for, was received to cover expenses in respect to the Female Farmer of the Year Awards. Interest of approximately R9 million due on 31 March 2006 was not received from the Land and Agricultural Devel-opment Bank.

DoA Annual report 2005/06 25
2002/03ActualR’000
2003/04ActualR’000
2004/05ActualR’000
2005/06TargetR’000
2005/06ActualR’000
% deviation from targetR’000
Non-tax revenue
Sales of goods and services other thancapital assets
50 146 54 556 62732 55 799 71 695 28
Administrative fees 46 348 50 807 58 252 47 643 59 023
Sales of goods and services 3 723 3 740 4 477 8 156 4 456
Sale of scrap, waste and other used current goods
75 9 3 – 8 216
Transfers received 10 13 – – 300
Public corporations and private enterprises 10 13 – – 300
Fines, penalties and forfeits 21 1 16 3 54 1 700
Interest, dividends and rent on land 11 484 10 937 14 193 9 358 1 596 (83)
Interest 10 261 10 279 13 994 9 236 654
Rent on land 1 223 658 199 250 942
Sales of capital assets (capital revenue) – 9 003 11 865 271 208 (23)
Other capital assets – 9 003 11 865 271 208
Financial transactions (recovery of loans andadvances)
12 801 161 019 11 814 2 016 2 283 13
Total departmental receipts 74 462 235 529 100 620 67 447 76 136 13
Departmental expenditure
The table indicates how actual expenditure differed from planned expenditure. The virements that were effectedbetween the programmes were mainly to provide funds for the outbreak of Classical Swine fever during September 2005 in the Eastern Cape Province. At that point in time the estimated cost to combat the disease was R39,93 mil-lion for which an additional amount of R20,4 million was allocated to the department in the Adjustments Estimate. The department, through prioritising its budget and shifts between programmes, contributed R19,5 million. However, the disease spread, and is still ongoing, forcing the department to provide more funds for this purpose. Not all claims in respect of the campaign were received before the end of the fi nancial year and the department has requested that its surplus for 2005/06 be rolled over to 2006/07 to provide for this campaign in the latter part of the year.
Programmes
Voted for 2005/06
Roll-oversandadjustments
Virement Total voted
Actualexpenditure
Variance
R’000 R’000 R’000 R’000 R’000 R’000
Administration 170 480 (1 676) (3 643) 165 161 159 758 5 403
Farmer Support and Development 476 791 250 749 (12 757) 714 783 696 728 18 055
Agricultural Trade and Business Development
95 783 (27 747) (5 443) 62 593 38 764 23 829
Economic Research and Analysis 25 590 (2 110) (1 878) 21 602 17 760 3 842
Agricultural Production 407 648 8 505 502 416 655 414 250 2 405
Sustainable Resources Managementand Use
177 252 (1 386) (5 967) 169 899 168 206 1 693
National Regulatory Services 230 513 31 639 26 758 288 910 267 331 21 579
Communication and Information Management
92 716 25 056 2 586 120 358 108 716 11 642
Programme Planning, Monitoring and Evaluation
7 965 – (158) 7 807 6 495 1 312
Total departmental expenditure 1 684 738 283 030 – 1 967 768 1 878 008 89 760

Programme performance26
Transfer payments
TRANSFERS TO PROVINCES
Name of institutionAmount transferred Estimated expenditure
R’000 R’000
Eastern Cape ProvinceFree State ProvinceGauteng ProvinceKwaZulu-Natal ProvinceLimpopo ProvinceMpumalanga ProvinceNorthern Cape ProvinceNorth West ProvinceWestern Cape Province
65 55239 088
7 72759 27066 78644 12935 14854 59437 706
65 55239 088
7 72759 27066 78644 12935 14854 59437 706
Total 410 000 410 000
These transfers include payments in respect of LandCare (R40 million), CASP (R250 million) which provides post-settlement support to targeted benefi ciaries of land reform, and funds provided for drought relief (R120 million).Some provinces experienced capacity and procurement problems and were unable to spend their full allocations for the year. These constraints are being attended to with intervention and assistance from the department.
TRANSFERS TO LOCAL GOVERNMENTS
Name of institutionAmount transferred Estimated expenditure
R’000 R’000
Various governments– Regional Services Council– Vehicle licences municipalities– Vehicle licences provincial department
1 124598
70
992298
42
Total 1 792 1 332
TRANSFERS TO PUBLIC ENTITIES
Name of institutionAmount transferred Estimated expenditure
R’000 R’000
National Agricultural Marketing CouncilAgricultural Research CouncilNcera Farms (Pty) Ltd
13 961360 902
2 377
13 961360 902
2 372
Total 377 240 377 235
The National Agricultural Marketing Council undertakes investigations and advises the Minister for Agriculture and Land Affairs on agricultural marketing policies. The Agricultural Research Council is a statutory body and is the principal agricultural research institution in South Africa. The National Student Financial Aid Scheme was appointed by the department to manage its external bursary scheme for students undertaking studies in the agricultural fi eld.
TRANSFERS TO FOREIGN ORGANISATIONS
Name of institutionAmount transferred Estimated expenditure
R’000 R’000
Offi ce International des EpizootiesInternational Seed Testing AssociationOrganisation for Economic Co-operation and DevelopmentInternational Union for the Protection of New Varieties
5403095
282
5302865
257

DoA Annual report 2005/06 27
Name of institutionAmount transferred Estimated expenditure
R’000 R’000
International Grains CouncilOffi ce International de la Vigne et du VinFood and Agriculture Organisation of theUnited NationsInternational Commission of AgriculturalEngineeringConsultative Group on International Agricultural ResearchCommonwealth Agricultural BureauInternationalRegional Food Security Training ProgrammeForeign rates and taxesInternational Cotton Advisory CouncilWorld Food Programme
117382
10 203
2 961
3 094
247
2150138
140 000
117375
10 203
–
3 094
246
–22
137140 000
Total 158 241 155 074
With the exception of foreign rates and taxes (R150 000) and the contribution to the World Food Programme (R140 million) the rest of the transfers represent membership fees to organisations approved by Parliament.
TRANSFERS TO DEPARTMENTAL AGENCIES
Name of institutionAmount transferred Estimated expenditure
R’000 R’000
Water Research CommissionNational Student Financial Aid SchemePublic Service Education and Training Authority (now called AgriSETA)
2 1288 300
420
2 1288 300
420
Total 10 848 10 848
TRANSFERS TO PUBLIC CORPORATIONS AND PRIVATE ENTERPRISES
Name of institutionAmount transferred Estimated expenditure
R’000 R’000
ESKOMRed Meat Industry ForumLand and Agricultural Development Bankof SAClaims against the StateNon-life insurance premiums
381
144 000
42045
––
144 000
413–
Total 144 504 144 413
TRANSFERS TO NON-PROFIT INSTITUTIONS
Name of institutionAmount transferred Estimated expenditure
R’000 R’000
National Emergent Red Meat Producers’OrganisationFruit industryPoultry industry
300
179300
300
179300
Total 779 779

Programme performance28
TRANSFERS TO HOUSEHOLDS
Name of institutionAmount transferred Estimated expenditure
R’000 R’000
Porcine respiratory and reproductive syndromeAvian influenzaSocial benefi tsClassical Swine feverAgriBEE
3 000
4 9302 277
34 2705 000
2 985
4 9301 344
25 366–
Total 49 477 34 625
CAPITAL INVESTMENT, MAINTENANCE AND ASSET MANAGEMENT PLANCAPITAL INVESTMENT, MAINTENANCE AND ASSET MANAGEMENT PLAN
Capital investment
The only project currently in progress is the building of additional offi ce space at the Plant Health Quarantine Sta-tion, Stellenbosch. The proposed completion date is March 2007.
The Animal Quarantine Station (Durban) is to be relocated to a site identifi ed by the Department of Agriculture and the Department of Public Works. A Property Development Programme is being undertaken by the Durban Munici-pality at the site where the Quarantine Station is currently situated, hence the need for relocation.
A priority list, depending on the availability of the allocated capital works budget, is in the process of being submitted to the Department of Public Works following the terms of the Memorandum of Understanding between the Depart-ment of Public Works and the Department of Agriculture.
Maintenance
The maintenance expenditure was kept within the planned expenditure framework for the 2005/06 fi nancial year. All expenditure for maintenance and repairs was fi nalised in terms of the normal procurement processes and was therefore market related.
The maintenance backlog at various government-owned buildings occupied by the department is being addressed in terms of a Repairs and Maintenance Programme (RAMP). A RAMP amounting to R20 million over a three-year period is currently in process at Harvest House. The RAMP at Harvest House is on schedule and is being super-vised by the Department of Public Works. The backlog in the maintenance of buildings has, therefore, decreased accordingly. The implementation of the Energy Saving Project at Agriculture Place is also contributing to a decrease in the maintenance costs regarding electric light fi ttings.
A RAMP has also been registered with the Department of Public Works for the upgrade of the Maize Board Building, focusing on repairs to the electrical power supply system and the air-conditioning system.
Asset management
Asset holdings have changed over the period of review through disposal of assets by means of public auctions held at Stellenbosch, Grootfontein Agricultural Development Institute (GADI) and Head Offi ce.
The department is using LOGIS as an asset management system. All procurement of assets is captured on the asset register by means of receipts. The asset register is also monitored/updated on a monthly basis. In addition, the asset register is maintained by means of annual stocktaking. The current state of capital stock procured during the period under review is good.
It is envisaged that the department will commence with the building of an additional offi ce building at Plant Health Quarantine Station in Stellenbosch during the 2006/07 fi nancial year.
The Department of Public Works handles the necessary tendering processes for building projects. The prescribed Supply Chain Management processes are adhered to by the department for the procurement of moveable assets.

DoA Annual report 2005/06 29
PROGRAMME 1PROGRAMME 1
Administration
Administration conducts the overall management of the department and provides strategic leadership and corpo-rate services through the activities of the Minister and senior management. It provides fi nancial, procurement, legaland IT services; an internal audit; human resource management and secretariat services. The programme also deals with agricultural debt collection.
The programme has two main components, namely Administration and Governance, and Financial Management.
Administration and Governance
This component provides the internal infrastructure of support that enables customer-oriented programmes to meet their strategic objectives through optimal use of people, information communication technology and legal expertise.
Financial Management
Tommie Marais
ASSISTANT DIRECTOR-GENERAL

Programme performance30
This component ensures sound fi nancial management, evaluates the feasibility of programmes and projects, renders fi nancial and supply chain management services, manages agricultural debt and co-ordinates budgetary matters. At all times, these activities are governed by the Public Finance Management Act of 1999, the Treasury Regulations and the Departmental Financial Instructions.
MEASUREMENT OF PERFORMANCEMEASUREMENT OF PERFORMANCE
A key result area of this programme is overall effective, effi cient and timely delivery on the department’s mandate within the allocated resources. Performance of this programme is therefore measured in terms of predetermined service standards as captured in the Strategic plan 2005.
Support services were rendered in terms of providing an enabling environment that supports the achievement of departmental objectives. Reporting on these services is not included in this report.

DoA Annual report 2005/06 31
PROGRAMME 2PROGRAMME 2
Farmer Support and Development
PURPOSEPURPOSE
To promote stability, competitiveness, growth and transformation in the agricultural sector by developing policies forfarmer settlement, food security and rural development, agricultural fi nance and co-operative development as well as risk and disaster management.
MEASURABLE OBJECTIVEMEASURABLE OBJECTIVE
Improve emerging farmers’ access to land and sustained participation in agriculture through appropriate policies and targeted programmes that will ensure viable farm businesses.
Sam Malatji
ASSISTANT DIRECTOR-GENERAL

Programme performance32
SERVICE DELIVERY OBJECTIVES AND INDICATORSSERVICE DELIVERY OBJECTIVES AND INDICATORS
Directorate OutputMeasure/indicators
Actual performance against target
Target Actual
Farmer Settlement Viable farm businesses
Proportion of viable farmbusinesses
Seventy percent of benefi ciaries of landreform have viable farmbusinesses by March2006
Although multiple efforts are made to achieve this target, such as consolidating informa-tion on the farm data, especiallyLRAD farms, the measure ofviability is diffi cult as it can onlybe assessed in years to come.
CASP support services are pro-gressing well as the align mentprocess is beginning to takeshape. A total of 542 projectsand 89 000 benefi ciaries were assisted as of the end of March2006.
Agricultural Financeand Co-operative Development
Agriculturalco-operativesestablished
Number of co-operativesestablished
Eighty new agriculturalco-operatives estab-lished by March 2006
A total of 84 agricultural co-operatives have been estab-lished in the nine provinces.
Food Security and Rural Development
FoodInsecurityVulnerabilityInformationMappingSystem(FIVIMS)
Number of ISRDP developmentnodes reached with FIVIMS
Twelve ISRDP nodes reached by March 2006
FIVIMS pilot project has beencompleted in one node. The resultant further work and consultations with clusterdepartments necessitated thedevelopment of the FIVIMS model for SA.
FIVIMS phase II project with fi ve components has been fi nalisedand implementation started inJanuary 2006. Atlas maps for Sekhukhune have been pro-duced and are in use by the local municipalities as part of the IDP.
Agricultural Risk andDisaster Manage-ment
Agriculturalrisk anddisastermanagementmeasures
Increase in thepercentage offarmers reached
Twenty percent increase in farmersreached annually
Target is not quantifi able asthere is no benchmark andfurther progress depends on theprovinces. Early warningmonthly advisories and climate change discussion information isdisseminated to provinces on a monthly basis.
The drought management planwas developed (in line with the Disaster Management Act of 2002), approved, gazetted forpublic comment and workshopswere held in three provinces forbroader inputs. The process is continuing.
SERVICE DELIVERY ACHIEVEMENTSSERVICE DELIVERY ACHIEVEMENTS
Outputs of the programme, as specifi ed in the Strategic plan 2005, are reported per quarter.

DoA Annual report 2005/06 33
First quarter
• Farmer-to-farmer mentorship policy was approved by DEXCO and submitted to ITCA.
• Technical problems were experienced with the development of the system for the electronic database of LRAD projects. However, information on LRAD projects was collected and kept manually while IT problems were beingsorted out.
• As part of the audit on unencumbered agricultural state land, the disposal of Ncera farms (Eastern Cape) and Hanover (North West) are in progress.
• A debtor system for rental payments was adopted and farmers have started utilising the system.
• Agriculture credit policy (lending scheme policy) for Mafi sa was drafted and submitted for approval. A credit committee was appointed for Mafi sa implementation.
• A service level agreement was concluded between the department and the Land Bank, and the Mafi sa budget was transferred to the Land Bank. A MoU between the department and the Post Bank was also fi nalised.
• A national SADC food security status report was fi nalised and submitted to SADC-FANR.
• All relevant stakeholders were consulted to fi nalise the draft food security policy. Guidelines were completed for the HFSP. SPFS project activities: 70 % complete in KwaZulu-Natal and the Eastern Cape.
• FIVIMS pilot report was fi nalised and a hand-over workshop was conducted on 4 May 2005.
• Early warning climate advisories for the agricultural sector were produced on a monthly basis and distributed electronically to national and provincial management including other stakeholders through e-mails, faxes and on the departmental and the AGIS websites. Brochures and banners on coping strategies during various disasters were developed and displayed and/or distributed during workshops.
• The draft drought management plan was submitted to the Minister for approval.
Second quarter
• The fi rst draft of the integrated co-operative development system was completed and will be incorporated into the guidelines on co-operative development and implementation plan on mobilisation of farmer organisation and self-help groups.
• A questionnaire was designed by ICT for the development of a co-operative data analysis system and was sub-mitted to the provinces for data capturing.
• A database template was developed for Financial Services Co-operatives to compile a Mafi sa database.
• A total of 45 co-operatives were established.
• Mafi sa was implemented as a pilot in the Sekhukhune nodal point in Limpopo Province on 30 May 2005.
• Household Food Production Programme (HFPP) guidelines were fi nalised. The provinces were briefed on HFPP guidelines and future implementation as well as the allocation of budgets to implement HFPP projects. The IF-SNP task team drafted a chronic food insecurity baseline arising from FIVIMS.
• The drought management plan was approved by DEXCO and the Minister for gazetting.
• The draft agricultural climate change discussion document was presented at STC (subcommittee of DEXCO).
Third quarter
• The disposal of unencumbered agricultural state land is in progress. The submission for the disposal of Ncera farms (Eastern Cape), and Hanover farms (North West) are awaiting ministerial approvals.
• Mafi sa was implemented as a pilot in the OR Tambo nodal point in the Eastern Cape Province on 5 July 2005. Provincial Steering Committees were also established to oversee the implementation of Mafi sa. The Mafi sa monitoring project has been initiated and preliminary analysis is being done on the applications received so far.
• A fi nal draft of the food security policy was submitted to DEXCO. A draft Food Security Bill is in its fi nal stage.
• A FIVIMS pilot survey was conducted in the pilot area of Sekhukhune. The outcome from the survey will be to create a model of food insecurity and determine a programme of action for the social cluster.
• Weather/climate awareness workshops were conducted in seven provinces. A report on an awareness pro-gramme on weather and climate for transfer of technology was produced.

Programme performance34
Fourth quarter
• FIVIMS was presented to the relevant senior management members of other social cluster departments, depart-mental directorates and structures such as PIMSA, National Disaster Management centre and the ISRDP/URP joint task team.
• Mafi sa was implemented as a pilot in the Mkhanyakude nodal point in KwaZulu-Natal Province on 9 October 2005.
• A service provider was appointed to assist in the establishment of a permanent Food Security Forum.
• An information working group under the IFSNP task team was established and a service provider for the devel-opment of the FIVIMS model was recruited.
• The agricultural disaster management plan was drafted and submitted to DEXCO for approval.
• A drought mapping project proposal was fi nalised with the ARC to establish a database of disaster prone areas (vulnerability assessment).
• A report on awareness on agricultural risk and disaster management was fi nalised.
CHALLENGES AND RESPONSES TO CHALLENGESCHALLENGES AND RESPONSES TO CHALLENGES
Challenge 1 Institutionalisation of FIVIMS and integration of other IFSNP related databases and information.
Response to challenge 1 Development of FIVIMS model: A service provider was recruited by WFP to review international and national modelling experiences, in-cluding fi ndings from the pilot phase to assist in identifying the best modelling approach for SA. Roll-out and further testing the system and handing over to relevant municipalities took place.
Challenge 2 There are numerous mentorship programmes which are being implemented in the provinces and are not standardised with the guidelines in the national farmer mentorship policy.
Response to challenge 2 Discussions are continuing with the provinces and stakeholders to 2align the current policies with the national framework.
Challenge 3 The LRAD database system is disabled owing to the fact that some provincial offi ces are still without access to the Intranet.
Response to challenge 3 Continue to liaise with the Directorate Information and Communica-3tion Technology of the department and provide ICT facilities to all national project co-ordinators who are working in the provinces in order to update the database on a continuous basis.

DoA Annual report 2005/06 35
PROGRAMME 3PROGRAMME 3
Agricultural Trade and BusinessDevelopment
PURPOSEPURPOSE
To develop policies to enhance access to national and international markets and promote broad-based black eco-nomic empowerment in the sector.
MEASURABLE OBJECTIVEMEASURABLE OBJECTIVE
Promote the development of agribusinesses, competitive markets and a freer international trade environment by providing agribusiness development support, equitable market access and trade opportunities in order to maximise growth, employment and equity in the sector.
Attie Swart
ASSISTANT DIRECTOR-GENERAL

Programme performance36
SERVICE DELIVERY OBJECTIVES AND INDICATORSSERVICE DELIVERY OBJECTIVES AND INDICATORS
Directorate Output Measure/indicatorsActual performance against target
Target Actual
Business andEntrepreneurialDevelopment
Agricultural business partnerships
Number of commodity action plans focusingon value addition
Four commodity action plans by March2006
Plans for cotton andgrain accepted by theDoA and the fruitcommodity action plan nearing conclusion.
International Trade Negotiating positions and plans
Number of issue-based positions developed
Ten position papersand reports on opportunities and constraints by March2006
Agricultural Trade Foruminformed six-weekly onall negoti-ations andopportunities. Altogether 29 position papers andreports were producedby March 2006.
Marketing Marketing information Number of farmers in rural developmentnodes reached bydepartment’smarketing informationproject
The majority of LRADfarmers in 3 ISRDPnodes by 2006
A total of 42 200marketing informationbooklets were distrib-uted to all provincialdepartments for re-distribution to farmers.
SERVICE DELIVERY ACHIEVEMENTSSERVICE DELIVERY ACHIEVEMENTS
Further information on outputs of the programme, as specifi ed in the Strategic plan 2005, is provided per quarter.
First quarter
• The draft AgriBEE implementation plan was fi nalised and submitted to the AgriBEE Steering Committee (SC).
• Norms and standards for the establishment of agricultural marketing infrastructure were completed and submit-ted to DEXCO for approval.
• The SACU technical visit to India was postponed by the Department of Trade and Industry as a result of a delay in the negotiating agenda.
• Commodity-based agricultural marketing value chains/industry profi les were drafted.
Second quarter
• A large-scale AgriBEE scorecard was drafted and the AgriBEE framework was fi nalised. The SC presented the fi nal AgriBEE report to the Minister.
• The agricultural SMME Strategy was aligned to CASP and submitted to DEXCO for approval. The Grain Strat-egy has been fi nalised and is awaiting DEXCO approval.
• Draft commodity-based agricultural marketing value chains/industry profi les were completed. Further enhance-ment of the profi les is in progress.
• The development of an agricultural marketing information system is in progress.
• Parliamentary Committees were briefed on agricultural trade matters.
• The development of an Agro-logistics Strategy is in progress.
• The impact study on SACU/India free trade agreement (FTA) was completed.
Third quarter
• AgriBEE charter and scorecard were approved in principle at the AgriBEE Indaba held on 6–7 December 2005.

DoA Annual report 2005/06 37
• The Grain Strategy and SMME Strategy were fi nalised and are awaiting DEXCO approval.
• The national launch of the agricultural marketing information system was postponed as a result of the technical complexity of the system. The launch can only take place once SITA has concluded the development of the project.
• Draft agricultural marketing training material for grains, livestock, horticulture and industrial products was pro-duced.
• Good progress is being made to update information for the market access constraints in Africa.
• The market research report on intra-Africa trade is due in the fourth quarter. Studies on Nigeria and Tanzania were completed, but progress is slow because of new offi cials who are still in training.
• The permit allocation policy was amended.
Fourth quarter
• The AgriBEE Section 12 charter process is at a fi nal stage. An operational manual for the AgriBEE fund was drafted, discussed at DEXCO and approved in principle. A draft brochure on AgriBEE offerings was compiled.
• Draft country reports on intra-African trade and market access constraints were completed for Angola, Kenya, Mozambique, Ghana and the Democratic Republic of the Congo.
• The draft report on market access constraints in Africa was completed.
• The development of the agricultural marketing information system is unduly delayed by SITA’s inability to pro-vide the required expertise to complete the system as agreed.
• The agricultural marketing environment review is in progress. A publication inviting public comment was issued in six major print media and comments are still coming through.
• Inputs on norms and standards for training on agricultural marketing skills development were provided.
• The report on norms and standards was concluded and the document will be submitted to the Minister for ap-proval as a national guideline towards an agricultural marketing infrastructure investment plan.
• The China study of economic impact on proposed SACU/China FTA was completed.
• The Department of Trade and Industry has not yet announced the start of negotiations concerning the SACU visit to China.
CHALLENGES AND RESPONSES TO CHALLENGESCHALLENGES AND RESPONSES TO CHALLENGES
Challenge 1 A great deal of time is spent on staff induction and training.
Response to challenge 1 Finalise staffi ng gaps and expose new recruits to the working envi-ronment in order to familiarise them with the challenges.
Challenge 2 The planned technical visit to India with ATF members and the Department of Trade and Industry has been postponed repeatedly by the Department of Trade and Industry owing to delays in the negotiating agenda.
Response to challenge 2 Greater focus and further resources will be given to the WTO, India, China and intra-Africa trade initiative.
Challenge 3 SITA is unable to complete the computerised marketing information system in time as a result of the technical complexity of the system.
Response to challenge 3 SITA’s contract was terminated due to non-delivery and a new serv-3ice provider was appointed to develop the system. The system is planned to be operational by the end of June 2006.

Programme performance38
PROGRAMME 4PROGRAMME 4
Economic Research and Analysis
PURPOSEPURPOSE
To provide information for developing and monitoring the agricultural sector.
MEASURABLE OBJECTIVEMEASURABLE OBJECTIVE
Provide timely, accurate and pertinent agricultural economic and statistical information on a quarterly basis to in-form decision making on production by all participants in the agricultural sector.
Rodney Dredge
ASSISTANT DIRECTOR-GENERAL
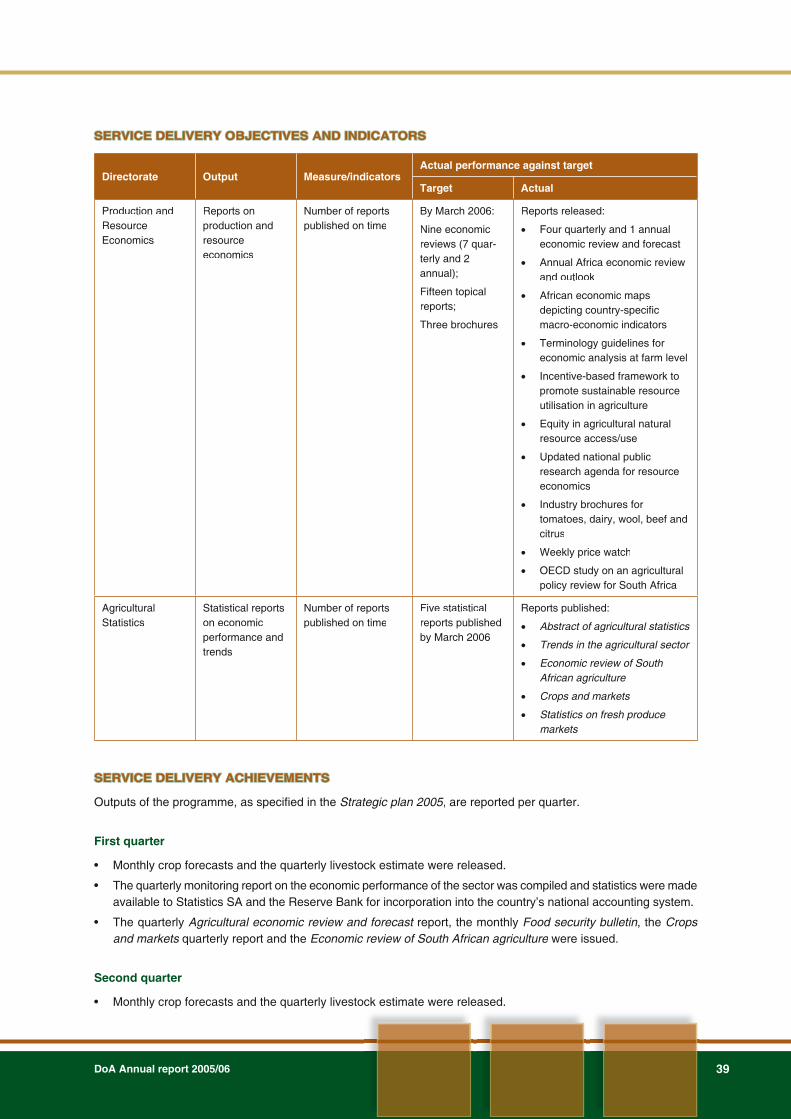
DoA Annual report 2005/06 39
SERVICE DELIVERY OBJECTIVES AND INDICATORSSERVICE DELIVERY OBJECTIVES AND INDICATORS
Directorate Output Measure/indicatorsActual performance against target
Target Actual
Production andResourceEconomics
Reports on production and resourceeconomics
Number of reportspublished on time
By March 2006:
Nine economicreviews (7 quar-terly and 2 annual);
Fifteen topical reports;
Three brochures
Reports released:
Four quarterly and 1 annualeconomic review and forecast
Annual Africa economic reviewand outlook
African economic maps depicting country-specifi c macro-economic indicators
Terminology guidelines foreconomic analysis at farm level
Incentive-based framework topromote sustainable resource utilisation in agriculture
Equity in agricultural naturalresource access/use
Updated national publicresearch agenda for resource economics
Industry brochures fortomatoes, dairy, wool, beef and citrus
Weekly price watch
OECD study on an agriculturalpolicy review for South Africa
AgriculturalStatistics
Statistical reports on economicperformance and trends
Number of reportspublished on time
Five statisticalreports publishedby March 2006
Reports published:
Abstract of agricultural statistics
Trends in the agricultural sector
Economic review of South African agriculture
Crops and markets
Statistics on fresh produce markets
SERVICE DELIVERY ACHIEVEMENTSSERVICE DELIVERY ACHIEVEMENTS
Outputs of the programme, as specifi ed in the Strategic plan 2005, are reported per quarter.
First quarter
• Monthly crop forecasts and the quarterly livestock estimate were released.
• The quarterly monitoring report on the economic performance of the sector was compiled and statistics were made available to Statistics SA and the Reserve Bank for incorporation into the country’s national accounting system.
• The quarterly Agricultural economic review and forecast report, the monthlyt Food security bulletin, the Cropsand markets quarterly report and thes Economic review of South African agriculture were issued.e
Second quarter
• Monthly crop forecasts and the quarterly livestock estimate were released.

Programme performance40
• The quarterly monitoring report on the economic performance of the sector was compiled.
• Industry brochure on wool was issued and the quarterly Agricultural economic review and forecast report was tproduced.
• An African economic map depicting country-specifi c macro-economic indicators was produced.
• The monthly Food security bulletin, the Crops and markets quarterly report and the s Annual fresh produce statis-tics report were issued.s
• Terminology guidelines for economic analysis at farm level were produced and distributed to appropriate stake-holders.
• Information on short-term economic viability of soya-beans and sunfl ower production as part of the biofuels ini-tiative was released.
Third quarter
• Monthly crop forecasts and the quarterly livestock estimate were released.
• The quarterly monitoring report on the economic performance of the sector was compiled.
• Industry brochures on tomatoes and the dairy industry as well as the quarterly Agricultural economic review and forecast report were issued.t
• The fi rst annual Africa economic review and outlook report, the monthlyk Food security bulletin, the Crops and markets quarterly report and the weekly price watch reports were released.s
• The OECD agricultural policy review study and peer review exercise were completed and offi cially launched. The outcome of the study will be used to measure Government’s intervention in the sector.
• The Micro FINREC system was installed for implementation in the provincial departments of agriculture.
Fourth quarter
• Monthly crop forecasts and the quarterly livestock estimate were released.
• The quarterly monitoring report on the economic performance of the sector was compiled.
• The monthly Food security bulletin, the Crops and markets quarterly report, the s Economic review of the South African agriculture report, the e Abstract of agricultural statistics publication, the report ons Trends in the agricul-tural sector, the quarterly and annualrr Agricultural economic review and forecast reports were released. t
• A draft report on equity in agricultural natural resource access/use, and on energy demand in agriculture was produced.
• Industry brochures for beef and citrus and weekly price watch reports were published.
• An incentive-based framework to promote sustainable resource utilisation in agriculture was fi nalised.
• The national public research agenda for resource economics was updated.
• The review of the best management practices in agriculture was completed.
CHALLENGES AND RESPONSES TO CHALLENGESCHALLENGES AND RESPONSES TO CHALLENGES
Challenge 1 Large number of carry-over issues which could not be dealt with during the period under review as a result of capacity constraints.
Response to challenge 1 Some of the economic outputs published in the Strategic plan 2005were reprioritised for greater emphasis on service delivery. Priority was given to the development of national information systems and agricultural economics analysis tools. Although some progress was made with the implementation of the latest extended functions and the organisational structure of the Directorate Production and Re-source Economics, diffi culties were experienced in recruiting and retaining suitably skilled agricultural economists for this directorate. This has impacted on the ability of the directorate to deliver on all its commitments for the year under review. An appropriate human re-source strategy is currently being developed.

DoA Annual report 2005/06 41
Challenge 2 Inadequate analytical and advisory capacity.
Response to challenge 1 The department will always need analytical capacity to monitor the sector and advise on the different policy options it can adopt. It is prudent to start building such capacity immediately. The programme is therefore addressing the human resource challenge for agricul-tural economists in co-operation with other economics directorates and the Directorate Education and Training within the department, as well as within the provincial departments of agriculture. National and provincial workshops were held in order to get clarity on the dif-ferent categories of agricultural economists that are needed, achieve agreement on the functions of these different categories, explore the skills and training requirements of agricultural economists and to ex-plore the possibility of an interdepartmental internship programme. Even if the department is able to attract qualifi ed professionals, ap-preciation of their role will still be required in order to retain them as employees.
Challenge 3 Lack of a comprehensive and accurate statistical database on the agricultural sector.
Response to challenge 3 To enhance the effective planning, implementation and support of 3development initiatives, the department has to strengthen and main-tain its statistics management capacity at a level commensurate with the strategic importance of the function. Furthermore, additional ca-pacity and fi nancial backing are needed to provide evidence for as-sessing the department’s success in meeting its objectives.
Challenge 4 Improving the accuracy of the monthly crop forecasts/estimates.
Response to challenge 4 Improvements to the forecasting system are being addressed by 4means of a contract awarded to an ARC-led consortium. To comple-ment the existing point frame sample system, a new producer-inde-pendent survey system is being developed and implemented in the North West, Free State, Mpumalanga and Gauteng provinces. This new system entails the incorporation of in-season satellite and air-borne and remote earth observation imagery into the crop estimation system. The aim is to improve the accuracy of the forecasts/esti-mates to within 5 % of actual harvest.

Programme performance42
PROGRAMME 5PROGRAMME 5
Agricultural Production
PURPOSEPURPOSE
To promote agricultural research, productivity and sustainability as well as to monitor and control genetically modi-fi ed organisms.
MEASURABLE OBJECTIVEMEASURABLE OBJECTIVE
Provide information and technology on agricultural production systems so as to increase productivity and profi tabil-ity.
Shadrack Moephuli
ASSISTANT DIRECTOR-GENERAL

DoA Annual report 2005/06 43
SERVICE DELIVERY OBJECTIVES AND INDICATORSSERVICE DELIVERY OBJECTIVES AND INDICATORS
Directorate OutputMeasure/indicators
Actual performance against target
Target Actual
Animal and Aqua Production
Systems for improving animaland aquacultural production
Functional milk recording scheme, goat-milk productionmodels and poultryprogrammes
By March 2006 Goat-milk production scheme expanded to all provinces.
Document on norms andstandards for sustainableaquaculture was compiled and is under going consultations with stakeholders.
Poultry and livestock supportprogrammes were developed.
Plant Production Productionguidelines,programmes andprojects
Publication ofproduct specifi cproductionguidelines,programmes and projects
For grain, fruit andindustrial crops byMarch 2006
Guidelines for fruit, industrial and vegetable crops were completed.
Scientifi c Research and Development
Policy and programme onagricultural advisoryservices
Programme onagricultural advisoryservices in allprovinces
By March 2006 Provision of advisory serv-ices—printed and distributed more than 1 000 copies of thenorms and standards onextension and advisoryservices to all provinces.
The directorate receivedbusiness plans from fi ve provinces (Limpopo, KZN, Mpumalanga, Eastern Cape and Western Cape) on advisory services used forimplementation.
Genetic Resources Amendment toGenetically Modifi ed Organisms Act of 1997
Cabinet’s approval of Amended GMOAct of 1997
By September 2005 Cabinet approved the tabling of the Amendment Bill in May2005. The bill was tabled fordebate at the Portfolio Committee for Agriculture and Land Affairs in Parliamentduring October 2005.
SERVICE DELIVERY ACHIEVEMENTSSERVICE DELIVERY ACHIEVEMENTS
Further information on outputs of the programme, as specifi ed in the Strategic plan 2005, is provided per quarter.
First quarter
• The status report on the Integrated Registration and Genetic Information system (INTERGIS) was completed.
• The aquaculture programme in Limpopo, Mpumalanga and KZN was completed and provincial co-ordinators were identifi ed. The poultry support programme was developed in collaboration with the South African Poultry Association and the livestock support programme in collaboration with the ARC-AII.
• The Livestock Development Strategy was approved by ITCA.
• The game farming policy was approved and the ostrich and smallholder pig production guidelines are being fi -nalised for publication. Sites have been created on the AGIS website for information on small-stock and aquac-ulture.

Programme performance44
• Production guidelines for grain, industrial crops, ornamental plants, indigenous and vegetable crops are in dif-ferent stages of development. Policies on organic farming, fruit production and industrial crops were drafted and submitted to STC and DEXCO. The review of the Plant Improvement Act is in progress.
• A template for business plans for extension advisory services was discussed and agreed on by the provinces. A draft database on multilateral science and R&D organisations was developed with ICT.
• Amendments of the GMO Act were published in the Government Gazette and the comments received were in-ecorporated into the second draft that was approved by the Minister.
Second quarter
• Production guidelines are still in the process of being fi nalised. Information brochures for fruit, vegetables and industrial crops were drafted.
• Research projects were commissioned via the ARC for sorghum, millet, cowpea, bambara, groundnut, cassava, cotton, amaranthus, amadumbe and honeybush tea.
• The Minister approved norms and standards for business plans for agricultural advisory services in the prov-inces.
• Annual reports on R&D projects were commissioned in 2004/05—only preliminary reports are available from the ARC.
• Implementation of a prioritised R&D agenda—priorities and a research agenda were determined to develop a draft R&D Strategy.
• An agricultural intellectual property rights policy was drafted and is under consultation.
• Amendments to the GMO Act were approved by Cabinet.
• The Agricultural Biotechnology Strategy was published in the Government Gazette.
• The DITC approved the development of a National Biosafety Clearing House system. The system is still under development.
Third quarter
• The policy on organic farming has not been fi nalised yet. The policy on indigenous crops was approved by DEXCO for external consultation. The review of the Plant Improvement Act is still in progress.
• The report on the review of the Agricultural Research Act was completed and inputs from stakeholders were incorporated. The electronic database on multilateral science and R&D organisations was placed on the depart-mental Intranet and Internet and is currently available.
• Implementation of ad hoc research projects with the ARC and other R&D project proposals for 2005/06—a draft R&D Strategy will be discussed at the next NARF Steering Committee meeting in February 2006 and will ensure consensus on the governance structure and fi nancial mechanisms for agricultural research.
• Five provinces completed business plans for agricultural advisory services i.e. Limpopo, KwaZulu-Natal, Mpu-malanga, Eastern Cape and Western Cape.
• Three on-farm pilot projects on seed multiplication in the Eastern Cape, KwaZulu-Natal and Mpumalanga were put into operation. The website development for the Biosafety Clearing House database was completed.
• An awareness promotion on alternative food crops was carried out by an exhibition at the Extension Offi cers’ Summit in Polokwane, Limpopo from 12 to 14 October 2005. Information leafl ets on conservation landraces of farmers’ varieties were distributed at the exhibition.
• The GMO auditors’ manual was completed.
• The agricultural intellectual property rights policy draft was revised.
• The GMO Amendment Bill was presented to the Parliamentary Portfolio Committee for Agriculture and Land Affairs and published for further consultations. Public hearings were scheduled for January 2006.
• The policy on plant breeders’ rights was merged with the agricultural intellectual property rights policy.

DoA Annual report 2005/06 45
Fourth quarter
• Business plans were developed and programmes linked to the accelerated and shared growth initiative (ASGI-SA) goat productivity improvement programme and livestock development programme.
CHALLENGES AND RESPONSES TO CHALLENGESCHALLENGES AND RESPONSES TO CHALLENGES
Challenge 1 With business plans for the development of goat-milk production schemes done, the challenge is securing funding for upscaling the current goat projects (Kgalagadi, Umzimvubu and UP goat milk) within ASGISA.
Response to challenge 1 An awareness programme for participation in the scheme to facilitateresource mobilisation and to obtain additional resources to support upscaling within the context of ASGISA.
Challenge 2 Diffi culty in obtaining accurate information for South African conditions and the need to verify this by external experts.
Response to challenge 2 The programme must have access to reference material, such as 2the CABI digital library, on various crops.

Programme performance46
PROGRAMME 6PROGRAMME 6
Sustainable Resources Managementand Use
PURPOSEPURPOSE
To develop, implement and monitor policies on managing and using land and water resources in agriculture.
MEASURABLE OBJECTIVEMEASURABLE OBJECTIVE
Conserve natural agricultural resources through developing, implementing and monitoring policies as well as norms and standards aimed at promoting the sustainable use of natural agricultural resources.
Sizwe Mkhize
ASSISTANT DIRECTOR-GENERAL

DoA Annual report 2005/06 47
SERVICE DELIVERY OBJECTIVES AND INDICATORSSERVICE DELIVERY OBJECTIVES AND INDICATORS
Directorates OutputMeasure/indicators
Actual performance against target
Target Actual
Water Use andIrrigationDevelopment
Groundwateratlas
Fixed pointmonitoring in all 19 quaternarycatchments
By March 2006 The underground water atlas has been developed. Data from more than 210 000boreholes on the national geohydrologydatabase were captured.
The atlas is on a 1:250 000 scale. Refi ne ment of the atlas to a scale of1:50 000 will be done jointly with DWAF over the next three years to be used atdistrict level for planning of the develop-ment of groundwater for stock wateringpurposes.
At present the data can be used at provincial level to plan groundwaterdevelopment for stock watering purpos-es. The use of the atlas combined with other available tools has increased success rates on projects by 50 %.
Land Use and Soil Management
Soil loss map Fixed pointmonitoring in all provinces
2 000 sites by March 2006
The 2 000 sites for the monitoring system were selected by means of a random stratifi ed sampling technique. All baseline data for the sites were extracted. Thefi eld survey techniques were fi nalised.
All sites are currently being visited and evaluated in terms of their suitability.
The fi rst progress report was completed.
The SPOT 5 imagery system was piloted in priority areas for the Soil Protection Strategy (highly erodable Mthathacatchments in the Eastern Cape and high-potential soils in KZN midlands andLimpopo).
SERVICE DELIVERY ACHIEVEMENTSSERVICE DELIVERY ACHIEVEMENTS
Outputs of the programme, as specifi ed in the Strategic plan 2005, are reported per quarter.
First quarter
• Guidelines for DORA projects: the fi nal business plan formats and guidelines for CASP and LandCare were circulated to the provinces and fi nalised after receiving comments.
• As part of the report on advisory engineering support, a scoping report for the area-wide planning of Sterkspruit was prepared. A technical evaluation of Hydrex products was also undertaken and a report submitted to all provincial engineers. Seven boreholes were drilled for school gardens.
• A strategy for effective upgrading and maintenance of the FMD border fences was developed. An implementa-tion plan was added to the strategy and this provided plans and specifi cations for the total fence. The upgrading of the FMD border fence will progress according to budget availability.
• Draft 12 of the SUAR Bill was fi nalised.

Programme performance48
• Funds were requested from AusAID for activities for a period of one year to develop a report on the establish-ment of the LandCare network for Africa.
Second quarter
• The Rust de Winter project consisting of 200 km of access roads, fi rebreaks and water runoff control structures on the roads in Limpopo (1999–2005), the Sigeni project consisting of the repair of fl ood damaged water runoff control infrastructure on 10 000 ha in KwaZulu-Natal (1999–2005) as well as the Sekgopo project consisting of the removal of invasive plants and the construction of water runoff control infrastructure on 2 000 ha in Limpopo (2001–2005) were completed.
• A Southern African Regional Irrigation Association workshop was held in February 2006 in Pretoria. Countries presented a status report on irrigation in their countries and highlighted opportunities and concerns. Mr Felix Reinders of the Agricultural Research Council was elected as Vice-President of the International Committee on Irrigation and Drainage with Africa as the area of responsibility. Continued technical support from South African experts and knowledge and information exchange through a partnership with the Water Research Commission are main thrusts to improve water use in Africa.
• The SUAR Bill was presented to the DEXCO subcommittees STC and ASRDC for recommendation as well as to DEXCO for approval.
• Literature of fi xed-point agricultural resource monitoring systems used in other countries was reviewed to de-velop a suitable system for South Africa.
Third quarter
• Altogether 71 boreholes were drilled for the KwaZulu-Natal dipping tank project, of which 33 were successful.These boreholes were in support of the enhanced animal health project in the province involving the repair and upgrading of dipping tanks for improved animal health management.
• In support of LandCare and the CASP, 12 boreholes were drilled (3 at Mthatha and 9 at Calvinia), of which 11 were successful.
• An area wide planning and scoping report on agricultural infrastructure for Sterkspruit, requested by the Eastern Cape Province, was completed. The province will be responsible for detailed project implementation.
• The SADC biofuel initiative focuses on nonfood crops as feedstock. South Africa has taken the opposite view, namely that crops that can be used both for food and biofuel production are targeted to ensure food security and address the yearly production variations experienced as a result of climate factors. While biofuel provides an opportunity to agriculture, the sustainable use of agricultural resources and economic viability issues have to be addressed appropriately.
• The guidelines for on/off-farm infrastructure support under the CASP were revisited and adjustments made ac-cording to the input received by the task team appointed.
• Advisory engineering support was provided on request from the provinces. While 31 minor requests involving technical matters were dealt with, the two major interventions were the Sterkspruit and Vaalharts/Taung projects, where 2 170 man days were spent on collecting information to draft scoping reports for the projects. The prov-inces involved were also exposed to the area wide project planning approach.
• The upscaling of rainwater harvesting was supported by means of a contribution to develop training material as part of the existing strategy to the Water Research Commission project from which more than 10 000 people are presently benefi ting.
• The guidelines for DORA projects were submitted to the National Treasury and were fi nalised.
• The report on DORA project administration—monthly expenditure reports (June to November 2005) for both the CASP and LandCare grants (2005/06) were submitted to the National Treasury. The second quarterly report on expenditure and outputs was submitted to the Select Committee on Finances of the NCOP. The report on DORA project administration was completed.
• The development of a fi xed-point agricultural resource monitoring system is in progress and is 70 % complete.

DoA Annual report 2005/06 49
Fourth quarter
• There was no request for advisory engineering support in Africa during the fi nancial year. Owing to a lack of engineering capacity to actively network with African countries no contact was initiated. Information is awaited from Angola to determine the extent of support required on projects identifi ed by them. Once the information is received, the required expertise will be facilitated according to need.
• A total of 330 power hoes were procured and distributed to the wards that fall within the Integrated Sustainable Rural Development Nodes and also qualify for Project Consolidate under the mechanisation support programme. Provinces that have benefi ted from the programme so far are KwaZulu-Natal, Eastern Cape, Free State and Limpopo. An estimated 6 000 ha will be cultivated with the distributed power hoes.
• Altogether 56 boreholes were drilled for food gardens at schools in support of the IFSNP in partnership with the Department of Water Affairs and Forestry and Roundabout Pumps (53 in Limpopo and 3 in Northern Cape), of which 37 were successful.
• The research report on rehabilitation of small-scale irrigation schemes with the aim of increasing water use ef-fi ciency was completed. The results have been workshopped and the fi nal report will be published by the Water Research Commission. The recommendations will be implemented in the water infrastructure rehabilitation project under ASGISA.
• The SUAR Bill was submitted for the commencement of the legislative process.
CHALLENGES AND RESPONSES TO CHALLENGESCHALLENGES AND RESPONSES TO CHALLENGES
Challenge 1 Agreeing on the variable and fi ne-tuning of measurements when modeling soil loss may take time.
Response to challenge 1 The fi rst version of the predicted soil loss map is shared with the aim of further improving variables.
Challenge 2 Spatial positioning of data points and their relevance to all parameters may prove to be a major challenge.
Response to challenge 2 Experts worldwide have been consulted for their input.2
Challenge 3 Existing facilities are not always linked (located) to farming areas and are therefore not totally relevant to agricultural needs.
Response to challenge 3 Further engaged with the Department of Water Affairs and Forestry 3in the speedy establishment of CMA in all catchments for sound par-ticipation by society.
Challenge 4 The drilling of boreholes and construction work by the Directorate Water Use and Irrigation Devel-opment presented a problem with respect to responsibility, i.e. whether responsibility lies with the department, the provincial department or the local authorities.
Response to challenge 4 The responsibility for drilling has moved from solely that of the na-4tional department to a shared responsibility where provinces and lo-cal governments identify and fund drilling projects. This demand cannot be met by the DoA alone and the drilling work done through the Directorate Water Use and Irrigation Development will focus on those projects where support is provided in cases where the demand cannot be met by provincial and local interventions and water devel-opment is linked to food security issues.
Challenge 5 The Directorate Water Use and Irrigation Development was instructed not to acquire any con-struction equipment. The challenge is that the equipment that is now in use is old and should be replaced.
Response to challenge 5 Agricultural structures and groundwater development equipment will 5be replaced after a decision by the departmental Management Com-mittee that the function should be carried out and teams should bealigned with the changed environment. National construction teams

Programme performance50
will focus on the FMD border fence and drilling teams will focus on food security issues.
The replacement schedule for construction equipment was devel-oped and additional funding will be required to implement this. The fi rst new construction equipment will be purchased in the 2007/08fi nancial year. Mobile homes and other camping requirements will be addressed in the 2006/07 fi nancial year.
Challenge 6 The Directorate Land Use and Soil Management is challenged by poor reporting from the prov-inces.
Response to challenge 6 All LandCare and CASP co-ordinators in the provinces were visited 6and the various reporting templates workshopped with staff mem-bers involved in compiling reports in order to improve the standard of reporting by the provinces.

DoA Annual report 2005/06 51
PROGRAMME 7PROGRAMME 7
National Regulatory Services
PURPOSEPURPOSE
To develop and monitor risk management policies for the control of animal and plant diseases and food safety.
MEASURABLE OBJECTIVEMEASURABLE OBJECTIVE
Reduce the occurrence of animal and plant diseases through the development, implementation and monitoring ofpolicies that ensure proper maintenance of and improvement in management systems for animal and plant disease control.
Eben Rademeyer
ACTING ASSISTANT DIRECTOR-GENERAL

Programme performance52
SERVICE DELIVERY OBJECTIVES AND INDICATORSSERVICE DELIVERY OBJECTIVES AND INDICATORS
Directorate OutputMeasure/indicators
Actual performance against target
Target Actual
Food Safety and Quality Assurance
Food controllegislation
Approved draftFood Control Act
By March 2006 A task team was established for thispurpose. This long-term deliverable involves 14 acts dealing with food control and 14 different stakehold-ers will be involved in drafting the legislation. The consultation pro-cess is still in the initial stages.
Plant Health Plant pest riskmanagementsystems and legislation
Improved plant pestrisk managementsystems and revised legislationon norms
Updated systemsand legislation by March 2006
The directorate has worked on thefollowing during the fi nancial year:
• Involvement in SADC work-shops regarding the harmonisa-tion of phyto sanitary regulations in the seed trade
• Working towards one standard import condition for plants andplant products from Lesotho and Swaziland because thereare no regulatory pests of con-cern to South Africa
• Implementing the exotic fruitfl ydetection programme
• Approval and publica tion of theplant health policy of SouthAfrica
• The revision of the Agricultural Pests Act is in its fi nal stagesbefore presentation to DEXCO.A submission is currently beingfi nalised to this effect
• Other regulations also revised are amendments to the CitrusFoundation Block, RegulationR1013 and the Cotton Regula-tion
Animal Health Co-ordinatedanimal healthsystem
Improvement inanimal diseasereporting
By March 2006 The directorate continues tosafeguard the internationallyrecognised status of the FMD-freezone without vaccination throughthe intensification of surveillanceactivities, the empowering ofprovinces to implement the currentNational Contingency Plan and an extensive awareness strategy. Inaddition, the directorate facilitatedthe organisation of an SADCworkshop on avian infl uenza under the auspices of the FAO from 7–9March 2006 to ensure the regionalharmonisation of prevention and control strategies.

DoA Annual report 2005/06 53
Directorate OutputMeasure/indicators
Actual performance against target
Target Actual
South AfricanAgricultural Food, Quarantine and InspectionServices
Effective andimproved bordercontrol, national plant and plantproductinspection ser-vices and plant and animalquarantine
Improvement in the level of servicedelivery
By March 2006 Engaged SADC members on the harmonised application of ISPM 15: guidelines for regulating wood packaging in international trade.
Eastern Cape small-scale farmerswere trained on the quality aspects of table potatoes. These farmersare marketing their produce at the Mthatha Fresh Produce Market.
Six line function training manualswere completed and the existing standard operating procedures were restructured.
Two reports were compiled, one on services rendered and another onthe retained regulated articles.
SERVICE DELIVERY ACHIEVEMENTSSERVICE DELIVERY ACHIEVEMENTS
Further information on outputs of the programme, as specifi ed in the Strategic plan 2005, is provided per quarter.
First quarter
• Export standards for citrus, plums, peaches, fl owers, cherries, apricots, apples, pears, table grapes, vegetables, soya-beans, leguminous seeds, buckwheat, drybeans, wheat, grass and feed products, onions, groundnuts,potatoes, yams, eggs and honeybush tea were drafted and amended.
• The mid-term review of SA PIP by the visiting EU monitoring delegation took place.
• The cycle of microbiological surveillance programme was successfully completed in the provinces of the Free State, Gauteng, Mpumalanga, KwaZulu-Natal and Western Cape.
• The following regulations were approved and gazetted for public comments: Agricultural Remedies, Stock Rem-edies, Fertiliser, Farm Feeds and Pest Control Operators’ Regulations.
• Altogether 879 import permits were issued for plants, plant products and related regulated articles and 161 ap-plications were submitted for pest risk analysis.
• The draft of the categorisation of the animal diseases policy will be resubmitted to DEXCO, including the amend-ments. The draft regulations for the new Animal Health Act of 2002 will also be submitted. The import policy on animal products will be submitted to the STC.
• Analytical laboratory services were rendered to benefi ciaries of CASP.
• An operational plan for the management of bacterial blight was fi nalised.
• The protocol for the export of raw hides and skins to the EU and Turkey was fi nalised and implemented.
Second quarter
• Technical advisory information packages on pesticides were drafted. Draft InfoPaks on the control of ectopara-sites and on the vaccine programme for poultry were compiled. The review of the Deciduous and Subtropical Fruit Regulations is in progress.
• Regulations relating to the grading, packing and marking of canned foodstuffs were signed by the Minister.
• Groundnut Regulations, export standards and requirements for onions and buckwheat standards were com-pleted and published in the Government Gazette.

Programme performance54
• As part of the AADP the department visited the Kenyan Pesticide Regulatory Authority to share knowledge and information on the management of pesticides and to establish co-operation and learn from each other’s systems to improve service delivery.
• The department engaged with Working for Water (WfW) by visiting their head offi ce to discuss the WfW project that involved pest control operators to ensure compliance with the requirements of the Fertilizers, Farm Feeds, Agricultural Remedies and Stock Remedies Act of 1947.
• The following draft policies were developed and presented at the STC meetings for discussion: pesticide man-agement policy, policy for animal feeds, stock remedies policy and fertiliser policy.
• The Exotic Fruitfl y Detection Programme, which forms part of the early warning system, is in progress. The plant health policy was approved by the STC and will be presented to the ASRDC.
• Approximately 2 834 import permits were issued and 483 applications were sent for pest risk analysis.
• A decision was taken that amendments to the Draft Agricultural Pests Act will be published as a new bill.
• Four courses to train animal health technicians as marking operators were presented in the Free State. Four export facilities for veterinary services were approved. An InfoPak on skin conditions in dogs was completed.
• Four SADC offi cials were trained on WTO SPS.
• Export of citrus to Japan and Korea was concluded.
Third quarter
• An operational manual for the African stockpile system was completed and submitted for approval. An assess-ment visit was undertaken to the CASP Stutterheim Poultry Programme. The development of the Wine on Line Phase II was completed.
• Amendments to export standards and requirements for plums and prunes, apricots, table grapes and cherries were published.
• An article on the microbiological surveillance project was published in the AgriNews.
• The brucellosis surveillance proposal was fi nalised in consultation with the Directorate Animal Health.
• The pamphlet on Purchasing of safe meat was fi nalised and submitted to the Directorate Agricultural Information tServices for design, layout and printing.
• The Liquor Products Amendment Bill was republished for public comment and the comments were discussed with role players and included in the amendment.
• The African Stockpiles Programme was approved by the World Bank and the national action plan was produced by all the role players.
• The department is participating in the phasing out of methyl bromide. One offi cial attended an international train-ing workshop on the phasing out of methyl bromide and possible alternatives. A Cabinet memo and a national action plan for methyl bromide management were submitted to DEXCO.
• The department submitted policy documents to SANAS as part of the application for the accreditation of labora-tories. However, the moving of Pretoria laboratories to Block W in Agriculture Place will affect the timing of the application for accreditation.
• Information material was developed for technical advisory packages to promote plant health matters which in-cluded early warning stickers, a Bactrocera invadens poster and a draft pamphlet on plant health policies and sstandards.
• The importation of hazelnut trees from Italy, with the aim of establishing a multimillion Rand industry in the East-ern Cape Province in which local communities will be involved, was approved. Extensive risk assessment re-garding pest and weed potential for planting hazelnut trees was completed.
• A total of 958 import permits were issued and 171 applications were sent for pest risk analysis. The Stellenbosch offi ce issued 37 permits for the importation of genetic material of 199 varieties of pome, stone and berry fruit,and 1 permit for the importation of a commercial quantity of apple rootstocks from France. A consignment ofrooted strawberry plants was rejected and returned to the exporting country after it was found that the plants were infested with mites and aphids and also had unacceptable volumes of soil on their roots.

DoA Annual report 2005/06 55
• A total of 17 black marking operators, who completed training, were registered on the national register. The re-view of primates and bird import requirements is in progress. InfoPaks were compiled on Classical Swine fever for national distribution.
• The export of potatoes to Zambia was concluded. Verifi cation was done of the good agricultural practices for effective control of regulated pests for the USA. Negotiations took place for the visit of a USDA APHIS expert to evaluate the application of the good agricultural practice documents. Delimiting surveys were undertaken in the Northern Cape, Limpopo and Free State.
• The plant health policy was approved by DEXCO and comments will be incorporated before publication for public comment. Policies for animal feeds and stock remedies were also approved by DEXCO. The categorisa-tion of the animal diseases policy was approved by DEXCO and the policy is being prepared for public com-ment.
Fourth quarter
• The translation of legislation was completed: the Meat Safety Act was translated into Setswana, Tshivenda, Xitsonga and isiZulu. The Red Meat Regulations was translated into Setswana, Xitsonga and isiZulu.
• A fi nal report on food safety was published and an article was published in AgriNews.
• The draft Poultry Regulations were promulgated by the Minister and the regulations were published in GovernmentGazette No. 8402 on 24 February 2006. These were approved by the Minister for publication for public comment.e
• Major changes are still being incorporated in the draft (English and Afrikaans) of the new regulations regarding control over the sale of products originally produced in South Africa. Proposed requirements for the “barn egg”were incorporated into the fi nal draft of the new regulations regarding free range eggs, poultry meat and egg barns in South Africa.
• Comments were received from the drafting committee and incorporated in the draft proposed Agricultural Pests Act. Submission for the presentation of the proposed draft Bill before DEXCO is in progress.
• Amendments to the export standards and requirements for citrus, apples and pears were published.
• Export requirements and new requirements for Quality Management Systems (QMS) were combined in a sum-mary document and discussed at the QMS Steering Committee Meeting.
• Positive outcomes were received on the Wine and Spirit Agreement with regard to the use of the terms “ruby”, “tawny” and “vintage”. The EU allowed the RSA to use these terms under certain conditions as published in the EU offi cial journal.
• The project to install a High Performance Liquid Chromatograph system to be used for benomyl and carben-dazim in the Stellenbosch laboratories was completed. The interface of the instruments with the Laboratory In-formation Management system has also been completed successfully.
• Technical advisory information packs were prepared on the use of dips and dipping management under stockremedies.
• New information packs on animal identifi cation were compiled. Information packs on Classical Swine fever were distributed at road blocks, taxi ranks, bus and train stations and were translated into Afrikaans, isiXhosa, isiZulu,seSotho and English.
• Plant health pamphlets were developed and reprinted. Awareness posters and roller banners on plant health were edited and reprinted. A draft poster for the awareness project—movement of propagation material—was developed. A pamphlet on the purchasing of safe meat was compiled and will be published shortly.
• Strict quarantine measures were imposed on an importer of strawberry plants in the Gauteng Province after they contravened the import protocol. Eight commercial consignments involving olive, walnut, hazelnut and straw-berry cuttings were detained until all diagnostic procedures were completed.
• Altogether 1 926 fresh fruit samples were analysed for chemical residue and 2 % (39) of the consignments were rejected owing to exceeding the MRL. About 854 samples were analysed for the presence of human pathogens. Two samples were rejected for export and 45 exceeded the limit for total bacterial count.
• The Minister approved the pesticide policy for publication for public comment.

Programme performance56
CHALLENGES AND RESPONSES TO CHALLENGESCHALLENGES AND RESPONSES TO CHALLENGES
Challenge 1 Outbreaks of serious animal diseases.
Response to challenge 1 Improvement of communication with the provinces.
Challenge 2 Establishing a co-ordinated approach to address the challenges facing the department with re-gard to food safety and quality.
Response to challenge 2 National Analytical Services adopted a management strategy to en-2able management by function and not by site.
Challenge 3 Lack of management personnel in the Directorate Plant Health.
Response to challenge 3 Management posts fi lled.3
Challenge 4 Insuffi cient human resources for inspection services.
Response to challenge 4 Entrance protection of national industries and maintenance of global 4markets’ share by addressing personnel on the directorate’s estab-lishment.
Challenge 5 Comments on food control legislation not received within requested time frame from relevant stakeholders.
Response to challenge 5 Send reminders to involved parties on a frequent basis. Strict adher-5ence to due dates shall be enforced.

DoA Annual report 2005/06 57
PROGRAMME 8PROGRAMME 8
Communication and InformationManagement
PURPOSEPURPOSE
To manage and co-ordinate communication, education and international relations.
MEASURABLE OBJECTIVEMEASURABLE OBJECTIVE
Provide for effective internal and external communication and information management through a communication strategy.
Mkhululi Mankazana
ASSISTANT DIRECTOR-GENERAL

Programme performance58
SERVICE DELIVERY OBJECTIVES AND INDICATORSSERVICE DELIVERY OBJECTIVES AND INDICATORS
Directorate OutputMeasure/indicators
Actual performance against target
Target Actual
AgriculturalInformationServices
Information in arange of media
Number ofpublications
Frequency ofwebsite updates
Twelve issues ofAgriNews
Twelve InfoPaks
Monthly updates
Ten AgriNews issues were published.sTwo issues were combined because ofa lack of news during certain periods,i.e. December.
No new InfoPaks were compiled be-cause of a lack of capacity to developcontent. Thirty two existing InfoPaksthat were out of stock were reprinted.
Information is updated daily on receipt.
InternationalRelations
African Agricul-tural Develop-ment Programme(AADP) Trust
AADP Trust established andall membersappointed
By November 2005
The Oversight Committee of the DoA reviewed this output. A decision wastaken that the AADP should be treatedas a line function budget item. An amount of R5 million was sourced forthis purpose.
Education andTraining
An agriculturalhuman resourcedevelopmentreview report
Report on reviewfi ndings integratedinto departmental programmes
By August 2005 A ten-year human resource develop-ment review report was approved byDEXCO. The report was successfully integrated into a number of DoAprogrammes, particularly the Agricul-tural Education and Training Strategyfor Agricultural and Rural Development and the external bursary scheme in terms of scarce skills fi nancing. Inaddition, the implementation of amaster mentorship programme was started, which resulted in the training of163 master mentors from variouscommodities and agricultural consultingfi rms.
GrootfonteinAgriculturalDevelopmentInstitute
Trained emergingfarmers
Number ofemerging farmerstrained success-fully
200 emerging farmers with 75 %pass rate
A total of 614 emerging farmers were trained.
SERVICE DELIVERY ACHIEVEMENTSSERVICE DELIVERY ACHIEVEMENTS
Outputs of the programme, as specifi ed in the Strategic plan 2005, are reported per quarter.
First quarter
An exhibition was set up for the Budget Vote in Parliament on 6 April 2005. The Directorate Agricultural Informa-tion Services organised and participated in the departmental exhibition at the annual NAMPO Harvest Day in Bothaville, from 16 to 21 May 2005 and participated in the National Youth Day celebrations held in Kimberley on 16 June 2005. The Directorate Food Safety and Quality Assurance represented the department at the Royal Agricultural Show in Pietermaritzburg from 27 May to 5 June 2005.
Communication support was provided for the Mafi sa launch at Nebo in Limpopo Province on 30 May 2005 by publishing fl yers. The mechanisation programme launch was postponed to the third quarter.
No radio programmes were broadcast because of a lack of capacity.

DoA Annual report 2005/06 59
The AgriBEE Consultative Indaba was postponed to the third quarter.
Two issues of AgriNews ands WezoLimo were published.
Approximately 31 InfoPak titles on animal health were distributed to MPCCs in all provinces (one MPCC per province).
The Indonesia agreement was signed. An Angola/South Africa joint committee was established and inauguratedat Ministerial level in Angola. The Brazil/SA SPS agreement was fi nalised.
South African co-operation with China in a joint working group in support of IFSNP was fi nalised.
The institutional mechanism model for the AADP administration was fi nalised.
Altogether 93 interns attended soft skills training courses at UNISA. A total of 1 499 learners registered at col-leges of agriculture and 668 learners graduated.
Packaged accredited training programmes were approved by the ASRDC.
The policy framework and implementation plan on youth involvement in agriculture was approved by DEXCO.
Three articles on successful youth entrepreneurs in the agricultural fi eld were published.
A total of 32 short courses were presented for farmers (95 % pass rate for 1 414 learners) and 11 skills develop-ment courses were presented to 121 learners.
Second quarter
Radio interviews were broadcast on SABC and community radio stations regarding the Land Summit in July 2005. This included TV coverage during July 2005 on all SABC TV and international channels. Support was provided to the Directorate Land Use and Soil Management to arrange weekly radio broadcasts on community radio stations in the provinces for the LandCare awareness campaign (May to end of July 2005). A radio inter-view was broadcast on swine fever on Motsweding FM.
A departmental exhibition was set up at the Pretoria Show from 29 August to 4 September 2005. The directorates Food Safety and Quality Assurance, Animal Health and Genetic Resource Management jointly exhibited. An exhibition was also co-ordinated for the Gauteng Agri-food Expo from 24 to 26 July 2005 at Gallagher Estate, Midrand. The Directorate Land Use and Soil Management set up an exhibition at the Mpumalanga AgriculturalShow from 9 to 13 August 2005. The launch of the marketing information system was postponed to the second quarter of 2006. The system is not set up yet and is controlled by the Directorate Marketing. Communication support will be provided for the launch.
The proposal for a new layout of the website to incorporate Government’s corporate branding was fi nalised as part of the re-engineering of the site.
Three issues of AgriNews and one issue of WezoLimo were published
The departmental Annual report 2004/05 was published and tabled in Parliament on 29 September 2005.5
The USAID Grant agreement was amended (USAID increased funding) and sent to the National Treasury.
The FAO: TCP 2905 NEPAD/CAADP agreement was signed.
The FAO: TCP on the Mycotoxins agreement was signed.
The Ten-year human resource development review on agricultural further and higher education and training provisions was published as well as annual reports on the Experiential and Internship Programme.
The Agricultural Education and Training (AET) Strategy for Agriculture and Rural Development in South Africa was launched. Communication support was provided for the launch on 30 September 2005 at Caesar’s Palace in Boksburg. Radio interviews were arranged as well as coverage on AgriTV.
Altogether 22 short courses and four skills development courses were presented to 83 learners (66 PDIs).
Third quarter
Media coverage and support was arranged for the AgriBEE Consultative Indaba, held at Gallagher Estate in Midrand, Gauteng on 6 and 7 December 2005. The Minister was interviewed on SABC TV Morning Live and SAFM. Radio interviews were also conducted on several SABC and community radio stations.

Programme performance60
Radio messages on Classical Swine fever “roadblock notifi cation” were broadcast from 27 December 2005 to 7 January 2006 on SAFM, Umhlobo Wenene, Radio Sonder Grense and an interview was broadcast on Teema-neng community radio station. Another interview was broadcast on Mohodi community radio station on animal and plant production.
Communication support was provided for the launch of the Mechanisation Programme held on 9 October 2005 to coincide with the Ministerial Imbizo at Jozini Local Municipality, KwaZulu-Natal. World Food Day was cele-brated on 16 October 2005 in Kimberley, Northern Cape. This included a public march. Radio interviews were conducted and there was coverage on AgriTV during the preceding week. A joint exhibition including the direc-torates Genetic Resources Management and Food Safety and Quality Assurance was co-ordinated at the Ma-cufe show in Bloemfontein from 30 September to 8 October 2005.
A total of 28 InfoPaks were reprinted. No new InfoPaks were compiled because of a lack of capacity.
The Directorate Information and Communication Technology was requested to pre-investigate the proposed layout of the website to incorporate Government’s corporate branding as part of the re-engineering of the site.
Two issues of AgriNews and WezoLimo were published.
An internal launch was held in support of the campaign 16 Days of Activism against the Abuse of Women and Children on 25 November 2005. The department also participated in the interdepartmental postcard project.
RSA/WTO Trade Negotiations—the Minister and a departmental delegation accompanied the Minister of Trade and Industry to the WTO trade negotiations in Hong Kong, China.
The Minister led the South African delegation to the FAO Annual Conference in Rome, Italy.
The RSA/Botswana agricultural sector co-operation agreement was signed by the Minister during the State visit by the President of Botswana to South Africa.
The amended protocol for the import and export of agricultural commodities between South Africa and China was ready for signing.
The progress report on citrus protocol between South Africa and China was completed (prepared by the Direc-torate Plant Health)
The feasibility study on the implications of introducing a community service for veterinarians was submitted to DEXCO for approval of the methodology.
The joint ASRDC and STC approved the norms and standards for sectoral training programmes. The commodity-based Mentorship Programme was implemented.
The policy on women’s involvement in agriculture was approved by DEXCO.
Altogether 22 short courses were presented with a pass rate of 91 %. A total of 48 learners received the Higher Certifi cate and 23 the National Diploma in Agriculture. A total of 20 skills development courses were presented in further education with an attendance of 411 (381 PDIs).
Fourth quarter
Radio interviews were broadcast on Mafi sa and indigenous plants on Mohodi FM and Radio Teemaneng. Radio advertisements were broadcast on avian infl uenza on 11 SABC radio stations, SABC 1, 2, 3 and eTV from Feb-ruary 2006.
The World Wetlands Day exhibition was held on 2 February 2006 in St Lucia, KwaZulu-Natal. Exhibitions were also staged at the Makhoba Village Green Revolution launch in Matatiele in the Eastern Cape on 12 January 2006, the Limpopo Agricultural Show from 2 to 4 March in Polokwane and at the Decade of Education for Sus-tainable Development Expo, 3 to 10 March 2006 in Mpumalanga. The Budget Vote exhibition was held on 28 March 2006 at the Parliament Buildings, Cape Town. Exhibitions were also staged at the SASOL Sci Fest held in Grahamstown from 21 to 29 March 2006 and at the African International Investment Expo from 27 to 31 March 2006.
No new InfoPaks were compiled, but four InfoPaks were reprinted, namely Test your soil, Soil erosion, Maize production andn Sorghum.

DoA Annual report 2005/06 61
Two issues of AgriNews and one issue ofs WezoLimo were published.o
The Strategic plan 2006 was published, presented to the Portfolio Committee and tabled in Parliament on 14 6March 2006.
A draft External Communication Strategy was submitted to the GCIS by the end of March 2006. It has also been submitted to the DEXCO subcommittee GOPC for approval.
The proposed MoU for co-operation and SPS agreement with Thailand is in progress.
A total of 53 learning manuals that include a learner guide, a facilitator guide and an assessor guide were de-veloped.
A progress report on the implementation of a pilot project to create agricultural awareness was produced.
The annual report on the external bursary scheme was printed and distributed to the relevant parties.
The annual report on the implementation of the Experiential Training and Internship Programme was fi nalised for printing.
The fi rst trend analysis report on agricultural graduates and enrolments in FET and HET was completed.
A total of 22 short courses were presented in higher education with a 95 % pass rate. Seven skills development courses in further education were presented—131 people attended, including 120 PDIs.
The GADI training report was published and distributed to stakeholders and training institutions.
The accreditation of the FET Programme of GADI with AgriSETA is in process.
CHALLENGES AND RESPONSES TO CHALLENGESCHALLENGES AND RESPONSES TO CHALLENGES
Challenge 1 The process of developing the governance framework document for colleges of agriculture is making slow progress.
Response to challenge 1 Appoint an investigation team in collaboration with the FET Chief Directorate from the Department of Education and agree on a joint time frame with the Ministers of Education and Agriculture.
Challenge 2 Accessing funds from the Department of Labour’s National Skills Fund is a challenge owing to changes in their funding strategy.
Response to challenge 2 Use the National Agricultural Education and Training Forum to cre-2ate a co-ordinating structure which should include provincial depart-ments of labour to formulate funding projects for the provinces.
Challenge 3 Consultation processes around the fi nalisation of the R&D Strategy are taking too long.
Response to challenge 3 Set deadlines with key stakeholders within the National Agricultural 3Research Forum to fi nalise the submission of inputs not later than 30 June 2006.
Challenge 4 The Further Education and Training Bill, which is out for public comment, if fi nalised in its current state, will be an impediment to the department’s vision of having colleges of agriculture as centres of learning excellence.
Response to challenge 4 Lobby and forward departmental inputs through the DG’s offi ce. The 4bill should allow Further Education and Training Colleges to offer industry-specifi c higher education programmes at NQF level 5.
Challenge 5 Lack of capacity for content development of InfoPaks.
Response to challenge 5 Employ more personnel with the requisite skills.5

Programme performance62
PROGRAMME 9PROGRAMME 9
Programme Planning, Monitoringand Evaluation
PURPOSEPURPOSE
To consolidate and support strategic and operational management in the department.
MEASURABLE OBJECTIVEMEASURABLE OBJECTIVE
Improve organisational performance by supporting operational units to implement and monitor the department’s strategic plan and by undertaking programme evaluations and impact assessments.
Vangile Titi
DEPUTY DIRECTOR-GENERAL (acting as ASSISTANT DIRECTOR-GENERAL)

DoA Annual report 2005/06 63
SERVICE DELIVERY OBJECTIVES AND INDICATORSSERVICE DELIVERY OBJECTIVES AND INDICATORS
Directorate Output Measure/indicatorsActual performance against target
Target Actual
Programme Planning Project management framework
Number ofdirectorates using the management-by-project approach
Twenty fi vedirectorates using the management-by-project approach by March 2006
Piloted the system, using LandCare and CASP projects inDirectorate Land Use and Soil Manage-ment.
Monitoring and Evaluation
Organisationalperformanceassessment report
Frequency oforganisationalassessment reports
Quarterly reportsavailable by March2006
Organisationalperformance reportswere completed,including the annual performance report ofthe department.
SERVICE DELIVERY ACHIEVEMENTSSERVICE DELIVERY ACHIEVEMENTS
Further information on outputs of the programme, as specifi ed in the Strategic plan 2005, is provided per quarter.
First quarter
• The Project Information Management System for Agriculture (PIMSA) was installed for the project management office.
• Eight directorates participated in the strategic and operational framework implementation.
• The service excellence model and analytical tools were developed.
Second quarter
• The assessment of PIMSA variables vis-à-vis an Excel database was completed.s
• The midterm organisational performance report was fi nalised.
• Performance measures were defi ned with monitoring mechanisms against KRAs.
Third quarter
• An internal PIMSA awareness campaign was run in the department to expose directorates to the system. A preliminary survey was conducted in the Northern Cape, Eastern Cape and Western Cape to collect project in-formation data in an EPWP reporting format.
• A report was compiled on the directorates’ implementation of the strategic and operational framework.
• A report was completed on the organisational achievements of the third quarter.
• CASP monitoring templates and analytical tools were completed.
Fourth quarter
• PIMSA was launched nationally on 17 March 2006.
• The CASP performance analysis report was completed.
• A report on organisational performance for the fourth quarter was fi nalised.
• The annual performance report was completed.
• The M&E system for organisational performance was established.

Programme performance64
CHALLENGES AND RESPONSES TO CHALLENGESCHALLENGES AND RESPONSES TO CHALLENGES
Challenge 1 Capacity limitations in terms of strategic and project planning as well as monitoring and evalua-tion skills.
Response to challenge 1 Pursue internal skills development and training initiatives.

RReport ofeport ofthe Audit Committeethe Audit Committee

Report of Audit Committee66
The committee was constituted in terms of the Public Finance Management Act, 1999 (Act No. 1 of 1999), and had two external members. During the year under review, the committee held several meetings to review and guide the Internal Audit Component in achieving its objectives.
The committee, amongst others, monitored the following:
• Compliance with the internal audit charter;
• Compliance with the requirements of the Public Finance Management Act, 1999 (Act No. 1 of 1999);
• The audit plan and risk assessment of the department;
• Interacted with the external auditors to ensure that more cost effective and effi cient audits were performed and that the work of the Internal Audit Component was aligned with the external audit objectives;
• The internal controls were adequate to protect the assets of the organization;
• That the system of internal control ensured that transactions were recorded in the correct periods;
• That all internal audit reports refl ected the result and the fi ndings of the audit and those recommendations for improvement, and where necessary, for the prevention of fraud were communicated to the Accounting Offi cer.
Reports of the Internal Audit Component were reviewed. No serious problems with regard to internal controls or cases of non-compliance to the requirements of the Public Finance Management Act, 1999 were revealed.
Ms F.N. Msimang
CHAIRPERSON
REPORT OF THE AUDIT COMMITTEEREPORT OF THE AUDIT COMMITTEE

AAnnual financialnnual financialstatementsstatements

Annual fi nancial statements68
Report of the Accounting Offi cer ................................................................................................................. 69
Reports of the Auditor-General .................................................................................................................... 80
Financial Statements
Departmental (Vote 25)
Accounting Policies ......................................................................................................................... 83
Appropriation Statement .................................................................................................................. 90
Notes to the Appropriation Statement .............................................................................................. 111
Statement of Financial Performance ............................................................................................... 113
Statement of Financial Position ....................................................................................................... 114
Statement of Changes in Net Assets ............................................................................................... 115
Cash Flow Statement ...................................................................................................................... 116
Notes to the Annual Financial Statements ...................................................................................... 117
Disclosure Notes to the Annual Financial Statements ..................................................................... 127
Annexures ....................................................................................................................................... 130
Agricultural Debt Account
Balance Sheet ................................................................................................................................. 155
Income Statement ........................................................................................................................... 156
Statement of Changes in Equity ...................................................................................................... 157
Cash Flow Statement ...................................................................................................................... 158
Notes to the Annual Financial Statements ...................................................................................... 159
DEPARTMENT OF AGRICULTURE
VOTE 25
ANNUAL FINANCIAL STATEMENTSANNUAL FINANCIAL STATEMENTS
for the year ended 31 March 2006for the year ended 31 March 2006

DoA Annual report 2005/06 69
Report by the Accounting Offi cer to the Executive Authority and Parliament of the Republic of South Africa.
1. General review of the state of fi nancial affairs
1.1 Important strategic issues:
The Comprehensive Agriculture Support Programme (CASP) was introduced by the Department during the 2004/05 fi nancial year in order to provide post settlement support to targeted ben eficiaries. An amount of R250,0 million was allocated during 2005/06 to the Provincial Depart ments of Agriculture and managed through the prescripts of the Division of Revenue Act, 2005 (Act No. 1 of 2005). The Agricultural Credit Scheme (Mafi sa) was also introduced during 2005/06. Funds accumulated in the Agricultural Debt Account (please refer to paragraph 12.1 and 12.2 of this report) are utilised to fund the Scheme. The amount of R150,0 million allocated during 2005/06 will be increased to R200,0 million in the 2006/07 fi nan cial year.
1.2 Signifi cant events that have taken place during the year:
• A total amount of R140,0 million was requested by the World Food Programme from the South African Government for humanitarian food assistance in the SADC region. The countries for which assistance was required included Lesotho, Malawi, Mozambique, Namibia, Swaziland, Zambia and Zimbabwe. Funds were appropriated by Parliament in the Adjust ments Estimate of 2005/06 and paid to the World Food Programme during February 2006.
• Over the past number of years, most parts of the country experienced drought conditions. In some provinces this resulted in livestock mortalities, poor grazing and shortage of water for livestock. Dur-ing the 2003/04 fi nancial year the Department developed a drought relief scheme to assist affected farmers. Despite late rainfalls in some parts of the country during the latter half of the 2004 summer season, that resulted in an improvement in grazing conditions, provinces such as Mpumalanga, Western and Northern Cape and Limpopo still experienced drought conditions and have exhausted funds made available for this purpose during the 2004/05 fi nancial year. An additional amount of R120,0 million was appropriated by Parliament, again in the Adjustments Estimate for 2005/06, to assist more than 41 000 communal farmers and 6000 commercial farmers. The number of livestockinvolved, was approximately 586 000.
• During the latter half of 2004 a foot-and-mouth disease (FMD) outbreak occurred in the Limpopo Province and avian infl uenza (AI) in the Eastern Cape. Expenditure in this regard spilled over to the 2005/06 fi nancial year and R21,1 million and R6,9 million were paid for FMD and AI, respectively. During 2005/06 Classical Swine fever was detected in both the Eastern and Western Cape Provinces. In order to eradicate the disease an amount of R73,4 million was paid out, mainly to the Eastern Cape up to 31 March 2006. However, the disease has not been eradicated yet and it is estimated that a further amount of R157,0 million will have to be paid out.
R’000 R’0001.3 Budget allocation
Main estimate 1 684 738Plus: Adjustments estimate 283 030Total amount appropriated 1 967 768Less: Actual expenditure 1 878 008Surplus 89 760
DEPARTMENT OF AGRICULTURE
VOTE 25
REPORT OF THE ACCOUNTING OFFICERREPORT OF THE ACCOUNTING OFFICER
for the year ended 31 March 2006for the year ended 31 March 2006

Annual fi nancial statements70
R’000 R’0001.4 Actual expenditure
• In terms of input cost:
Compensation of employees 357 132Goods and services 330 007Transfers and subsidies 1 134 306Payment for capital assets 56 563 1 878 008
• In terms of programmes:
Programme 1: Administration 159 758Programme 2: Farmer Support and Development 696 728Programme 3: Agricultural Trade and Business Development 38 764Programme 4: Economic Research and Analysis 17 760Programme 5: Agricultural Production 414 250Programme 6: Sustainable Resources Management and Use 168 206Programme 7: National Regulatory Services 267 331Programme 8: Communication and Information Management 108 716Programme 9: Programme Planning, Monitoring and Evaluation 6 495 1 878 008
2005/06 2004/051.5 Spending trends
• In terms of input cost as a percentage of total actual expenditure:
Compensation of employees 19,0 22,1Goods and services 17,6 15,6Transfers and subsidies 60,4 54,9Payment for capital assets 3,0 7,3
• In terms of programmes as a percentage of total actual expenditure:
Programme 1: Administration 8,5 12,2Programme 2: Farmer Support and Development 37,1 23,8Programme 3: Agricultural Trade and Business Development 2,1 1,9Programme 4: Economic Research and Analysis 0,9 1,2Programme 5: Agricultural Production 22,1 26,6Programme 6: Sustainable Resources Management and Use 9,0 10,3Programme 7: National Regulatory Services 14,2 17,8Programme 8: Communication and Information Management 5,8 6,0Programme 9: Programme Planning, Monitoring and Evaluation 0,3 0,2
• In terms of total actual spending as a percentage of the total appropriated amount:
95,4 95,7
• If specifi c services rendered by the Department are analysed in terms of actual spending, the follow-ing trends in expenditure emerge: Land Use and Soil Management amounted to R41,7 million or 2,2 %; Water Use and Irrigation Development to R61,4 million or 3,3 %; Food Safety and Quality Assurance to R28,8 million or 1,5 %; Agricultural Product Inspection Services to R86,4 million or 4,6 %; Animal Health (excluding animal diseases) to R39,7 million or 2,1 %; Agricultural Information Services to R26,1 million or 1,4 %; Scientifi c Research and Development to R32,4 million or 1,7 %; Membership
DEPARTMENT OF AGRICULTURE
VOTE 25
REPORT OF THE ACCOUNTING OFFICERREPORT OF THE ACCOUNTING OFFICER
for the year ended 31 March 2006for the year ended 31 March 2006

DoA Annual report 2005/06 71
fees to international organisations to R15,1 million or 0,8 %; capital works to R17,2 million or 0,9 %; Transfer payments to the Agricultural Research Council and the National Agricultural Marketing Council to respectively R360,9 million or 19,2 %; and R14,0 million or 0,7 %; Comprehensive Agri-cultural Support Programme to R250,0 million or 13,3 %; drought relief to R120,0 million or 6,4 %; Mafi sa to R146,4 million or 7,8 %; World Food Programme to R140,0 million or 7,5 %; and Animal diseases (FMD, CSF, AI, PRRS) to R104,3 million or 5,6 %.
1.6 Underspending
An amount of R89,760 million or 4,6 % of the total appropriation of R1 967,8 million was not spent by the Department during this fi nancial year. The underspending can be attributed to vacancies not being fi lled timeously, which also had a carry through effect on spending on goods and services. Not all the funds appropriated for AgriBEE, being a new initiative, were spent and claims amounting to R20,0 million for Classical Swine fever were not received in time. Because of exchange rate fl uctuations membership fees to international organisations were less than budgeted for.
1.7 Departmental receipts
An amount of R67,4 million was estimated for departmental receipts in the Estimate of National Expend i-ture for 2005/06. However, an amount of R76,1 million was received. The increase of R8,7 million re-sulted from the sale of departmental assets already written off. For further information, please refer to Part 2 (Programme Performance) of this report and specifi cally to departmental revenue, expenditure and other specifi c topics.
2. Services rendered by the Department
2.1 Some of the more important services rendered by the Department are as follows:
• Advisory services to small-stock farmers• Education to and training of new entrants• Agricultural campaigns• Allocation of external bursaries• Soil, water and plant analyses• Registration of fertilisers, farm feeds, agricultural remedies and/or stock remedies• Meat inspection at export abattoirs• Import certifi cates for liquor products• Export exemption certifi cates• Export certifi cates for liquor products• National inspection services on plants and propagating material• Analytical laboratory services with regard to agricultural products• Animal quarantine and diagnostic services• Plant quarantine and plant health diagnostic services• National plant and plant product inspections• Inspections at offi cial ports of entry• Combating animal diseases• Registration of brands• Issuing import/export permits (animals)
DEPARTMENT OF AGRICULTURE
VOTE 25
REPORT OF THE ACCOUNTING OFFICERREPORT OF THE ACCOUNTING OFFICER
for the year ended 31 March 2006for the year ended 31 March 2006

Annual fi nancial statements72
• Developing early warning systems for the detection of exotic pests• Registration and approval of production units and packhouses for export of fresh fruit• Issuing of import permits (plants)• Construction of access roads for fi re prevention • Construction of key soil conservation works• Drilling of boreholes• Eradication of invasive weeds• Control migratory pests• Regulating the subdivision of agricultural land• Variety listing• Issuing of plant export certifi cates• Authorisation of the export of animal/genetic material from the RSA• Authorisation of the import of animal/genetic material into the RSA• Approval of an animal to donate genetic material • Registration of a premises as a centre• Registration of inseminators, collectors, transplanters and invocators• Registration of facilities• Issuing of GMO status certifi cates• Contained use of genetically modifi ed organisms• Import/export of genetically modifi ed organisms• Veld and pasture management• National computerised record system for farmers• Publication of industry brochures (maize and wheat)• Quarterly economic review reports • Statistical publications• Farm profi les and sector demographics• Commodity statistics• Economic trends for the sector• Economic performance of the sector• Calculation of food utilisation• Food balance sheets to monitor food security issues• Quarterly estimate of livestock numbers• Monthly crop forecasts for summer grains and winter cereals• Food price monitoring• Issuing of import and export permits in terms of free trade agreements• Reporting on trade matters• Providing information regarding trade matters• Compilation of a policy for business and entrepreneurial development
2.2 Tariff policy
In terms of section 76(2)(f) of the Public Finance Management Act, 1999 (Act No. 1 of 1999), a tariff struc-ture was developed by the Department and approved by the National Treasury. Amendments to the approved structure are effected in consultation with the National Treasury. In terms of departmental poli-cy, and if at all feasible, tariffs are adjusted annually to further phase in cost recovery in full for services rendered.
DEPARTMENT OF AGRICULTURE
VOTE 25
REPORT OF THE ACCOUNTING OFFICERREPORT OF THE ACCOUNTING OFFICER
for the year ended 31 March 2006for the year ended 31 March 2006

DoA Annual report 2005/06 73
2.3 Free services
The following free services were rendered by the Directorate Water Use and Irrigation Development:
R’000
• Construction of waterways and contourbanks 2 705• Drilling of boreholes 1 646• Drilling of boreholes for school gardens 1 241• Rehabilitation of boreholes 558• Sighting and drilling of boreholes at dipping tanks 3 799• Providing access roads for fi re prevention 181
10 130
2.4 Inventories
Inventory items are managed by means of the Logistical Information System (LOGIS). The Department has three stores namely Headquarters (Pretoria), Grootfontein Agricultural Development Institute (GADI) at Middelburg, Eastern Cape and Stellenbosch. Inventory items such as stationery, cleaning material and food are kept at the stores. The total value of the balance on hand of inventory items as at 31 March 2006 was R547 039.
3. Utilisation of donor funds
During the 2004/05 fi nancial year, the European Union (EU) has made an amount of R5,170 million available for the South African Pesticides Initiative Programme (SA PIP). An amount of R5,590 million was again made available for this purpose by the EU for 2005/06.
According to current EU regulations, approximately 400 chemical compounds will be effectively withdrawn from use on export crops from South Africa to the EU. The Perishable Products Export Control Board (PPECB) and the SA Bureau of Standards are the only accredited local laboratories that can conduct the MRL trials and pesticide residue analysis acceptable to the EU. The PPECB, being South Africa’s offi cial certifi cation agencyfor exports, has been appointed to conduct the necessary research in order for exporters to comply with the stringent requirements of the EU.
4. Capacity constraints
The personnel turnover in the Department can still be classifi ed as high. On an establishment of 3 399 posts only 2 530 posts were fi lled on 31 March 2006. In order to rectify the situation the Department was restructured with effect from 1 April 2006. The previous nine programmes were decreased to fi ve and certain key manage-ment posts advertised.
5. Public entities
In terms of section 48(1) and Schedules 2 and 3 of the Public Finance Management Act, 1999 (Act No. 1 of 1999), the Public Entities that function within the sphere of the Department of Agriculture, are classifi ed as fol-lows:
• Land and Agricultural Bank of South Africa (major public entity and listed in Schedule 2).
• The Land Bank, constituted in terms of the Land and Agricultural Development Bank Act, 2002 (Act No. 15 of 2002), operates as a development fi nance institution within the agricultural and agribusiness sec-
DEPARTMENT OF AGRICULTURE
VOTE 25
REPORT OF THE ACCOUNTING OFFICERREPORT OF THE ACCOUNTING OFFICER
for the year ended 31 March 2006for the year ended 31 March 2006

Annual fi nancial statements74
tors. The Department does not contribute fi nancially to the Bank and funds will only be transferred to the Bank in instances where agency services are rendered.
• Agricultural Research Council (ARC) (national public entity and listed in Schedule 3: Part A).
• The ARC is a statutory body established in terms of the Agricultural Research Act, 1990 (Act No. 86 of 1990). The ARC reports through its president and its board and the Minister of Agriculture and Land Affairs as the executive authority.
• National Agricultural Marketing Council (NAMC) (national public entity and listed in Schedule 3: Part A).
• The NAMC was established in terms of the Marketing of Agricultural Products Act, 1996 (Act No. 47 of 1996). The council undertakes investigations and advises the Minister of Agriculture and Land Affairs on agricultural marketing policies. The council is accountable to its chairperson and board and to the Minister for Agriculture and Land Affairs as executive authority.
• Onderstepoort Biological Products Ltd (OBP) (national government business enterprise and listed in Schedule 3: Part B).
• OBP was established in accordance with the Onderstepoort Biological Products Incorporation Act, 1999 (Act No. 19 of 1999). It is a biotechnical company, which manufactures vaccines and related products for the global animal healthcare industry. The Department of Agriculture is the sole shareholder. The company is accountable to its board and the Minister for Agriculture and Land Affairs as the executive authority.
• Perishable Products Export Control Board (PPECB) (national public entity and listed in Schedule 3: Part A).
• The PPECB, established in terms of the Perishable Products Export Control Board Act, 1983 (Act No. 9 of 1983), must ensure that perishable products intended for export from South Africa meet international quality standards. The board is in the fi nal instance accountable and reports to the Minister for Agriculture and Land Affairs.
• Ncera Farms (Pty) Ltd (national government business enterprise and listed in Schedule 3: Part B).
Ncera Farms is a small public company and the Department of Agriculture is the sole shareholder. The purpose of the company is to assist small and emerging farmers in the Kidd’s Beach area of the Eastern Cape through various services such as advice, extension services, ploughing services and more. The board is accountable and reports to the Minister for Agriculture and Land Affairs as the executive author-ity.
• Transfer payments in support of these public entities
Voted ActualR’000 R’000
Land Bank* – –Agricultural Research Council 360 902 360 902National Agricultural Marketing Council 13 961 13 961Onderstepoort Biological Products Ltd* – –Perishable Products Export Control Board* – –Ncera Farms (Pty) Ltd 2 377 2 372
* Any payments to these entities were either for agency services or services rendered.
DEPARTMENT OF AGRICULTURE
VOTE 25
REPORT OF THE ACCOUNTING OFFICERREPORT OF THE ACCOUNTING OFFICER
for the year ended 31 March 2006for the year ended 31 March 2006
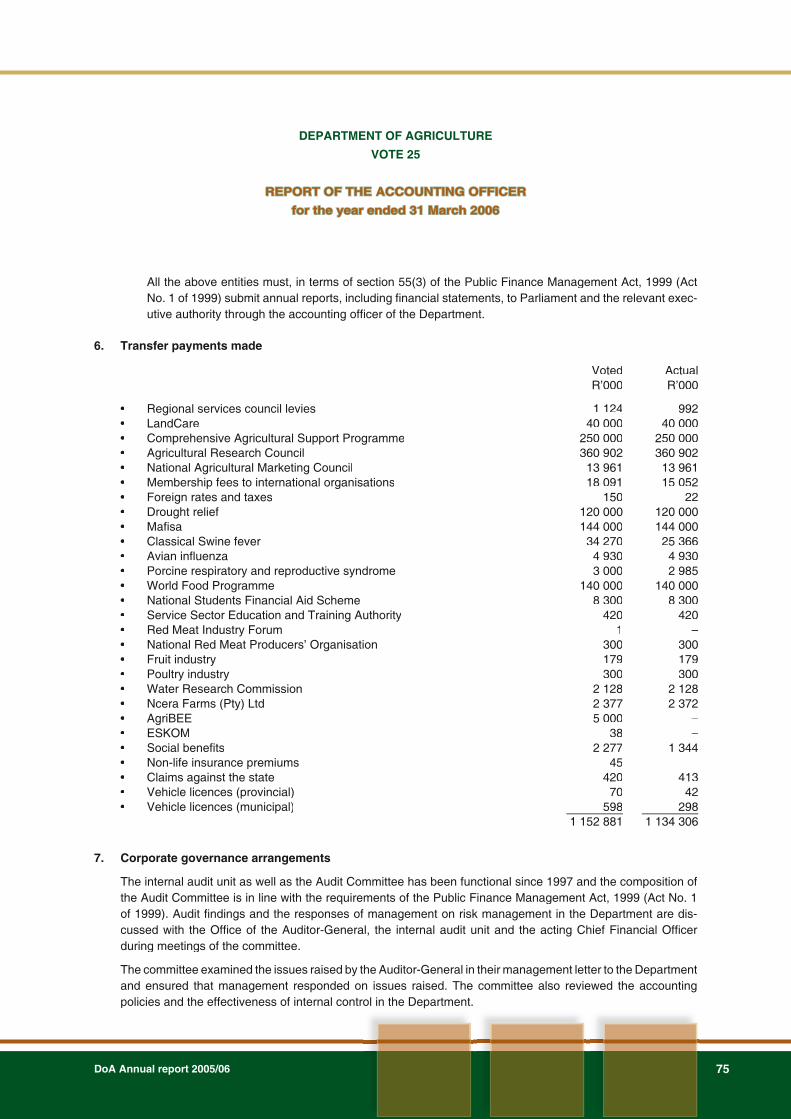
DoA Annual report 2005/06 75
All the above entities must, in terms of section 55(3) of the Public Finance Management Act, 1999 (ActNo. 1 of 1999) submit annual reports, including fi nancial statements, to Parliament and the relevant exec-utive authority through the accounting offi cer of the Department.
6. Transfer payments made
Voted ActualR’000 R’000
• Regional services council levies 1 124 992• LandCare 40 000 40 000• Comprehensive Agricultural Support Programme 250 000 250 000• Agricultural Research Council 360 902 360 902• National Agricultural Marketing Council 13 961 13 961• Membership fees to international organisations 18 091 15 052• Foreign rates and taxes 150 22• Drought relief 120 000 120 000• Mafisa 144 000 144 000• Classical Swine fever 34 270 25 366• Avian influenza 4 930 4 930• Porcine respiratory and reproductive syndrome 3 000 2 985• World Food Programme 140 000 140 000• National Students Financial Aid Scheme 8 300 8 300• Service Sector Education and Training Authority 420 420• Red Meat Industry Forum 1 –• National Red Meat Producers’ Organisation 300 300• Fruit industry 179 179• Poultry industry 300 300• Water Research Commission 2 128 2 128• Ncera Farms (Pty) Ltd 2 377 2 372• AgriBEE 5 000 –• ESKOM 38 –• Social benefi ts 2 277 1 344• Non-life insurance premiums 45 –• Claims against the state 420 413• Vehicle licences (provincial) 70 42• Vehicle licences (municipal) 598 298
1 152 881 1 134 306
7. Corporate governance arrangements
The internal audit unit as well as the Audit Committee has been functional since 1997 and the composition of the Audit Committee is in line with the requirements of the Public Finance Management Act, 1999 (Act No. 1 of 1999). Audit fi ndings and the responses of management on risk management in the Department are dis-cussed with the Offi ce of the Auditor-General, the internal audit unit and the acting Chief Financial Offi cer during meetings of the committee.
The committee examined the issues raised by the Auditor-General in their management letter to the Department and ensured that management responded on issues raised. The committee also reviewed the accounting policies and the effectiveness of internal control in the Department.
DEPARTMENT OF AGRICULTURE
VOTE 25
REPORT OF THE ACCOUNTING OFFICERREPORT OF THE ACCOUNTING OFFICER
for the year ended 31 March 2006for the year ended 31 March 2006

Annual fi nancial statements76
During the fi nancial year a new risk assessment was undertaken and a new risk management plan compiled that will be implemented during the 2006/07 fi nancial year.
8. Discontinued activities
Two activities were discontinued at the end of the 2005/06 fi nancial year, namely assistance for drought relief and a transfer to the World Food Programme. According to budgetary systems, funding for these kind of pro-grammes will be undertaken when the need arises. The discontinuation of these activities will therefore have no effect on the operations of and service delivery by the Department. Two further functions of the Department, namely the Offi ce of the Deputy Minister for Agriculture and Land Affairs and the Registrar of Co-operatives, were transferred to the Department of Land Affairs and the Department of Trade and Industry, respectively.
9. New activities
No new activities are provided for in the 2006/07 fi nancial year.
10. Performance information
Performance information will, for the fi rst time, be audited. The relevant information is taken up in Part 2 of this report.
11. SCOPA resolution
The Department did not appear before the Standing Committee on Public Accounts, following the annual re-port of 2004/05 and, therefore, no report is submitted in this regard.
12. Agricultural debt
12.1 General
Agricultural debt is managed in accordance with the provisions of the Agricultural Debt Management Act, 2001 (Act No. 45 of 2001), and debt management frameworks. According to the Act, agricultural debt is defi ned as any amount contractually or statutorily owed to the state as a result of fi nancial assist-ance, loans or subsidies in terms of the provisions of the Agricultural Credit Act, 1966 (Act No. 28 of 1966), and other related legislation or fi nancial assistance schemes.
12.2 Agricultural Debt Account
Section 3(1) of the Agricultural Debt Management Act, 2001 (Act No. 45 of 2001), provides for the Agricultural Debt Account and payments that result from the recovery of agricultural debt are deposited into this account. Funds in the account are disbursed in accordance with the provisions of section 5 ofthe abovementioned Act. The status of the account on 31 March 2006 is as follows:
Total debt outstanding – R510 863 765Number of debtors – 3 054Number of accounts – 4 518Net amount recovered (2005/06) – R69 268 115Credit balance in the Agricultural Debt Account – R1 026 499 552
An amount of R150,0 million was, in terms of section 5 of the mentioned Act, transferred from the Agri-cultural Debt Account to the National Revenue Fund, appropriated on the Department’s budget and utilised for the funding of Mafi sa.
DEPARTMENT OF AGRICULTURE
VOTE 25
REPORT OF THE ACCOUNTING OFFICERREPORT OF THE ACCOUNTING OFFICER
for the year ended 31 March 2006for the year ended 31 March 2006

DoA Annual report 2005/06 77
12.3 Agricultural debt, administered in terms of the Act, mentioned, consists of debt that resulted from loan assistance to farmers and prospective farmers granted by the former Agricultural Credit Board for pay-ment of debt, construction of improvements, purchasing of farms, farming equipment and production inputs and furthermore, other debt that resulted from other fi nancial assistance schemes with regard to the Production Loan Scheme for Small and Beginner Farmers and multiple debt that resulted from the implementation of certain subsidy schemes.
12.4 Following from previous reports the status of the Production Loan Scheme for Small and Beginner Farmers and multiple debt is again reported on:
12.4.1 Production Loan Scheme for Small and Beginner Farmers
12.4.1.1 Grovida
The State Attorney was requested on 29 April 1999 to take steps to recover the out-standing debt, which amounted to R1 030 321 (capital) and R565 097 (interest) on 31 March 2006. In terms of the resultant offer, total payments of R521 500 were re-ceived. However, as Grovida defaulted on this resultant offer, the matter was againreferred to the State Attorney. Following a new repayment arrangement, payments to the amount of R9 000 were received during the 2005/06 fi nancial year.
12.4.1.2 Bakgaga Bakopa
The State Attorney was requested on 7 September 1999 to take steps to recover the outstanding debt, which amounted to R728 585 (capital) and R728 585 (interest) on 31 March 2006. As the debt is irrecoverable, it is the considered opinion that the out-standing debt may be written off during the 2006/07 fi nancial year. The State Attorney issued a write-off execution. Following a nulla bona return of service by the Sheriff, the State Attorney recommended that the outstanding debt be written off based on the fact that it would be uneconomical to pursue. The Registrar of Co-operatives also in-dicated that the co-operative is dormant and that the name of the co-operative will be removed from the register.
12.4.1.3 Shiela Primary Co-op
The co-operative is under liquidation. At 31 March 2006 the outstanding debt amount-ed to R970 547 (capital) and R970 547 (interest). As the proceeds realised from the selling of the assets of the liquidated co-operative were insuffi cient to meet the debt, the debt is irrecoverable and may result in a write-off. The liquidation and distribution account is awaited.
12.4.1.4 Central Primary Co-operative (CPAC)
The State Attorney was requested on 29 June 1999 to assist with the recovery of the outstanding debt, which amounted to R3 600 000 (capital) and R3 600 000 (interest)on 31 March 2006. In respect of the 1994 production loan debt, which was taken over by CPAC, the outstanding debt amounted to R3 079 640 (capital) and R3 079 640 (interest) on 31 March 2006. As was previously reported, the option of judicial man-agement in terms of section 237(A) of the Co-operatives Act, 1981 (Act No. 91 of 1981), did not materialise. In order to establish the fi nancial position of CPAC and the possibility to revive CPAC, the DBSA funded an investigation by Pricewater house-Coopers. In the report, various recommendations were made regarding the revival of
DEPARTMENT OF AGRICULTURE
VOTE 25
REPORT OF THE ACCOUNTING OFFICERREPORT OF THE ACCOUNTING OFFICER
for the year ended 31 March 2006for the year ended 31 March 2006

Annual fi nancial statements78
CPAC and it was revealed that the assets of CPAC are of relatively little value and that CPAC has a limited income. A meeting took place on 3 November 2005 between the Management Committee of CPAC, the Registrar of Co-operatives, the Department of Agriculture, Conservation and Environment of the North West Province and the na-tional Department of Agriculture. It was emphasised that the issues pertaining to the revival of CPAC should be separated from CPAC’s debt commitments towards its creditors. In order to decide the way forward regarding CPAC’s outstanding debt, it was agreed that Financial Statements for 2004/05 must be submitted to the Offi ce of the Registrar of Co-operatives. These statements are still awaited. Based on the above, it is the considered opinion that the debt is irrecoverable and may result in a write-off.
12.4.1.5 Saron
The co-operative is under liquidation. At 31 March 2006 the outstanding debt amount-ed to R737 600 (capital) and R737 600 (interest). The liquidator indicated that the liquidated co-op is hopelessly insolvent. As the debt is irrecoverable, it is the consid-ered opinion that the outstanding debt may be written off during the 2006/07 fi nancial year.
12.4.1.6 Production loans (administrative costs)
The outstanding amount originated from overpayments of administration fees to agents managing the loan schemes as mentioned earlier (excluding CPAC). On 31 March 2006 the outstanding debt amounted to R3 861 147 (capital) and R3 858 236 (inter-est).
12.4.2 Multiple debt
12.4.2.1 Conversion of marginal ploughed lands
This debt originated from the non-compliance with the conditions of the scheme by the participants. In terms of these conditions, successful establishment of perennial pas-tures had to be achieved within two seasons and thereafter maintained for at least sixyears, failing which the subsidy plus interest have to be repaid immediately. Only one case, currently with the State Attorney, is outstanding. It is anticipated that the Depart-ment’s debt will be settled in full during the 2006/07 fi nancial year. On 31 March 2006 the outstanding debt under this scheme amounted to R5 436 in comparison to R139 794 as on 31 March 2005.
12.4.2.2 Emergency drought relief and interim veld recovery
This debt originated from the non-compliance by the participants with the prescripts ofthe scheme. The State Attorney is in the process of recovering the outstanding debt (amounting to R802 319 on 31 March 2006).
12.4.2.3 Farmworker housing subsidy
This debt originated from the non-adherence by participants to the conditions of the scheme. Two cases are currently outstanding. In one case, the Department is consid-ering writing off the outstanding debt, while in the other case the Department is in the process of recovering the outstanding debt. On 31 March 2006 the outstanding debt amounted to R185 971.
DEPARTMENT OF AGRICULTURE
VOTE 25
REPORT OF THE ACCOUNTING OFFICERREPORT OF THE ACCOUNTING OFFICER
for the year ended 31 March 2006for the year ended 31 March 2006

DoA Annual report 2005/06 79
12.4.2.4 Flood damage
The outstanding debt amounted to R19 634 and was written off during the 2005/06fi nancial year.
Approval
The Annual Financial Statements set out on pages 83 to 162 were approved by the acting Chief Financial Offi cer on behalf of the Accounting Offi cer and in terms of delegations granted.
T. Maraisfor DIRECTOR-GENERAL31 MAY 2006
DEPARTMENT OF AGRICULTURE
VOTE 25
REPORT OF THE ACCOUNTING OFFICERREPORT OF THE ACCOUNTING OFFICER
for the year ended 31 March 2006for the year ended 31 March 2006

Annual fi nancial statements80
REPORT OF THE AUDITOR-GENERAL TO PARLIAMENT ON THE FINANCIAL STATEMENTSREPORT OF THE AUDITOR-GENERAL TO PARLIAMENT ON THE FINANCIAL STATEMENTS
OF VOTE 25 — THE DEPARTMENT OF AGRICULTUREOF VOTE 25 — THE DEPARTMENT OF AGRICULTURE
FOR THE YEAR ENDED 31 MARCH 2006FOR THE YEAR ENDED 31 MARCH 2006
1. AUDIT ASSIGNMENT
The Financial Statements as set out on pages 83 to 154 for the year ended 31 March 2006, have been audited in terms of section 188 of the Constitution of the Republic of South Africa, 1996 (Act No. 108 of 1996), read with sections 4 and 20 of the Public Audit Act, 2004 (Act No. 25 of 2004). The fi xed asset opening balances have not been audited because of the timing of guidance from National Treasury to the departments relating to the treat-ment, valuation and disclosure of fi xed assets. These Financial Statements are the responsibility of the account-ing offi cer. My responsibility is to express an opinion on these Financial Statements, based on the audit.
2. SCOPE
The audit was conducted in accordance with the International Standards on Auditing read with General Notice 544 of 2006, issued in Government Gazette No. 28723 of 10 April 2006 ande General Notice 808 of 2006, is-sued in Government Gazette No. 28954 of 23 June 2006. Those standards require that I plan and perform the eaudit to obtain reasonable assurance that the Financial Statements are free of material mis statement.
An audit includes:• examining, on a test basis, evidence supporting the amounts and disclosures in the Financial State ments,• assessing the accounting principles used and signifi cant estimates made by management, and• evaluating the overall fi nancial statement presentation.
I believe that the audit provides a reasonable basis for my opinion.
3. BASIS OF ACCOUNTING
The department’s policy is to prepare fi nancial statements on the modifi ed cash basis of accounting deter-mined by the National Treasury, as described in paragraph 1.1 of the accounting policies to the fi nancial state-ments.
4. AUDIT OPINION
In my opinion, the Financial Statements present fairly, in all material respects, the fi nancial position of the Department of Agriculture at 31 March 2006 and the results of its operations and its cash fl ows for the year then ended, in accordance with the modifi ed cash basis of accounting determined by the National Treasury of South Africa, as described in paragraph 1.1 of the accounting policies to the Financial Statements, and in the manner required by PFMA.
5. EMPHASIS OF MATTER
Without qualifying the audit opinion, attention is drawn to the following matter:
5.1 Revenue
Policies and procedures to effi ciently and effectively manage revenue in the Department were not docu-mented which resulted in several defi ciencies identifi ed during the audit of revenue. Furthermore, reconcili-ations for revenue deposited against certifi cates and licences issued were not done throughout the year.
6. APPRECIATION
The assistance rendered by the staff of the Department of Agriculture during the audit is sincerely appreciated.
Auditor-GeneralPretoria31/07/2006

DoA Annual report 2005/06 81
1. AUDIT ASSIGNMENT
The fi nancial statements as set out on pages 155 to 162, for the year ended 31 March 2006 have been audited in terms of section 188 of the Constitution of the Republic of South Africa, 1996, read with sections 4 and 20 of the Public Audit Act, 2004 (Act No. 25 of 2004) and the Agriculture Debt Management Act, 2001 (Act No. 45 of 2001). These Financial Statements are the responsibility of the Accounting Offi cer. My responsibility is to express an opinion on these Financial Statements, based on the audit.
2. SCOPE
The audit was conducted in accordance with the International Standards on Auditing read with General Notice 544 of 2006, issued in Government Gazette No. 28723 of 10 April 2006 ande General Notice 808 of 2006, is-sued in Government Gazette No. 28954 of 23 June 2006. Those standards require that I plan and perform the eaudit to obtain reasonable assurance that the fi nancial statements are free of material misstatement.
An audit includes:
• examining, on a test basis, evidence supporting the amounts and disclosures in the fi nancial statements• assessing the accounting principles used and signifi cant estimates made by management, and• evaluating the overall fi nancial statement presentation.
I believe that the audit provides a reasonable basis for my opinion.
3. BASIS OF ACCOUNTING
The entity’s policy is to prepare Financial Statements on the basis of accounting determined by the National Treasury, as described in note 1 to the fi nancial statements.
4. QUALIFICATION
Financial statements
Financial instruments — limitation of scope
I was unable to perform all the necessary audit procedures on the compliance with the standards on fi nancial instruments. Therefore I could not reliably conclude on the accuracy and fair presentation of the majority of the balances disclosed in the annual fi nancial statements.
This is due to a lack of necessary expertise, proper accounting and data management systems that could allow the Department to comply with International Accounting Standards 32 and 39 (IAS 32 and IAS 39), respec-tively.
The following specifi c issues were identifi ed during the audit:
The Agricultural Debt Account’s impairment and provisions on loans and receivables, the fair value disclosure of debtors and calculation of interest revenue do not comply with the requirements of IAS 32 and IAS39—Financial Instruments. Furthermore, the requirement to apply the standards retrospectively affects the follow-ing current and prior year balances and amounts in the annual fi nancial statements:
• Long-term loans to farmers• Short-term portion of long-term loans• Accounts receivable• Accumulated reserves• Revenue• Provision for doubtful debts
REPORT OF THE AUDITOR-GENERAL TO PARLIAMENT ON THE FINANCIAL STATEMENTSREPORT OF THE AUDITOR-GENERAL TO PARLIAMENT ON THE FINANCIAL STATEMENTS
OF THE AGRICULTURAL DEBT ACCOUNTOF THE AGRICULTURAL DEBT ACCOUNT
FOR THE YEAR ENDED 31 MARCH 2006FOR THE YEAR ENDED 31 MARCH 2006

Annual fi nancial statements82
Consequently, as a result of lack of proper accounting system and data availability, I was unable to perform alternative audit procedures to determine the effect of noncompliance with the required accounting frame-work.
5. DISCLAIMER OF AUDIT OPINION
Because of the signifi cance of the matter referred to in the preceding paragraph, I do not express an opinion on the Financial Statements.
6. APPRECIATION
The assistance rendered by the staff of the Department of Agriculture during the audit is sincerely appreciated.
Auditor-GeneralPretoria31/07/2006
REPORT OF THE AUDITOR-GENERAL TO PARLIAMENT ON THE FINANCIAL STATEMENTSREPORT OF THE AUDITOR-GENERAL TO PARLIAMENT ON THE FINANCIAL STATEMENTS
OF THE AGRICULTURAL DEBT ACCOUNTOF THE AGRICULTURAL DEBT ACCOUNT
FOR THE YEAR ENDED 31 MARCH 2006FOR THE YEAR ENDED 31 MARCH 2006

DoA Annual report 2005/06 83
The Financial Statements have been prepared in accordance with the following policies, which have been applied consistently in all material aspects, unless otherwise indicated. However, where appropriate and meaningful, addi-tional information has been disclosed to enhance the usefulness of the Financial Statements and to comply with the statutory requirements of the Public Finance Management Act, 1999 (Act No. 1 of 1999) (as amended by Act No. 29 of 1999), and the Treasury Regulations issued in terms of the Act and the Division of Revenue Act, 2005 (ActNo.1 of 2005).
1. Presentation of the Financial Statements
1.1 Basis of preparation
The Financial Statements have been prepared on a modifi ed cash basis of accounting, except where stated otherwise. The modifi ed cash basis constitutes the cash basis of accounting supplemented with additional disclosure items. Under the cash basis of accounting, transactions and other events are recog-nised when cash is received or paid or when the fi nal authorisation for payment is effected on the system (not later than 31 March of each year).
1.2 Presentation currency
All amounts have been presented in the currency of the South African Rand (R), which is also the func-tional currency of the Department.
1.3 Rounding
Unless stated otherwise all fi nancial fi gures have been rounded off to the nearest one thousand Rand (R1 000).
1.4 Comparative figures
Prior period comparative information has been presented in the current year’s Financial Statements. Where necessary fi gures included in the prior period’s Financial Statements have been reclassifi ed to ensure that the format in which the information is presented is consistent with the format of the current year’s Financial Statements.
A comparison between actual and budgeted amounts per major classifi cation of expenditure is included in the Appropriation Statement.
2. Revenue
2.1 Appropriated funds
Appropriated funds are recognised in the fi nancial records on the date the appropriation becomes effec-tive. Adjustments to the appropriated funds made in terms of the adjustment budget process are recog-nised in the fi nancial records on the date the adjustments become effective.
Total appropriated funds are presented in the Statement of Financial Performance.
Unexpended appropriated funds are surrendered to the National Revenue Fund, unless approval has been given by the National Treasury to roll over the funds to the subsequent fi nancial year. These roll -over funds form part of retained funds in the Annual Financial Statements. Amounts owed to the National Revenue Fund at the end of the fi nancial year are recognised in the Statement of Financial Position.
2.2 Departmental revenue
All Departmental revenue is paid into the National Revenue Fund when received, unless stated other-wise.
DEPARTMENT OF AGRICULTURE
VOTE 25
ACCOUNTING POLICIESACCOUNTING POLICIES
for the year ended 31 March 2006for the year ended 31 March 2006

Annual fi nancial statements84
Amounts owed to the National Revenue Fund at the end of the fi nancial year are recognised in the State-ment of Financial Position.
2.2.1 Tax revenue
Tax revenue comprises all compulsory unrequited amounts collected by the Department in ac-cordance with laws and or regulations (excluding fi nes, penalties and forfeits).
Tax receipts are recognised in the Statement of Financial Performance when received.
2.2.2 Sales of goods and services other than capital assets
The proceeds received from the sale of goods and/or the provision of services is recognised in the Statement of Financial Performance when the cash is received.
2.2.3 Fines, penalties and forfeits
Fines, penalties and forfeits are compulsory unrequited amounts, which were imposed by a court or quasi-judicial body and collected by the Department. Revenue arising from fi nes, penalties and forfeits is recognised in the Statement of Financial Performance when the cash is received.
2.2.4 Interest, dividends and rent on land
Interest, dividends and rent on land are recognised in the Statement of Financial Performance when the cash is received.
2.2.5 Sale of capital assets
The proceeds received on sale of capital assets are recognised in the Statement of Financial Performance when the cash is received.
2.2.6 Financial transactions in assets and liabilities
Repayments of loans and advances previously extended to employees and public corporations forpolicy purposes are recognised as revenue in the Statement of Financial Performance on receipt of the funds. Amounts receivable on the reporting date are disclosed in the Disclosure Notes to the Annual Financial Statements.
Cheques issued in previous accounting periods that expire before being banked are recognisedas revenue in the Statement of Financial Performance when the cheques become stale. When the cheque is reissued the payment is made from Revenue.
2.2.7 Gifts, donations and sponsorships (transfers received)
All cash gifts, donations and sponsorships are paid into the National Revenue Fund and recorded as revenue in the Statement of Financial Performance when received. Amounts receivable on the reporting date are disclosed in the Disclosure Notes to the Annual Financial Statements.
All gifts in-kind, donations and sponsorships are disclosed at fair value in the annexures to the Annual Financial Statements.
2.3 Local and foreign aid assistance
Local and foreign aid assistance is recognised in the fi nancial records when notifi cation of the donation is received from the National Treasury or when the Department directly receives the cash from the donor(s).The total cash amounts received during the year is refl ected in the Statement of Financial Performance as revenue.
DEPARTMENT OF AGRICULTURE
VOTE 25
ACCOUNTING POLICIESACCOUNTING POLICIES
for the year ended 31 March 2006for the year ended 31 March 2006

DoA Annual report 2005/06 85
All in-kind local and foreign aid assistance is disclosed at fair value in the annexures to the Annual Financial Statements.
The cash payments made during the year relating to local and foreign aid assistance projects are recog-nised as expenditure in the Statement of Financial Performance. A receivable is recognised in the State-ment of Financial Position to the value of the amounts expensed prior to the receipt of the funds.
A payable is raised in the Statement of Financial Position where amounts were inappropriately expensed using local and foreign aid assistance. Unutilised amounts are recognised in the State ment of Financial Position.
3. Expenditure
3.1 Compensation of employees
Salaries and wages comprise payments to employees. Salaries and wages are recognised as an ex-pense in the Statement of Financial Performance when the fi nal authorisation for payment is effected on the system (not later than 31 March of each year).
All other payments are classifi ed as current expense.
Social contributions include the entities’ contribution to social insurance schemes paid on behalf of the employee. Social contributions are recognised as an expense in the Statement of Financial Performance when the fi nal authorisation for payment is effected on the system.
3.1.1 Short-term employee benefi ts
Short-term employee benefi ts comprise of leave entitlements (capped leave), thirteenth cheques and performance bonuses. The cost of short-term employee benefi ts is expensed as salaries and wages in the Statement of Financial Performance when the fi nal authorisation for payment is ef-fected on the system (not later than 31 March of each year).
Short-term employee benefi ts that give rise to a present legal or constructive obligation are dis-closed in the Notes to the Annual Financial Statements. These amounts are not recognised in the Statement of Financial Performance.
3.1.2 Long-term employee benefi ts
3.1.2.1 Termination benefi ts
Termination benefi ts such as severance packages are recognised as expenses in the Statement of Financial Performance as a transfer when the fi nal authorisation for pay-ment is effected on the system (not later than 31 March of each year).
3.1.2.2 Post-employment retirement benefi ts
The Department provides retirement benefi ts (pension benefi ts) for certain of its employ-ees through a defi ned benefi t plan for government employees. These benefi ts are fundedby both employer and employee contributions. Employer contributions (13 % of the basic salary of an employee) to the fund are expensed when the fi nal authorisation for payment to the fund is effected on the system (not later than 31 March of each year). No provision is made for retirement benefi ts in the fi nancial statements of the department. Any poten-tial liabilities are disclosed in the fi nancial statements of the National Revenue Fund andnot in the fi nancial statements of the employer department.
DEPARTMENT OF AGRICULTURE
VOTE 25
ACCOUNTING POLICIESACCOUNTING POLICIES
for the year ended 31 March 2006for the year ended 31 March 2006

Annual fi nancial statements86
3.1.2.3 Medical benefi ts
The Department provides medical benefi ts for certain of its employees. Employer contri-butions to the medical funds (two thirds of an employee’s monthly contribution, but lim-ited to R1 014 per month) are expensed when the fi nal authorisation for payment to the fund is effected on the system (not later than 31 March of each year). Contract workers, however, who prefer to provide their own medical contributions, receive a cash amount equal to 30 % of their basic salary, which includes a government contribution for medical benefi ts.
In the case of members of the Senior and Middle Management Service, members contri b-ute two thirds of their total monthly contribution to a medical aid scheme from the fl ex ibleportion and one third from the basic salary of a member’s annual remuneration package.
3.2 Goods and services
Payment made for goods and/or services are recognised as an expense in the Statement of Financial Performance when the fi nal authorisation for payment is effected on the system (not later than 31 March of each year). These expenses are classifi ed as capital if the goods and services were used on a capital project.
3.3 Interest and rent on land
Interest and rental payments are recognised as an expense in the Statement of Financial Performance when the fi nal authorisation for payment is effected on the system (not later than 31 March of each year).This item excludes rental for the use of buildings or other fi xed structures.
3.4 Financial transactions in assets and liabilities
Debts are written off when identifi ed as irrecoverable. Debts written off are limited to the amount of savings and/or underspending of appropriated funds. The write-offs occur at year-end or when funds are available. No provision is made for irrecoverable amounts; however, amounts are disclosed as a disclosure note.
All other losses are recognised when authorisation has been granted for the recognition thereof.
3.5 Unauthorised expenditure
When discovered, unauthorised expenditure is recognised as an asset in the Statement of Financial Posi-tion until such time as the expenditure is either approved by the relevant authority, recovered from the responsible person or written off as irrecoverable in the Statement of Financial Performance.
Unauthorised expenditure approved with funding is recognised in the Statement of Financial Performance when the unauthorised expenditure is approved and the related funds are received. If the amount is ap-proved without funding, it is recognised as expenditure, subject to availability of savings, in the Statement of Financial Performance on the date of approval.
3.6 Fruitless and wasteful expenditure
Fruitless and wasteful expenditure is recognised as an asset in the Statement of Financial Position until such time as the expenditure is recovered from the responsible person or written off as irrecoverable in the Statement of Financial Performance.
3.7 Irregular expenditure
Irregular expenditure is recognised as expenditure in the Statement of Financial Performance. If the ex-penditure is not condoned by the relevant authority, it is treated as an asset until recovered or written offas irrecoverable.
DEPARTMENT OF AGRICULTURE
VOTE 25
ACCOUNTING POLICIESACCOUNTING POLICIES
for the year ended 31 March 2006for the year ended 31 March 2006

DoA Annual report 2005/06 87
3.8 Transfers and subsidies
Transfers and subsidies are recognised as an expense when the fi nal authorisation for payment is ef-fected on the system (not later than 31 March of each year).
3.9 Expenditure for capital assets
Payments made for capital assets are recognised as an expense in the Statement of Financial Performance when the fi nal authorisation for payment is effected on the system (not later than 31 March of each year).
4. Assets
4.1 Cash and cash equivalents
Cash and cash equivalents are carried in the Statement of Financial Position at cost. For the purposes of the Cash Flow Statement, cash and cash equivalents comprise cash on hand, deposits held, other short-term investments of high liquidity and bank overdrafts.
4.2 Prepayments and advances
Amounts prepaid or advanced are recognised in the Statement of Financial Position when the payments are made.
4.3 Receivables
Receivables included in the Statement of Financial Position arise from cash payments made that are re-coverable from another party.
Revenue receivable but not yet collected and amounts that are potentially irrecoverable, are included in the Disclosure Notes to the Annual Financial Statements.
4.4 Investments
Capitalised investments are shown at cost in the Statement of Financial Position. Any cash fl ows such as dividends received or proceeds from the sale of the investment are recognised in the Statement of Financial Performance.
Investments are tested for an impairment loss whenever events or changes in circumstances indicate that the investment may be impaired. Any impairment loss is included in the Disclosure Notes to the Annual Financial Statements.
4.5 Loans
Loans are recognised in the Statement of Financial Position at the nominal amount. Amounts that are potentially irrecoverable are included in the Disclosure Notes to the Annual Financial Statements.
4.6 Inventory
Inventories on hand at the reporting date are disclosed at cost in the Report of the Accounting Offi cer.
4.7 Asset registers
Assets are recorded in an asset register, at cost, on receipt of the item. The cost of an asset is defi ned as the total cost of acquisition. Assets procured in previous fi nancial periods, may be stated at fair value, where determinable, or R1 in instances where the original cost of acquisition or fair value cannot be es-tablished. No revaluation or impairment of assets is currently recognised in the asset register. Construction/development projects extending longer than one fi nancial year relating to assets, are only included in the asset register on completion of the project and at the total cost incurred over the duration of the project.
DEPARTMENT OF AGRICULTURE
VOTE 25
ACCOUNTING POLICIESACCOUNTING POLICIES
for the year ended 31 March 2006for the year ended 31 March 2006

Annual fi nancial statements88
Annexures 4 and 5 of the Disclosure Notes to the Annual Financial Statements, refl ect the total movement in the asset register of assets with a cost equal to and exceeding R5 000 (therefore capital assets only) for the current fi nancial year. The movement is refl ected at the cost as recorded in the asset register and not the carrying value, as depreciation is not recognised in the Financial Statements under the modifi ed cash basis of accounting. The opening balance refl ected on in Annexures 4 and 5 will include items pro-cured in prior accounting periods and the closing balance will represent the total cost of the register forcapital assets on hand.
5. Liabilities
5.1 Payables
Recognised payables mainly comprise amounts owed to other governmental entities. These payables are recognised at historical cost in the Statement of Financial Position.
5.2 Lease commitments
Lease commitments represent amounts owed from the reporting date to the end of the lease contract. These commitments are not recognised in the Statement of Financial Position as a liability or as expend-iture in the Statement of Financial Performance but are included in the Disclosure Notes to the Annual Financial Statements.
Operating and fi nance lease commitments are expensed when the payments are made. Assets acquired in terms of fi nance lease agreements are disclosed in the Annexures to the Annual Financial State ments.
5.3 Accruals
Accruals represent goods/services that have been received, but where no invoice was received from the supplier at the reporting date, or where an invoice was received, but fi nal authorisation for payment was not effected on the system.
Accruals are not recognised in the Statement of Financial Position as a liability or as expenditure in the Statement of Financial Performance; however, these are included in the Disclosure Notes to the Annual Financial Statements.
5.4 Contingent liabilities
A contingent liability is a possible obligation that arises from past events and the existence of which will be confi rmed only by the occurrence or non-occurrence of one or more uncertain future events not wholly within the control of the Department; or
A contingent liability is a present obligation that arises from past events. However, it is not recognisedbecause:
It is not probable that an outfl ow of resources embodying economic benefi ts or service potential will be required to settle the obligation; orthe amount of the obligation cannot be measured with suffi cient reliability.
Contingent liabilities are included in the Disclosure Notes to the Annual Financial Statements.
5.5 Commitments
Commitments represent goods/services that have been approved and/or contracted, but where no deliv-ery has taken place at the reporting date.
Commitments are not recognised in the Statement of Financial Position as a liability or as expenditure in the Statement of Financial Performance, but are included in the Disclosure Notes to the Annual Financial Statements.
DEPARTMENT OF AGRICULTURE
VOTE 25
ACCOUNTING POLICIESACCOUNTING POLICIES
for the year ended 31 March 2006for the year ended 31 March 2006

DoA Annual report 2005/06 89
6. Net assets
6.1 Capitalisation reserve
The capitalisation reserve comprises fi nancial assets and/or liabilities originating in a prior reporting pe-riod but which are recognised in the Statement of Financial Position for the fi rst time in the current report-ing period. Amounts are transferred to the National Revenue Fund on disposal, repayment or recovery ofsuch amounts.
6.2 Recoverable revenue
Amounts are recognised as recoverable revenue when a payment made and recognised in a previous fi nancial year becomes recoverable from a debtor.
7. Key management personnel
Key management personnel are those persons having the authority and responsibility for planning, directing and controlling the activities of the Department.
Compensation paid to key management personnel, including their family members where relevant, is included in the Disclosure Notes to the Annual Financial Statements.
DEPARTMENT OF AGRICULTURE
VOTE 25
ACCOUNTING POLICIESACCOUNTING POLICIES
for the year ended 31 March 2006for the year ended 31 March 2006

Annual fi nancial statements90
DEPARTMENT OF AGRICULTURE
VOTE 25
APPROPRIATION STATEMENTAPPROPRIATION STATEMENT
for the year ended 31 March 2006for the year ended 31 March 2006
programme
2005/06 2004/05
Adjustedappropri-
ation
Shiftingof funds
Virement Finalappropri-
ation
Actualexpendi-
ture
Variance Expendi-ture as %
of fi nal appropri-
ation
Finalappropri-
ation
Actualexpendi-
ture
R’000 R’000 R’000 R’000 R’000 R’000 % R’000 R’000
1. Administration
Current payment Transfers and
subsidiesPayment forcapital assets
148 870
837
19 097
(5 135)
264
4 871
(3 971)
328
–
139 764
1 429
23 968
135 370
994
23 394
4 394
435
574
96,9
69,6
97,6
129 612
594
46 484
125 979
494
43 365
2. Farmer Support and Development
Current payment Transfers and
subsidies Payment for
capital assets
70 888
656 452
200
(1 209)
4
1 205
(12 758)
1
–
56 921
656 457
1 405
39 404
656 436
888
17 517
21
517
69,2
100,0
63,2
32 631
303 562
705
26 059
303 467
518
3. Agricultural Tradeand BusinessDevelopment
Current payment Transfers and
subsidiesPayment for capital assets
48 527
19 007
502
(700)
6
694
(5 624)
181
–
42 203
19 194
1 196
23 597
14 182
985
18 606
5 012
211
55,9
73,9
82,4
22 808
12 774
223
14 870
11 707
182
4. Economic Researchand Analysis
Current payment Transfers and
subsidies Payment for
capital assets
22 301
794
385
(2 201)
1
2 200
(1 879)
1
–
18 221
796
2 585
15 205
35
2 520
3 016
761
65
83,4
4,4
97,5
21 106
172
477
15 714
155
239
5. AgriculturalProduction
Current payment Transfers and
subsidies Payment for
capital assets
53 905
361 799
449
(765)
2
763
502
–
–
53 642
361 801
1 212
51 465
361 795
990
2 177
6
222
95,9
100,0
81,7
30 266
342 331
1 347
28 999
342 261
1 234
6. SustainableResources Man-agement and Use
Current payment Transfers and
subsidies Payment for
capital assets
77 688
42 586
55 592
(2 688)
77
2 611
(5 978)
11
–
69 022
42 674
58 203
67 531
42 565
58 110
1 491
109
93
97,8
99,7
99,8
68 842
45 334
45 168
54 031
45 046
44 142
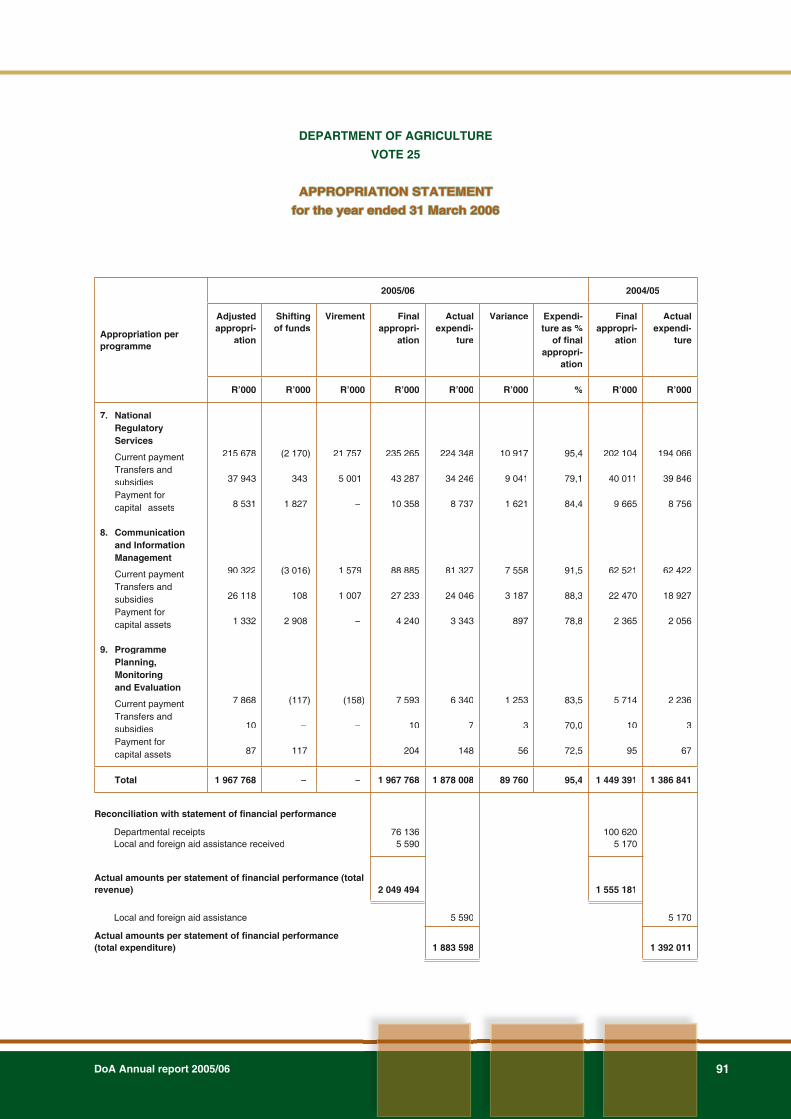
DoA Annual report 2005/06 91
Appropriation perprogramme
2005/06 2004/05
Adjustedappropri-
ation
Shiftingof funds
Virement Finalappropri-
ation
Actualexpendi-
ture
Variance Expendi-ture as %
of fi nal appropri-
ation
Finalappropri-
ation
Actualexpendi-
ture
R’000 R’000 R’000 R’000 R’000 R’000 % R’000 R’000
7. NationalRegulatoryServices
Current payment Transfers and
subsidies Payment for
capital assets
215 678
37 943
8 531
(2 170)
343
1 827
21 757
5 001
–
235 265
43 287
10 358
224 348
34 246
8 737
10 917
9 041
1 621
95,4
79,1
84,4
202 104
40 011
9 665
194 066
39 846
8 756
8. Communicationand InformationManagement
Current payment Transfers and
subsidiesPayment for capital assets
90 322
26 118
1 332
(3 016)
108
2 908
1 579
1 007
–
88 885
27 233
4 240
81 327
24 046
3 343
7 558
3 187
897
91,5
88,3
78,8
62 521
22 470
2 365
62 422
18 927
2 056
9. ProgrammePlanning,Monitoringand Evaluation
Current payment Transfers and
subsidiesPayment forcapital assets
7 868
10
87
(117)
–
117
(158)
–
–
7 593
10
204
6 340
7
148
1 253
3
56
83,5
70,0
72,5
5 714
10
95
2 236
3
67
Total 1 967 768 – – 1 967 768 1 878 008 89 760 95,4 1 449 391 1 386 841
Reconciliation with statement of fi nancial performance
Departmental receiptsLocal and foreign aid assistance received
76 1365 590
100 6205 170
Actual amounts per statement of fi nancial performance (totalrevenue) 2 049 494 1 555 181
Local and foreign aid assistance 5 590 5 170
Actual amounts per statement of fi nancial performance(total expenditure) 1 883 598 1 392 011
DEPARTMENT OF AGRICULTURE
VOTE 25
APPROPRIATION STATEMENTAPPROPRIATION STATEMENT
for the year ended 31 March 2006for the year ended 31 March 2006

Annual fi nancial statements92
DEPARTMENT OF AGRICULTURE
VOTE 25
APPROPRIATION STATEMENTAPPROPRIATION STATEMENT
for the year ended 31 March 2006for the year ended 31 March 2006
Appropriation pereconomicclassifi cation
2005/06 2004/05
Adjustedappropri-
ation
Shiftingof funds
Virement Finalappropri-
ation
Actualexpendi-
ture
Variance Expendi-ture as %
of fi nalappro-
priation
Finalappropri-
ation
Actualexpendi-
ture
R’000 R’000 R’000 R’000 R’000 R’000 % R’000 R’000
Current payment
Compensation ofemployees 381 807 (22 811) (13 012) 345 984 337 738 8 246 97,6 321 601 306 469
Goods and services 354 240 4 810 5 752 364 802 306 130 58 672 83,9 253 055 216 970
Financial transactionsin assets and liabilities – – 730 730 719 11 98,5 948 937
Transfers andsubsidies
Provinces andmunicipalities 411 744 48 – 411 792 411 332 460 99,9 345 844 345 019
Departmental agencies and accounts 384 711 – 1 000 385 711 385 711 – 100,0 358 906 358 905
Foreign governments and international organisations 158 241 – – 158 241 155 074 3 167 98,0 15 949 12 998
Public corporations and private enterprises 146 460 – 421 146 881 146 785 96 99,9 2 851 2 428
Non-profi t institutions 600 – 179 779 779 – 100,0 3 683 2 626
Households 43 790 757 4 930 49 477 34 625 14 852 70,0 40 025 39 930
Payment for capitalassets
Buildings and otherfi xed structures 59 182 1 331 – 60 513 60 331 182 99,7 75 044 74 859
Machinery and equipment 25 048 12 210 – 37 258 33 376 3 882 89,6 26 093 22 581
Biological or cultivated assets – 12 – 12 11 1 91,7 175 175
Software and otherintangible assets 1 945 3 643 – 5 588 5 397 191 96,6 5 217 2 944
Total 1 967 768 – – 1 967 768 1 878 008 89 760 95,4 1 449 391 1 386 841

DoA Annual report 2005/06 93
DEPARTMENT OF AGRICULTURE
VOTE 25
DETAIL PER PROGRAMME 1 – ADMINISTRATIONDETAIL PER PROGRAMME 1 – ADMINISTRATION
for the year ended 31 March 2006for the year ended 31 March 2006
Programme persubprogramme
2005/06 2004/05
Adjustedappropri-
ation
Shiftingof funds
Virement Finalappropri-
ation
Actualexpendi-
ture
Variance Expendi-ture as
% of fi nal
appropri-ation
Finalappropri-
ation
Actualexpendi-
ture
R’000 R’000 R’000 R’000 R’000 R’000 % R’000 R’000
1.1 Minister
Current payment 843 – – 843 837 6 99,3 792 791
1.2 Deputy Minister
Current payment – – – – – – – 644 643
1.3 Management
Current paymentTransfers and subsidiesPayment for capitalassets
35 359108
45
(785)221
1 027
(1 820)322
–
32 754651
1 072
30 333598
913
2 42153
159
92,691,9
85,2
34 180185
653
32 233161
375
1.4 Corporate services
Current paymentTransfers and subsidiesPayment for capital assets
112 668729
1 816
(4 350) 43
3 844
(2 435)6
–
105 883778
5 660
103 919396
5 245
1 964382
415
98,150,9
92,7
93 243409
8 953
91 562333
6 120
1.5 Capital works
Payment for capital assets 17 236 – – 17 236 17 236 – 100,0 6 878 36 870
1.6 Thefts and losses
Current payment – – 284 284 281 3 98,9 753 750
Total 168 804 – (3 643) 165 161 159 758 5 403 96,7 176 690 169 838

Annual fi nancial statements94
Economicclassifi cation
2005/06 2004/05
Adjustedappropri-
ation
Shiftingof funds
Virement Finalappropri-
ation
Actualexpendi-
ture
Variance Expendi-ture as
% of fi nal appropri-
ation
Finalappropri-
ation
Actualexpendi-
ture
R’000 R’000 R’000 R’000 R’000 R’000 % R’000 R’000
Current payment
Compensation of employeesGoods and servicesFinancial transactions in assets and liabilities
93 89354 977
–
(6 417) 1 282
–
(3 227)(1 028)
284
84 24955 231
284
82 91252 177
281
1 3373 054
3
98,494,5
98,9
80 76748 092
753
78 29346 936
750
Transfers and subsidies
Provinces and municipalitiesPublic corporation and private enterprisesHouseholds
663
45129
–
–264
–
328 –
663
373393
335
326333
328
4760
50,5
87,484,7
355
14891
313
9784
Payment for capital assets
Buildings and other fi xedstructuresMachinery and equipmentSoftware and other intangibleassets
17 236311
1 550
–6 080
(1 209)
––
–
17 2366 391
341
17 2365 895
263
–496
78
100,092,2
77,1
36 8785 067
4 539
36 8704 037
2 458
Total 168 804 – (3 643) 165 161 159 758 5 403 96,7 176 690 169 838
DEPARTMENT OF AGRICULTURE
VOTE 25
DETAIL PER PROGRAMME 1 – ADMINISTRATIONDETAIL PER PROGRAMME 1 – ADMINISTRATION
for the year ended 31 March 2006for the year ended 31 March 2006

DoA Annual report 2005/06 95
DEPARTMENT OF AGRICULTURE
VOTE 25
DETAIL PER PROGRAMME 2 – FARMER SUPPORT AND DEVELOPMENTDETAIL PER PROGRAMME 2 – FARMER SUPPORT AND DEVELOPMENT
for the year ended 31 March 2006for the year ended 31 March 2006
subprogramme
2005/06 2004/05
Adjustedappropri-
ation
Shiftingof funds
Virement Finalappropri-
ation
Actualexpendi-
ture
Variance Expendi-ture as
% of fi nal appropri-
ation
Finalappropri-
ation
Actualexpendi-
ture
R’000 R’000 R’000 R’000 R’000 R’000 % R’000 R’000
2.1 Management
Current paymentTransfers and subsidies
1 4822
––
(677)–
8052
2511
5541
31,250,0
71283
33782
2.2 Farmer Settlement
Current payment Transfers and subsidiesPayment for capitalassets
39 730252 416
200
(3 841) –
511
(8659)–
–
27 230252 416
711
18 281252 399
201
8 94917
510
67,1100,0
28,3
17 809202 315
526
12 446202 292
401
2.3 Agricultural Financeand Co-operativeDevelopment
Current payment Transfers and subsidies Payment for capital
assets
6 41713
–
(3 891)3
144
4 1011
–
6 62717
144
6 62616
143
11
1
100,094,1
99,3
5 2651 087
–
5 2621 070
–
2.4 Food Security andRural Development
Current payment Transfers and subsidies Payment for capital
assets
11 466140 011
–
2 194(1)
307
(6 024)–
–
7 636140 010
307
6 780140 010
307
856–
–
88,8100,0
100,0
2 55359
150
2 51811
90
2.5 Agricultural Risk and Disaster Management
Current payment Transfers and subsidies Payment for capital
assets
5 793120 010
–
1852
113
(499)–
–
5 479120 012
113
5 153120 010
107
3262
6
94,1100,0
94,7
3 167100 010
29
3 102100 006
27
2.6 Registrar ofCo-operatives
Current payment Transfers and subsidies
––
––
––
––
––
––
––
3 1028
2 3726
2.7 Micro AgriculturalFinance Scheme
Current payment Transfers and subsidies Payment for capital
assets
6 000144 000
–
4 144 –
130
(1 000)–
–
9 144144 000
130
2 313144 000
130
6 831–
–
25,3100,0
100,0
––
–
––
–
2.8 Thefts and losses
Current payment – – – – – – – 23 22
Total 727 540 – (12 757) 714 783 696 728 18 055 97,5 336 898 330 044

Annual fi nancial statements96
Economic
classification
2005/06 2004/05
Adjustedappropri-
ation
Shiftingof funds
Virement Finalappropri-
ation
Actualexpendi-
ture
Variance Expendi-ture as
% of fi nal
appro-priation
Finalappropri-
ation
Actualexpendi-
ture
R’000 R’000 R’000 R’000 R’000 R’000 % R’000 R’000
Current payment
Compensation of employeesGoods and servicesFinancial transactions in assets and liabilities
26 57244 316
–
(4)(1 205)
–
(5 459)(7 299)
–
21 10935 812
–
20 25319 151
–
85616 661
–
95,953,5
–
18 11314 495
23
17 3808 657
22
Transfers and subsidies
Provinces and municipalitiesForeign governments andinternational organisationsPublic corporations and private enterprisesNon-profi t institutionsHouseholds
370 067
140 000
146 385––
2
–
– –2
–
–
1 – –
370 069
140 000
146 386–2
370 062
140 000
146 373–1
7
–
13–1
100,0
100,0
100,0–
50,0
300 109
–
2 3041 058
91
300 058
–
2 2701 058
81
Payment for capital assets
Buildings and other fi xedstructuresMachinery and equipment
–200
– 1 205
––
–1 405
–888
–517
–63,2
23682
22496
Total 727 540 – (12 757) 714 783 696 728 18 055 97,5 336 898 330 044
DEPARTMENT OF AGRICULTURE
VOTE 25
DETAIL PER PROGRAMME 2 – FARMER SUPPORT AND DEVELOPMENTDETAIL PER PROGRAMME 2 – FARMER SUPPORT AND DEVELOPMENT
for the year ended 31 March 2006for the year ended 31 March 2006

DoA Annual report 2005/06 97
DEPARTMENT OF AGRICULTURE
VOTE 25
DETAIL PER PROGRAMME 3 – AGRICULTURAL TRADE AND BUSINESS DEVELOPMENTDETAIL PER PROGRAMME 3 – AGRICULTURAL TRADE AND BUSINESS DEVELOPMENT
for the year ended 31 March 2006for the year ended 31 March 2006
Programme persubprogramme
2005/06 2004/05
Adjustedappropri-
ation
Shiftingof funds
Virement Finalappropri-
ation
Actualexpendi-
ture
Variance Expendi-ture as
% of fi nal
appropri-ation
Finalappropri-
ation
Actualexpendi-
ture
R’000 R’000 R’000 R’000 R’000 R’000 % R’000 R’000
3.1 Management
Current payment Transfers and subsidies Payment for capital
assets
1 2662
45
891
–
––
–
1 3553
45
1 1792
18
1761
27
87,066,7
40,0
1 1022
–
1 0872
–
3.2 Business andEntrepreneurialDevelopment
Current payment Transfers and subsidies Payment for capital
assets
28 4695 016
350
(1 370)–
670
(5 624)181
–
21 4755 197
1 020
6 137190
858
15 3385 007
162
28,63,7
84,1
6 8082 144
49
3 1231 084
24
3.3 Marketing
Current payment Transfers and subsidies Payment for capital
assets
8 33412
30
686–
14
––
–
9 02012
44
6 97611
24
2 0441
20
77,391,7
54,5
5 87012
51
4 0888
36
3.4 International Trade
Current payment Transfers and subsidies Payment for capital
assets
10 45816
77
(105)5
10
––
–
10 35321
87
9 30518
85
1 0483
2
89,985,7
97,7
9 02715
123
6 57212
122
3.5 National AgriculturalMarketing Council
Transfers and subsidies 13 961 – – 13 961 13 961 – 100,0 10 601 10 601
3.6 Thefts and losses
Current payment – – – – – – – 1 –
Total 68 036 – (5 443) 62 593 38 764 23 829 61,9 35 805 26 759

Annual fi nancial statements98
DEPARTMENT OF AGRICULTURE
VOTE 25
DETAIL PER PROGRAMME 3 – AGRICULTURAL TRADE AND BUSINESS DEVELOPMENTDETAIL PER PROGRAMME 3 – AGRICULTURAL TRADE AND BUSINESS DEVELOPMENT
for the year ended 31 March 2006for the year ended 31 March 2006
Economic
classification
2005/06 2004/05
Adjustedappropri-
ation
Shiftingof funds
Virement Finalappropri-
ation
Actualexpendi-
ture
Variance Expendi-ture as
% of fi nal appropri-
ation
Finalappropri-
ation
Actualexpendi-
ture
R’000 R’000 R’000 R’000 R’000 R’000 % R’000 R’000
Current payment
Compensation of employeesGoods and servicesFinancial transactions inassets and liabilities
16 91931 608
–
(1 057) 357
–
(981)(4 643)
–
14 88127 322
–
13 09110 506
–
1 79016 816
–
88,038,5
–
12 32310 484
1
8 5086 362
–
Transfers and subsidies
Provinces and municipalitiesDept agencies and accountsPublic corporations and private enterprisesNon-profi t institutionsHouseholds
4613 961
––
5 000
6–
–––
––
2 179
–
5213 961
2179
5 000
4013 961
2179
–
12–
––
5 000
76,9100,0
100,0100,0
–
4310 601
–2 130
–
2610 601
–1 080
–
Payment for capital assets
Machinery and equipmentSoftware and other intangible assets
492
10
694
–
–
–
1 186
10
985
–
201
10
83,1
–
223
–
182
–
Total 68 036 – (5 443) 62 593 38 764 23 829 61,9 35 805 26 759

DoA Annual report 2005/06 99
DEPARTMENT OF AGRICULTURE
VOTE 25
DETAIL PER PROGRAMME 4 – ECONOMIC RESEARCH AND ANALYSISDETAIL PER PROGRAMME 4 – ECONOMIC RESEARCH AND ANALYSIS
for the year ended 31 March 2006for the year ended 31 March 2006
Programme persubprogramme
2005/06 2004/05
Adjustedappropri-
ation
Shiftingof funds
Virement Final appropri-
ation
Actualexpendi-
ture
Variance Expendi-ture as
% offi nal
appropri-ation
Finalappropri-
ation
Actualexpendi-
ture
R’000 R’000 R’000 R’000 R’000 R’000 % R’000 R’000
4.1 Management
Current payment Transfers and subsidies
1 062–
(118) 3
––
9443
2381
7062
25,233,3
9092
129–
4.2 Production and Re-source Economics
Current payment Transfers and subsidies Payment for capital
assets
9 375770
245
(1 600)–
1 600
(1 878)–
–
5 897770
1 845
5 26012
1 782
637758
63
89,21,6
96,6
6 600149
157
4 825140
12
4.3 Agricultural Statistics
Current payment Transfers and subsidies Payment for capital
assets
11 86424
140
(483)(2)
600
(7)1
–
11 37423
740
9 70222
738
1 6721
2
85,395,7
99,7
13 59221
320
10 75615
227
4.4 Thefts and losses
Current payment – – 6 6 5 1 83,3 5 4
Total 23 480 – (1 878) 21 602 17 760 3 842 82,2 21 755 16 108

Annual fi nancial statements100
Economic
classification
2005/06 2004/05
Adjustedappropri-
ation
Shiftingof funds
Virement Finalappropri-
ation
Actualexpendi-
ture
Variance Expen di-ture as
% of fi nal
appropri-ation
Finalappropri-
ation
Actualexpendi-
ture
R’000 R’000 R’000 R’000 R’000 R’000 % R’000 R’000
Current payment
Compensation of employeesGoods and servicesFinancial transactions in assets and liabilities
16 2166 085
–
(1 423)(778)
–
(1 878)(7)
6
12 9155 300
6
11 0094 191
5
1 9061 109
1
85,279,1
83,3
10 93410 167
5
8 0907 620
4
Transfers and subsidies
Provinces and municipalitiesPublic corporations and private enterprisesNon-profi t institutions Households
44
––
750
1
–––
–
1––
45
1–
750
34
1––
11
––
750
75,6
100,0––
41
–131
–
25
–130
–
Payment for capital assets
Machinery and equipmentSoftware and other intangibleassets
385
–
400
1 800
–
–
785
1 800
720
1 800
65
–
91,7
100,0
477
–
239
–
Total 23 480 – (1 878) 21 602 17 760 3 842 82,2 21 755 16 108
DEPARTMENT OF AGRICULTURE
VOTE 25
DETAIL PER PROGRAMME 4 – ECONOMIC RESEARCH AND ANALYSISDETAIL PER PROGRAMME 4 – ECONOMIC RESEARCH AND ANALYSIS
for the year ended 31 March 2006for the year ended 31 March 2006

DoA Annual report 2005/06 101
DEPARTMENT OF AGRICULTURE
VOTE 25
DETAIL PER PROGRAMME 5 – AGRICULTURAL PRODUCTIONDETAIL PER PROGRAMME 5 – AGRICULTURAL PRODUCTION
for the year ended 31 March 2006for the year ended 31 March 2006
Programme persubprogramme
2005/06 2004/05
Adjustedappropri-
ation
Shiftingof funds
Virement Finalappropri-
ation
Actualexpendi-
ture
Variance Expen di-ture as
% of fi nal
appropri-ation
Finalappropri-
ation
Actualexpendi-
ture
R’000 R’000 R’000 R’000 R’000 R’000 % R’000 R’000
5.1 Management
Current payment Transfers and subsidies Payment for capital
assets
4 7012
18
(3 198)251
33
(178)–
–
1 325253
51
1 308251
30
172
21
98,799,2
58,8
1 1362
35
1 1262
27
5.2 Animal and AquaProduction
Current payment Transfers and subsidies Payment for capital
assets
4 106861
14
3 080(250)
238
(2 151) –
–
5 035611
252
5 031611
154
4–
98
99,9100,0
61,1
2 576125
130
2 56579
125
5.3 Plant Production
Current payment Transfers and subsidies Payment for capital
assets
13 70119
209
(636)–
373
(3 429)–
–
9 63619
582
8 15117
551
1 4852
31
84,689,5
94,7
5 78239
910
5 83826
845
5.4 Scientifi c Researchand Development
Current payment Transfers and subsidies Payment for capital
assets
25 0943
150
6111
–
6 983 –
–
32 6884
150
32 2234
123
465–
27
98,6100,0
82,0
16 5453
123
15 6193
97
5.5 Genetic Resources
Current payment Transfers and subsidies Payment for capital
assets
6 30312
58
(622)–
119
(732)–
–
4 94912
177
4 74410
132
2052
45
95,983,3
74,6
4 22718
149
3 8517
140
5.6 AgriculturalResearch Council
Transfers and subsidies 360 902 – – 360 902 360 902 – 100,0 342 144 342 144
5.7 Thefts and losses
Current payment – – 9 9 8 1 88,9 – –
Total 416 153 – 502 416 655 414 250 2 405 99,4 373 944 372 494

Annual fi nancial statements102
DEPARTMENT OF AGRICULTURE
VOTE 25
DETAIL PER PROGRAMME 5 – AGRICULTURAL PRODUCTIONDETAIL PER PROGRAMME 5 – AGRICULTURAL PRODUCTION
for the year ended 31 March 2006for the year ended 31 March 2006
Economic
classification
2005/06 2004/05
Adjustedappropri-
ation
Shiftingof funds
Virement Finalappropri-
ation
Actualexpendi-
ture
Variance Expendi-ture as
% of fi nal
appropri-ation
Finalappropri-
ation
Actualexpendi-
ture
R’000 R’000 R’000 R’000 R’000 R’000 % R’000 R’000
Current payment
Compensation of employeesGoods and servicesFinancial transactions in assets and liabilities
19 99833 907
–
(2 298) 1 533
–
(2 459) 2 952
9
15 24138 392
9
13 94637 511
8
1 295881
1
91,597,7
88,9
9 44720 819
–
9 07919 916
–
Transfers and subsidies
Provinces and municipalitiesDept agencies and accountsPublic corporations and private enterprisesNon-profi t institutionsHouseholds
47361 152
–600
–
2 –
– – –
––
–––
49361 152
–600
–
43361 152
–600
–
6–
–––
87,8100,0
–100,0
–
34342 144
34–
119
20342 144
7–
90
Payment for capital assets
Machinery and equipment 449 763 – 1 212 990 222 81,7 1 347 1 238
Total 416 153 – 502 416 655 414 250 2 405 99,4 373 944 372 494

DoA Annual report 2005/06 103
DEPARTMENT OF AGRICULTURE
VOTE 25
DETAIL PER PROGRAMME 6 – SUSTAINABLE RESOURCES MANAGEMENT AND USEDETAIL PER PROGRAMME 6 – SUSTAINABLE RESOURCES MANAGEMENT AND USE
for the year ended 31 March 2006for the year ended 31 March 2006
Programme persubprogramme
2005/06 2004/05
Adjustedappropri-
ation
Shiftingof funds
Virement Finalappropri-
ation
Actualexpendi-
ture
Variance Expendi-ture as
% offi nal
appropri-ation
Finalappropri-
ation
Actualexpendi-
ture
R’000 R’000 R’000 R’000 R’000 R’000 % R’000 R’000
6.1 Management
Current payment Transfers and subsidies
Payment for capitalassets
1 6123
–
(134)–
40
(39)–
–
1 4393
40
1 3412
37
981
3
93,266,7
92,5
1 2713
52
1 1893
50
6.2 Water Use and Irri-gation Development
Current payment Transfers and subsidies
Payment for capital assets
7 6672 427
55 323
1 40277
195
(4 648)10
–
4 4212 514
55 518
3 5012 488
55 428
92026
90
79,299,0
99,8
5 041989
43 688
4 933981
43 460
6.3 Land Use and SoilManagement
Current payment Transfers and subsidies
Payment for capital assets
68 40940 156
269
(3 956)–
2 376
(1 461)1
–
62 99240 157
2 645
62 52040 075
2 645
47282
–
99,399,8
100,0
62 52344 342
1 428
47 90244 062
632
6.4 Thefts and losses
Current payment – – 170 170 169 1 99,4 7 7
Total 175 866 – (5 967) 169 899 168 206 1 693 99,0 159 344 143 219

Annual fi nancial statements104
Economicclassifi cation
2005/06 2004/05
Adjustedappropri-
ation
Shiftingof funds
Virement Finalappropri-
ation
Actualexpendi-
ture
Variance Expen di-ture as
% of fi nal appro-
priation
Finalappro-
priation
Actualexpendi-
ture
R’000 R’000 R’000 R’000 R’000 R’000 % R’000 R’000
Current payment
Compensation of employeesGoods and servicesFinancial transactions inassets and liabilities
28 79348 895
–
(1 511)(1 177)
–
(2 627)(3 521)
170
24 65544 197
170
24 36842 994
169
2871 203
1
98,897,3
99,4
26 81942 016
7
24 98729 037
7
Transfers and subsidies
Provinces and municipalitiesDept agencies and accountsPublic corporations andprivate enterprisesNon-profi t institutionsHouseholds
40 4051 878
––
303
4–
––
73
––
11––
40 4091 878
11–
376
40 3801 878
9–
298
29–
2–
78
99,9100,0
81,8–
79,3
44 219500
28180
254
44 189500
2680
251
Payment for capital assets
Buildings and other fi xed structuresMachinery and equipmentSoftware and other intangible assets
41 50613 733
353
1 130(1 376)
2 857
––
–
42 63612 357
3 210
42 55112 349
3 210
858
–
99,899,9
100,0
38 1436 929
96
37 9676 168
7
Total 175 866 – (5 967) 169 899 168 206 1 693 99,0 159 344 143 219
DEPARTMENT OF AGRICULTURE
VOTE 25
DETAIL PER PROGRAMME 6 – SUSTAINABLE RESOURCES MANAGEMENT AND USEDETAIL PER PROGRAMME 6 – SUSTAINABLE RESOURCES MANAGEMENT AND USE
for the year ended 31 March 2006for the year ended 31 March 2006

DoA Annual report 2005/06 105
DEPARTMENT OF AGRICULTURE
VOTE 25
DETAIL PER PROGRAMME 7 – NATIONAL REGULATORY SERVICESDETAIL PER PROGRAMME 7 – NATIONAL REGULATORY SERVICES
for the year ended 31 March 2006for the year ended 31 March 2006
Programme persubprogramme
2005/06 2004/05
Adjustedappropri-
ation
Shiftingof funds
Virement Finalappropri-
ation
Actualexpendi-
ture
Variance Expendi-ture as
% offi nal
appro-priation
Finalappro-
priation
Actualexpendi-
ture
R’000 R’000 R’000 R’000 R’000 R’000 % R’000 R’000
7.1 Management
Current payment Transfers and subsidies Payment for capital
assets
1 7712
15
2 774–
–
(37)–
–
4 5082
15
3401
15
4 1681
–
7,550,0
100,0
1 2353
11
1 2102
11
7.2 Food Safety andQuality Assurance
Current payment Transfers and subsidies Payment for capital
assets
33 537175
369
(3 294)(4)
231
(1 570) –
–
28 673171
600
28 003162
594
6709
6
97,794,7
99,0
29 444698
330
29 155663
317
7.3 Plant Health
Current payment Transfers and subsidies Payment for capital
assets
8 77320
176
(745)2
198
(565)–
–
7 46322
374
7 18918
367
2744
7
96,381,8
98,1
5 778191
207
5 598190
180
7.4 Animal Health
Current payment Transfers and subsidies Payment for capital
assets
83 12937 576
2 024
2 3085
–
27 041 4 930
–
112 47842 511
2 024
108 71733 504
1 760
3 7619 007
264
96,778,8
87,0
96 52438 624
1 478
89 98838 503
908
7.5 South African Agricultural Food,Quarantine and Inspection Services
Current payment Transfers and subsidies Payment for capital
assets
88 468170
5 947
(3 213) 340
1 398
(3 367)71
–
81 888581
7 345
79 848561
6 001
2 04020
1 344
97,596,6
81,7
68 971495
7 639
67 966488
7 340
7.6 Thefts and losses
Current payment – – 255 255 251 4 98,4 152 149
Total 262 152 – 26 758 288 910 267 331 21 579 92,5 251 780 242 668

Annual fi nancial statements106
DEPARTMENT OF AGRICULTURE
VOTE 25
DETAIL PER PROGRAMME 7 – NATIONAL REGULATORY SERVICESDETAIL PER PROGRAMME 7 – NATIONAL REGULATORY SERVICES
for the year ended 31 March 2006for the year ended 31 March 2006
Economicclassifi cation
2005/06 2004/05
Adjustedappropri-
ation
Shiftingof funds
Virement Finalappropri-
ation
Actualexpendi-
ture
Variance Expendi-ture as
% of fi nal
appro-priation
Finalappro-
priation
Actualexpendi-
ture
R’000 R’000 R’000 R’000 R’000 R’000 % R’000 R’000
Current payment
Compensation of employeesGoods and servicesFinancial transactions in assets and liabilities
134 79580 883
–
(6 132) 3 962
–
3 77717 725
255
132 440102 570
255
131 96592 132
251
47510 438
4
99,689,8
98,4
123 95178 001
152
123 40370 518
149
Transfers and subsidies
Provinces and municipalitiesPublic corporations andprivate enterprisesNon-profi t institutions Households
347
30–
37 566
10
– –
333
–
71–
4 930
357
101–
42 829
307
68–
33 871
50
33–
8 958
86,0
67,3–
79,1
335
83284
39 309
276
27278
39 265
Payment for capital assets
Buildings and other fi xedstructuresMachinery and equipmentSoftware and other intangibleassets
4408 091
–
201 1 536
90
––
–
6419 627
90
5448 109
84
971 518
6
84,984,2
93,3
–9 246
419
–8 348
404
Total 262 152 – 26 758 288 910 267 331 21 579 92,5 251 780 242 668

DoA Annual report 2005/06 107
DEPARTMENT OF AGRICULTURE
VOTE 25
DETAIL PER PROGRAMME 8 – COMMUNICATION AND INFORMATION MANAGEMENTDETAIL PER PROGRAMME 8 – COMMUNICATION AND INFORMATION MANAGEMENT
for the year ended 31 March 2006for the year ended 31 March 2006
Programme persubprogramme
2005/06 2004/05
Adjustedappropri-
ation
Shiftingof funds
Virement Finalappropri-
ation
Actualexpendi-
ture
Variance Expendi-ture as
% of fi nal
appropri-ation
Finalappropri-
ation
Actualexpendi-
ture
R’000 R’000 R’000 R’000 R’000 R’000 % R’000 R’000
8.1 Management
Current payment Transfers and subsidies Payment for capital
assets
1 7682
–
(1 626)–
–
––
–
1422
–
92–
–
502
–
64,8–
–
712
20
70–
–
8.2 Agricultural Infor-mation Services
Current payment Transfers and subsidies Payment for capital
assets
22 12551
232
(1 261)11
1 146
4 736–
–
25 60062
1 378
25 36161
703
2391
675
99,198,4
51,0
17 73856
856
17 85653
622
8.3 InternationalRelations
Current payment Transfers and subsidies Payment for capital
assets
11 75418 254
–
1 01774
518
––
–
12 77118 328
518
12 77015 151
515
13 177
3
100,082,7
99,4
10 27716 051
111
10 02613 089
109
8.4 Education andTraining
Current payment Transfers and subsidies Payment for capital
assets
31 5667 735
–
(2 738)7
270
(3 150)1 000
–
25 6788 742
270
18 4568 742
160
7 222–
110
71,9100,0
59,3
12 5215 682
232
12 5585 680
193
8.5 Grootfontein Agricul-tural DevelopmentInstitute
Current payment Transfers and subsidies Payment for capital
assets
23 10976
1 100
1 592 16
974
(7)7
–
24 69499
2 074
24 64892
1 965
467
109
99,892,9
94,7
21 912679
1 146
21 911105
1 132
8.6 Thefts and losses
Current payment – – – – – – – 2 1
Total 117 772 – 2 586 120 358 108 716 11 642 90,3 87 356 83 405

Annual fi nancial statements108
DEPARTMENT OF AGRICULTURE
VOTE 25
DETAIL PER PROGRAMME 8 – COMMUNICATION AND INFORMATION MANAGEMENTDETAIL PER PROGRAMME 8 – COMMUNICATION AND INFORMATION MANAGEMENT
for the year ended 31 March 2006for the year ended 31 March 2006
Economicclassifi cation
2005/06 2004/05
Adjustedappropri-
ation
Shiftingof funds
Virement Finalappropri-
ation
Actualexpendi-
ture
Variance Expendi-ture as
% of fi nal appro-
priation
Finalappro-
priation
Actualexpendi-
ture
R’000 R’000 R’000 R’000 R’000 R’000 % R’000 R’000
Current payment
Compensation of employeesGoods and servicesFinancial transactions inassets and liabilities
40 79549 527
–
(2 763)(253)
–
–1 579
–
38 03250 853
–
37 83943 488
–
1937 365
–
99,585,5
–
35 83226 687
2
35 62926 792
1
Transfers and subsidies
Provinces and municipalitiesDepartmental agencies and accountsForeign governments and international organisations Public corporations and private enterprisesHouseholds
115
7 720
18 241
–42
23
–
–
–85
–
1 000
–
7–
138
8 720
18 241
7127
124
8 720
15 074
6122
14
–
3 167
15
89,9
100,0
82,6
85,796,1
698
5 661
15 949
1161
109
5 660
12 998
1159
Payment for capital assets
Machinery and equipmentBiological or cultivated assetsSoftware and other intangible assets
1 300–
32
2 79112
105
––
–
4 09112
137
3 29211
40
7991
97
80,591,7
29,2
2 035175
155
1 813175
68
Total 117 772 – 2 586 120 358 108 716 11 642 90,3 87 356 83 405

DoA Annual report 2005/06 109
DEPARTMENT OF AGRICULTURE
VOTE 25
DETAIL PER PROGRAMME 9 – PROGRAMME PLANNING, MONITORING AND EVALUATIONDETAIL PER PROGRAMME 9 – PROGRAMME PLANNING, MONITORING AND EVALUATION
for the year ended 31 March 2006for the year ended 31 March 2006
Programme persubprogramme
2005/06 2004/05
Adjustedappropri-
ation
Shiftingof funds
Virement Final appropri-
ation
Actualexpendi-
ture
Variance Expendi-ture as %
of fi nal appro-
priation
Finalappro-
priation
Actualexpendi-
ture
R’000 R’000 R’000 R’000 R’000 R’000 % R’000 R’000
9.1 Project Planning
Current payment Transfers and subsidies Payment for capital
assets
4 0266
47
561 –
17
(7)–
–
4 5806
64
4 5784
63
22
1
100,066,7
98,4
3 5127
84
2 2203
56
9.2 Monitoring and Evaluation
Current payment Transfers and subsidies Payment for capital
assets
3 8424
40
(678)–
100
(157)–
–
3 0074
140
1 7573
85
1 2501
55
58,475,0
60,7
2 1973
11
12–
11
9.3 Thefts and losses
Current payment – – 6 6 5 1 83,3 5 4
Total 7 965 – (158) 7 807 6 495 1 312 83,2 5 819 2 306

Annual fi nancial statements110
DEPARTMENT OF AGRICULTURE
VOTE 25
DETAIL PER PROGRAMME 9 – PROGRAMME PLANNING, MONITORING AND EVALUATIONDETAIL PER PROGRAMME 9 – PROGRAMME PLANNING, MONITORING AND EVALUATION
for the year ended 31 March 2006for the year ended 31 March 2006
classifi cation
2005/06 2004/05
Adjustedappropri-
ation
Shiftingof funds
Virement Finalappropri-
ation
Actualexpendi-
ture
Variance Expendi-ture as %
of fi nal appro-
priation
Finalappro-
priation
Actualexpendi-
ture
R’000 R’000 R’000 R’000 R’000 R’000 % R’000 R’000
Current payment
Compensation of employees 3 826 (1 206) (158) 2 462 2 355 107 95,7 3 415 1 100
Goods and services 4 042 1 089 (6) 5 125 3 980 1 145 77,7 2 294 1 132
Financial transactions in assets and liabilities – – 6 6 5 1 83,3 5 4
Transfers and subsidies
Provinces and municipalities 10 – – 10 7 3 70,0 10 3
Payment for capital assets
Machinery and equipment 87 117 – 204 148 56 72,5 87 60
Software and other intangibleassets – – – – – – – 8 7
Total 7 965 – (158) 7 807 6 495 1 312 83,2 5 819 2 306

DoA Annual report 2005/06 111
1. Detail of transfers and subsidies as per the Appropriation Act (after virement):
Detail of these transactions can be viewed in Note 7 (Transfers and subsidies) of the Notes to the Annual Financial Statements and Annexure 1 (A–L) in the Annexures to the Annual Financial Statements.
2. Detail of specifi cally and exclusively appropriated amounts voted (after virement):
Detail of these transactions can be viewed in Note 1 (Annual appropriation) of the Notes to the Annual Financial Statements.
3. Detail on fi nancial transactions in assets and liabilities
Detail of these transactions per programme can be viewed in Note 6 (Financial transactions in assets and li-abilities) of the Notes to the Annual Financial Statements.
4. Explanations of material variances from amounts voted (after virement):
4.1 Per programme Finalappropri-
ation
Actualexpendi-
ture
Variance Varianceas a % of
fi nal appropri-
ationR’000 R’000 R’000 %
Administration 165 161 159 758 5 403 3,27Farmer Support and Development 714 783 696 728 18 055 2,52Agricultural Trade and Business Development 62 593 38 764 23 829 38,06Economic Research and Analysis 21 602 17 760 3 842 17,78Agricultural Production 416 655 414 250 2 405 0,57Sustainable Resources Management and Use 169 899 168 206 1 693 0,99National Regulatory Services 288 910 267 331 21 579 7,46Communication and Information Management 120 358 108 716 11 642 9,67Programme Planning, Monitoring and Evaluation 7 807 6 495 1 312 16,80
Administration
As a result of vacancies not fi lled, savings occurred under the items compensation of employees (R1,3 million)and goods and services (R3,1 million). A further saving occurred as a result of the delay in delivery of IT equip-ment (R686 000).
Farmer Support and Development
Vacancies not fi lled led to savings under the items compensation of employees (R856 000) and goods and serv-ices (R3,2 million) while not all the funds for Mafi sa (R6,8 million) and LRAD support (R5,4 million) were spent.
Agricultural Trade and Business Development
Vacancies not fi lled led to savings under the items compensation of employees (R1,7 million) and goods and services (R1,6 million). Funds appropriated for AgriBEE (R19,8 million) were not spent.
Economic Research and Analysis
Vacancies not fi lled led to savings under the items compensation of employees (R1,9 million) and goods and services (R1,1 million).
DEPARTMENT OF AGRICULTURE
VOTE 25
NOTES TO THE APPRORIATION STATEMENTNOTES TO THE APPRORIATION STATEMENT
for the year ended 31 March 2006for the year ended 31 March 2006

Annual fi nancial statements112
Agricultural Production
Vacancies not fi lled led to savings under the items compensation of employees (R1,2 million) and goods and services (R800 000).
Sustainable Resources Management and Use
Vacancies not fi lled led to savings under the items compensation of employees (R280 000) and goods and services (R1,2 million).
National Regulatory Services
Vacancies not fi lled led to savings under the item compensation of employees (R475 000). Claims in respect of the Classical Swine fever combating campaign (R20,0 million) have not been received timeously from the Provincial Department of Agriculture of the Eastern Cape.
Communication and Information Management
Funds earmarked for AgriBEE (R7,0 million) were not spent. Because of the exchange rate fl uctuations, mem-bership fees to international organisations were less than budgeted for (R3,0 million).
Programme Planning, Monitoring and Evaluation
Vacancies not fi lled led to savings under the items compensation of employees (R107 000) and goods and services (R1,1 million).
4.2 Per economic classifi cation R’000
Current expenditure
Compensation of employees 8 256Goods and services 58 747Financial transactions in assets and liabilities 11
Total 67 014
Transfers and subsidies
Provinces and municipalities 460Public corporations and private enterprises 96Foreign governments and international organisations 3 167Households 14 852
Total 18 575
Payments for capital assets
Buildings and other fi xed structures 97Machinery and equipment 3 882Biological assets 1Software and other intangible assets 191
Total 4 171
DEPARTMENT OF AGRICULTURE
VOTE 25
NOTES TO THE APPRORIATION STATEMENTNOTES TO THE APPRORIATION STATEMENT
for the year ended 31 March 2006for the year ended 31 March 2006

DoA Annual report 2005/06 113
DEPARTMENT OF AGRICULTURE
VOTE 25
STATEMENT OF FINANCIAL PERFORMANCESTATEMENT OF FINANCIAL PERFORMANCE
for the year ended 31 March 2006for the year ended 31 March 2006
Notes 2005/06 2004/05
R’000 R’000
REVENUE
Annual appropriation 1 1 967 768 1 449 391
Departmental revenue 2 76 136 100 620
Local and foreign aid assistance 3 5 590 5 170
TOTAL REVENUE 2 049 494 1 555 181
EXPENDITURE
Current expenditure
Compensation of employees 4 337 738 306 469
Goods and services 5 306 130 216 970
Financial transactions in assets and liabilities 6 719 937
Local and foreign aid assistance 3 5 590 5 170
Total current expenditure 650 177 529 546
Transfers and subsidies 7 1 134 306 761 906
Expenditure for capital assets
Buildings and other fi xed structures 8 60 331 74 859
Machinery and equipment 8 33 376 22 581
Biological or cultivated assets 8 11 175
Software and other intangible assets 8 5 397 2 944
Total expenditure for capital assets 99 115 100 559
TOTAL EXPENDITURE 1 883 598 1 392 011
SURPLUS 165 896 163 170
SURPLUS FOR THE YEAR 165 896 163 170
Reconciliation of net surplus for the year
Voted funds 14 89 760 62 550
Departmental revenue 15 76 136 100 620
SURPLUS FOR THE YEAR 165 896 163 170

Annual fi nancial statements114
DEPARTMENT OF AGRICULTURE
VOTE 25
STATEMENT OF FINANCIAL POSITIONSTATEMENT OF FINANCIAL POSITION
at 31 March 2006at 31 March 2006
Notes 2005/06 2004/05
R’000 R’000
ASSETS
Current assets 40 777 86 201
Unauthorised expenditure 9 663 663
Cash and cash equivalents 10 23 394 70 197
Prepayments and advances 11 4 722 1 192
Receivables 12 11 998 14 149
Noncurrent assets 18 889 19 783
Investments 13 18 889 19 783
TOTAL ASSETS 59 666 105 984
LIABILITIES
Current liabilities 31 919 73 814
Voted funds to be surrendered to the Revenue Fund 14 27 429 62 550
Departmental revenue to be surrendered to the Revenue Fund 15 2 473 8 990
Payables 16 2 017 2 274
Noncurrent liabilities
Payables 17 18 889 19 492
TOTAL LIABILITIES 50 808 93 306
NET ASSETS 8 858 12 678
Represented by:
Recoverable revenue 8 858 12 678
TOTAL 8 858 12 678

DoA Annual report 2005/06 115
DEPARTMENT OF AGRICULTURE
VOTE 25
STATEMENT OF CHANGES IN NET ASSETSSTATEMENT OF CHANGES IN NET ASSETS
for the year ended 31 March 2006for the year ended 31 March 2006
Notes 2005/06 2004/05
R’000 R’000
Recoverable revenue
Opening balance 12 678 9 013
Transfers (3 820) 3 665
Debts written off 6.2 (719) (937)
Debts recovered (36 125) (33 150)
Debts raised 33 024 37 752
Balance at 31 March 8 858 12 678

Annual fi nancial statements116
DEPARTMENT OF AGRICULTURE
VOTE 25
CASH FLOW STATEMENTCASH FLOW STATEMENT
for the year ended 31 March 2006for the year ended 31 March 2006
Notes 2005/06 2004/05
R’000 R’000
CASH FLOWS FROM OPERATING ACTIVITIES
Receipts 1 986 955 1 543 316
Annual appropriated funds received 1.1 1 905 437 1 449 391
Departmental revenue received 75 928 88 755
Local and foreign aid assistance received 3 5 590 5 170
Net (increase)/decrease in working capital (1 636) 1 066
Surrendered to Revenue Fund (145 203) (104 843)
Current payments (650 177) (529 546)
Transfers and subsidies paid (1 134 306) (761 906)
Net cash fl ow available from operating activities 18 55 633 148 087
CASH FLOWS FROM INVESTING ACTIVITIES
Payments for capital assets (99 115) (100 559)
Proceeds from sale of capital assets 2 208 11 865
Decrease in investments 894 1 061
Net cash fl ows from investing activities (98 013) (87 633)
CASH FLOWS FROM FINANCING ACTIVITIES
Increase/(decrease) in net assets (3 820) 3 665
Decrease in non-current payables (603) (1 221)
Net cash fl ows from fi nancing activities (4 423) 2 444
Net increase/(decrease) in cash and cash equivalents (46 803) 62 898
Cash and cash equivalents at the beginning of the period 70 197 7 299
Cash and cash equivalents at end of period 19 23 394 70 197

DoA Annual report 2005/06 117
DEPARTMENT OF AGRICULTURE
VOTE 25
NOTES TO THE ANNUAL FINANCIAL STATEMENTSNOTES TO THE ANNUAL FINANCIAL STATEMENTS
for the year ended 31 March 2006for the year ended 31 March 2006
1. Annual appropriation
1.1 Included are funds appropriated in terms of the Appropriation Act for National Departments (Voted funds)
Finalappropria-
tion
Actualfunds
received
Funds notrequested/
not received
Appropria-tion
received2004/05
R’000 R’000 R’000 R’000
Administration 165 161 160 000 5 161 176 690
Farmer Support and Development 714 783 699 000 15 783 336 898
Agricultural Trade and BusinessDevelopment 62 593 40 000 22 593 35 805
Economic Research and Analysis 21 602 20 000 1 602 21 755
Agricultural Production 416 655 415 000 1 655 369 550
Sustainable Resources Manage-ment and Use 169 899 169 000 899 159 344
National Regulatory Services 288 910 285 000 3 910 256 174
Communication and InformationManagement 120 358 110 437 9 921 87 356
Programme Planning, Monitoring and Evaluation 7 807 7 000 807 5 819
Total 1 967 768 1 905 437 62 331 1 449 391
A request was submitted to the National Treasury to roll an amount of R89,177 million over to 2006/07 toprovide for expenditure relating to the Classical Swine fever outbreak which could not be paid before theend of the fi nancial year.
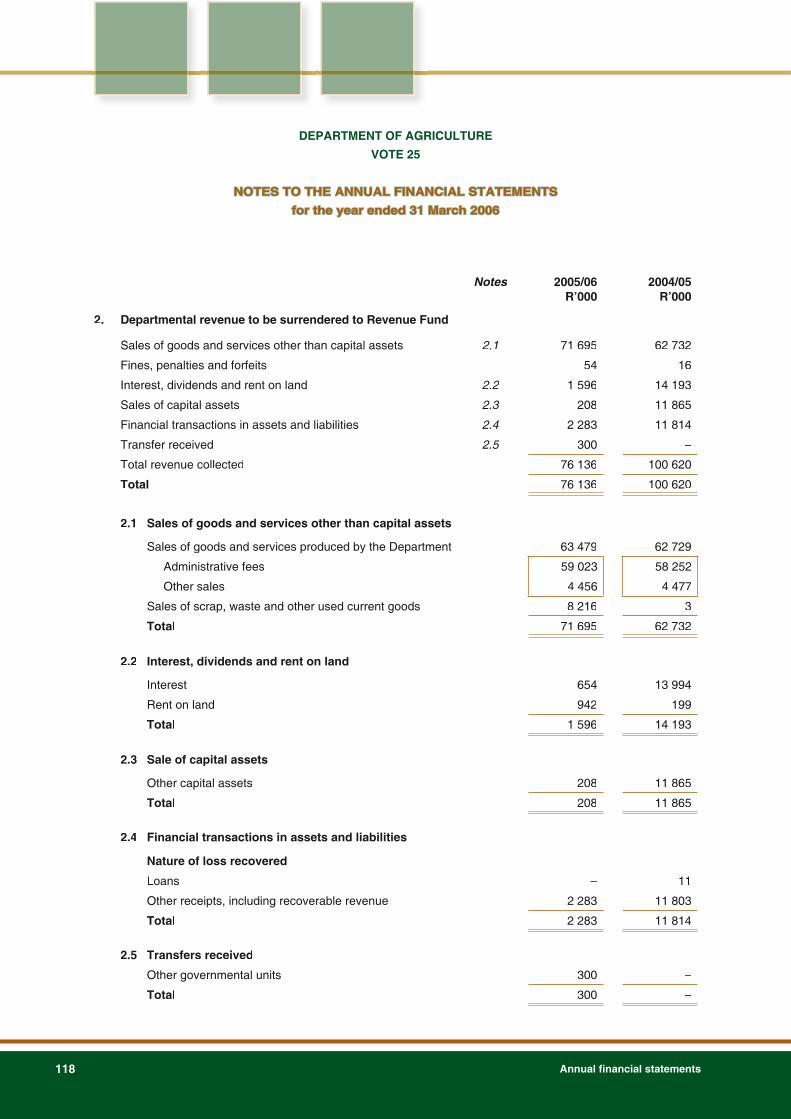
Annual fi nancial statements118
DEPARTMENT OF AGRICULTURE
VOTE 25
NOTES TO THE ANNUAL FINANCIAL STATEMENTSNOTES TO THE ANNUAL FINANCIAL STATEMENTS
for the year ended 31 March 2006for the year ended 31 March 2006
Notes 2005/06R’000
2004/05R’000
2. Departmental revenue to be surrendered to Revenue Fund
Sales of goods and services other than capital assets 2.1 71 695 62 732
Fines, penalties and forfeits 54 16
Interest, dividends and rent on land 2.2 1 596 14 193
Sales of capital assets 2.3 208 11 865
Financial transactions in assets and liabilities 2.4 2 283 11 814
Transfer received 2.5 300 –
Total revenue collected 76 136 100 620
Total 76 136 100 620
2.1 Sales of goods and services other than capital assets
Sales of goods and services produced by the Department 63 479 62 729
Administrative fees 59 023 58 252
Other sales 4 456 4 477
Sales of scrap, waste and other used current goods 8 216 3
Total 71 695 62 732
2.2 Interest, dividends and rent on land
Interest 654 13 994
Rent on land 942 199
Total 1 596 14 193
2.3 Sale of capital assets
Other capital assets 208 11 865
Total 208 11 865
2.4 Financial transactions in assets and liabilities
Nature of loss recovered
Loans – 11
Other receipts, including recoverable revenue 2 283 11 803
Total 2 283 11 814
2.5 Transfers received
Other governmental units 300 –
Total 300 –

DoA Annual report 2005/06 119
DEPARTMENT OF AGRICULTURE
VOTE 25
NOTES TO THE ANNUAL FINANCIAL STATEMENTSNOTES TO THE ANNUAL FINANCIAL STATEMENTS
for the year ended 31 March 2006for the year ended 31 March 2006
Notes 2005/06R’000
2004/05R’000
3. Local and foreign aid assistance
Assistance received in cash: Other
Foreign
Opening balance – –
Revenue 5 590 5 170
Expenditure 5 590 5 170
Current 5 590 5 170
Closing balance – –
4. Compensation of employees
4.1 Salaries and wages
Basic salary 211 770 186 807
Performance awards 9 946 7 088
Service based 1 018 446
Compensative/circumstantial 33 251 37 961
Periodic payments 5 811 5 197
Other nonpensionable allowances 34 617 27 865
Total 296 413 265 364
4.2 Social contributions
4.2.1 Employer contributions
Pension 27 271 27 845
Medical 13 981 13 193
Bargaining council 67 64
Insurance 6 3
Total 41 325 41 105
Total compensation of employees 337 738 306 469
Average number of employees 2 528 2 661

Annual fi nancial statements120
DEPARTMENT OF AGRICULTURE
VOTE 25
NOTES TO THE ANNUAL FINANCIAL STATEMENTSNOTES TO THE ANNUAL FINANCIAL STATEMENTS
for the year ended 31 March 2006for the year ended 31 March 2006
Notes 2005/06R’000
2004/05R’000
5. Goods and services
Advertising 6 504 4 908
Attendance fees (including registration fees) 8 747 3 776
Bank charges and card fees 372 581
Bursaries (employees) 1 732 1 523
Communication 15 846 11 341
Computer services 19 695 13 145
Consultants, contractors and special services 113 243 37 176
Courier and delivery services 565 517
Tracing agents and debt collections 5 –
Drivers’ licences and permits 29 63
Entertainment 394 421
External audit fees 5.1 3 591 1 923
Equipment less than R5 000 7 641 8 332
Freight service 85 206
Inventories 5.2 29 408 43 473
Legal fees 1 150 651
Maintenance, repairs and running costs 10 787 13 058
Medical services 70 55
Operating leases 4 500 3 363
Personnel agency fees 4 78
Photographic services 1 1
Plants, fl owers and other decorations 64 14
Printing and publications 525 522
Professional bodies and membership fees 33 32
Resettlement cost 959 841
Roadworthy tests 1 3
School and boarding fees 478 367
Subscriptions 222 176
Storage of furniture 200 93
Taking over of contractual obligations 616 302
Owned leasehold property expenditure 634 348
Translations and transcriptions 27 12
Travel and subsistence 5.3 62 905 64 100
Venues and facilities 9 680 5 521
Protective, special clothing and uniforms 77 47
Training and staff development 5 340 –
Town and regional planning – 1
Total 306 130 216 970

DoA Annual report 2005/06 121
DEPARTMENT OF AGRICULTURE
VOTE 25
NOTES TO THE ANNUAL FINANCIAL STATEMENTSNOTES TO THE ANNUAL FINANCIAL STATEMENTS
for the year ended 31 March 2006for the year ended 31 March 2006
Notes 2005/06R’000
2004/05R’000
5.1 External audit fees
Regulatory audits 3 466 1 923
Other audits 125 –
Total external audit fees 3 591 1 923
5.2 Inventory
Domestic consumables 4 444 3 424
Agricultural consumables 3 595 5 963
Learning and teaching support material 8 77
Food and food supplies 892 1 963
Fuel, oil and gas 6 381 8 791
Laboratory consumables 2 173 2 651
Other consumables 583 670
Parts and other maintenance material 1 867 8 420
Stationery and printing 9 409 11 496
Veterinary supplies 42 8
Medical supplies 14 10
Total inventory 29 408 43 473
5.3 Travel and subsistence
Local 48 172 54 817
Foreign 14 733 9 283
Total travel and subsistence 62 905 64 100
6. Financial transactions in assets and liabilities
Debts written off 6.1 719 937
Total 719 937
6.1 Debts written off
Nature of debts written offUneconomical 214 52
Claims settled or waived to the advantage of the state 505 885
Total 719 937
6.2 Recoverable revenue debts written off
Uneconomical (214) (52)
Claims settled or waived to the advantage of the state (505) (885)
Total (719) (937)

Annual fi nancial statements122
DEPARTMENT OF AGRICULTURE
VOTE 25
NOTES TO THE ANNUAL FINANCIAL STATEMENTSNOTES TO THE ANNUAL FINANCIAL STATEMENTS
for the year ended 31 March 2006for the year ended 31 March 2006
Notes 2005/06R’000
2004/05R’000
7. Transfers and subsidies
Provinces and municipalities Annex 1C, 1F 411 332 345 019Departmental agencies and accounts Annex 1G 385 711 358 905Foreign governments and international organisations Annex 1J 155 074 12 998Public corporations and private enterprises Annex 1I 146 785 2 428Nonprofi t institutions Annex 1K 779 2 626Households Annex 1L 34 625 39 930
Total 1 134 306 761 906
8. Expenditure for capital assets
Buildings and other fi xed structures Annex 4 60 331 74 859Machinery and equipment Annex 4 33 376 22 581Biological or cultivated assets Annex 4 11 175Software and other intangible assets Annex 5 5 397 2 944
Total 99 115 100 559
The following amount for compensation of employees hasbeen included in expenditure for capital assets: 19 394 17 462
9. Unauthorised expenditure
9.1 Reconciliation of unauthorised expenditure
Opening balance 663 663
Unauthorised expenditure awaiting authorisation 663 663
9.2 Analysis of unauthorised expenditure
Incident Disciplinary steps taken/criminalproceedings
A course for theintroduction ofEnglish(1998/1999)
Procurement prescripts were not followed. The responsible offi cial was verbally reprimanded due to the fact that there was no loss tothe state 136 136
Organising of workshops inprovinces to plan a national irrigation policy (1999/2000)
Extension of the number of work-shops from 27 to 65 by provinceswithout consulting the Department. Expenditure was claimed from the Department by the provinces. No disciplinary steps were taken asno offi cial in the Department could be held responsible 527 527
Total 663 663

DoA Annual report 2005/06 123
DEPARTMENT OF AGRICULTURE
VOTE 25
NOTES TO THE ANNUAL FINANCIAL STATEMENTSNOTES TO THE ANNUAL FINANCIAL STATEMENTS
for the year ended 31 March 2006for the year ended 31 March 2006
Notes 2005/06R’000
2004/05R’000
10. Cash and cash equivalents
Consolidated Paymaster-General Account 22 974 69 682
Cash receipts 230 331
Cash on hand 159 182
Cash with commercial banks 31 2
23 394 70 197
11. Prepayments and advances
Travel and subsistence 1 406 1 192
Advances paid to other entities 3 316 –
Total 4 722 1 192
12. Receivables
Notes Lessthan one
year
One to threeyears
Older thanthreeyears
Total Total
Staff debtors 12.1 100 – – 100 29
Other debtors 12.2 4 363 3 051 1 872 9 286 13 072
Claims recoverable Annex 6 2 414 – 198 2 612 1 048
Total 6 877 3 051 2 070 11 998 14 149
12.1 Staff debt
Sal: Deduction disallowance account 40 7
Sal: Tax debt 17 22
Sal: Reversal control 38 –
Sal: Pension fund 5 –
Total 100 29
12.2 Other debtors
Debt account 894 1 614
Inspection fees: Capital account 6 856 8 919
Inspection fees: Interest account 1 337 1 470
Inspection fees: Interest account (suspense) – 1 024
Claims recoverable public entities 4 2
Disallowance dishonoured cheques 121 33
Disallowance miscellaneous 74 10
Total 9 286 13 072
Included in the amount of R6,856 million was an amount of R2 148 262,00in respect of outstanding debt for longer than 120 days as at 31 March2006. After year end an amount of R875 592,00 was paid.

Annual fi nancial statements124
DEPARTMENT OF AGRICULTURE
VOTE 25
NOTES TO THE ANNUAL FINANCIAL STATEMENTSNOTES TO THE ANNUAL FINANCIAL STATEMENTS
for the year ended 31 March 2006for the year ended 31 March 2006
Notes 2005/06R’000
2004/05R’000
13. Investments
Noncurrent
Shares and other equity
Ncera Farms (Pty) Ltd 1 1
Onderstepoort Biological Products (Pty) Ltd 1 1
JS Pistorius Trust Fund 66 62
Greenberg Trust Fund 30 28
SAAU Fund 119 112
Abattoir Industry Fund 18 672 19 288
Drilling deposits – 291
Total 18 889 19 783
Analysis of noncurrent investments
Opening balance 19 783 20 844
Additions in cash 13 174
Disposals for cash (907) (1 235)
Closing balance 18 889 19 783
14. Voted funds to be surrendered to the Revenue Fund
Opening balance 62 550 9 491
Transfer from Statement of Financial Performance 89 760 62 550
Voted funds not requested/not received 14.1 (62 331) –
Paid during the year (62 550) (9 491)
Closing balance 27 429 62 550
14.1 Voted funds not requested/not received
Funds to be rolled over 89 220 10 359
Funds not to be requested 62 331 –
151 551 10 359
15. Departmental revenue to be surrendered to the Revenue Fund
Opening balance 8 990 3 722
Transfer from Statement of Financial Performance 76 136 100 620
Paid during the year (82 653) (95 352)
Closing balance 2 473 8 990

DoA Annual report 2005/06 125
DEPARTMENT OF AGRICULTURE
VOTE 25
NOTES TO THE ANNUAL FINANCIAL STATEMENTSNOTES TO THE ANNUAL FINANCIAL STATEMENTS
for the year ended 31 March 2006for the year ended 31 March 2006
Payables – current
Description Notes 30 days 30+ days 2005/06Total
R’000
2004/05Total
R’000
Advances received 16.1 – 1 063 1 063 678
Clearing accounts 16.2 246 708 954 1 596
Total 246 1 771 2 017 2 274
16.1 Advances received
Plant breeders’ rights 17 97
Drilling deposits 13 307
Citrus Growers’ Association 1 033 274
Total 1 063 678
16.2 Clearing accounts
Pension recoverable – 31
Salary: ACB recalls 5 49
Salary: Pension fund – 2
Salary: Income tax 949 1 511
Salary: Garnishee order – 1
Regional services council – 1
Telephone control – 1
Total 954 1 596
17. Payables – non-current
Notes One to two
years
R’000
Two to threeyears
R’000
More thanthreeyears
R’000
Total
R’000
Total
R’000
Other payables 17.1 – – 18 889 18 889 19 492
Total – – 18 889 18 889 19 492
17.1 Other payables
Ncera Farms (Pty) Ltd 1 1
Onderstepoort Biological Products (Pty) Ltd 1 1
JS Pistorius Trust Fund 66 62
Greenberg Trust Fund 30 28
Abattoir Industry Fund 18 672 19 288
SAAU levies 119 112
Total 18 889 19 492

Annual fi nancial statements126
DEPARTMENT OF AGRICULTURE
VOTE 25
NOTES TO THE ANNUAL FINANCIAL STATEMENTSNOTES TO THE ANNUAL FINANCIAL STATEMENTS
for the year ended 31 March 2006for the year ended 31 March 2006
Notes 2005/06R’000
2004/05R’000
18. Net cash fl ow available from operating activities
Net surplus/(defi cit) as per Statement of FinancialPerformance
165 896 163 170
(Increase)/decrease in receivables – current 2 151 (648)
(Increase)/decrease in prepayments and advances (3 530) 126
Increase/(decrease) in payables – current (257) 1 588
Proceeds from sale of capital assets (208) (11 865)
Surrenders to Revenue Fund (145 203) (104 843)
Expenditure on capital assets 99 115 100 559
Voted funds not requested/not received (62 331) –
Net cash fl ow generated by operating activities 55 633 148 087
19. Reconciliation of cash and cash equivalents for cash fl ow purposes
Consolidated Paymaster-General Account 22 974 69 682
Cash receipts 230 331
Cash on hand 159 182
Cash with commercial banks 31 2
Total 23 394 70 197

DoA Annual report 2005/06 127
DEPARTMENT OF AGRICULTURE
VOTE 25
DISCLOSURE NOTES TO THE ANNUAL FINANCIAL STATEMENTSDISCLOSURE NOTES TO THE ANNUAL FINANCIAL STATEMENTS
for the year ended 31 March 2006for the year ended 31 March 2006
These amounts are not recognised in the Annual Financial Statements and are disclosed to enhance the usefulnessof the Annual Financial Statements.
Notes 2005/06R’000
2004/05R’000
20. Contingent liabilities Nature
Liable toHousing loan guarantees Employees Annex 3A 2 440 2 924Other guarantees Annex 3A 94 791 99 925Claims against the Department Annex 3B – –Other departments (interdepartmental unconfi rmed balances) Annex 7 23 002 9 956Other Annex 3B 31 39
Total 120 264 112 844
21. Commitments
Current expenditureApproved and contracted 36 742 51 108Subtotal 36 742 51 108
Capital expenditureApproved and contracted 5 271 6 620Subtotal 5 271 6 620
Total commitments 42 013 57 728
22. Accruals
By economic classifi cation 30 daysR’000
30+ daysR’000
TotalR’000
TotalR’000
Goods and services 121 255 376 9 834Machinery and equipment 94 21 115 40
Total 215 276 491 9 874
Listed by programme levelAdministration 151 13Farmer Support and Development – 32Agricultural Trade and Business Development 15 –Economic Research and Analysis 40 196Agricultural Production 95 311Sustainable Resources Management and Use 31 28National Regulatory Services 97 9 235Communication and Information Management 32 55Programme Planning, Monitoring and Evaluation 30 4
Total 491 9 874
Confi rmed balances with other Departments Annex 7 380 5 905
Total 380 5 905

Annual fi nancial statements128
Notes 2005/06R’000
2004/05R’000
23. Employee benefi ts
Leave entitlement 37 841 38 043
Thirteenth cheque 9 764 9 175
Performance awards 8 326 5 480
Total 55 931 52 698
DEPARTMENT OF AGRICULTURE
VOTE 25
DISCLOSURE NOTES TO THE ANNUAL FINANCIAL STATEMENTSDISCLOSURE NOTES TO THE ANNUAL FINANCIAL STATEMENTS
for the year ended 31 March 2006for the year ended 31 March 2006
24. Lease commitments
24.1 Operating leases
Land
R’000
Buildingsand other
fi xed structures
R’000
Machineryand
equipment
R’000
2005/06Total
R’000
2004/05Total
R’000
Not later than one year – – 1 684 1 684 1 339
Later than 1 year and notlater than 5 years – – 1 030 1 030 1 299
Total present value oflease liabilities – – 2 714 2 714 2 638
2005/06R’000
2004/05R’000
25. Irregular expenditure
25.1 Reconciliation of irregular expenditure
Opening balance 3 903 3 903
Irregular expenditure — current year 2 714 –
Irregular expenditure awaiting condonement 6 617 3 903
AnalysisCurrent 2 714 –
Prior years 3 903 3 903
Total 6 617 3 903
The current expenditure is in respect of the lease of photo copiers in terms of the state contract entered into by the National Treasury

DoA Annual report 2005/06 129
DEPARTMENT OF AGRICULTURE
VOTE 25
DISCLOSURE NOTES TO THE ANNUAL FINANCIAL STATEMENTSDISCLOSURE NOTES TO THE ANNUAL FINANCIAL STATEMENTS
for the year ended 31 March 2006for the year ended 31 March 2006
26. Key management personnel
No. of individuals 2005/06Total
2004/05Total
Political office bearers 1 1 010 963
Offi cials
Levels 15 and 16 5 3 667 4 065
Level 14 4 2 325 2 722
Family members of key management personnel – –
Total 7 002 7 750
27. Provisions
2005/06R’000
2004/05R’000
Potential irrecoverable debts
Other debtors 2 768 521
Claims recoverable 198 –
Total 2 966 521

Annual fi nancial statements130
Nam
e o
f p
rovi
nce
/gra
nt
Gra
nt
allo
cati
on
Tra
nsf
ers
Sp
ent
2004
/05
Div
isio
n o
f R
even
ue
Act
Ro
ll o
vers
Ad
just
-m
ents
To
tal
avai
lab
leA
ctu
altr
ansf
er%
of
avai
l-ab
le f
un
ds
tran
sfer
red
Am
ou
nt
rece
ived
by
Dep
artm
ent
Am
ou
nt
spen
tb
yD
epar
tmen
t
% o
f av
ail-
able
fu
nd
s sp
ent
by
Dep
artm
ent
Div
isio
n o
fR
even
ue
Act
R’0
00R
’000
R’0
00R
'000
R’0
00%
R’0
00R
’000
%R
’000
Infr
astr
uct
ure
dev
elo
pm
ent
and
po
vert
y re
lief
(Lan
dC
are)
Eas
tern
Cap
e P
rovi
nce
Fre
e S
tate
Pro
vinc
e G
aute
ng P
rovi
nce
Kw
aZul
u-N
atal
Pro
vinc
eLi
mpo
po P
rovi
nce
Mpu
mal
anga
Pro
vinc
eN
orth
ern
Cap
e P
rovi
nce
Nor
th W
est P
rovi
nce
Wes
tern
Cap
e P
rovi
nce
800
02
000
2 00
08
000
500
05
500
200
05
000
2 50
0
– – – – – – – – –
– – – – – – – – –
800
02
000
2 00
08
000
500
05
500
200
05
000
2 50
0
800
02
000
2 00
08
000
500
05
500
200
05
000
2 50
0
100,
010
0,0
100,
010
0,0
100,
010
0,0
100,
010
0,0
100,
0
– – – – – – – – –
800
02
000
2 00
08
000
500
05
500
200
05
000
2 50
0
100,
010
0,0
100,
010
0,0
100,
010
0,0
100,
010
0,0
100,
0
8 76
63
370
1 78
57
240
204
47
744
268
56
370
3 79
6
Su
bto
tal
4000
0–
–40
000
4000
010
0,0
–40
000
100,
043
800
Co
mp
reh
ensi
ve A
gri
cult
ura
lS
up
po
rt P
rog
ram
me
Eas
tern
Cap
e P
rovi
nce
Fre
eS
tate
Pro
vinc
eG
aute
ng P
rovi
nce
Kw
aZul
u-N
atal
Pro
vinc
eLi
mpo
po P
rovi
nce
Mpu
mal
anga
Pro
vinc
e
4755
221
088
5 72
746
270
41 7
8 623
629
– – – – – –
– – – – – –
4755
221
08 8
5 72
746
27 0
41 7
8623
629
4755
221
088
5 72
746
270
41 7
8623
629
100,
010
0,0
100,
010
0,0
100,
010
0,0
– – – – – –
4755
221
088
5 72
746
270
41 7
8623
629
100,
010
0 ,0
100,
010
0,0
100 ,
010
0,0
3804
316
870
458
237
016
33 4
2818
903
DE
PA
RT
ME
NT
OF
AG
RIC
UL
TU
RE
VO
TE
25
AN
NE
XU
RE
ST
OT
HE
AN
NU
AL
FIN
AN
CIA
LS
TA
TE
ME
NT
SA
NN
EX
UR
ES
TO
TH
E A
NN
UA
L F
INA
NC
IAL
ST
AT
EM
EN
TS
for
the
ye
ar
en
de
d3
1M
arc
h2
00
6fo
r th
e y
ea
r e
nd
ed
31
Ma
rch
20
06
AN
NE
XU
RE
1C
ST
AT
EM
EN
T O
F C
ON
DIT
ION
AL
GR
AN
T P
AID
TO
PR
OV
INC
ES

DoA Annual report 2005/06 131
Nam
e o
f p
rovi
nce
/gra
nt
Gra
nt
allo
cati
on
Tra
nsf
ers
Sp
ent
2004
/05
Div
isio
n o
fR
even
ue
Ac t
Ro
ll o
vers
Ad
just
-m
ents
To
tal
avai
lab
leA
ctu
altr
ansf
er%
of
avai
l-ab
lefu
nd
str
ans f
erre
d
Am
ou
nt
rece
ived
by
Dep
artm
ent
Am
ou
nt
spen
t b
yD
epar
tmen
t
% o
f av
ail-
able
fun
ds
spen
t b
yD
epar
tmen
t
Div
isio
n o
fR
even
ue
Act
R’0
00R
’000
R’0
00R
'000
R’0
00%
R’0
00R
’000
%R
’000
Co
mp
reh
ensi
ve A
gri
cult
ura
lS
up
po
rt P
rog
ram
me
(cont.
)
Nor
ther
n C
ape
Pro
vinc
eN
orth
Wes
t Pro
vinc
eW
este
rn C
ape
Pro
vinc
e
13 1
4833
594
17 2
0 6
– – –
– – –
13 1
4833
594
17 2
06
13 1
4833
594
17 2
06
100,
010
0,0
100,
0
– – –
13 1
4833
594
17 2
06
100,
010
0,0
100,
0
10 5
1826
875
13 7
65
Su
bto
tal
250
000
––
250
000
250
000
100,
0–
250
000
100,
020
0 00
0
Dis
aste
r m
anag
emen
t(d
rou
gh
t re
lief)
Eas
tern
Cap
e P
rovi
nce
Fre
eS
tate
Pro
vinc
eG
aute
ng P
rovi
nce
Kw
aZul
u-N
atal
Pro
vinc
eLi
mpo
po P
rovi
nce
Mpu
mal
anga
Pro
vinc
eN
orth
ern
Ca p
e P
rovi
nce
Nor
th W
est P
rovi
nce
Wes
tern
Cap
e P
rovi
nce
– – – – – – – – –
– – – – – – – – –
1000
016
000 –
5 00
020
000
1500
020
000
1600
018
000
1000
016
000 –
5 00
020
000
1500
020
000
1600
018
000
1000
016
000 –
5 00
020
000
1500
020
000
1600
018
000
100,
010
0,0 –
100,
010
0,0
100,
010
0,0
100,
010
0,0
– – – – – – – – –
1000
016
000 –
5 00
020
000
1500
020
000
1600
018
000
100,
010
0,0 –
100,
010
0,0
100,
010
0,0
100,
010
0,0
800
017
000
18 0
002
000
200
026
000
1800
09
000 –
Su
bto
tal
––
120
000
120
000
120
000
100,
0–
120
000
100,
010
0,00
0
To
tal
290
000
–12
000
041
000
041
000
010
0,0
–41
000
010
0,0
343
800
DE
PA
RT
ME
NT
OF
AG
RIC
UL
TU
RE
VO
TE
25
AN
NE
XU
RE
ST
OT
HE
AN
NU
AL
FIN
AN
CIA
LS
TA
TE
ME
NT
SA
NN
EX
UR
ES
TO
TH
E A
NN
UA
L F
INA
NC
IAL
ST
AT
EM
EN
TS
for
the
ye
ar
en
de
d3
1M
arc
h2
00
6fo
r th
e y
ea
r e
nd
ed
31
Ma
rch
20
06
AN
NE
XU
RE
1C
(cont.
)
ST
AT
EM
EN
T O
F C
ON
DIT
ION
AL
GR
AN
T P
AID
TO
PR
OV
INC
ES

Annual fi nancial statements132
DE
PA
RT
ME
NT
OF
AG
RIC
UL
TU
RE
VO
TE
25
AN
NE
XU
RE
ST
OT
HE
AN
NU
AL
FIN
AN
CIA
LS
TA
TE
ME
NT
SA
NN
EX
UR
ES
TO
TH
E A
NN
UA
L F
INA
NC
IAL
ST
AT
EM
EN
TS
for
the
ye
ar
en
de
d3
1M
arc
h2
00
6fo
r th
e y
ea
r e
nd
ed
31
Ma
rch
20
06
AN
NE
XU
RE
1F
ST
AT
EM
EN
T O
F U
NC
ON
DIT
ION
AL
GR
AN
TS
AN
D T
RA
NS
FE
RS
TO
MU
NIC
IPA
LIT
IES
Nam
e o
f m
un
icip
alit
y
Gra
nt
allo
cati
on
Tra
nsf
ers
Sp
ent
2004
/05
Am
ou
nt
Ro
ll o
vers
Ad
just
-m
ents
To
tal
avai
lab
leA
ctu
altr
ansf
er%
of
avai
l-ab
le f
un
ds
tran
sfer
red
Am
ou
nt
rece
ived
by
mu
nic
ipal
ity
Am
ou
nt
spen
tb
ym
un
icip
alit
y
% o
f av
ail-
able
fu
nd
s sp
ent
by
mu
nic
ipal
ity
To
tal
avai
lab
le
R’0
00R
’000
R’0
00R
'000
R’0
00 %
R’0
00R
’000
%R
’000
Reg
iona
l Ser
vice
s C
ounc
il le
vies
Veh
icle
lice
nces
, mun
icip
aliti
esV
ehic
le li
cenc
es, p
rovi
ncia
l Dep
artm
ent
1 15
436
0 70
– – –
(30)
238 –
112
459
8 70
992
298 42
88,3
49,8
60,0
992
298 42
– – –
– – –
– – –
To
tal
1 58
4–
208
1 79
21
332
74,3
1 33
2–
––

DoA Annual report 2005/06 133
DE
PA
RT
ME
NT
OF
AG
RIC
UL
TU
RE
VO
TE
25
AN
NE
XU
RE
ST
OT
HE
AN
NU
AL
FIN
AN
CIA
LS
TA
TE
ME
NT
SA
NN
EX
UR
ES
TO
TH
E A
NN
UA
L F
INA
NC
IAL
ST
AT
EM
EN
TS
for
the
ye
ar
en
de
d3
1M
arc
h2
00
6fo
r th
e y
ea
r e
nd
ed
31
Ma
rch
20
06
AN
NE
XU
RE
1G
ST
AT
EM
EN
T O
F T
RA
NS
FE
RS
TO
DE
PA
RT
ME
NT
AL
AG
EN
CIE
S A
ND
AC
CO
UN
TS Tra
nsf
er a
lloca
tio
nT
ran
sfer
2004
/05
Ad
just
edA
pp
rop
riat
ion
Act
Ro
ll o
vers
Ad
just
men
tsT
ota
lav
aila
ble
Act
ual
tran
sfer
% o
fav
aila
ble
fu
nd
str
ansf
erre
d
Ap
pro
pri
atio
nA
ct
R'0
00R
'000
R'0
00R
'000
R'0
00%
R'0
00
Nat
iona
l Agr
icul
tura
l Mar
ketin
g C
ounc
ilA
gric
ultu
ral R
esea
rch
Cou
ncil
Wat
er R
esea
rch
Com
mis
sion
Nat
iona
l Stu
dent
s’ F
inan
cial
Aid
Sch
eme
Pub
lic S
ervi
ce E
duca
tion
and
Tra
inin
g A
utho
rity
13 9
6136
0 90
22
128
730
042
0
– – – – –
– – –1
000 –
13 9
6136
0 90
22
128
830
042
0
13 9
6136
0 90
22
128
830
042
0
100,
010
0,0
100,
010
0,0
100,
0
1060
134
214
450
05
300
361
To
tal
384
711
–1
000
385
711
385
711
100,
035
8 90
6

Annual fi nancial statements134
DE
PA
RT
ME
NT
OF
AG
RIC
UL
TU
RE
VO
TE
25
AN
NE
XU
RE
ST
OT
HE
AN
NU
AL
FIN
AN
CIA
LS
TA
TE
ME
NT
SA
NN
EX
UR
ES
TO
TH
E A
NN
UA
L F
INA
NC
IAL
ST
AT
EM
EN
TS
for
the
ye
ar
en
de
d3
1M
arc
h2
00
6fo
r th
e y
ea
r e
nd
ed
31
Ma
rch
20
06
AN
NE
XU
RE
1I
ST
AT
EM
EN
T O
F T
RA
NS
FE
RS
/SU
BS
IDIE
S T
O P
UB
LIC
CO
RP
OR
AT
ION
S A
ND
PR
IVA
TE
EN
TE
RP
RIS
ES
Nam
e o
f p
ub
lic c
orp
ora
tio
n/
pri
vate
en
terp
rise
Tra
nsf
er a
lloca
tio
nE
xpen
dit
ure
2004
/05
Ad
just
edA
pp
rop
riat
ion
Act
Ro
ll o
vers
Ad
just
men
tsT
ota
lav
aila
bl e
Act
ual
tran
sfer
% o
fav
aila
ble
fun
ds
tran
sfer
red
Cap
ital
Cu
rren
tA
pp
rop
riat
ion
Act
R'0
00R
'000
R'0
00R
'000
R'0
00%
R'0
00R
'000
R'0
00
Pu
blic
co
rpo
rati
on
s
Esk
om38
––
38–
0,0
––
44
Kal
ahar
i Eas
t Wat
er B
oard
––
––
––
––
19
Nce
ra F
arm
s (P
ty)
Ltd
237
7–
–2
377
237
299
,8–
–2
240
Red
Mea
t Ind
ustr
y F
orum
––
11
–0,
0–
––
Land
and
Agr
icul
tura
l Ban
k of
SA
144
000
––
144
000
144
000
100,
0–
––
Su
bto
tal
146
415
–1
146
416
146
372
––
–2
303
Pri
vate
en
terp
rise
s
Cla
ims
agai
nst t
he S
tate
––
420
420
413
98,3
––
78
Non
-life
insu
ranc
e pr
emiu
ms
45–
–45
–0,
0–
–47
0
Su
bto
tal
45–
420
465
413
––
–54
8
To
tal
146
460
–42
114
6 88
114
6 78
5–
––
2 85
1

DoA Annual report 2005/06 135
DE
PA
RT
ME
NT
OF
AG
RIC
UL
TU
RE
VO
TE
25
AN
NE
XU
RE
ST
OT
HE
AN
NU
AL
FIN
AN
CIA
LS
TA
TE
ME
NT
SA
NN
EX
UR
ES
TO
TH
E A
NN
UA
L F
INA
NC
IAL
ST
AT
EM
EN
TS
for
the
ye
ar
en
de
d3
1M
arc
h2
00
6fo
r th
e y
ea
r e
nd
ed
31
Ma
rch
20
06
AN
NE
XU
RE
1J
ST
AT
EM
EN
T O
F T
RA
NS
FE
RS
TO
FO
RE
IGN
GO
VE
RN
ME
NT
AN
D IN
TE
RN
AT
ION
AL
OR
GA
NIS
AT
ION
S
Tra
nsf
er a
lloca
tio
nE
xpen
dit
ure
2004
/05
Ad
just
edA
pp
rop
riat
ion
Act
Ro
ll o
vers
Ad
just
men
tsT
ota
lav
aila
ble
Act
ual
tran
sfer
% o
f av
aila
ble
fu
nd
str
ansf
erre
d
Ap
pro
pri
atio
nA
ct
R'0
00R
'000
R'0
00R
'000
R'0
00 %
R'0
00
Tra
nsf
ers
Inte
rnat
iona
l Dai
ry F
eder
atio
nO
ffi ce
Inte
rnat
iona
l des
Epi
zoot
ies
Inte
rnat
iona
l See
d T
estin
g A
ssoc
iatio
nO
rgan
isat
ion
for
Eco
nom
ic C
o-op
erat
ion
and
Dev
elop
men
tIn
tern
atio
nal U
nion
for
the
Pro
tect
ion
of N
ew V
arie
ties
of P
lant
sIn
tern
atio
nal G
rain
s C
ounc
ilO
ffi ce
Inte
rnat
iona
l de
la V
igne
et d
u V
inP
lant
Gen
etic
Res
ourc
es C
entr
eF
ood
and
Agr
icul
tura
l Org
anis
atio
n of
the
Uni
ted
Nat
ions
Inte
rnat
iona
l Com
mis
sion
of A
gric
ultu
ral E
ngin
eerin
gC
onsu
ltativ
e G
roup
on
Inte
rnat
iona
l Agr
icul
tura
l Res
earc
hC
omm
onw
ealth
Agr
icul
tura
l Bur
eau
Inte
rnat
iona
lR
egio
nal E
arly
War
ning
Uni
t for
Foo
d S
ecur
ityR
egio
nal F
ood
Sec
urity
Tra
inin
g P
rogr
amm
eF
orei
gn r
ates
and
taxe
sIn
tern
atio
nal C
otto
n A
dvis
ory
Cou
ncil
Wor
ldF
ood
Pro
gram
me
–52
2 3 0 95 282
117
382 –
10 2
033
090
3 08
812
4 – 20 150
138
140
000
– – – – – – – – – – – – – – – – –
– 18 – – – – – – –(1
29) 6
123 –
(18) – – –
–54
0 30 95 282
117
382 –
10 2
032
961
3 09
424
7 – 215
013
814
0 00
0
–53
0 28 65 257
117
375 –
10 2
03 –3
094
246 – – 22 137
140
000
–98
,193
,368
,491
,110
0 ,0
98,2 –
100,
00,
010
0,0
99,6 – –
14,7
99,3
100,
0
201
548 62 102
561
233
380
405
9 89
4 501
870
204
330
250 40 – –
To
tal
158
241
– –
158
241
155
074
97,8
15 9
49

Annual fi nancial statements136
DE
PA
RT
ME
NT
OF
AG
RIC
UL
TU
RE
VO
TE
25
AN
NE
XU
RE
ST
OT
HE
AN
NU
AL
FIN
AN
CIA
LS
TA
TE
ME
NT
SA
NN
EX
UR
ES
TO
TH
E A
NN
UA
L F
INA
NC
IAL
ST
AT
EM
EN
TS
for
the
ye
ar
en
de
d3
1M
arc
h2
00
6fo
r th
e y
ea
r e
nd
ed
31
Ma
rch
20
06
AN
NE
XU
RE
1K
ST
AT
EM
EN
T O
F T
RA
NS
FE
RS
/SU
BS
IDIE
S T
O N
ON
-PR
OF
IT IN
ST
ITU
TIO
NS
Tra
nsf
er a
lloca
tio
nE
xpen
dit
ure
2004
/05
Ad
just
ed A
pp
ro-
pri
atio
n A
ctR
oll
ove
rsA
dju
stm
ents
To
tal a
vaila
ble
Act
ual
tra
nsf
er %
of
avai
lab
lefu
nd
s tr
ansf
erre
dA
pp
rop
riat
ion
Act
R'0
00R
'000
R'0
00R
'000
R'0
00%
R'0
00
Tra
nsf
ers
Nat
iona
l Red
Mea
t Pro
duce
r’s O
rgan
isat
ion
Cot
ton
indu
stry
Fru
it in
dust
ryP
oultr
y in
dust
ryN
atio
nal A
fric
an F
arm
ers’
Uni
on (
NA
FU
)G
rain
Indu
stry
Pro
ject
Man
agem
ent
Inte
rnat
iona
l Con
fere
nce
of A
gric
ultu
ral E
cono
mic
sF
ood
and
Tre
esfo
r A
fric
aS
A W
ine
and
Vin
e In
dust
ryM
ankw
e F
inan
cial
Ser
vice
s C
o-op
erat
ive
Qud
eni F
inan
cial
Ser
vice
s C
o-op
erat
ive
Ndk
andl
a F
inan
cial
Ser
vice
s C
o-op
erat
ive
Nga
vum
a F
inan
cial
Ser
vice
s C
o-op
erat
ive
Fin
anci
al C
oope
rativ
e of
Sou
th A
fric
a (F
ICO
SA
)
300 – –
300 – – – – – – – – – –
– – – – – – – – – – – – – –
– –17
9 – – – – – – – – – – –
300 –
179
300 – – – – – – – – – –
300 –
179
300 – – – – – – – – – –
100,
0 –10
0,0
100,
0 – – – – – – – – – –
185
645
250
250
500
300
131 80 284 30 6 12 10
1 00
0
To
tal
600
–17
977
977
9–
3 68
3

DoA Annual report 2005/06 137
DE
PA
RT
ME
NT
OF
AG
RIC
UL
TU
RE
VO
TE
25
AN
NE
XU
RE
ST
OT
HE
AN
NU
AL
FIN
AN
CIA
LS
TA
TE
ME
NT
SA
NN
EX
UR
ES
TO
TH
E A
NN
UA
L F
INA
NC
IAL
ST
AT
EM
EN
TS
for
the
ye
ar
en
de
d3
1M
arc
h2
00
6fo
r th
e y
ea
r e
nd
ed
31
Ma
rch
20
06
AN
NE
XU
RE
1L
ST
AT
EM
EN
T O
F T
RA
NS
FE
RS
/SU
BS
IDIE
S T
O H
OU
SE
HO
LD
S
Tra
nsf
er a
lloca
tio
nE
xpen
dit
ure
2004
/05
Ad
just
edA
pp
rop
riat
ion
Act
Ro
ll o
vers
Ad
just
men
tsT
ota
l ava
ilab
leA
ctu
al t
ran
sfer
% o
f av
aila
ble
fun
ds
tran
sfer
red
Ap
pro
pri
atio
nA
ct
R'0
00R
'000
R'0
00R
'000
R'0
00%
R'0
00
Por
cine
res
pira
tory
and
rep
rodu
ctiv
e sy
ndro
me
Avi
an in
fl uen
zaS
ocia
l ben
efi ts
Cla
ssic
al S
win
e fe
ver
Agr
iBE
E
300
0 –1
520
3427
05
000
– – – – –
–4
930
757 – –
300
04
930
227
734
270
500
0
2 98
54
930
134
425
366 –
99,5
100,
059
,074
,0 –
200
036
271
1 75
4 – –
To
tal
43 7
90–
5 68
749
477
34 6
2570
,040
025

Annual fi nancial statements138
DE
PA
RT
ME
NT
OF
AG
RIC
UL
TU
RE
VO
TE
25
AN
NE
XU
RE
ST
OT
HE
AN
NU
AL
FIN
AN
CIA
LS
TA
TE
ME
NT
SA
NN
EX
UR
ES
TO
TH
E A
NN
UA
L F
INA
NC
IAL
ST
AT
EM
EN
TS
for
the
ye
ar
en
de
d3
1M
arc
h2
00
6fo
r th
e y
ea
r e
nd
ed
31
Ma
rch
20
06
AN
NE
XU
RE
1M
ST
AT
EM
EN
T O
F G
IFT
S, D
ON
AT
ION
S A
ND
SP
ON
SO
RS
HIP
S R
EC
EIV
ED
FO
R T
HE
YE
AR
EN
DE
D 3
1 M
AR
CH
200
6
Nam
e o
f o
rgan
isat
ion
Nat
ure
of
gif
t, d
on
atio
n o
r sp
on
sors
hip
2005
/06
2004
/05
R’0
00R
’000
Rec
eive
d in
cas
h
Land
Ban
kF
emal
e F
arm
er o
f the
Yea
r aw
ards
200
530
0–
Su
bto
tal
300
–
Rec
eive
din
kin
d
SA
DC
Aqu
a M
aste
r S
outh
Afr
ica
(Pty
) Lt
dIn
t ern
atio
nal L
ives
tock
Res
earc
h In
stitu
teF
AO
TR
ALA
CG
erm
an g
over
nmen
tS
ever
al g
ifts/
dona
tions
A
BS
A/L
and
Ban
kA
ustr
alia
n A
genc
y fo
r In
tern
atio
nal D
evel
opm
ent
Dis
tel/S
outh
Afr
ican
Drie
d F
ruit
and
Sou
th A
fric
an M
eat I
ndus
try
Cou
ncil
Sec
reta
riat t
o th
e C
onse
rvat
ion
on B
iolo
gica
l Div
ersi
tyM
onsa
nto/
AB
SA
Agr
ic.B
usin
ess/
NA
MC
Nam
ibia
n A
gric
ultu
re T
rade
For
um
Allo
wan
ce to
atte
nd a
cou
rse
on q
uant
itativ
e ris
k an
alys
isA
wat
er c
ondi
tione
r fo
r irr
igat
ion
purp
oses
Allo
wan
ce to
atte
nd a
mee
ting
at th
e IL
RI H
eadq
uart
ers
in N
airo
bi, K
enya
Com
mem
orat
ion
of W
orld
Foo
d D
ay in
the
Nor
ther
n C
ape
Wor
ksho
pA
ttend
ing
the
3rd in
tern
atio
nal e
xper
t con
gres
s fo
r B
iofu
els
in B
erly
n, G
erm
any
Dep
artm
enta
l tea
m b
uild
ing
day
Bud
get s
peec
h fu
nctio
nS
uppo
rt o
f Lan
dCar
e pr
ogra
mm
eG
ift b
aske
t use
d du
ring
the
pres
iden
tial i
naug
urat
ion
cere
mon
yW
orks
hop
Far
ewel
l fun
ctio
nC
ontr
ibut
ion
tow
ards
exp
endi
ture
to a
ttend
For
um m
eetin
g
6 26 16 10 5 10 215 – – – – – –
– – – – – – 55 65 999 20 54 42 3
Su
bto
tal
288
123
8
To
tal
588
123
8

DoA Annual report 2005/06 139
Nam
e o
f o
rgan
isat
ion
Nat
ure
of
gif
t, d
on
atio
n o
r sp
on
sors
hip
2004
/05
2003
/04
R’0
00R
’000
Rec
eive
d in
cas
h
Inte
rnat
iona
l Pla
nt G
enet
ic R
esou
rces
Inst
itutio
n (I
PG
RI)
Wor
ksho
p–
13
Su
bto
tal
–13
Rec
eive
din
kin
d
AB
SA
/Lan
d B
ank
Aus
tral
ian
Age
ncy
for
Inte
rnat
iona
l Dev
elop
men
tD
iste
l/Sou
th A
fric
an D
ried
Fru
it an
d S
outh
Afr
ican
Mea
t Ind
ustr
y C
ounc
ilS
ever
al g
ift/d
onat
ions
Sec
reta
riat t
o th
e C
onse
rvat
ion
on B
iolo
gica
l Div
ersi
tyM
onsa
nto/
AB
SA
Agr
ic B
usin
ess/
NA
MC
Nam
ibia
n A
gric
ultu
re T
rade
For
umS
wis
s S
tate
Sec
reta
rial f
or E
cono
mic
Affa
irs (
SE
CO
)S
AB
SF
lopp
y S
prin
kler
(P
ty)
Ltd
Bud
get s
peec
h fu
nctio
nS
uppo
rt o
f Lan
dCar
e pr
ogra
mm
eG
ift b
aske
t use
d du
ring
the
pres
iden
tial i
naug
urat
ion
cere
mon
yD
epar
tmen
t’s a
nnua
l tea
m b
uild
ing
day
Wor
ksho
pF
arew
ellf
unct
ion
Con
trib
utio
n to
war
ds e
xpen
ditu
re to
atte
nd fo
rum
mee
ting
Cap
acity
bui
ldin
g fo
r su
rvei
llanc
e fo
r pr
even
tion
of B
SE
and
oth
er z
oono
tic d
isea
ses
Tra
velin
g co
stIr
rigat
ion
mat
eria
l
65 999 20 55 54 42 3 – – –
– – – – – – –20
800 2 34
Su
bto
tal
123
820
836
To
tal
123
820
849
DE
PA
RT
ME
NT
OF
AG
RIC
UL
TU
RE
VO
TE
25
AN
NE
XU
RE
ST
OT
HE
AN
NU
AL
FIN
AN
CIA
LS
TA
TE
ME
NT
SA
NN
EX
UR
ES
TO
TH
E A
NN
UA
L F
INA
NC
IAL
ST
AT
EM
EN
TS
for
the
ye
ar
en
de
d3
1M
arc
h2
00
6fo
r th
e y
ea
r e
nd
ed
31
Ma
rch
20
06
AN
NE
XU
RE
1M
(co
nt.
)
ST
AT
EM
EN
T O
F G
IFT
S, D
ON
AT
ION
S A
ND
SP
ON
SO
RS
HIP
S R
EC
EIV
ED
FO
R T
HE
YE
AR
EN
DE
D 3
1 M
AR
CH
200
6

Annual fi nancial statements140
DE
PA
RT
ME
NT
OF
AG
RIC
UL
TU
RE
VO
TE
25
AN
NE
XU
RE
ST
OT
HE
AN
NU
AL
FIN
AN
CIA
LS
TA
TE
ME
NT
SA
NN
EX
UR
ES
TO
TH
E A
NN
UA
L F
INA
NC
IAL
ST
AT
EM
EN
TS
for
the
ye
ar
en
de
d3
1M
arc
h2
00
6fo
r th
e y
ea
r e
nd
ed
31
Ma
rch
20
06
AN
NE
XU
RE
1N
ST
AT
EM
EN
T O
F L
OC
AL
AN
D F
OR
EIG
N A
ID A
SS
IST
AN
CE
RE
CE
IVE
D F
OR
TH
E Y
EA
R E
ND
ED
31
MA
RC
H 2
006
Nam
e o
f d
on
or
Pu
rpo
se
Op
enin
gb
alan
ceR
even
ue
Ex p
en-
dit
ur e
Clo
sin
gb
alan
ce
R'0
00R
'000
R'0
00R
'000
Rec
eive
d in
cas
h
Eur
opea
n U
nion
Pes
ticid
es In
itiat
ive
Pro
gram
me
–5
590
5 59
0–
To
tal
–5
590
5 59
0–

DoA Annual report 2005/06 141
DE
PA
RT
ME
NT
OF
AG
RIC
UL
TU
RE
VO
TE
25
AN
NE
XU
RE
ST
OT
HE
AN
NU
AL
FIN
AN
CIA
LS
TA
TE
ME
NT
SA
NN
EX
UR
ES
TO
TH
E A
NN
UA
L F
INA
NC
IAL
ST
AT
EM
EN
TS
for
the
ye
ar
en
de
d3
1M
arc
h2
00
6fo
r th
e y
ea
r e
nd
ed
31
Ma
rch
20
06
AN
NE
XU
RE
1O
ST
AT
EM
EN
T O
F G
IFT
S, D
ON
AT
ION
S A
ND
SP
ON
SO
RS
HIP
S M
AD
E A
ND
RE
MIS
SIO
NS
, RE
FU
ND
S A
ND
PA
YM
EN
TS
MA
DE
AS
AN
AC
T O
F G
RA
CE
FO
R T
HE
YE
AR
EN
DE
D
31 M
AR
CH
200
6
Nat
ure
of
gif
t, d
on
atio
n o
r sp
on
sors
hip
R’0
00
Pai
din
cas
h
Gift
s to
fore
ign
visi
tors
from
Indi
a an
d C
hina
Gift
s to
Min
iste
rs o
f the
Dem
ocra
tic R
epub
lic o
f the
Con
go a
nd M
ali
Gift
s to
the
Chi
nese
hos
ts o
f the
sec
ond
Sou
th A
fric
a-C
hina
JW
G m
eetin
gG
ifts
to th
e P
resi
dent
of t
he O
AE
Don
atio
n to
the
SA
She
ep S
hear
ing
Fed
erat
ion
for
part
icip
atio
n in
the
Wor
ld S
hear
ing
and
Hol
ding
Cha
mpi
onsh
ips
in A
ustr
alia
Gift
for
a vi
sit t
o N
amib
ia
1 1 1 110
0 1
To
tal
105

Annual fi nancial statements142
DE
PA
RT
ME
NT
OF
AG
RIC
UL
TU
RE
VO
TE
25
AN
NE
XU
RE
ST
OT
HE
AN
NU
AL
FIN
AN
CIA
LS
TA
TE
ME
NT
SA
NN
EX
UR
ES
TO
TH
E A
NN
UA
L F
INA
NC
IAL
ST
AT
EM
EN
TS
for
the
ye
ar
en
de
d3
1M
arc
h2
00
6fo
r th
e y
ea
r e
nd
ed
31
Ma
rch
20
06
AN
NE
XU
RE
2B
ST
AT
EM
EN
T O
F IN
VE
ST
ME
NT
S IN
AN
D A
MO
UN
TS
OW
ING
BY
/TO
EN
TIT
IES
AS
AT
31
MA
RC
H 2
006
Nam
e o
f p
ub
lic e
nti
tyN
atu
re o
f b
usi
nes
s
Co
st o
f in
vest
men
tN
et a
sset
val
ue
of
inve
stm
ent
Am
ou
nts
ow
ing
to
en
titi
esA
mo
un
ts o
win
g b
y en
titi
es
R’ 0
00R
’000
R'0
00R
'000
2005
/06
2004
/05
2005
/06
2004
/05
2005
/06
2004
/05
2005
/06
2004
/05
Co
ntr
olle
d e
nti
ties
Nce
ra F
arm
s (P
ty)
Ltd
Far
mer
sup
port
and
rela
ted
activ
ities
in K
idd’
sB
each
dist
rict
––
11
––
––
Ond
erst
epoo
rt B
iolo
gica
l P
rodu
cts
(Pty
) Lt
dM
anuf
actu
ring
of v
acci
nes
and
rela
ted
prod
ucts
toan
imal
care
indu
strie
s–
–1
1–
––
–
To
tal
––
22
––
––
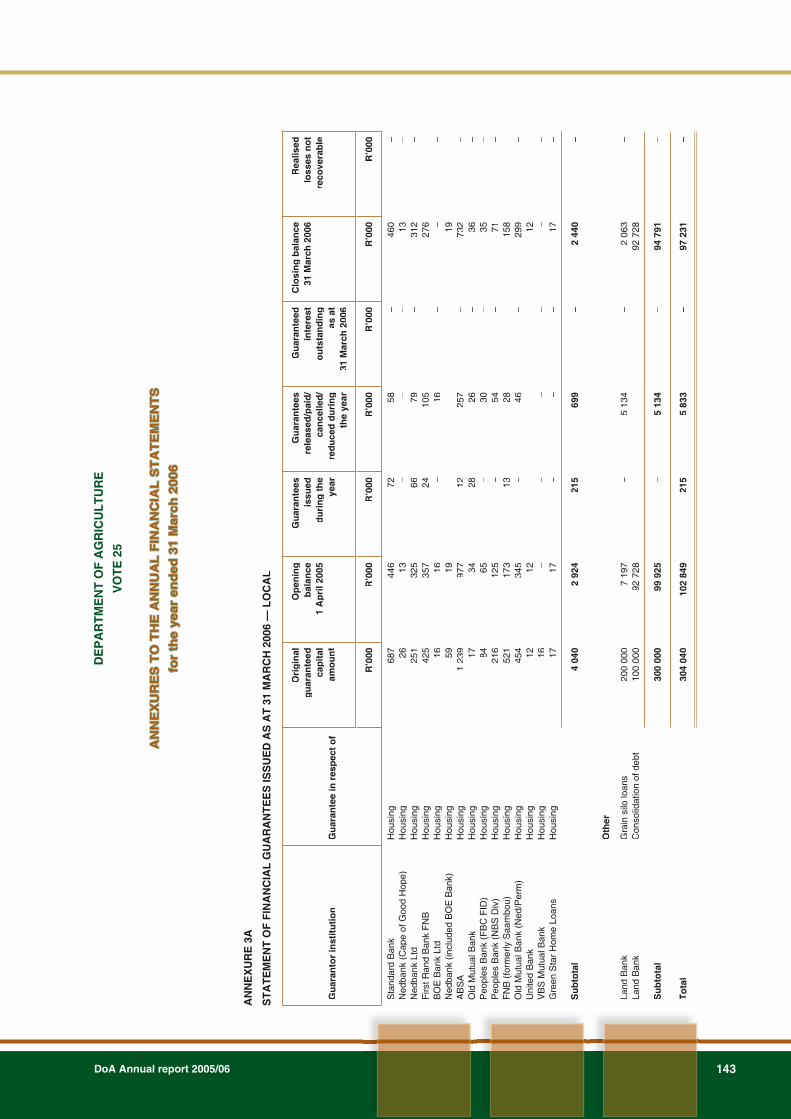
DoA Annual report 2005/06 143
DE
PA
RT
ME
NT
OF
AG
RIC
UL
TU
RE
VO
TE
25
AN
NE
XU
RE
ST
OT
HE
AN
NU
AL
FIN
AN
CIA
LS
TA
TE
ME
NT
SA
NN
EX
UR
ES
TO
TH
E A
NN
UA
L F
INA
NC
IAL
ST
AT
EM
EN
TS
for
the
ye
ar
en
de
d3
1M
arc
h2
00
6fo
r th
e y
ea
r e
nd
ed
31
Ma
rch
20
06
AN
NE
XU
RE
3A
ST
AT
EM
EN
T O
F F
INA
NC
IAL
GU
AR
AN
TE
ES
ISS
UE
D A
S A
T 3
1 M
AR
CH
200
6 —
LO
CA
L
Gu
aran
tor
inst
itu
tio
nG
uar
ante
e in
res
pec
t o
f
Ori
gin
alg
uar
ante
edca
pit
alam
ou
nt
Op
enin
gb
alan
ce1
Ap
ril 2
005
Gu
aran
tees
issu
edd
uri
ng
th
eye
ar
Gu
aran
tees
rele
ased
/pai
d/
can
celle
d/
red
uce
d d
uri
ng
the
year
Gu
aran
teed
inte
rest
ou
tsta
nd
ing
as a
t31
Mar
ch 2
006
Clo
sin
g b
alan
ce31
Mar
ch 2
006
Rea
lised
loss
es n
ot
reco
vera
ble
R’0
00R
’000
R’0
00R
’000
R’0
00R
’000
R’0
00
Sta
ndar
d B
ank
Ned
bank
(Cap
e of
Goo
d H
ope)
Ned
bank
Ltd
Firs
t Ran
d B
ank
FN
BB
OE
Ban
k Lt
dN
edba
nk (
incl
uded
BO
E B
ank)
AB
SA
Old
Mut
ual B
ank
Peo
ples
Ban
k (F
BC
FID
)P
eopl
es B
ank
(NB
S D
iv)
FN
B (
form
erly
Saa
mbo
u)O
ld M
utua
l Ban
k (N
ed/P
erm
)U
nite
d B
ank
VB
S M
utua
l Ban
kG
reen
Sta
r H
ome
Loan
s
Hou
sing
Hou
sing
Hou
sing
Hou
sing
Hou
sing
Hou
sing
Hou
sing
Hou
sing
Hou
sing
Hou
sing
Hou
sing
Hou
sing
Hou
sing
Hou
sing
Hou
sing
687 26 251
425 16 59
123
9 17 84 216
521
454 12 16 17
446 13 325
357 16 19 977 34 65 125
173
345 12 – 17
72 – 66 24 – – 12 28 – – 13 – – – –
58 – 79 105 16 –
257 26 30 54 28 46 – – –
– – – – – – – – – – – – – – –
460 13 312
276 – 19 732 36 35 71 158
299 12 – 17
– – – – – – – – – – – – – – –
Su
bto
tal
4 04
02
924
215
699
–2
440
–
Oth
er
Land
Ban
kLa
nd B
ank
Gra
in s
ilo lo
ans
Con
solid
atio
n of
deb
t20
0 00
010
000
07
197
92 7
28– –
5 13
4 –– –
2 06
392
728
– –
Su
bto
tal
300
000
99 9
25–
5 13
4–
94 7
91–
To
tal
304
040
102
849
215
5 83
3–
97 2
31–

Annual fi nancial statements144
DE
PA
RT
ME
NT
OF
AG
RIC
UL
TU
RE
VO
TE
25
AN
NE
XU
RE
ST
OT
HE
AN
NU
AL
FIN
AN
CIA
LS
TA
TE
ME
NT
SA
NN
EX
UR
ES
TO
TH
E A
NN
UA
L F
INA
NC
IAL
ST
AT
EM
EN
TS
for
the
ye
ar
en
de
d3
1M
arc
h2
00
6fo
r th
e y
ea
r e
nd
ed
31
Ma
rch
20
06
AN
NE
XU
RE
3B
ST
AT
EM
EN
T O
F C
ON
TIN
GE
NT
LIA
BIL
ITIE
S A
S A
T 3
1 M
AR
CH
200
6
Nat
ure
of
liab
ility
Op
enin
g b
alan
ce01
/04/
2005
Lia
bili
ties
incu
rred
du
rin
g t
he
year
Lia
bili
ties
pai
d/c
ance
lled
/re
du
ced
du
rin
g t
he
year
Lia
bili
ties
rec
ove
rab
leC
losi
ng
bal
ance
31/0
3/20
06
R’ 0
00R
’000
R’0
00R
’000
R’0
00
Oth
er39
–8
–31
To
tal
39–
8–
31
Nat
ure
of
liab
ility
Op
enin
g b
alan
ce01
/04/
2005
Det
ails
of
liab
ility
an
d r
eco
vera
bili
ty
Mo
vem
ent
du
rin
g y
ear
Clo
sin
g b
alan
ce31
/03/
2006
R’0
00R
’000
R’0
00
Ex-
grat
ia7
Cla
im:
Loss
of p
erso
nal e
ffect
s. A
wai
ting
com
men
ts fr
om S
tate
A
ttorn
e y–
7
Veh
icle
colli
sion
s:C
ompe
nsat
ion
30C
laim
s —
Im
peria
l ca
rs d
amag
ed —
Fur
ther
rec
over
ies
still
und
erin
vest
i gat
ion
(6)
24
Com
pens
atio
n cl
aim
2B
urst
pip
e at
cro
ssin
g —
cla
im b
y M
etro
rail
paid
with
out r
ecou
rse
(2)
–

DoA Annual report 2005/06 145
DEPARTMENT OF AGRICULTURE
VOTE 25
ANNEXURES TO THE ANNUAL FINANCIAL STATEMENTSANNEXURES TO THE ANNUAL FINANCIAL STATEMENTS
for the year ended 31 March 2006for the year ended 31 March 2006
ANNEXURE 4
CAPITAL TANGIBLE ASSET MOVEMENT SCHEDULE FOR THE YEAR ENDED 31 MARCH 2006
Openingbalance
Additions Disposals Closingbalance
R’000 R’000 R’000 R’000
BUILDING AND OTHER FIXED STRUCTURES 837 60 438 60 508 767
Dwellings 827 39 221 645
Non-residential buildings 10 17 848 17 736 122
Other fi xed structures – 42 551 42 551 –
MACHINERY AND EQUIPMENT 121 029 49 356 31 869 138 516
Transport assets 32 564 12 768 5 058 40 274
Specialised military assets 34 – 12 22
Computer equipment 37 959 9 728 3 033 44 654
Furniture and offi ce equipment 4 295 3 107 299 7 103
Other machinery and equipment 46 177 23 753 23 467 46 463
CULTIVATED ASSETS
Cultivated assets 1 075 22 – 1 097
TOTAL CAPITAL ASSETS 122 941 109 816 92 377 140 380
The Department maintains a LOGIS asset register centrally, with assets shown per directorate. Separate registersneed to be maintained to control assets on a directorate basis. A number of these directorates have not compiledasset registers per offi ce which prohibits the physical verifi cation of assets. Quarterly stock takes as required by the Departmental Financial Instructions have not been done but a stock take was done at year end. The current systemto administer assets does not meet the requirements of the Department.
To improve the control over assets in the Department, the National Treasury has embarked on an asset managementreform process to assist the Department to improve the control over assets. In order to fully comply with the assetmanagement reform process, the Department and the National Treasury agreed on an asset implementation actionplan to ensure the effective and effi cient management of assets in the Department and therefore to enhance overallcontrol over assets by 31 March 2007.
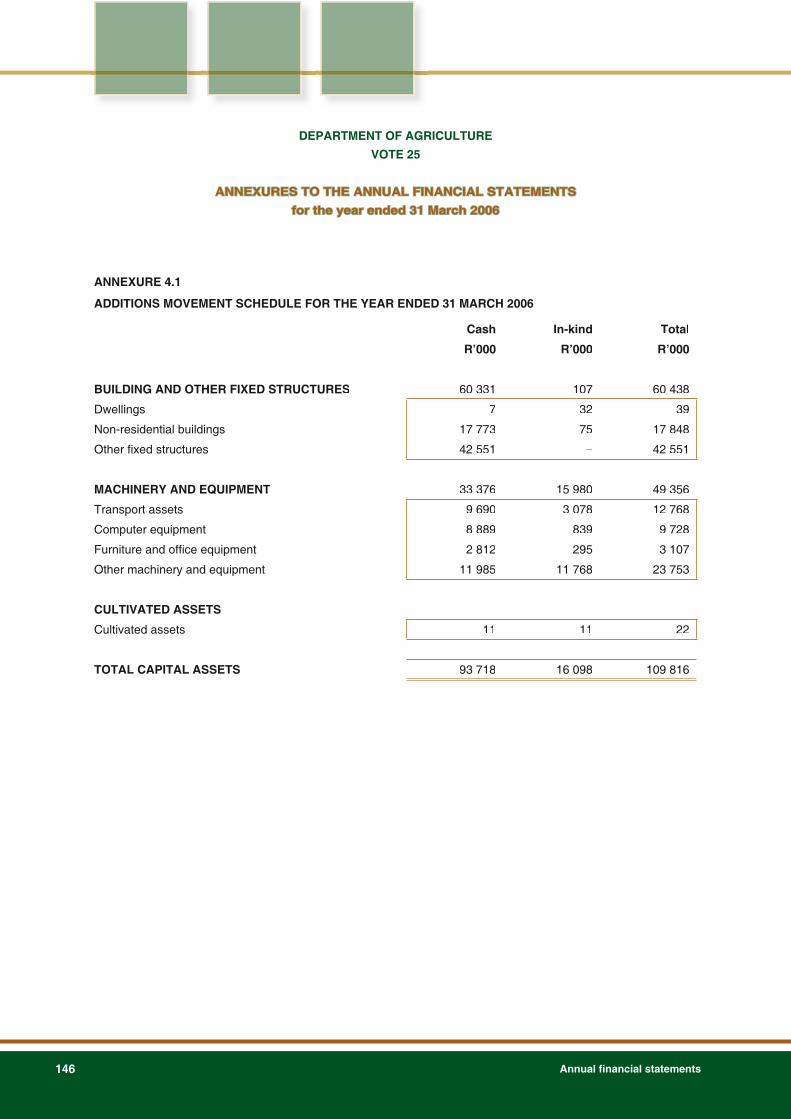
Annual fi nancial statements146
DEPARTMENT OF AGRICULTURE
VOTE 25
ANNEXURES TO THE ANNUAL FINANCIAL STATEMENTSANNEXURES TO THE ANNUAL FINANCIAL STATEMENTS
for the year ended 31 March 2006for the year ended 31 March 2006
ANNEXURE 4.1
ADDITIONS MOVEMENT SCHEDULE FOR THE YEAR ENDED 31 MARCH 2006
Cash In-kind Total
R’000 R’000 R’000
BUILDING AND OTHER FIXED STRUCTURES 60 331 107 60 438
Dwellings 7 32 39
Non-residential buildings 17 773 75 17 848
Other fi xed structures 42 551 – 42 551
MACHINERY AND EQUIPMENT 33 376 15 980 49 356
Transport assets 9 690 3 078 12 768
Computer equipment 8 889 839 9 728
Furniture and offi ce equipment 2 812 295 3 107
Other machinery and equipment 11 985 11 768 23 753
CULTIVATED ASSETS
Cultivated assets 11 11 22
TOTAL CAPITAL ASSETS 93 718 16 098 109 816

DoA Annual report 2005/06 147
ANNEXURE 4.2
DISPOSALS MOVEMENT SCHEDULE FOR THE YEAR ENDED 31 MARCH 2006
Cost/carryingamount
Cash Profi t/(loss) ondisposal
R’000 R’000 R’000
BUILDING AND OTHER FIXED STRUCTURES 60 508 65 (60 443)
Dwellings 221 65 (156)
Non-residential buildings 17 736 – (17 736)
Other fi xed structures 42 551 – (42 551)
MACHINERY AND EQUIPMENT 31 869 143 (31 726)
Transport assets 5 058 115 (4 943)
Specialised military assets 12 12 –
Computer equipment 3 033 4 (3 029)
Furniture and offi ce equipment 299 10 (289)
Other machinery and equipment 23 467 2 (23 465)
TOTAL CAPITAL ASSETS 92 377 208 (92 169)
DEPARTMENT OF AGRICULTURE
VOTE 25
ANNEXURES TO THE ANNUAL FINANCIAL STATEMENTSANNEXURES TO THE ANNUAL FINANCIAL STATEMENTS
for the year ended 31 March 2006for the year ended 31 March 2006

Annual fi nancial statements148
DEPARTMENT OF AGRICULTURE
VOTE 25
ANNEXURES TO THE ANNUAL FINANCIAL STATEMENTSANNEXURES TO THE ANNUAL FINANCIAL STATEMENTS
for the year ended 31 March 2006for the year ended 31 March 2006
ANNEXURE 4.3
CAPITAL TANGIBLE ASSET MOVEMENT SCHEDULE FOR THE YEAR ENDED 31 MARCH 2005
Additions Disposals Totalmovement
R’000 R’000 R’000
BUILDING AND OTHER FIXED STRUCTURES 74 859 37 967 36 892
Non-residential buildings 36 892 – 36 892
Other fi xed structures 37 967 37 967 –
MACHINERY AND EQUIPMENT 22 581 11 399 11 182
Transport assets 3 765 8 592 (4 827)
Computer equipment 8 054 10 8 044
Furniture and offi ce equipment 713 637 76
Other machinery and equipment 10 049 2 160 7 889
CULTIVATED ASSETS
Cultivated assets 175 – 175
TOTAL CAPITAL ASSETS 97 615 49 366 48 249
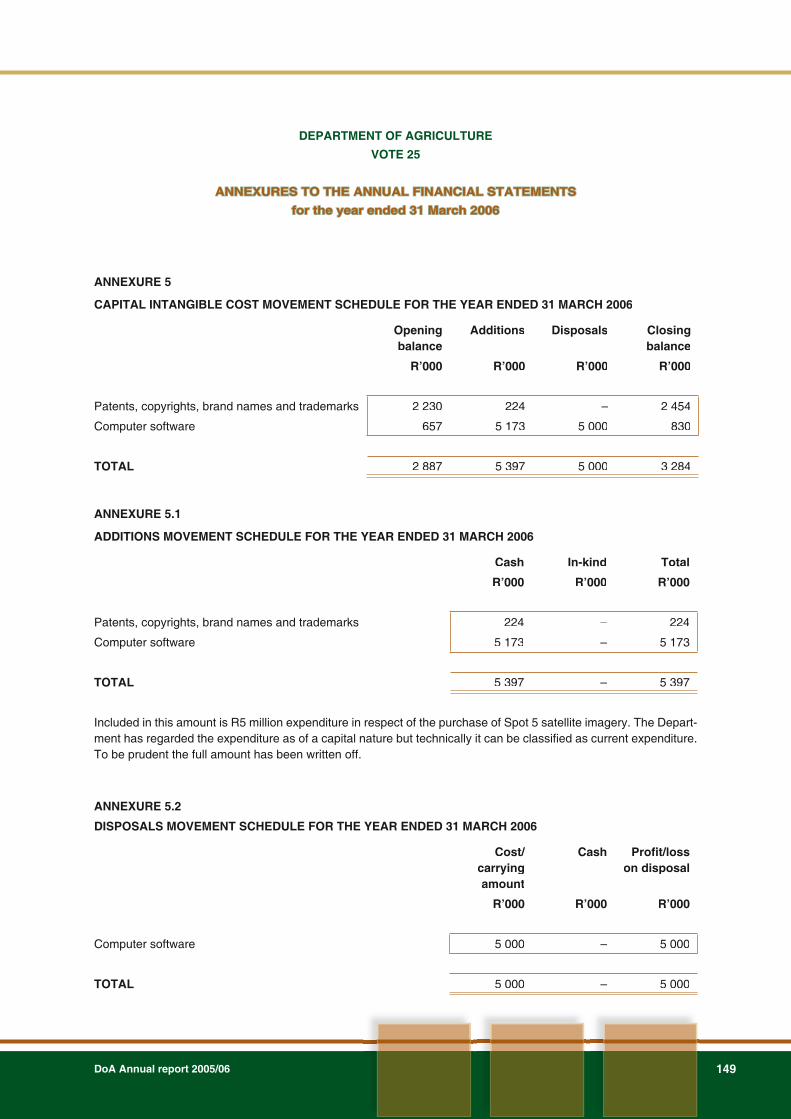
DoA Annual report 2005/06 149
DEPARTMENT OF AGRICULTURE
VOTE 25
ANNEXURES TO THE ANNUAL FINANCIAL STATEMENTSANNEXURES TO THE ANNUAL FINANCIAL STATEMENTS
for the year ended 31 March 2006for the year ended 31 March 2006
ANNEXURE 5
CAPITAL INTANGIBLE COST MOVEMENT SCHEDULE FOR THE YEAR ENDED 31 MARCH 2006
Openingbalance
Additions Disposals Closingbalance
R’000 R’000 R’000 R’000
Patents, copyrights, brand names and trademarks 2 230 224 – 2 454
Computer software 657 5 173 5 000 830
TOTAL 2 887 5 397 5 000 3 284
ANNEXURE 5.1
ADDITIONS MOVEMENT SCHEDULE FOR THE YEAR ENDED 31 MARCH 2006
Cash In-kind Total
R’000 R’000 R’000
Patents, copyrights, brand names and trademarks 224 – 224
Computer software 5 173 – 5 173
TOTAL 5 397 – 5 397
Included in this amount is R5 million expenditure in respect of the purchase of Spot 5 satellite imagery. The Depart-ment has regarded the expenditure as of a capital nature but technically it can be classifi ed as current expenditure. To be prudent the full amount has been written off.
ANNEXURE 5.2
DISPOSALS MOVEMENT SCHEDULE FOR THE YEAR ENDED 31 MARCH 2006
Cost/carryingamount
Cash Profi t/losson disposal
R’000 R’000 R’000
Computer software 5 000 – 5 000
TOTAL 5 000 – 5 000

Annual fi nancial statements150
DEPARTMENT OF AGRICULTURE
VOTE 25
ANNEXURES TO THE ANNUAL FINANCIAL STATEMENTSANNEXURES TO THE ANNUAL FINANCIAL STATEMENTS
for the year ended 31 March 2006for the year ended 31 March 2006
ANNEXURE 5.3
CAPITAL INTANGIBLE ASSET MOVEMENT SCHEDULE FOR THE YEAR ENDED 31 MARCH 2005
Additions Disposals Totalmovement
R’000 R’000 R’000
BUILDING AND OTHER FIXED STRUCTURES
Patents, copyrights, brand names and trademarks 603 – 603
Computer software 2 341 2 341 –
TOTAL 2 944 2 341 603

DoA Annual report 2005/06 151
DE
PA
RT
ME
NT
OF
AG
RIC
UL
TU
RE
VO
TE
25
AN
NE
XU
RE
ST
OT
HE
AN
NU
AL
FIN
AN
CIA
LS
TA
TE
ME
NT
SA
NN
EX
UR
ES
TO
TH
E A
NN
UA
L F
INA
NC
IAL
ST
AT
EM
EN
TS
for
the
ye
ar
en
de
d3
1M
arc
h2
00
6fo
r th
e y
ea
r e
nd
ed
31
Ma
rch
20
06
AN
NE
XU
RE
6
INT
ER
GO
VE
RN
ME
NT
RE
CE
IVA
BL
ES
Go
vern
men
t en
tity
Co
nfi
rmed
bal
ance
ou
tsta
nd
ing
Un
con
fi rm
ed b
alan
ce o
uts
tan
din
gT
ota
l
31/0
3/20
0631
/03/
2005
31/0
3/20
0631
/03/
2005
31/0
3/20
0631
/03/
2005
R’0
00R
’000
R’0
00R
’00 0
R’0
00R
’000
Nat
ion
al D
epar
tmen
ts
Dep
artm
ent o
f For
eign
Affa
irs
Dep
artm
ent M
iner
als
and
Ene
rgy
Dep
artm
ent o
f Pro
vinc
ial a
nd L
ocal
Gov
ernm
ent
Dep
artm
ent o
f Tra
de a
nd In
dust
ry
Dep
artm
ent o
f Jus
tice
and
Con
stitu
tiona
l Dev
elop
men
t
Dep
artm
ent o
f Hea
lth
Nat
iona
l Pro
secu
ting
Aut
horit
y
Nat
iona
l Int
ellig
ence
Age
ncy
Dep
artm
ent o
f Pub
lic W
orks
Dep
artm
ent o
f Lan
d A
ffairs
Dep
artm
ent o
f Hom
e A
ffairs
Dep
artm
ent o
f Wat
er A
ffairs
and
For
estr
y
SA
MD
I
The
Pre
side
ncy
Dep
artm
ent o
f Lab
our
– – 1 – – – 3 – – – – 26 – – –
19 – – – – – – 5 – – – – – – –
17 3 –
244 1 30 – –
459
1,26
3 26 57 1 14 2
65 – –
132
115 38 6 – 78 25 6 33 – – –
17 3 1
244 1 30 3 –
459
1,26
3 26 83 1 14 2
84 – –
132
115 38 6 5 78 25 6 33 – – –
Gau
ten
g P
rovi
nce
Dep
artm
ent o
f Agr
icul
ture
, Con
serv
atio
n, E
nviro
nmen
t and
Lan
d A
ffairs
Gau
teng
GG
Tra
nspo
r t
Pro
vinc
ialG
over
nmen
t
Soc
ial D
evel
opm
ent
– – – –
– – – –
– 3 14 9
15 – – –
– 3 14 9
15 – – –

Annual fi nancial statements152
Go
vern
men
t en
tity
Co
nfi
rmed
bal
ance
ou
tsta
nd
ing
Un
con
fi rm
ed b
alan
ce o
uts
tan
din
gT
ota
l
31/0
3/20
0631
/03/
2005
31/0
3/20
0631
/03/
2005
31/0
3/20
0631
/03/
2005
R’0
00R
’000
R’0
00R
’000
R’0
00R
’000
Mp
um
alan
ga
Pro
vin
ce
Dep
artm
ent o
f Edu
catio
n
Dep
artm
ent o
f Agr
icul
ture
, Con
serv
atio
n an
d E
nviro
nmen
t
Dep
artm
ent o
f Wat
er A
ffairs
Pub
lic W
orks
– – – –
– 50 – –
– 36 14 14
12 35 23 –
– 36 14 14
12 85 23 –
No
rth
Wes
t P
rovi
nce
Dep
artm
ent o
f Agr
icul
ture
, Con
serv
atio
n an
d E
nviro
nmen
t
Dep
artm
ent o
f Roa
ds a
nd P
ublic
Wor
ks
Dep
artm
ent o
f Wat
er A
ffairs
– – –
– – 70
205 – –
218 7 –
205 – –
218 7 70
Lim
po
po
Pro
vin
ce
Dep
artm
ent o
f Pub
lic W
orks
––
–58
–58
Kw
aZu
lu–N
atal
Pro
vin
ce
Dep
artm
ent o
f Lab
our
Dep
artm
ent o
f Agr
icul
ture
and
Env
ironm
ent A
ffairs
– –
– –
– 11
24 –
– 11
24 –
Fre
e S
tate
Pro
vin
ce
Dep
artm
ent o
f Agr
icul
ture
Dep
artm
ent o
f Soc
ial D
evel
opm
ent
Dep
artm
ent o
f Edu
catio
n
– – –
– 10 –
15 – 10
4 – –
15 – 10
4 10 –
DE
PA
RT
ME
NT
OF
AG
RIC
UL
TU
RE
VO
TE
25
AN
NE
XU
RE
ST
OT
HE
AN
NU
AL
FIN
AN
CIA
LS
TA
TE
ME
NT
SA
NN
EX
UR
ES
TO
TH
E A
NN
UA
L F
INA
NC
IAL
ST
AT
EM
EN
TS
for
the
ye
ar
en
de
d3
1M
arc
h2
00
6fo
r th
e y
ea
r e
nd
ed
31
Ma
rch
20
06
AN
NE
XU
RE
6 (co
nt.
)
INT
ER
GO
VE
RN
ME
NT
RE
CE
IVA
BL
ES

DoA Annual report 2005/06 153
Go
vern
men
t en
tity
Co
nfi
rmed
bal
ance
ou
tsta
nd
ing
Un
con
fi rm
ed b
alan
ce o
uts
tan
din
gT
ota
l
31/0
3/20
0631
/03/
2005
31/0
3/20
0631
/03/
2005
31/0
3/20
0631
/03/
2005
R’0
00R
’000
R’0
00R
’000
R’0
00R
’000
No
rth
ern
Cap
e P
rovi
nce
Dep
artm
ent o
f Agr
icul
ture
and
Lan
d R
efor
m–
–21
–21
–
Lim
po
po
Pro
vin
ce
Dep
artm
entR
oads
and
Tra
nspo
rtD
epar
tmen
t Hea
lth a
nd W
elfa
reD
epar
tmen
t of E
duca
tion
– – –
– – –
58 10 13
– – –
58 1 0 13
– – –
Wes
tern
Cap
e P
rovi
nce
Dep
artm
ent o
f Agr
icul
ture
Dep
artm
ent o
f Hea
lthD
epar
tmen
t of W
ater
Affa
irs a
nd F
ores
try
– – –
– – –
1 4 9
– – –
1 4 9
– – –
To
tal
3015
42
564
894
259
41
048
DE
PA
RT
ME
NT
OF
AG
RIC
UL
TU
RE
VO
TE
25
AN
NE
XU
RE
ST
OT
HE
AN
NU
AL
FIN
AN
CIA
LS
TA
TE
ME
NT
SA
NN
EX
UR
ES
TO
TH
E A
NN
UA
L F
INA
NC
IAL
ST
AT
EM
EN
TS
for
the
ye
ar
en
de
d3
1M
arc
h2
00
6fo
r th
e y
ea
r e
nd
ed
31
Ma
rch
20
06
AN
NE
XU
RE
6 (co
nt.
)
INT
ER
GO
VE
RN
ME
NT
RE
CE
IVA
BL
ES

Annual fi nancial statements154
DEPARTMENT OF AGRICULTURE
VOTE 25
ANNEXURES TO THE ANNUAL FINANCIAL STATEMENTSANNEXURES TO THE ANNUAL FINANCIAL STATEMENTS
for the year ended 31 March 2006for the year ended 31 March 2006
ANNEXURE 7
INTERGOVERNMENT PAYABLES — CURRENT
Government entity
Confi rmed balance outstanding
Unconfi rmed balanceoutstanding
Total
31/03/2006 31/03/2005 31/03/2006 31/03/2005 31/03/2006 31/03/2005
R’000 R’000 R’000 R’000 R’000 R’000
Departments
Current
National departments
South African Police ServiceDepartment of LabourSouth African National Defence ForceDepartment of Water Affairs and ForestryDepartment of JusticeDepartment of Correctional ServicesParliamentDepartment of Arts and CultureDepartment of Foreign AffairsSAMDISITA
––––––––––
380
256
4 9547
911–2––––
87–––
801 206
–130
2 09387
–
3 633––––
761–––––
87–––
801 206
–130
2 09387
380
3 6586
4 9547
911761
2––––
Provincial departments
Gauteng Province
Department of Public Transport, Roads andWorks
– – 1 047 – 1 047 –
Limpopo Province
Department of TransportDepartment of AgricultureMopani District Municipality
–––
–––
–––
4 053338687
–––
4 053338687
Mpumalanga Province
Department of Agriculture, Conservation and Environment – – – 109 – 109
Northern Cape Province
Department of Agriculture, Land ReformEnvironment and Conservation – – – 340 – 340
Western Cape Province
Department of Transport and Public Works – – 44 33 44 33
Free State Province
Provincial Treasury – – – 2 – 2
Eastern Cape Province
Department of Agriculture – – 18 228 – 18 228 –
Total 380 5 905 23 002 9 956 23 382 15 861

DoA Annual report 2005/06 155
AGRICULTURAL DEBT ACCOUNT
BALANCE SHEETBALANCE SHEET
as at 31 March 2006as at 31 March 2006
31 March2006
31 March2005
Notes R’000 R’000
ASSETS
Noncurrent assets 117 155 155 891
Long-term loans to farmers 2.1 117 155 155 891
Current assets 1 256 473 1 461 410
Short-term portion of long-term loans 2.2 93 590 161 703
Accounts receivable 3 136 384 194 198
Cash and cash equivalents 4 1 026 499 1 105 509
1 373 628 1 617 301
EQUITY AND LIABILITIES
Capital and reserves 987 731 1 616 987
Accumulated reserves 987 731 1 616 987
Current liabilities 385 897 314
Accounts payable 9 385 897 314
1 373 628 1 617 301

Annual fi nancial statements156
AGRICULTURAL DEBT ACCOUNT
INCOME STATEMENTINCOME STATEMENT
for the year ended 31 March 2006for the year ended 31 March 2006
Notes 31 March2006
31 March2005
R’000 R’000
INCOME
Revenue 5 22 743 12 844
Sundry income 378 71
Total income 23 121 12 915
EXPENDITURE
Administrative expenses 25 109
Bond protection 6 – 425
Irrecoverable amounts written off 59 611 34 843
Transfer 150 000 –
Provision for doubtful debts 57 000 5 000
Provision for transfer 7.2 385 741 –
Total expenditure 652 377 40 377
Retained (defi cit)/surplus for the year (629 256) (27 462)
Accumulated funds—beginning of the period 1 616 987 1 644 449
Accumulated funds—end of the period 987 731 1 616 987

DoA Annual report 2005/06 157
AGRICULTURAL DEBT ACCOUNT
STATEMENT OF CHANGES IN EQUITYSTATEMENT OF CHANGES IN EQUITY
for the year ended 31 March 2006for the year ended 31 March 2006
Accumulatedreserves
R’000
Balance at 1 April 2001 1 598 218
Retained surplus for the year 59 090
Balance at 1 April 2002 1 657 308
Retained (defi cit) for the period (35 366)
Balance at 18 March 2003 1 621 942
Retained surplus for the period 22 507
Balance at 31 March 2004 1 644 449
Retained (defi cit) for the year (27 462)
Balance at 31 March 2005 1 616 987
Retained (defi cit) for the year (629 256)
Balance at 31 March 2006 987 731

Annual fi nancial statements158
AGRICULTURAL DEBT ACCOUNT
CASH FLOW STATEMENTCASH FLOW STATEMENT
for the year ended 31 March 2006for the year ended 31 March 2006
Notes 31 March2006
31 March2005
R’000 R’000
Cash fl ows from operating activities
Cash generated by operating activities 8.1 (80 758) 74 267
Interest received 1 748 2 443
Net cash from operating activities (79 010) 76 710
Cash fl ows from fi nancing activities
Increase/(decrease) in cash and cash equivalents (79 010) 76 710
Cash and cash equivalents at the beginning of the period 8.2 1 105 509 1 028 799
Cash and cash equivalents at the end of the period 8.2 1 026 499 1 105 509

DoA Annual report 2005/06 159
AGRICULTURAL DEBT ACCOUNT
NOTES TO THE ANNUAL FINANCIAL STATEMENTSNOTES TO THE ANNUAL FINANCIAL STATEMENTS
for the year ended 31 March 2006for the year ended 31 March 2006
1. Accounting policies
The Department received approval from the National Treasury for the non-compliance to Generally Accepted Accounting Practices (GAAP) in respect of the Agricultural Debt Account for the 2004/05 fi nancial year. During the 2005/06 fi nancial year the Department embarked on a process to enhance the Debtor System to be able to comply with the GAAP requirements. Unfortunately, the amendments took longer than anticipated and the National Treasury was again approached in October 2005 for deviation as the enhancements would not be fi nalised in time for the Department to comply with the GAAP standards for the 2005/06 fi nancial year.
The National Treasury also indicated that the Agricultural Debt Account had been classifi ed as a trading entity and as such has to comply with GAAP (however, no formal correspondence in this regard was received). It should be noted that in accordance with section 6(3) of the Agricultural Debt Management Act, 2001 (Act No. 45 of 2001) that the statements of the account should be compiled in accordance with Generally Recognised Accounting Practices. The National Treasury was informed that the Department does not agree with this view-point. Financial Statements were nevertheless prepared in terms of GAAP.
The Department is, however, of the opinion that, in view of the nature of the Account, namely to manage the recovery of the outstanding debt, there is no benefi t in the application of these standards.
The Financial Statements are prepared on the historical cost basis. These Financial Statements are prepared in accordance with Generally Accepted Accounting Practices, except where stated otherwise. The following are the principal accounting policies used by the Agricultural Debt Account, which are consistent with those of the previous period.
1.1 Income recognition
Income is recognised on a time proportion basis.
1.2 Provision for doubtful debt
The basis for the calculation of the provision for doubtful debts for the previous and the current periods was determined, using an estimate of future write-offs, taking into account the statistical information of prior years.
1.3 Loans
Repayments and interest on loans are made and levied as per individual agreement. Various interest rates are applicable. Loans to farmers are indicated in the Financial Statements at an estimated realisable value after taking the provision for doubtful debts into account.
1.4 Interest on loans written off
The Debtors System does not distinguish between accounts identifi ed to be written off and as a result continues to accrue for interest up to the date that the debt is written off.
1.5 Bond protection
Costs relating to the purchase of immovable properties are expensed in terms of section 8(1)(d) of the Agricultural Debt Management Act, 2001 (Act No. 45 of 2001) (ADMA) and the property is transferred to the Directorate Farmer Settlement from the Agricultural Debt Account (ADA).
1.6 Financial instruments
Financial instruments carried on the balance sheet include cash and cash equivalents, loans, receivables and payables.

Annual fi nancial statements160
Cash and cash equivalents, receivables and payables are generally carried at their estimated fair value, which is the amount for which an asset could be exchanged, or liability settled.
The ADA is mandated by the ADMA to collect all outstanding debts or write them off if it is not economical to collect. These loans are carried at amortised cost using the interest rates as per the individual agree-ments. The ADA is therefore exposed to the following risks:
• Interest rate risk, which is the risk that the value of a fi nancial instrument will fl uctuate due to the change in market interest rate with respect to cash and cash equivalents.
• Credit risk, which is the risk that one party to a fi nancial instrument will fail to discharge an obligation and cause the other party to incur a fi nancial loss with respect to loans, receivables and payables.
Recognition and measurement
The balances of the related accounts have not been restated in terms of the effect of the disclosure on fi nancial instruments, but the effects are disclosed as follows:
• Provision for doubtful debt
When the provision for doubtful debt calculated in terms of paragraph 1.2 of the accounting policy is reviewed against the outstanding debt of the debtors who did not honour their contracts over the last 3 years (R54,051 million), the provision is overstated by R109,950 million.
• Credits on debt accounts
The Department pays over credit balances on debt accounts of which the debtor could not be traced or obtain banking details of, over to revenue as sundry income. The revenue is accordingly overstated by the amount of R378 000 and R71 000, respectively, for the 2005/06 and 2004/05 fi nancial years.
AGRICULTURAL DEBT ACCOUNT
NOTES TO THE ANNUAL FINANCIAL STATEMENTSNOTES TO THE ANNUAL FINANCIAL STATEMENTS
for the year ended 31 March 2006for the year ended 31 March 2006
31 March 2006
31 March 2005
R’000 R’000
2. Loans to farmers
2.1 Long-term loans to farmers 117 155 155 891
2.2 Short-term loans
Short-term portion of long-term loans 15 103 18 229
Capital payable 178 178 209 902
Less: Provision for capital portion of bad debts (99 691) (66 428)
93 590 161 703
3. Accounts receivable
Interest 200 255 234 533
Less: Provision for interest portion of bad debts (64 309) (40 572)
Rental debt 173 237
Receivables 265 –
136 384 194 198

DoA Annual report 2005/06 161
AGRICULTURAL DEBT ACCOUNT
NOTES TO THE ANNUAL FINANCIAL STATEMENTSNOTES TO THE ANNUAL FINANCIAL STATEMENTS
for the year ended 31 March 2006for the year ended 31 March 2006
31 March 2006
31 March 2005
R’000 R’000
4. Cash and cash equivalents
Corporation for Public Deposits Call Account 1 022 853 1 102 953
Current account balance 3 646 2 556
1 026 499 1 105 509
5. Revenue
Interest income 20 995 10 401
Interest received on positive bank balance 1 748 2 443
22 743 12 844
6. Bond protection
No immovable properties were purchased during the fi nancial year.
7. Short-term provisions
7.1 Provision for doubtful debts
Opening balance 107 000 102 000
Adjustment for the current period 57 000 5 000
Closing balance 164 000 107 000
7.2 Provision for transfer
Provision made during the year 385 741 –
Provision is made for the transfer of funds to the National RevenueFund for the implementation of Micro-agricultural Financial Insti tu-tions of South Africa (Mafi sa). This amount has been discounted at a rate of 10,5 % as per government borrowing rate, over one and two-year periods, respectively for the R200 million transfer in 2006/07 and R250 million transfer in 2007/08.

Annual fi nancial statements162
AGRICULTURAL DEBT ACCOUNT
NOTES TO THE ANNUAL FINANCIAL STATEMENTSNOTES TO THE ANNUAL FINANCIAL STATEMENTS
for the year ended 31 March 2006for the year ended 31 March 2006
31 March2006
31 March 2005
R’000 R’000
8.1 Reconciliation between retained surplus and cash generated byoperating activities:
Retained (defi cit)/surplus for the period (629 256) (27 462)
Adjustment for interest received (1 748) (2 443)
Provision for transfer 385 741 –
(245 263) (29 905)
Movements in working capital:
Decrease in loans and accounts receivable 164 663 104 427
Increase/(decrease) in accounts payable (158) (255)
(80 758) 74 267
8.2 Cash and cash equivalents
Cash and cash equivalents for the current period consists of balances held with a commercial bank and an on call investment at the Corporation for Public Deposits. Cash and cash equivalents included in the Cash Flow Statement comprise the following Balance Sheet amounts. 1 026 499 1 105 509
Cash and cash equivalents 1 026 499 1 105 509
9. Accounts payable
Creditor Current Account 156 314
Micro-agricultural Financial Insti tutions of South Africa (Mafi sa) 385 741 –
385 897 314

Human resources uman resources managementmanagement

Human resources management164
Human resources management
STATISTICSSTATISTICS
During the period under review the vacancy rate of the department decreased from 26,2 to 25,6 %, bearing in mind that some of the vacant posts were only funded in the 2005/06 financial year.
With regard to job evaluation, a total of 196 jobs were evaluated, including all Senior Management Service posts on the approved structure of the department.
As far as labour relations are concerned the department was able to resolve 17 grievances of employees. A total of 18 disciplinary hearings were finalised and four disputes were settled.
A total of 222 new staff member were employed during the period under review and 185 staff members were pro-moted to higher positions.
The percentage of employees with disabilities has increased from 0,23 to 0,40 %. The Employment Equity and Transformation Consultative Forum has taken initiatives to increase the number of employees with disabilities in order to reach the target of 2 %. These initiatives include the advice to the Directorate Supply Chain Management and Directorate Information Communication Technology, to upgrade the various buildings and workstations to ac-commodate the needs of people with disabilities. The Directorate Human Resources Management also made amendments to the application form, to encourage people with disabilities to apply for positions in the department.
The labour turnover in the department has decreased from 5,7 to 4,5 % with the lowest rate at Senior Management Service level.
The Employee Health and Wellness Team were able to visit 80 % of our remote offices on an HIV and Health Awareness Campaign, where more than 1 000 staff members participated in the voluntary health risk assessment appraisals during the year. Many staff members came back for appropriate treatment or advice on lifestyle changes.

DoA Annual report 2005/06 165
1. E
XP
EN
DIT
UR
E1
. E
XP
EN
DIT
UR
E
The
fol
low
ing
tabl
es s
umm
aris
e fin
al a
udite
d ex
pend
iture
by
prog
ram
me
(Tab
le 1
.1)
and
by s
alar
y ba
nds
(Tab
le 1
.2).
In
part
icul
ar,
it pr
ovid
es a
n in
dica
tion
of t
heam
ount
spe
nt o
n pe
rson
nel c
osts
in te
rms
of e
ach
of th
e pr
ogra
mm
es o
r sa
lary
ban
ds w
ithin
the
depa
rtm
ent.
TA
BL
E 1
.1
Per
son
nel
co
sts
by
pro
gra
mm
e
Pro
gra
mm
e
To
tal
exp
end
itu
re(R
’000
)
Per
son
nel
ex
pen
dit
ure
(R’0
00)
Tra
inin
g
exp
end
itu
re(R
’000
)
Pro
fess
ion
al
and
sp
ecia
lse
rvic
es(R
’000
)
Per
son
nel
co
st
(% o
f to
tal
exp
end
itu
re)
Ave
rag
e p
erso
nn
elco
st p
erem
plo
yee
(R’0
00)
Em
plo
y-m
ent
Adm
inis
trat
ion
Far
mer
Sup
port
and
Dev
elop
men
t
Agr
icul
tura
l Tra
de a
nd B
usin
ess
Dev
elop
men
t
Agr
icul
tura
l Res
earc
h an
d E
cono
mic
Ana
lysi
s
Agr
icul
tura
l Pro
duct
ion
Sus
tain
able
Res
ourc
es M
anag
emen
t and
Use
Nat
iona
l Agr
icul
tura
l Reg
ulat
ory
Ser
vice
s
Com
mun
icat
ion
and
Info
rmat
ion
Man
agem
ent
Pro
gram
me
Pla
nnin
g, M
onito
ring
and
Eva
luat
ion
To
tal
159
758
696
728
38 7
64
17 7
60
414
250
168
206
267
331
108
716
6 49
5
1 87
8 00
8
82 9
12
20 2
53
13 0
91
11 0
09
13 9
46
43 7
62
131
965
37 8
39
2 35
5
357
132
2 74
1
280
439
394
658
649
1 68
0
7 58
3 96
14 5
20
4 92
1
5 04
3
2 97
3
665
30 7
17
28 7
49
35 6
82
2 50
1
2 68
1
113
932
51,9 2,9
33,7
62,0 3,4
26,0
49,4
34,8
36,3
19,0
33 8 5 4 6 17 52 15 1
141
2 53
3
2 53
3
2 53
3
2 53
3
2 53
3
2 53
3
2 53
3
2 53
3
2 53
3
2 53
3
TA
BL
E 1
.2
Per
son
nel
co
sts
by
sala
ry b
and
Sal
ary
ban
ds
Per
son
nel
exp
end
itu
re
(R’0
00)
% o
f to
tal
per
son
nel
cost
s
Ave
rag
e p
erso
nn
el c
ost
per
em
plo
yee
(R’0
00)
To
tal
per
son
nel
exp
end
itu
re
Nu
mb
er o
f em
plo
yees
Low
er s
kille
d (L
evel
s 1–
2)
Ski
lled
(Lev
els
3–5)
Hig
hly
skill
ed p
rodu
ctio
n (L
evel
s 6–
8)
Hig
hly
skill
ed s
uper
visi
on (
Leve
ls 9
–12)
Sen
ior
man
agem
ent (
Leve
ls 1
3–16
)
Per
iodi
cal r
emun
erat
ion
Abn
orm
al a
ppoi
ntm
ent
To
tal
44 2
02
29 4
13
143
518
107
321
26 7
22
2 25
9
3 69
7
357
132
12,4 8,2
40,2
30,0 7,5
0,6
1,0
99 43 169
204
593 12 13
357
132
357
132
357
132
357
132
357
132
357
132
357
132
357
132
443
673
846
526 45 180
288
3 00
1

Human resources management166
The
follo
win
g ta
bles
pro
vide
a s
umm
ary
per
prog
ram
me
(Tab
le 1
.3)
and
sala
ry b
ands
(T
able
1.4
), o
f exp
endi
ture
incu
rred
as
a re
sult
of s
alar
ies,
ove
rtim
e, h
ome
owne
r’sal
low
ance
and
med
ical
ass
ista
nce.
In e
ach
case
, the
tabl
e pr
ovid
es a
n in
dica
tion
of th
e pe
rcen
tage
of t
he p
erso
nnel
bud
get t
hat w
as u
sed
for
thes
e ite
ms.
TA
BL
E 1
.3
Sal
arie
s, o
vert
ime,
ho
me
ow
ner
’s a
llow
ance
(H
OA
) an
d m
edic
al a
id b
y p
rog
ram
me
Pro
gra
mm
e
Sal
arie
s
(R’0
00)
Sal
arie
s as
%
of
per
son
nel
cost
Ove
rtim
e
(R’0
00)
Ove
rtim
e as
% o
fp
erso
nn
elco
st
HO
A
(R’0
00)
HO
A a
s%
of
per
son
nel
cost
Med
ical
ass.
(R’0
00)
Med
ical
ass.
as
% o
f p
erso
n-
nel
co
st
To
tal
per
son
nel
cost
(R’0
00)
Adm
inis
trat
ion
Far
mer
Sup
port
and
Dev
elop
men
tA
gric
ultu
ral T
rade
and
Bus
ines
s D
evel
opm
ent
Agr
icul
tura
l Res
earc
h an
d E
cono
mic
Ana
lysi
sA
gric
ultu
ral P
rodu
ctio
n S
usta
inab
le R
esou
rces
Man
agem
ent a
nd U
seN
atio
nal A
gric
ultu
ral R
egul
ator
y S
ervi
ces
Cam
paig
ns (
FM
D a
nd C
lass
ical
Sw
ine
feve
r)C
omm
unic
atio
n an
d In
form
atio
n M
anag
emen
tP
rogr
amm
e P
lann
ing,
Mon
itorin
g an
d E
valu
atio
n
To
tal
56 5
8514
526
9 53
87
785
10 0
3830
713
72 9
93 –22
402
1 67
2
226
252
68,2
71,7
72,9
70,7
72,0
70,2
55,3 –
59,2
71,0
63,4
781 – – – 6
162
3 09
926
121 44
4 –
30 6
13
0,90 – – –
0,04
7,20
22,1
010
0,00
1,20 –
8,60
1 12
324
610
510
820
545
81
126 –
405 56
3 83
2
1,4
1,2
0,8
0,9
1,5
1,0
0,9 –
1,1
2,4
1,1
8 20
880
757
240
157
92
266
4 52
6 –1
503 68
18 9
30
9,9
3,9
4,4
3,6
4,2
5,2
3,4 –
4,0
2,9
5,3
82 9
1220
253
13 0
9111
009
13 9
4643
762
105
844
26 1
2137
839
2 35
5
357
132
TA
BL
E 1
.4
Sal
arie
s, o
vert
ime,
ho
me
ow
ner
’s a
llow
ance
(H
OA
) an
d m
edic
al a
id b
y sa
lary
ban
d
Sal
ary
ban
ds
Sal
arie
s
(R’0
00)
Sal
arie
s as
%
of
per
son
nel
cost
Ove
rtim
e
(R’0
00)
Ove
rtim
e as
% o
fp
erso
nn
elco
st
HO
A
(R’0
00)
HO
A a
s%
of
per
son
nel
cost
Med
ical
ass.
(R’0
00)
Med
ical
ass.
as
% o
f p
erso
n-
nel
co
st
To
tal
per
son
nel
cost
(R’0
00)
Low
er s
kille
d (L
evel
s 1–
2)
Ski
lled
(Lev
els
3–5)
Hig
hly
skill
ed p
rodu
ctio
n (L
evel
s 6–
8)H
ighl
y sk
illed
sup
ervi
sion
(Le
vels
9–1
2)S
enio
r m
anag
emen
t (Le
vels
13–
16)
Per
iodi
cal r
emun
erat
ion
Abn
orm
al a
ppoi
ntm
ent
Abn
orm
al a
ppoi
ntm
ent 2
To
tal
30 2
4219
419
94 0
3568
729
13 8
27 – – –
226
252
68,4
49,3
65,5
64,0
51,7 – – –
63,4
480
500
2 14
81
364 – – –
26 1
21
30 6
13
1,1
1,7
1,5
1,3 – – – –
1,3
595
443
1 58
285
036
2 – – –
3 83
2
1,3
1,5
1,1
0,8
1,4 – – –
1,0
2 32
82
146
8 75
24
527
117
7 – – –
18 9
30
5,2
7,3
6 ,1
4,2
4,4 – – –
5,3
44 2
0229
413
143
518
107
321
26 7
222
259
3 69
7 –
357
132

DoA Annual report 2005/06 167
2. E
MP
LO
YM
EN
T A
ND
VA
CA
NC
IES
2.
EM
PL
OY
ME
NT
AN
D V
AC
AN
CIE
S
The
follo
win
g ta
bles
sum
mar
ise
the
num
ber
of p
osts
on
the
esta
blis
hmen
t, th
e nu
mbe
r of
em
ploy
ees,
the
vaca
ncy
rate
, and
whe
ther
ther
e ar
e an
y st
aff m
embe
rs w
hoar
e ad
ditio
nal t
o th
e es
tabl
ishm
ent.
Thi
s in
form
atio
n is
pre
sent
ed in
term
s of
thre
e ke
y va
riabl
es: p
rogr
amm
e (T
able
2.1
), s
alar
y ba
nd (
Tab
le 2
.2)
and
criti
cal o
ccup
atio
ns(T
able
2.3
). D
epar
tmen
ts h
ave
iden
tifie
d cr
itica
l occ
upat
ions
tha
t sh
ould
be
mon
itore
d. T
able
2.3
pro
vide
s es
tabl
ishm
ent
and
vaca
ncy
info
rmat
ion
for
the
key
criti
cal
occu
patio
ns o
f the
dep
artm
ent.
The
vac
ancy
rat
e re
flect
s th
e pe
rcen
tage
of p
osts
that
are
not
fille
d.
TA
BL
E 2
.1
Em
plo
ymen
t an
d v
acan
cies
by
pro
gra
mm
e at
en
d o
f p
erio
d
Pro
gra
mm
eN
um
ber
of
po
sts
Nu
mb
er o
f p
ost
s fi
lled
Vac
ancy
ra
te%
Nu
mb
er o
f p
ost
s fi
lled
ad
dit
ion
al t
o t
he
esta
blis
hm
ent
1: A
dmin
istr
atio
n, p
erm
anen
t2:
Far
mer
Sup
port
and
Dev
elop
men
t, pe
rman
ent
3: A
gric
ultu
ral T
rade
and
Bus
ines
s D
evel
opm
ent,
perm
anen
t4:
Eco
nom
ic R
esea
rch
and
Ana
lysi
s, p
erm
anen
t5:
Agr
icul
tura
l Pro
duct
ion,
per
man
ent
6: S
usta
inab
le R
esou
rces
Man
agem
ent a
nd U
se, p
erm
anen
t7:
Nat
iona
l Reg
ulat
ory
Ser
vice
s, p
erm
anen
t8:
Com
mun
icat
ion
and
Info
rmat
ion
Man
agem
ent,
perm
anen
t9:
Pro
gram
me
Pla
nnin
g, M
onito
ring
and
Eva
luat
ion
To
tal
682
159 87 84 197
584
1 21
437
6 16
3 39
9*
569
117 69 55 132
447
855
272 14
2 53
0**
16,6
26,4
20,7
34,5
33,0
23,5
29,6
27,7
12,5
25,6
3 4 0 0 1 0 0 1 1 10
* N
umbe
r of
pos
ts in
clud
ing
Min
iste
r**
Num
ber
of p
osts
doe
s no
t inc
lude
3 p
osts
at t
he D
epar
tmen
t of A
gric
ultu
re, L
impo
po P
rovi
nce
TA
BL
E 2
.2
Em
plo
ymen
t an
d v
acan
cies
by
sala
ry b
and
at
end
of
per
iod
Sal
ary
ban
dN
um
ber
of
po
sts
Nu
mb
er o
f p
ost
s fi
lled
Vac
ancy
ra
te%
Nu
mb
er o
f p
ost
s fi
lled
ad
dit
ion
al t
o t
he
esta
blis
hm
ent
Low
er s
kille
d (L
evel
s 1–
2), p
erm
anen
tS
kille
d (L
evel
s 3–
5), p
erm
anen
t H
ighl
y sk
illed
pro
duct
ion
(Lev
els
6–8)
, per
man
ent
Hig
hly
skill
ed s
uper
visi
on (
Leve
ls 9
–12)
, per
man
ent
Sen
ior
man
agem
ent (
Leve
ls 1
3–16
), p
erm
anen
t
To
tal
865
534
1 20
773
3 59
3 39
8*
753
368
886
479 43
2 52
9
12,9
31,0
26,6
34,7
27,1
25,6
0 5 5 0 0 10
* N
umbe
r of
pos
ts e
xclu
ding
Min
iste
r

Human resources management168
TA
BL
E 2
.3
Em
plo
ymen
t an
d v
acan
cies
by
crit
ical
occ
up
atio
n a
t en
d o
f p
erio
d
Cri
tica
l occ
up
atio
ns
Nu
mb
er o
f p
ost
sN
um
ber
of
po
sts
fille
dV
acan
cy
rate
%
Nu
mb
er o
f p
ost
s fi
lled
ad
dit
ion
al t
o
the
esta
blis
hm
ent
Adm
inis
trat
ive
rela
ted,
per
man
ent
Agr
icul
tura
l ani
mal
, oce
anog
raph
y, fo
rest
ry a
nd o
ther
sci
ence
, per
man
ent
Agr
icul
ture
rel
ated
, per
man
ent
Airc
raft
pilo
ts a
nd r
elat
ed a
ssoc
iate
pro
fess
iona
ls, p
erm
anen
tA
ll ar
tisan
s in
the
build
ing,
met
al, m
achi
nery
, etc
, per
man
ent
App
rais
ers—
valu
ers
and
rela
ted
prof
essi
onal
s, p
erm
anen
t A
rchi
vist
s, c
urat
ors
and
rela
ted
prof
essi
onal
s, p
erm
anen
t A
rtis
an p
roje
ct a
nd r
elat
ed s
uper
inte
nden
ts, p
erm
anen
tA
uxili
ary
and
rela
ted
wor
kers
, per
man
ent
Bio
chem
istr
y, p
harm
acol
ogy,
zoo
logy
and
life
sci
ence
tech
nici
ans,
per
man
ent
Bui
ldin
g an
d ot
her
prop
erty
car
etak
ers,
per
man
ent
Bus
and
hea
vy v
ehic
le d
river
s, p
erm
anen
tC
hem
ists
, per
man
ent
Civ
il en
gine
erin
g te
chni
cian
s, p
erm
anen
tC
lean
ers
in o
ffice
s, w
orks
hops
, etc
., pe
rman
ent
Clie
nt in
form
atio
n cl
erks
(sw
itchb
oard
, rec
eptio
n an
d in
form
atio
n cl
erks
), p
erm
anen
tC
omm
unic
atio
n an
d in
form
atio
n re
late
d, p
erm
anen
tC
ompu
ter
prog
ram
mer
s, p
erm
anen
t C
ompu
ter
syst
em d
esig
ners
and
ana
lyst
s, p
erm
anen
t C
usto
dian
per
sonn
el, p
erm
anen
tE
arth
-mov
ing
and
rela
ted
plan
t ope
rato
rs, p
erm
anen
tE
cono
mis
ts, p
erm
anen
t E
ngin
eerin
g sc
ienc
es r
elat
ed, p
erm
anen
tE
ngin
eers
and
rel
ated
pro
fess
iona
ls, p
erm
anen
t F
arm
hand
s an
d w
orke
rs, p
erm
anen
t F
arm
ing,
fore
stry
adv
isor
s an
d fa
rm m
anag
ers,
per
man
ent
Fin
ance
and
eco
nom
ics
rela
ted,
per
man
ent
Fin
anci
al a
nd r
elat
ed p
rofe
ssio
nals
, per
man
ent
Fin
anci
al c
lerk
s an
d cr
edit
cont
rolle
rs, p
erm
anen
t F
ood
serv
ices
aid
s an
d w
aite
rs, p
erm
anen
t G
ener
al le
gal a
dmin
istr
atio
n an
d re
late
d pr
ofes
sion
als,
per
man
ent
Hea
d of
dep
artm
ent/c
hief
exe
cutiv
e of
ficer
, per
man
ent
Hea
lth s
cien
ces
rela
ted,
per
man
ent
Hor
ticul
turis
ts, f
ores
ters
, agr
icul
tura
l and
fore
stry
tech
nici
ans,
per
man
ent
Hou
seho
ld a
nd la
undr
y w
orke
rs, p
erm
anen
t H
uman
res
ourc
es a
nd o
rgan
isat
iona
l dev
elop
men
t and
rel
ated
pro
fess
iona
ls, p
erm
anen
tH
uman
res
ourc
es c
lerk
s, p
erm
anen
tH
uman
res
ourc
es r
elat
ed, p
erm
anen
t
139
134
341 1
101 19 2 2 82 30 31 7 3 1
107 8 9 1 9 1 1 30 3 23 234 5 78 27 95 25 1 1 3
159 21 24 47 13
89 95 180 1 50 10 1 0 71 22 27 5 3 0 93 7 7 1 4 1 0 18 2 17 198 4 49 20 80 23 1 1 1
120 19 16 42 11
36,0
29,1
47,2 0,0
50,5
47,4
50,0
100,
013
,426
,712
,928
,6 0,0
100,
013
,112
,522
,2 0,0
55,6 0,0
100,
040
,033
,326
,115
,420
,037
,225
,915
,8 8,0
0,0
0,0
66,7
24,5 9,5
33,3
10,6
15,4
1 0 0 0 0 0 0 0 0 0 0 0 0 0 0 0 0 0 0 0 0 0 0 0 0 0 0 0 0 0 0 0 0 0 0 0 3 0
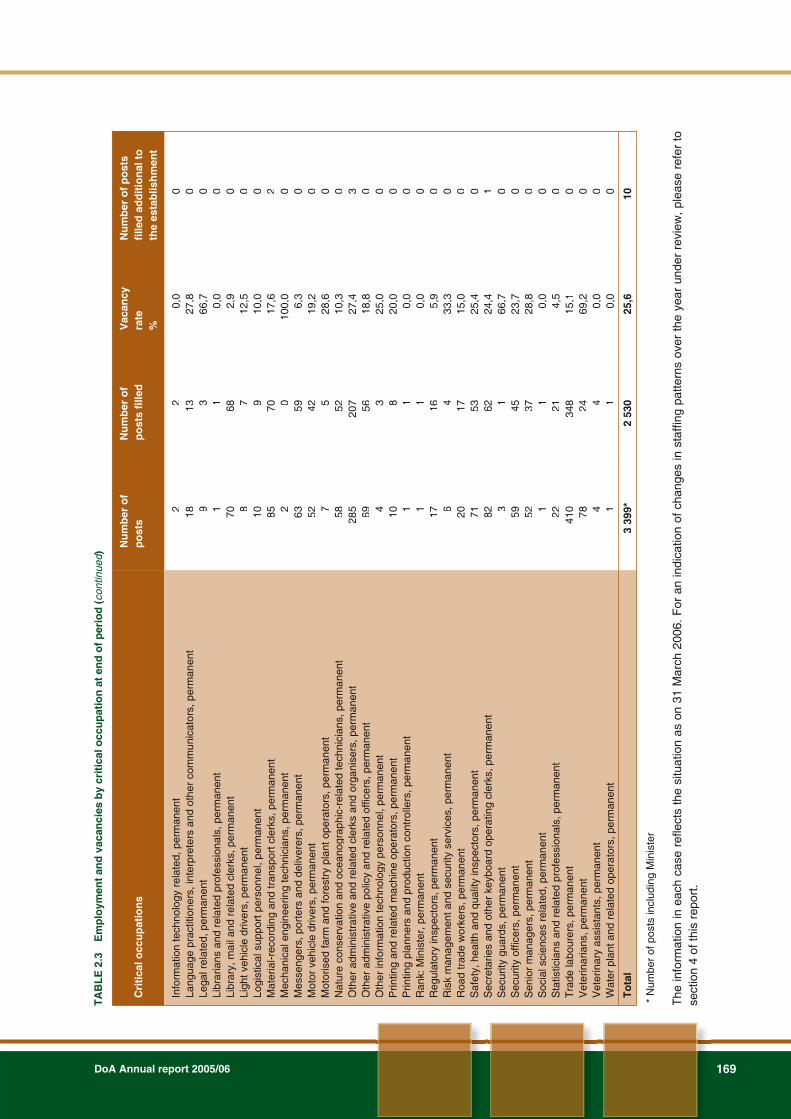
DoA Annual report 2005/06 169
Cri
tica
l occ
up
atio
ns
Nu
mb
er o
f p
ost
sN
um
ber
of
po
sts
fille
dV
acan
cy
rate
%
Nu
mb
er o
f p
ost
s fi
lled
ad
dit
ion
al t
o
the
esta
blis
hm
ent
Info
rmat
ion
tech
nolo
gy r
elat
ed, p
erm
anen
t La
ngua
ge p
ract
ition
ers,
inte
rpre
ters
and
oth
er c
omm
unic
ator
s, p
erm
anen
tLe
gal r
elat
ed, p
erm
anen
tLi
brar
ians
and
rel
ated
pro
fess
iona
ls, p
erm
anen
tLi
brar
y, m
ail a
nd r
elat
ed c
lerk
s, p
erm
anen
tLi
ght v
ehic
le d
river
s, p
erm
anen
tLo
gist
ical
sup
port
per
sonn
el, p
erm
anen
tM
ater
ial-r
ecor
ding
and
tran
spor
t cle
rks,
per
man
ent
Mec
hani
cal e
ngin
eerin
g te
chni
cian
s, p
erm
anen
t M
esse
nger
s, p
orte
rs a
nd d
eliv
erer
s, p
erm
anen
t M
otor
veh
icle
driv
ers,
per
man
ent
Mot
oris
ed fa
rm a
nd fo
rest
ry p
lant
ope
rato
rs, p
erm
anen
tN
atur
e co
nser
vatio
n an
d oc
eano
grap
hic-
rela
ted
tech
nici
ans,
per
man
ent
Oth
er a
dmin
istr
ativ
e an
d re
late
d cl
erks
and
org
anis
ers,
per
man
ent
Oth
er a
dmin
istr
ativ
e po
licy
and
rela
ted
offic
ers,
per
man
ent
Oth
er in
form
atio
n te
chno
logy
per
sonn
el, p
erm
anen
tP
rintin
g an
d re
late
d m
achi
ne o
pera
tors
, per
man
ent
Prin
ting
plan
ners
and
pro
duct
ion
cont
rolle
rs, p
erm
anen
t R
ank:
Min
iste
r, p
erm
anen
tR
egul
ator
y in
spec
tors
, per
man
ent
Ris
k m
anag
emen
t and
sec
urity
ser
vice
s, p
erm
anen
t R
oad
trad
e w
orke
rs, p
erm
anen
tS
afet
y, h
ealth
and
qua
lity
insp
ecto
rs, p
erm
anen
tS
ecre
tarie
s an
d ot
her
keyb
oard
ope
ratin
g cl
erks
, per
man
ent
Sec
urity
gua
rds,
per
man
ent
Sec
urity
offi
cers
, per
man
ent
Sen
ior
man
ager
s, p
erm
anen
t S
ocia
l sci
ence
s re
late
d, p
erm
anen
t S
tatis
ticia
ns a
nd r
elat
ed p
rofe
ssio
nals
, per
man
ent
Tra
de la
bour
ers,
per
man
ent
Vet
erin
aria
ns, p
erm
anen
tV
eter
inar
y as
sist
ants
, per
man
ent
Wat
er p
lant
and
rel
ated
ope
rato
rs, p
erm
anen
t
To
tal
2 18 9 1 7 0 8 10 85 2 63 52 7 58 285 69 4 10 1 1 17 6 20 71 82 3 59 52 1 22 410 78 4 1
3 39
9*
2 13 3 1 68 7 9 70 0 59 42 5 52 207 56 3 8 1 1 16 4 17 53 62 1 45 37 1 21 348 24 4 1
2 53
0
0,0
27,8
66,7 0,0
2,9
12,5
10,0
17,6
100,
06,
319
,228
,610
,327
,418
,825
,020
,0 0,0
0,0
5,9
33,3
15,0
25,4
24,4
66,7
23,7
28,8 0,0
4,5
15,1
69,2 0,0
0,0
25,6
0 0 0 0 0 0 0 2 0 0 0 0 0 3 0 0 0 0 0 0 0 0 0 1 0 0 0 0 0 0 0 0 0 10
* N
umbe
r of
pos
ts in
clud
ing
Min
iste
r
The
info
rmat
ion
in e
ach
case
ref
lect
s th
e si
tuat
ion
as o
n 31
Mar
ch 2
006.
For
an
indi
catio
n of
cha
nges
in s
taffi
ng p
atte
rns
over
the
yea
r un
der
revi
ew,
plea
se r
efer
to
sect
ion
4 o f
this
rep
ort.
TA
BL
E 2
.3
Em
plo
ymen
t an
d v
acan
cies
by
crit
ical
occ
up
atio
n a
t en
d o
f p
erio
d (
cont
inue
d)

Human resources management170
3. J
OB
EV
AL
UA
TIO
N3
. J
OB
EV
AL
UA
TIO
N
The
Pub
lic S
ervi
ce R
egul
atio
ns, 1
999
intr
oduc
ed jo
b ev
alua
tion
as a
way
of e
nsur
ing
that
wor
k of
equ
al v
alue
is r
emun
erat
ed e
qual
ly. W
ithin
a n
atio
nally
det
erm
ined
fram
ewor
k, e
xecu
tive
auth
oriti
es m
ay e
valu
ate
or r
e-ev
alua
te a
ny jo
b in
his
or
her
orga
nisa
tion.
In te
rms
of th
e R
egul
atio
ns a
ll va
canc
ies
on s
alar
y le
vels
9 a
nd h
ighe
rm
ust
be e
valu
ated
bef
ore
they
are
fill
ed.
Thi
s w
as c
ompl
emen
ted
by a
dec
isio
n by
the
Min
iste
r fo
r th
e P
ublic
Ser
vice
and
Adm
inis
trat
ion
that
all
SM
S jo
bs m
ust
beev
alua
ted
befo
re 3
1 D
ecem
ber
2002
.
The
fol
low
ing
tabl
e (T
able
3.1
) su
mm
aris
es t
he n
umbe
r of
jobs
tha
t w
ere
eval
uate
d du
ring
the
year
und
er r
evie
w.
The
tab
le a
lso
prov
ides
sta
tistic
s on
the
num
ber
ofpo
sts
that
wer
e up
grad
ed o
r do
wng
rade
d.
TA
BL
E 3
.1
Job
eva
luat
ion
Sal
ary
ban
d
Nu
mb
er
of
po
sts
Nu
mb
er o
f jo
bs
eval
uat
ed
% o
f p
ost
s ev
alu
ated
Nu
mb
er
of
po
sts
up
gra
ded
% o
f u
pg
rad
edp
ost
sev
alu
ated
Nu
mb
er o
fp
ost
sd
ow
ng
rad
ed
% o
fd
ow
ng
rad
edp
ost
sev
alu
ated
Low
er s
kille
d (L
evel
s 1–
2)
Ski
lled
(Lev
els
3–5)
Hig
hly
skill
ed p
rodu
ctio
n (L
evel
s 6–
8)
Hig
hly
skill
ed s
uper
visi
on (
Leve
ls 9
–12)
Sen
ior
Man
agem
ent S
ervi
ce B
and
A
Sen
ior
Man
agem
ent S
ervi
ce B
and
B
Sen
ior
Man
agem
ent S
ervi
ce B
and
C
Sen
ior
Man
agem
ent S
ervi
ce B
and
D
To
tal
865
534
1 20
7
733 41 12 5 1
3 39
8*
8 15 107 61 – 3 2 –
196
0,92
2,81
8,86
8,32 –
0,25
0,40 –
5,77
2 4 15 15 – – – – 36
0,23
0,75
1,24
2,05 – – – –
1,06
– – 13 12 – – – – 25
– –
1,08
1,64 – – – –
0,74
* N
umbe
r of
pos
ts e
xclu
ding
Min
iste
r
The
follo
win
g ta
ble
prov
ides
a s
umm
ary
of th
e nu
mbe
r of e
mpl
oyee
s w
hose
sal
ary
posi
tions
wer
e up
grad
ed o
win
g to
thei
r pos
ts b
eing
upg
rade
d. T
he n
umbe
r of e
mpl
oyee
s m
ight
diff
er fr
omth
e nu
mbe
r of
pos
ts u
pgra
ded
beca
use
not a
ll em
ploy
ees
are
auto
mat
ical
ly a
bsor
bed
into
the
new
pos
ts a
nd s
ome
of th
e po
sts
upgr
aded
cou
ld a
lso
be v
acan
t.
TA
BL
E 3
.2
Pro
file
of
emp
loye
es w
ho
se p
osi
tio
ns
wer
e u
pg
rad
ed o
win
g t
o t
hei
r p
ost
s b
ein
g u
pg
rad
ed
Ben
efic
iari
esA
fric
anA
sian
Co
lou
red
Wh
ite
To
tal
Fem
ale
222
821
53
Mal
e 34
24
3676
To
tal
564
1257
129
Em
ploy
ees
with
dis
abili
ties
0

DoA Annual report 2005/06 171
The
follo
win
g ta
ble
sum
mar
ises
the
num
ber
of c
ases
whe
re r
emun
erat
ion
leve
ls e
xcee
ded
the
grad
e de
term
ined
by
job
eval
uatio
n.
TA
BL
E 3
.3
Em
plo
yees
wh
ose
sal
ary
leve
l exc
eed
th
e g
rad
e d
eter
min
ed b
y jo
b e
valu
atio
n (
i.t.o
. PS
R 1
.V.C
.3)
Occ
up
atio
nN
um
ber
of
emp
loye
esJo
b e
valu
atio
n
leve
lR
emu
ner
atio
n
leve
lR
easo
n f
or
dev
iati
on
No
. of
emp
loye
es
in d
ept
Adm
inis
trat
ive
rela
ted
Fin
ance
and
eco
nom
ics
rela
ted
To
tal
Per
cent
age
of to
tal e
mpl
oym
ent
2 1 3 0,1
9 910 11
2 53
0
Tab
le 3
.4 is
a s
umm
ary
of th
e nu
mbe
r of
ben
efic
iarie
s of
the
abov
e in
term
s of
rac
e, g
ende
r an
d di
sabi
lity.
TA
BL
E 3
.4
Pro
file
of
emp
loye
es w
ho
se s
alar
y le
vel e
xcee
ded
th
e g
rad
e d
eter
min
ed b
y jo
b e
valu
atio
n (
i.t.o
. PS
R 1
.V.C
.3)
Ben
efic
iari
esA
fric
anA
sian
Co
lou
red
Wh
ite
To
tal
Mal
e T
ota
l E
mpl
oyee
s w
ith d
isab
ilitie
s
1 10 0
0 02 2
3 3 0
4. E
MP
LO
YM
EN
T C
HA
NG
ES
4.
EM
PL
OY
ME
NT
CH
AN
GE
S
Thi
s se
ctio
n pr
ovid
es in
form
atio
n on
cha
nges
in e
mpl
oym
ent o
ver
the
finan
cial
yea
r.
Tur
nove
r ra
tes
prov
ide
an in
dica
tion
of t
rend
s in
the
em
ploy
men
t pr
ofile
of
the
depa
rtm
ent.
The
fol
low
ing
tabl
es p
rovi
de a
sum
mar
y of
tur
nove
r ra
tes
by s
alar
y ba
nd(T
able
4.1
) an
d by
crit
ical
occ
upat
ions
(T
able
4.2
).
TA
BL
E 4
.1 A
nn
ual
tu
rno
ver
rate
s b
y sa
lary
ban
d
Sal
ary
ban
dE
mp
loym
ent
at b
egin
nin
g
of
per
iod
Ap
po
intm
ents
Ter
min
atio
ns
Tu
rno
ver
rate
Low
er s
kille
d (L
evel
s 1–
2)
Ski
lled
(Lev
els
3–5)
Hig
hly
skill
ed p
rodu
ctio
n (L
evel
s 6–
8)
Hig
hly
skill
ed s
uper
visi
on (
Leve
ls 9
–12)
Sen
ior
Man
agem
ent S
ervi
ce B
and
A
Sen
ior
Man
agem
ent S
ervi
ce B
and
B
Sen
ior
Man
agem
ent S
ervi
ce B
and
C
Sen
ior
Man
agem
ent S
ervi
ce B
and
D
To
tal
765
381
1 01
027
5 36 4 3 0
2 47
4
49 31 114 25 2 0 1 0
222
33 17 49 10 1 1 0 0
111
4,3
4,5
4,9
3,6
2,8
25,0 0,0
0,0
4,5

Human resources management172
TA
BL
E 4
.2
An
nu
al t
urn
ove
r ra
tes
by
crit
ical
occ
up
atio
n
Occ
up
atio
nE
mp
loym
ent
at
beg
inn
ing
o
f p
erio
d
Ap
po
intm
ents
Ter
min
atio
ns
Tu
rno
ver
rate
Adm
inis
trat
ive
rela
ted,
per
man
ent
Agr
icul
tura
l ani
mal
, oce
anog
raph
y, fo
rest
ry a
nd o
ther
sci
ence
s, p
erm
anen
tA
gric
ultu
re r
elat
ed, p
erm
anen
tA
ircra
ft pi
lots
and
rel
ated
ass
ocia
te p
rofe
ssio
nals
, per
man
ent
All
artis
ans
in b
uild
ing,
met
al, m
achi
nery
, etc
., pe
rman
ent
App
rais
ers,
val
uers
and
rel
ated
pro
fess
iona
ls, p
erm
anen
tA
rchi
vist
s, c
urat
ors
and
rela
ted
prof
essi
onal
s, p
erm
anen
t A
rtis
an, p
roje
ct a
nd r
elat
ed s
uper
inte
nden
ts, p
erm
anen
tA
uxili
ary
and
rela
ted
wor
kers
, per
man
ent
Bio
chem
istr
y, p
harm
acol
ogy,
zoo
logy
and
life
sci
ence
, tec
hnic
ians
, per
man
ent
Bui
ldin
g an
d ot
her
prop
erty
car
etak
ers,
per
man
ent
Bus
and
hea
vy v
ehic
le d
river
s, p
erm
anen
tC
hem
ists
, per
man
ent
Civ
il en
gine
erin
g te
chni
cian
s, p
erm
anen
tC
lean
ers
in o
ffice
s, w
orks
hops
, etc
., pe
rman
ent
Clie
nt in
form
atio
n cl
erks
(sw
itchb
oard
, rec
eptio
n an
d in
form
atio
n cl
erks
), p
erm
anen
tC
omm
unic
atio
n an
d in
form
atio
n re
late
d, p
erm
anen
tC
ompu
ter
prog
ram
mer
s, p
erm
anen
t C
ompu
ter
syst
em d
esig
ners
and
ana
lyst
s, p
erm
anen
t C
usto
dian
per
sonn
el, p
erm
anen
tD
iplo
mat
s, p
erm
anen
t E
arth
-mov
ing
and
rela
ted
plan
t ope
rato
rs, p
erm
anen
tE
cono
mis
ts, p
erm
anen
t E
ngin
eerin
g sc
ienc
es r
elat
ed, p
erm
anen
tE
ngin
eers
and
rel
ated
pro
fess
iona
ls, p
erm
anen
t F
arm
hand
s an
d w
orke
rs, p
erm
anen
t F
arm
ing,
fore
stry
adv
isor
s an
d fa
rm m
anag
ers,
per
man
ent
Fin
ance
and
eco
nom
ics
rela
ted,
per
man
ent
Fin
anci
al a
nd r
elat
ed p
rofe
ssio
nals
, per
man
ent
Fin
anci
al c
lerk
s an
d cr
edit
cont
rolle
rs, p
erm
anen
t F
ood
serv
ices
aid
s an
d w
aite
rs, p
erm
anen
t G
ener
al, l
egal
, adm
inis
trat
ion
and
rela
ted
prof
essi
onal
s, p
erm
anen
t H
ead
of d
epar
tmen
t/chi
ef e
xecu
tive
offic
er, p
erm
anen
t H
ortic
ultu
rists
, for
este
rs, a
gric
ultu
ral a
nd fo
rest
ry te
chni
cian
s, p
erm
anen
tH
ouse
hold
and
laun
dry
wor
kers
, per
man
ent
Hum
an r
esou
rces
and
org
anis
atio
nal d
evel
opm
ent a
nd r
elat
ed p
rofe
ssio
nals
, per
man
ent
Hum
an r
esou
rces
cle
rks,
per
man
ent
Hum
an r
esou
rces
rel
ated
, per
man
ent
71 99 131 1 53 7 2 0 69 23 27 5 3 0 96 8 6 1 1 0 0 0 14 1 18 197 4 36 17 83 22 1 0
118 19 19 41 10
12 8 43 0 1 0 0 0 4 2 2 0 0 0 2 0 1 0 1 0 0 0 12 0 5 7 0 9 0 10 3 0 0 8 3 1 3 0
2 2 3 0 4 0 1 0 2 5 0 0 0 0 2 0 1 0 0 0 0 1 3 0 2 4 0 0 0 3 1 0 0 2 1 3 1 0
2,8
2,0
2,3
0,0
7,5
0,0
50,0 0,0
2,9
21,7 0,0
0,0
0,0
0,0
2,1
0,0
16,7 0,0
0,0
0,0
0,0
0,0
21,4 0,0
11,1 2,0
0,0
0,0
0,0
3,6
4,5
0,0
0,0
1,7
5 ,3
15,8 2,4
0 ,0

DoA Annual report 2005/06 173
Occ
up
atio
nE
mp
loym
ent
at
beg
inn
ing
o
f p
erio
d
Ap
po
intm
ents
Ter
min
atio
ns
Tu
rno
ver
rate
Info
rmat
ion
tech
nolo
gy r
elat
ed, p
erm
anen
t La
ngua
ge p
ract
ition
ers,
inte
rpre
ters
and
oth
er c
omm
unic
ator
s, p
erm
anen
tLe
gal r
elat
ed, p
erm
anen
tLi
brar
ians
and
rel
ated
pro
fess
iona
ls, p
erm
anen
tLi
brar
y, m
ail a
nd r
elat
ed c
lerk
s, p
erm
anen
tLi
ght v
ehic
le d
river
s, p
erm
anen
tLo
gist
ical
sup
port
per
sonn
el, p
erm
anen
tM
ater
ial-r
ecor
ding
and
tran
spor
t cle
rks,
per
man
ent
Mec
hani
cal e
ngin
eerin
g te
chni
cian
s, p
erm
anen
t M
esse
nger
s, p
orte
rs a
nd d
eliv
erer
s, p
erm
anen
t M
otor
veh
icle
driv
ers,
per
man
ent
Mot
oris
ed fa
rm a
nd fo
rest
ry p
lant
ope
rato
rs, p
erm
anen
tN
atur
e co
nser
vatio
n an
d oc
eano
grap
hy r
elat
ed te
chni
cian
s, p
erm
anen
tO
ther
adm
inis
trat
ive
and
rela
ted
cler
ks a
nd o
rgan
iser
s, p
erm
anen
tO
ther
adm
inis
trat
ive
polic
y an
d re
late
d of
ficer
s, p
erm
anen
t O
ther
info
rmat
ion
tech
nolo
gy p
erso
nnel
, per
man
ent
Prin
ting
and
rela
ted
mac
hine
ope
rato
rs, p
erm
anen
tP
rintin
g pl
anne
rs a
nd p
rodu
ctio
n co
ntro
llers
, per
man
ent
Ran
k: M
inis
ter
Ran
k: D
eput
y M
inis
ter
Reg
ulat
ory
insp
ecto
rs, p
erm
anen
tR
isk
man
agem
ent a
nd s
ecur
ity s
ervi
ces,
per
man
ent
Roa
d tr
ade
wor
kers
, per
man
ent
Saf
ety,
hea
lth a
nd q
ualit
y in
spec
tors
, per
man
ent
Sec
reta
ries
and
othe
r ke
yboa
rd o
pera
ting
cler
ks, p
erm
anen
t S
ecur
ity g
uard
s, p
erm
anen
tS
ecur
ity o
ffice
rs, p
erm
anen
t S
enio
r m
anag
ers,
per
man
ent
Sta
tistic
ians
and
rel
ated
pro
fess
iona
ls, p
erm
anen
t S
ocia
l sci
ence
s re
late
d, p
erm
anen
t T
rade
wor
kers
, per
man
ent
Vet
erin
aria
ns, p
erm
anen
tV
eter
inar
y as
sist
ants
, per
man
ent
Wat
er p
lant
and
rel
ated
ope
rato
rs, p
erm
anen
t
To
tal
1 13 4 1 67 7 8 78 1 62 46 6 51 215 58 7 9 1 1 1 16 4 19 58 46 1 48 40 19 1
357 22 4 1
2 47
6
1 5 0 0 2 0 0 1 0 3 0 0 6 21 1 0 3 0 0 0 2 0 0 4 5 0 2 3 2 0 21 2 1 0
222
0 1 1 0 0 0 1 4 1 1 4 1 2 10 4 1 2 0 0 0 1 0 2 4 1 0 3 2 0 0 22 0 0 0
111
0,0
7,7
25,0 0,0
0,0
0,0
12,5 5,1
100,
01,
68,
716
,7 3,9
4,7
6,9
14,3
22,2 0,0
0,0
0,0
6,3
0,0
10,5 6,9
2,2
0,0
6,3
5,0
0,0
0,0
6,2
0,0
0,0
0,0
4,5
TA
BL
E 4
.2
An
nu
al t
urn
ove
r ra
tes
by
crit
ical
occ
up
atio
n (
cont
inue
d)

Human resources management174
Tab
le 4
.3 id
entif
ies
the
maj
or r
easo
ns w
hy s
taff
mem
bers
are
leav
ing
the
depa
rtm
ent.
TA
BL
E 4
.3
Rea
son
s w
hy
staf
f m
emb
ers
are
leav
ing
th
e d
epar
tmen
t
Ter
min
atio
n t
ype
Nu
mb
erP
erce
nta
ge
of
tota
l res
ign
atio
ns
Per
cen
tag
e o
f to
tal e
mp
loym
ent
To
tal
To
tal
emp
loym
ent
Dea
th, P
erm
anen
tR
esig
natio
n, P
erm
anen
t D
ism
issa
l-ope
ratio
nal c
hang
es, P
erm
anen
t D
isch
arge
d ow
ing
to il
l hea
lth, P
erm
anen
tD
ism
issa
l-mis
cond
uct,
Per
man
ent
Ret
irem
ent,
Per
man
ent
Tra
nsfe
rsE
xpiry
of c
ontr
act
To
tal
27 44 2 6 0 31 1 0
111
24,3
39,6 1,8
5,4
0,0
27,9 0,9
0,0
100,
0
1,1
1,7
0,1
0,2
0,0
1,2
0,0
0,0
4,4
111
111
111
111 0
111
111 0
111
2 53
02
530
2 53
02
530 0
2 53
02
530 0
2 53
0
Res
ign
atio
ns
as %
of
emp
loym
ent
1,7
TA
BL
E 4
.4
Pro
mo
tio
ns
by
crit
ical
occ
up
atio
n
Occ
up
atio
n
Em
plo
ymen
t at
beg
inn
ing
of
per
iod
Pro
mo
tio
ns
to a
no
ther
sa
lary
leve
l
Sal
ary
leve
l p
rom
oti
on
s as
a %
of
emp
loym
ent
Pro
gre
s-si
on
s to
an
oth
ern
otc
h w
ith
in
sala
ry le
vel
No
tch
pro
-g
resi
on
as
a %
of
emp
loym
ent
Adm
inis
trat
ive
rela
ted
Agr
icul
tura
l ani
mal
, oce
anog
raph
y, fo
rest
ry a
nd o
ther
sci
ence
sA
gric
ultu
re r
elat
ed
Airc
raft
pilo
ts a
nd r
elat
ed a
ssoc
iate
pro
fess
iona
ls
All
artis
ans
in b
uild
ing,
met
al, m
achi
nery
, etc
. A
ppra
iser
s, v
alue
rs a
nd r
elat
ed p
rofe
ssio
nals
A
rchi
vist
s, c
urat
ors
and
rela
ted
prof
essi
onal
sA
rtis
an p
roje
ct a
nd r
elat
ed s
uper
inte
nden
tsA
uxili
ary
and
rela
ted
wor
kers
B
ioch
emis
try,
pha
rmac
olog
y, z
oolo
gy a
nd li
fe s
cien
ce te
chni
cian
sB
uild
ing
and
othe
r pr
oper
ty c
aret
aker
s B
us a
nd h
eavy
veh
icle
driv
ers
Che
mis
ts
71 99 131 1 53 7 2 – 69 23 27 5 3
8 5 22 – – 1 – – 1 4 – – –
11,3 5 ,1
16,8 – –
14,3 – –
1,4
17,4 – – –
30 51 69 – 48 5 – – 50 27 21 5 1
42,3
51,5
52,7 –
906
71,4 – –
72,5
117,
477
,810
033
,3

DoA Annual report 2005/06 175
Occ
up
atio
n
Em
plo
ymen
t at
beg
inn
ing
of
per
iod
Pro
mo
tio
ns
to a
no
ther
sa
lary
leve
l
Sal
ary
leve
l p
rom
oti
on
s as
a %
of
emp
loym
ent
Pro
gre
s-si
on
s to
an
oth
ern
otc
h w
ith
in
sala
ry le
vel
No
tch
pro
-g
resi
on
as
a %
of
emp
loym
ent
Civ
il en
gine
erin
g te
chni
cian
s C
lean
ers
in o
ffice
s, w
orks
hops
, hos
pita
ls, e
tc.
Clie
nt in
form
atio
n cl
erks
(sw
itchb
oard
, rec
eptio
n an
d in
form
atio
n cl
erks
)C
omm
unic
atio
n an
d in
form
atio
n re
late
d C
omm
unity
dev
elop
men
t wor
kers
Com
pute
r pr
ogra
mm
ers
Com
pute
r sy
stem
des
igne
rs a
nd a
naly
sts
Cus
todi
an p
erso
nnel
Ear
th-m
ovin
g an
d re
late
d pl
ant o
pera
tors
E
cono
mis
tsE
ngin
eerin
g sc
ienc
es r
elat
ed
Eng
inee
rs a
nd r
elat
ed p
rofe
ssio
nals
Far
mha
nds
and
wor
kers
Far
min
g, fo
rest
ry a
dvis
ors
and
farm
man
ager
s F
inan
ce a
nd e
cono
mic
s re
late
dF
inan
cial
and
rel
ated
pro
fess
iona
ls
Fin
anci
al c
lerk
s an
d cr
edit
cont
rolle
rsF
ood
serv
ices
aid
s an
d w
aite
rsG
ener
al, l
egal
, adm
inis
trat
ion
and
rela
ted
prof
essi
onal
sH
ead
of d
epar
tmen
t/chi
ef e
xecu
tive
offic
erH
ortic
ultu
rists
, for
este
rs, a
gric
ultu
ral a
nd fo
rest
ry te
chni
cian
sH
ouse
hold
and
laun
dry
wor
kers
Hum
an r
esou
rces
, org
anis
atio
n de
velo
pmen
t and
rel
ated
pro
fess
iona
lsH
uman
res
ourc
es c
lerk
s H
uman
res
ourc
es r
elat
edIn
form
atio
n te
chno
logy
rel
ated
Lang
uage
pra
ctiti
oner
s, in
terp
rete
rs a
nd o
ther
com
mun
icat
ors
Lega
l rel
ated
Li
brar
ians
and
rel
ated
pro
fess
iona
ls
Libr
ary,
mai
l and
rel
ated
cle
rks
Ligh
t veh
icle
driv
ers
Logi
stic
al s
uppo
rt p
erso
nnel
M
ater
ial-r
ecor
ding
and
tran
spor
t cle
rks
Mec
hani
cal e
ngin
eerin
g te
chni
cian
s
0 96 8 6 – 1 1 0 0 14 1 18 197 4 36 17 83 22 1 0
118 19 19 41 10 1 13 4 1 67 7 8 78 1
– 3 – 1 2 – – 1 – 3 – – 6 – 9 1 23 1 – – 7 – 8 8 2 – 3 – – 3 – 3 11 –
–3,
1 –16
,7 0 – – 0 –21
,4 – – 3 – 25 5,9
27,7 4,5 – –
5,9 –
42,1
19,5 20 –
23,1 – –
4,5 –
37,5
14,1 –
– 82 8 4 – – 1 – – 2 1 618
3 5 14 15 51 19 – – 34 15 8 31 9 – 8 3 1 57 7 3 57 –
–85
,410
0,0
66,7 – –
100,
0 – –14
,310
0,0
33,3
92,9
125
38,9
88,2
61,4
86,4 – –
28,8
78,9
42,1
75,6
90,0 –
61,5
75,0
100,
085
,110
0,0
37,5
73,1 –
TA
BL
E 4
.4
Pro
mo
tio
ns
by
crit
ical
occ
up
atio
n (
cont
inue
d)

Human resources management176
Occ
up
atio
n
Em
plo
ymen
t at
beg
inn
ing
of
per
iod
Pro
mo
tio
ns
to a
no
ther
sa
lary
leve
l
Sal
ary
leve
l p
rom
oti
on
s as
a %
of
emp
loym
ent
Pro
gre
s-si
on
s to
an
oth
ern
otc
h w
ith
in
sala
ry le
vel
No
tch
pro
-g
resi
on
as
a %
of
emp
loym
ent
Mes
seng
ers,
por
ters
and
del
iver
ers
Met
eoro
logi
sts,
sta
tistic
al a
nd r
elat
ed te
chni
cian
s M
inin
g ge
olog
y, g
eoph
ysic
al a
nd r
elat
ed te
chni
cian
s M
otor
veh
icle
driv
ers
Mot
oris
ed fa
rm a
nd fo
rest
ry p
lant
ope
rato
rs
Nat
ural
sci
ence
s re
late
d N
atur
e co
nser
vatio
n an
d oc
eano
grap
hy r
elat
ed te
chni
cian
sO
ther
adm
inis
trat
ive
and
rela
ted
cler
ks a
nd o
rgan
iser
s O
ther
adm
inis
trat
ive
polic
y an
d re
late
d of
ficer
sO
ther
info
rmat
ion
tech
nolo
gy p
erso
nnel
O
ther
occ
upat
ions
Prin
ting
and
rela
ted
mac
hine
ope
rato
rs
Prin
ting
plan
ners
and
pro
duct
ion
cont
rolle
rs
Pro
puls
ion
engi
neer
ing
oper
ator
, eng
ine
room
mec
hani
cs a
nd m
arin
e en
gine
ers
Ran
k: M
inis
ter
Ran
k: D
eput
y M
inis
ter
Reg
ulat
ory
insp
ecto
rs
Ris
k m
anag
emen
t and
sec
urity
ser
vice
sR
oad
trad
e w
orke
rs
Roa
dwor
kers
S
afet
y, h
ealth
and
qua
lity
insp
ecto
rs
Sec
reta
ries
and
othe
r ke
yboa
rd o
pera
ting
cler
ksS
ecur
ity g
uard
s S
ecur
ity o
ffice
rsS
enio
r m
anag
ers
Soc
ial s
cien
ces
rela
ted
Sta
tistic
ians
and
rel
ated
pro
fess
iona
ls
Sup
plem
enta
ry d
iagn
ostic
rad
iogr
aphe
rsT
rade
labo
urer
s V
eter
inar
ians
V
eter
inar
y as
sist
ants
W
ater
pla
nt a
nd r
elat
ed o
pera
tors
To
tal
62 – – 46 6 – 51 215 58 7 – 9 1 – 1 1 16 4 19 – 58 46 1 48 40 1 19 –
357 22 4 1
2 47
6
2 – – – – – – 23 5 – – – – – – – – – – – – 2 – 3 6 – 1 – 1 3 1 –
183
3,2 – – – – – –
10,7 8,6 – – – – – – – – – – – –
4,3 –
6,3 15 –
5,3 –
0,3
13,6 25 –
7,4
53 – – 40 5 – 43 150 39 3 – 5 – – – – 1 – 16 – 44 29 1 33 10 – 3 –
278 7 3 –
1 69
4
85,5 – – 87
83,3 –
84,3
69,8
67,2
42,9 –
55,6 – – – –
6,3 –
84,2 –
75,9 63 100
68,8 25 –
15,8 –
77,9
31,8 75 –
68,5
TA
BL
E 4
.4
Pro
mo
tio
ns
by
crit
ical
occ
up
atio
n (
cont
inue
d)
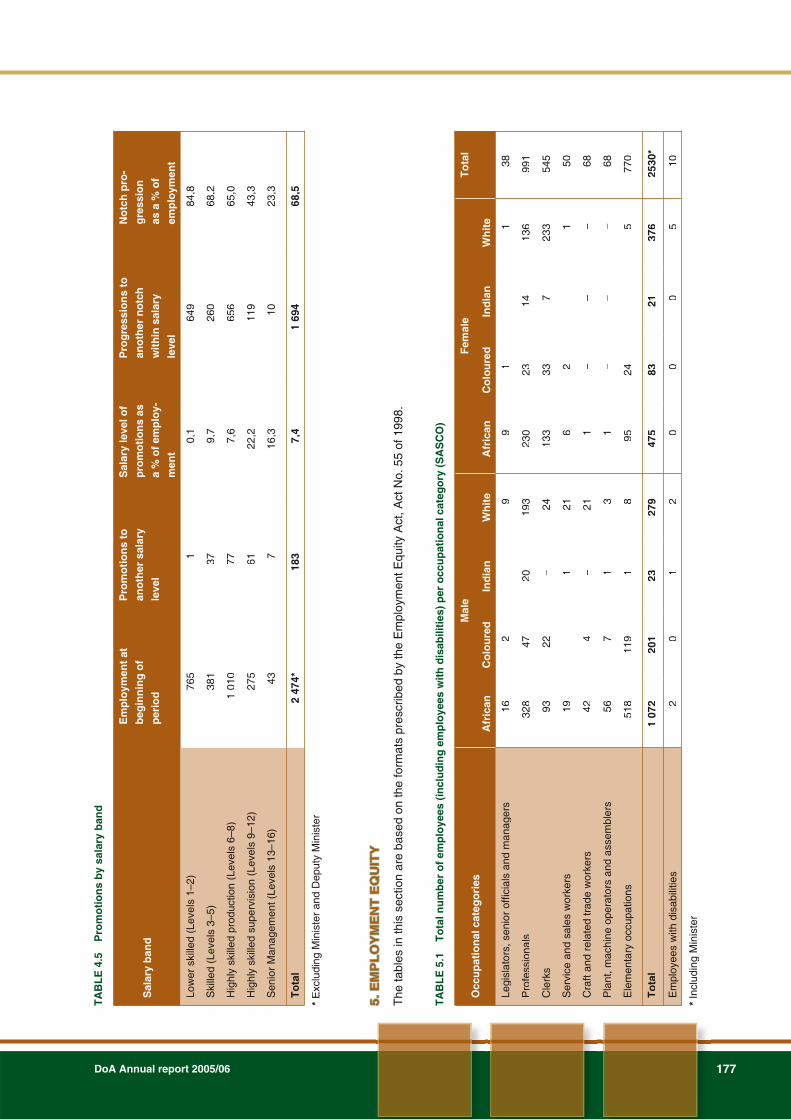
DoA Annual report 2005/06 177
TA
BL
E 4
.5
Pro
mo
tio
ns
by
sala
ry b
and
Sal
ary
ban
d
Em
plo
ymen
t at
beg
inn
ing
of
per
iod
Pro
mo
tio
ns
to
ano
ther
sal
ary
leve
l
Sal
ary
leve
l of
pro
mo
tio
ns
as
a %
of
emp
loy-
men
t
Pro
gre
ssio
ns
to
ano
ther
no
tch
wit
hin
sal
ary
leve
l
No
tch
pro
-
gre
ssio
n
as a
% o
f
emp
loym
ent
Low
er s
kille
d (L
evel
s 1–
2)
Ski
lled
(Lev
els
3–5)
Hig
hly
skill
ed p
rodu
ctio
n (L
evel
s 6–
8)
Hig
hly
skill
ed s
uper
visi
on (
Leve
ls 9
–12)
Sen
ior
Man
agem
ent (
Leve
ls 1
3–16
)
To
tal
765
381
1 01
0
275 43
2 47
4*
1 37 77 61 7
183
0,1
9,7
7,6
22,2
16,3 7,4
649
260
656
119 10
1 69
4
84,8
68,2
65,0
43,3
23,3
68,5
*E
xclu
ding
Min
iste
r an
d D
eput
y M
inis
ter
5. E
MP
LO
YM
EN
T E
QU
ITY
5.
EM
PL
OY
ME
NT
EQ
UIT
Y
The
tabl
es in
this
sec
tion
are
base
d on
the
form
ats
pres
crib
ed b
y th
e E
mpl
oym
ent E
quity
Act
, Act
No.
55
of 1
998.
TA
BL
E 5
.1
To
tal n
um
ber
of
emp
loye
es (
incl
ud
ing
em
plo
yees
wit
h d
isab
iliti
es)
per
occ
up
atio
nal
cat
ego
ry (
SA
SC
O)
Occ
up
atio
nal
cat
ego
ries
Mal
eF
emal
eT
ota
l
Afr
ican
Co
lou
red
Ind
ian
Wh
ite
Afr
ican
Co
lou
red
Ind
ian
Wh
ite
Legi
slat
ors,
sen
ior
offic
ials
and
man
ager
s
Pro
fess
iona
ls
Cle
rks
Ser
vice
and
sal
es w
orke
rs
Cra
ft an
d re
late
d tr
ade
wor
kers
Pla
nt, m
achi
ne o
pera
tors
and
ass
embl
ers
Ele
men
tary
occ
upat
ions
To
tal
16 328 93 1 9 42 56 518
1 07
2
2 47 22 – 4 7
119
201
– 20 – 1 – 1 1 23
9
193 24 21 21 3 8
279
9
230
133 6 1 1 95 475
1 23 33 2 – – 24 83
– 14 7 – – – – 21
1
136
233 1 – – 5
376
38 991
545 5 0 68 68 770
2530
*
Em
ploy
ees
with
dis
abili
ties
20
12
00
05
10
*In
clud
ing
Min
iste
r

Human resources management178
TA
BL
E 5
.2
To
tal n
um
ber
of
emp
loye
es (
incl
ud
ing
em
plo
yees
wit
h d
isab
iliti
es)
per
occ
up
atio
nal
ban
ds
Occ
up
atio
nal
ban
ds
Mal
eF
emal
eT
ota
l
Afr
ican
Co
lou
red
Ind
ian
Wh
ite
Afr
ican
Co
lou
red
Ind
ian
Wh
ite
Top
man
agem
ent
Sen
ior
man
agem
ent
Pro
fess
iona
lly q
ualif
ied
and
expe
rienc
ed
spe
cial
ists
and
mid
-man
agem
ent
Ski
lled
tech
nica
l and
aca
dem
ical
ly q
ualif
ied
wor
kers
, j
unio
r m
anag
emen
t, su
perv
isor
s, fo
rem
enS
emis
kille
d an
d di
scre
tiona
ry d
ecis
ion
mak
ing
Uns
kille
d an
d de
fined
dec
isio
n m
akin
g
To
tal
3 17 152
230
152
519
1 07
3
0 2 10 36 41 112
201
0 1 12 8 0 2 23
0 10 125
119 20 5
279
2 6 66 230 79 90 473
0 1 6 28 26 22 83
0 0 6 12 3 0 21
0 2 63 273 35 3
376
5 39 440
936
356
753
2 52
9*
* E
xclu
ding
Min
iste
r
TA
BL
E 5
.3
Rec
ruit
men
t
Occ
up
atio
nal
ban
ds
Mal
eF
emal
eT
ota
l
Afr
ican
Co
lou
red
Ind
ian
Wh
ite
Afr
ican
Co
lou
red
Ind
ian
Wh
ite
Sen
ior
man
agem
ent
Pro
fess
iona
lly q
ualif
ied
and
expe
rienc
ed
spe
cial
ists
and
mid
-man
agem
ent
Ski
lled
tech
nica
l and
aca
dem
ical
ly q
ualif
ied
wor
kers
, j
unio
r m
anag
emen
t, su
perv
isor
s, fo
rem
enS
emis
kille
d an
d di
scre
tiona
ry d
ecis
ion
mak
ing
Uns
kille
d an
d de
fined
dec
isio
n m
akin
g
To
tal
Em
ploy
ees
with
dis
abili
ties
3 15 48 7 32 105 0
0 0 3 2 4 9 0
0 1 0 0 0 1 0
0 1 1 1 3 6 0
0 6 60 16 10 92 0
0 0 0 3 0 3 0
0 1 1 2 0 4 0
0 1 1 0 0 2 0
3 25 114 31 49 222 0
TA
BL
E 5
.4
Pro
mo
tio
ns
Occ
up
atio
nal
ban
ds
Mal
eF
emal
eT
ota
l
Afr
ican
Co
lou
red
Ind
ian
Wh
ite
Afr
ican
Co
lou
red
Ind
ian
Wh
ite
Top
man
agem
ent
Sen
ior
man
agem
ent
Pro
fess
iona
lly q
ualif
ied
and
expe
rienc
ed
spe
cial
ists
and
mid
-man
agem
ent
Ski
lled
tech
nica
l and
aca
dem
ical
ly q
ualif
ied
wor
kers
, j
unio
r m
anag
emen
t, su
perv
isor
s, fo
rem
enS
emis
kille
d an
d di
scre
tiona
ry d
ecis
ion
mak
ing
Uns
kille
d an
d de
fined
dec
isio
n m
akin
g
To
tal
Em
ploy
ees
with
dis
abili
ties
1 4 29 31 15 0 80 0
0 0 3 3 8 1 15 0
0 0 2 0 0 0 2 0
0 1 6 1 0 0 8 0
0 1 15 33 11 0 60 0
0 0 2 5 2 0 9 0
0 0 0 0 0 0 0 0
0 0 4 4 1 0 9 0
1 6 61 77 37 1
183 0

DoA Annual report 2005/06 179
TA
BL
E 5
.5
Ter
min
atio
ns
Occ
up
atio
nal
ban
ds
Mal
eF
emal
eT
ota
l
Afr
ican
Co
lou
red
Ind
ian
Wh
ite
Afr
ican
Co
lou
red
Ind
ian
Wh
ite
Sen
ior
man
agem
ent
Pro
fess
iona
lly q
ualif
ied
and
expe
rienc
ed
spe
cial
ists
and
mid
-man
agem
ent
Ski
lled
tech
nica
l and
aca
dem
ical
ly q
ualif
ied
wor
kers
,
jun
ior
man
agem
ent,
supe
rvis
ors,
fore
men
Sem
iski
lled
and
disc
retio
nary
dec
isio
n m
akin
g
Uns
kille
d an
d de
fined
dec
isio
n m
akin
g
To
tal
Em
ploy
ees
with
dis
abili
ties
0 2 11 8 28 49 0
0 0 1 1 0 2 0
0 0 0 0 0 0 0
0 3 12 0 1 16 0
1 3 8 4 3 19 0
1 0 0 1 1 3 0
0 0 1 0 0 1 0
0 2 16 3 0 21 0
2 10 49 17 33 111 0
TA
BL
E 5
.6
Dis
cip
linar
y ac
tio
n
Dis
cip
linar
y ac
tio
nM
ale
Fem
ale
To
tal
Afr
ican
Co
lou
red
Ind
ian
Wh
ite
Afr
ican
Co
lou
red
Ind
ian
Wh
ite
Dis
cipl
inar
y ac
tion
133
06
01
02
25
To
tal
133
06
01
02
25
TA
BL
E 5
.7
Ski
lls d
evel
op
men
t
Occ
up
atio
nal
cat
ego
ries
Mal
eF
emal
eT
ota
l
Afr
ican
Co
lou
red
Ind
ian
Wh
ite
Afr
ican
Co
lou
red
Ind
ian
Wh
ite
Legi
slat
ors,
sen
ior
offic
ials
and
man
ager
s
Pro
fess
iona
ls
Tec
hnic
ians
and
ass
ocia
te p
rofe
ssio
nals
Cle
rks
Ser
vice
and
sal
es w
orke
rs
Ski
lled
agric
ultu
re a
nd fi
sher
y w
orke
rs
Cra
ft an
d re
late
d tr
ade
wor
kers
Pla
nt, m
achi
ne o
pera
tors
and
ass
embl
ers
Ele
men
tary
occ
upat
ions
To
tal
Em
ploy
ees
with
dis
abili
ties
218
110
287 45 128 6 0 0
174
968 0
11 12 15 0 8 1 0 0 40 87 0
0 5 11 2 0 0 0 0 0 18 0
13 56 1 34 35 10 0 0 0 1
249 0
90 149
166 40 149 2 0 0 18 614 0
2 1 9 10 28 0 0 0 13 63 0
0 0 6 2 20 0 0 0 0 28 0
8 51 40 23 100 1 0 0 0
223 0
342
384
668
157
443 10 0 0
246
2 25
0 0

Human resources management180
6. P
ER
FO
RM
AN
CE
RE
WA
RD
S6
. P
ER
FO
RM
AN
CE
RE
WA
RD
S
To
enco
urag
e go
od p
erfo
rman
ce, t
he d
epar
tmen
t has
gra
nted
the
follo
win
g pe
rfor
man
ce r
ewar
ds d
urin
g th
e ye
ar u
nder
rev
iew
. The
info
rmat
ion
is p
rese
nted
in te
rms
of r
ace,
gen
der
and
disa
bilit
y (T
able
6.1
), s
alar
y ba
nds
(Tab
le 6
.2)
and
criti
cal o
ccup
atio
ns (
Tab
le 6
.3).
TA
BL
E 6
.1
Per
form
ance
rew
ard
s b
y ra
ce, g
end
er a
nd
dis
abili
ty
Rac
e, g
end
er a
nd
dis
abili
ty
Nu
mb
er o
f
ben
efic
iari
es
To
tal
emp
loym
ent
Per
cen
tag
e o
f
tota
l em
plo
ymen
t
Co
st
(R’0
00)
Ave
rag
e co
st
per
ben
efic
iary
(R)
Afr
ican
, fem
ale
Afr
ican
, mal
e
Asi
an, f
emal
e
Asi
an, m
ale
Col
oure
d, fe
mal
e
Col
oure
d, m
ale
Whi
te, f
emal
e
Whi
te, m
ale
Em
ploy
ees
with
dis
abili
ties
To
tal
105
148 3 6 16 31 196
120 0
625
474
1072 21 23 83 201
376
279 0
2 52
9
22,2
13,8
14,3
26,1
19,3
15,4
52,1
43,0 0,0
24,7
977
1 50
1 41 93 128
236
2 73
8
2 61
8 0
8 33
2
9 30
5
10 1
42
13 6
67
15 5
00
8 00
0
7 61
3
13 9
69
21 8
17 0
13 3
31
TA
BL
E 6
.2
Per
form
ance
rew
ard
s b
y sa
lary
ban
d f
or
per
son
nel
bel
ow
sen
ior
man
agem
ent
serv
ice
Sal
ary
ban
d
Nu
mb
er o
f
ben
efic
iari
es
To
tal
emp
loym
ent
Per
cen
tag
e o
f
tota
l em
plo
ymen
t
Co
st
(R’0
00)
Ave
rag
e co
st
per
ben
efic
iary
(R)
Low
er s
kille
d (L
evel
s 1–
2)
Ski
lled
(Lev
els
3–5)
Hig
hly
skill
ed p
rodu
ctio
n (L
evel
s 6–
8)
Hig
hly
skill
ed s
uper
visi
on (
Leve
ls 9
–12)
To
tal
120 74 282
135
611
753
368
886
479
2 48
6
15,9
20,1
31,8
28,2
24,6
535
456
3 42
4
3 05
7
7 47
2
4 45
8
6 16
2
1214
2
22 6
44
12 2
29

DoA Annual report 2005/06 181
TA
BL
E 6
.3
Per
form
ance
rew
ard
s b
y cr
itic
al o
ccu
pat
ion
Cri
tica
l occ
up
atio
ns
Nu
mb
er o
f
ben
efic
iari
es
To
tal
emp
loym
ent
Per
cen
tag
e o
f
tota
l em
plo
y-
men
t
Co
st
(R’0
00)
Ave
rag
e co
st
per
ben
efic
iary
(R)
Adm
inis
trat
ive
rela
ted
Agr
icul
tura
l ani
mal
, oce
anog
raph
y, fo
rest
ry a
nd o
ther
sci
ence
sA
gric
ultu
re r
elat
ed
Airc
raft
pilo
t and
rel
ated
ass
ocia
te p
rofe
ssio
nals
All
artis
ans
in b
uild
ing,
met
al, m
achi
nery
, etc
. A
ppra
iser
s, v
alue
rs a
nd r
elat
ed p
rofe
ssio
nals
Arc
hivi
sts,
cur
ator
s an
d re
late
d pr
ofes
sion
als
Aux
iliar
y an
d re
late
d w
orke
rsB
ioch
emis
try,
pha
rmac
olog
y, z
oolo
gy a
nd li
fe s
cien
ce te
chni
cian
sB
uild
ing
and
othe
r pr
oper
ty c
aret
aker
sB
us a
nd h
eavy
veh
icle
driv
ers
Che
mis
tsC
ivil
engi
neer
ing
tech
nici
ans
Cle
aner
s in
offi
ces,
wor
ksho
ps, e
tc.
Clie
nt in
form
atio
n cl
erks
(sw
itchb
oard
, rec
eptio
n an
d i
nfor
mat
ion
cler
ks)
Com
mun
icat
ion
and
info
rmat
ion
rela
ted
Com
mun
ity d
evel
opm
ent w
orke
rC
ompu
ter
prog
ram
mer
sC
ompu
ter
syst
em d
esig
ners
and
ana
lyst
s E
arth
-mov
ing
and
rela
ted
plan
t ope
rato
rsE
cono
mis
tsE
ngin
eerin
g sc
ienc
es r
elat
edE
ngin
eers
and
rel
ated
pro
fess
iona
lsF
arm
hand
s an
d w
orke
rsF
arm
ing,
fore
stry
adv
isor
s an
d fa
rm m
anag
ers
Fin
ance
and
eco
nom
ics
rela
ted
Fin
anci
al a
nd r
elat
ed p
rofe
ssio
nals
F
inan
cial
cle
rks
and
cred
it co
ntro
llers
Foo
d se
rvic
es a
ids
and
wai
ters
Gen
eral
lega
l adm
inis
trat
ion
and
rela
ted
prof
essi
onal
sH
ead
of d
epar
tmen
t/chi
ef e
xecu
tive
offic
erH
ealth
sci
ence
s re
late
dH
ortic
ultu
rists
, for
este
rs, a
gric
ultu
ral a
nd fo
rest
ry te
chni
cian
sH
ouse
hold
and
laun
dry
wor
kers
H
uman
res
ourc
es a
nd o
rgan
isat
ion
deve
lopm
ent a
nd r
elat
ed p
rofe
ssio
nals
Hum
an r
esou
rce
cler
ks
Hum
an r
esou
rces
rel
ated
22 27 21 0 10 0 0 16 21 2 0 1 0 39 4 2 0 0 1 0 3 0 5 15 0 20 13 24 12 1 0 0 13 3 4 25 7
89 95 180 1 50 10 1 71 22 27 5 3 0 93 7 7 0 1 4 0 18 2 17 198 4 49 20 80 23 1 1 1
120 19 16 42 11
24,7
28,4
11,7 0,0
20,0 0,0
0,0
22,5
95,5 7,4
0,0
33,3 0,0
41,9
57,1
28,6 0,0
0,0
25,0 0,0
16,7 0,0
29,4 7,6
0,0
40,8
65,0
30,0
5 2,2
100,
00,
00,
010
,815
,825
,0
59,5
63,6
533
429
483 0 89 0 0 95 298 8 0 13 0
194 52 66 0 0 21 0 76 0 81 64 0
431
166
235 61 41 0 0
144 14 70 345
227
2422
715
889
23 0
00 08
900 0 0
5 93
814
190
4 00
0 013
000 0
4 97
413
000
33 0
00 0 021
000 0
25 3
33 016
200
4 26
7 021
550
12 7
699
792
5 08
341
000 0 0
11 0
774
667
17 5
00
13 8
0032
429

Human resources management182
Cri
tica
l occ
up
atio
ns
Nu
mb
er o
f
ben
efic
iari
es
To
tal
emp
loym
ent
Per
cen
tag
e o
f
tota
l em
plo
y-
men
t
Co
st
(R’0
00)
Ave
rag
e co
st
per
ben
efic
iary
(R)
Info
rmat
ion
tech
nolo
gy r
elat
ed
Lang
uage
pra
ctiti
oner
s, in
terp
rete
rs a
nd o
ther
com
mun
icat
ors
Lega
l rel
ated
Libr
aria
ns a
nd r
elat
ed p
rofe
ssio
nals
Libr
ary,
mai
l and
rel
ated
cle
rks
Ligh
t veh
icle
driv
ers
Logi
stic
al s
uppo
rt p
erso
nnel
Mat
eria
l-rec
ordi
ng a
nd tr
ansp
ort c
lerk
s
Mes
seng
ers,
por
ters
and
del
iver
ers
Mot
or v
ehic
le d
river
s
Met
eoro
logi
sts,
sta
tistic
al a
nd r
elat
ed te
chni
cian
s
Mot
oris
ed fa
rm a
nd fo
rest
ry p
lant
ope
rato
rs
Nat
ure
cons
erva
tion
and
ocea
nogr
aphy
rel
ated
tech
nici
ans
Oth
er a
dmin
istr
ativ
e an
d re
late
d cl
erks
and
org
anis
ers
Oth
er a
dmin
istr
ativ
e po
licy
and
rela
ted
offic
ers
Oth
er in
form
atio
n te
chno
logy
per
sonn
el
Prin
ting
and
rela
ted
mac
hine
ope
rato
rs
Prin
ting
plan
ners
and
pro
duct
ion
cont
rolle
rs
Reg
ulat
ory
insp
ecto
rs
Ris
k m
anag
emen
t and
sec
urity
ser
vice
s
Roa
d tr
ade
wor
kers
Saf
ety
heal
th a
nd q
ualit
y in
spec
tors
Sec
reta
ries
and
othe
r ke
yboa
rd o
pera
ting
cler
ks
Sec
urity
gua
rds
Sec
urity
offi
cers
Sen
ior
man
ager
s
Soc
ial s
cien
ces
rela
ted
Sta
tistic
ians
and
rel
ated
pro
fess
iona
ls
Tra
de w
orke
rs
Vet
erin
aria
ns
Vet
erin
ary
assi
stan
ts
Wat
er p
lant
and
rel
ated
ope
rato
rs
To
tal
1 5 3 1 28 5 4 11 33 6 0 1 7 60 22 4 4 0 6 0 1 22 33 0 4 13 0 2 22 13 3 0
625
2 13 3 1 68 7 9 70 59 42 0 5 52 207 56 3 8 1 16 4 17 53 62 1 45 37 1 21 348 24 4 1
2 52
9
50,0
38,5
100,
0
100,
0
41,2
71,4
44,4
15,7
55,9
14,3 0,0
20,0
13,5
29,0
39,3
133,
3
50,0 0,0
37,5 0,0
5,9
41,5
53,2 0,0
8,9
35,1 0,0
9,5
6,3
54,2
75,0 0,0
24,7
97 57 102 10 234 26 50 86 163 26 0 5 88 564
368
101 23 0 62 0 4
287
390 0 34 763 0 26 87 409 34 0
8 33
2
97 0
00
11 4
00
34 0
00
10 0
00
8 35
7
5 20
0
12 5
00
7 81
8
4 93
9
4 33
3 0
5 00
0
12 5
71
9 40
0
16 7
27
25 2
50
5 75
0 0
10 3
33 0
4 00
0
13 0
45
11 8
18 0
8 50
0
58 6
92 0
13 0
00
3 95
5
31 4
62
11 3
33 0
13 3
31
TA
BL
E 6
.3
Per
form
ance
rew
ard
s b
y cr
itic
al o
ccu
pat
ion
(co
ntin
ued)

DoA Annual report 2005/06 183
TA
BL
E 6
.4
Per
form
ance
rel
ated
rew
ard
s (c
ash
bo
nu
s) b
y sa
lary
ban
d f
or
sen
ior
man
agem
ent
serv
ice
SM
S b
and
Nu
mb
er o
f b
enef
icia
ries
To
tal
emp
loym
ent
% t
ota
lem
plo
ymen
tC
ost
(R’0
00)
Ave
rag
e co
st
per
ben
efic
iary
(R)
% o
f S
MS
w
age
bill
Per
son
nel
co
st S
MS
(R’0
00)
Ban
d B
Ban
d C
Ban
d D
To
tal
11 3 0 0 14
30 8 4 1 43
36,7
37,5
0,0
0,0
32,6
667
193 0 0 860
60 6
36
64 3
33
0 0
61 4
29
3,8
4,8
0,0
0,0
4,0
17 6
45
4 00
9
0 0
21 6
54
7. F
OR
EIG
N W
OR
KE
RS
7.
FO
RE
IGN
WO
RK
ER
S
No
fore
ign
natio
nals
wer
e em
ploy
ed in
the
depa
rtm
ent d
urin
g th
e pe
riod
unde
r re
view
.
8. L
EA
VE
UT
ILIS
AT
ION
FO
R T
HE
PE
RIO
D 1
JA
NU
AR
Y 2
00
5 T
O 3
1 D
EC
EM
BE
R 2
00
58
. L
EA
VE
UT
ILIS
AT
ION
FO
R T
HE
PE
RIO
D 1
JA
NU
AR
Y 2
00
5 T
O 3
1 D
EC
EM
BE
R 2
00
5
The
Pub
lic S
ervi
ce C
omm
issi
on id
entif
ied
the
need
for
care
ful m
onito
ring
of s
ick
leav
e w
ithin
the
publ
ic s
ervi
ce. T
he fo
llow
ing
tabl
es p
rovi
de a
n in
dica
tion
of th
e us
e of
sick
leav
e (T
able
8.1
) an
d di
sabi
lity
leav
e (T
able
8.2
). In
bot
h ca
ses,
the
estim
ated
cos
t of t
he le
ave
is a
lso
prov
ided
.
TA
BL
E 8
.1
Sic
k le
ave
Sal
ary
ban
d
To
tal d
ays
% d
ays
wit
h
med
ical
ce
rtif
icat
ion
Nu
mb
er o
fem
plo
yees
usi
ng
sic
kle
ave
% o
f to
tal
emp
loye
esu
sin
g s
ick
leav
e
Ave
rag
ed
ays
per
emp
loye
e
Est
imat
edco
st
(R’0
00)
To
tal n
um
ber
o
f em
plo
yees
usi
ng
sic
kle
ave
To
tal n
um
ber
o
f d
ays
wit
hm
edic
alce
rtif
icat
ion
Low
er s
kille
d (L
evel
s 1–
2)
Ski
lled
(Lev
els
3–5)
Hig
hly
skill
ed p
rodu
ctio
n (L
evel
s 6–
8)
Hig
hly
skill
ed s
uper
visi
on (
Leve
ls 9
–12)
Sen
ior
man
agem
ent (
Leve
ls 1
3–16
)
To
tal
2 66
3,0
1 58
2,0
5 05
1,5
1 36
6,0
16,0
10 6
78,5
88,1
93,4
80,7
96,2
100,
0
86,4
339
211
663
241 2
1 45
6
23,3
14,5
45,5
16,6 0,1
100,
0
8 8 8 6 8 7
407
332
1 88
1
1 02
6 24
3 67
0
1 45
6
1 45
6
1 45
6
1 45
6
1 45
6
1 44
8
2 34
6
1 47
7
4 07
6
1 31
4 1 6
9 22
9

Human resources management184
TA
BL
E 8
.2
Dis
abili
ty le
ave
(tem
po
rary
an
d p
erm
anen
t)
Sal
ary
ban
d
To
tal d
ays
% d
ays
wit
h
med
ical
ce
rtif
icat
ion
Nu
mb
er o
fem
plo
yees
usi
ng
sic
kle
ave
% o
f to
tal
emp
loye
esu
sin
g s
ick
leav
e
Ave
rag
ed
ays
per
emp
loye
e
Est
imat
edco
st
(R’0
00)
To
tal n
um
ber
o
f em
plo
yees
usi
ng
sic
kle
ave
To
tal n
um
ber
o
f d
ays
wit
hm
edic
alce
rtif
icat
ion
Low
er s
kille
d (L
evel
s 1–
2)
Ski
lled
(Lev
els
3–5)
Hig
hly
skill
ed p
rodu
ctio
n (L
evel
s 6–
8)H
ighl
y sk
illed
sup
ervi
sion
(Le
vels
9–1
2)S
enio
r m
anag
emen
t (Le
vels
13–
16)
To
tal
838
627
1 03
5 54 0
2 55
4
100
100
100
100 0
100
29 23 48 4 0
104
27,9
22,1
46,2 3,8
0,0
100,
0
29 27 22 14 0 25
128
142
396 37 0
703
104
104
104
104 0
104
838
627
1 03
5 54 0
2 55
4
Tab
le 8
.3 s
umm
aris
es th
e ut
ilisa
tion
of a
nnua
l lea
ve. T
he w
age
agre
emen
t con
clud
ed w
ith tr
ade
unio
ns in
the
PS
CB
C in
200
0 re
quire
s m
anag
emen
t of a
nnua
l lea
veto
pre
vent
pay
ing
out h
igh
leve
ls o
f acc
rued
leav
e at
the
time
of te
rmin
atio
n of
ser
vice
.
TA
BL
E 8
.3
An
nu
al le
ave
Sal
ary
ban
dT
ota
l day
s ta
ken
Ave
rag
e p
er e
mp
loye
eE
mp
loym
ent
Ski
lled
(Lev
els
3–5)
Hig
hly
skill
ed p
rodu
ctio
n (L
evel
s 6–
8)
Hig
hly
skill
ed s
uper
visi
on (
Leve
ls 9
–12)
Sen
ior
man
agem
ent (
Leve
ls 1
3–16
)
TO
TA
L
17 4
31,0
06
728,
0021
353
,28
7 74
3,00
83,0
0
53 3
38,2
8
23,8
20,0
24,0
17,4
21,0
22,0
734
338
903
445 4
242
4
TA
BL
E 8
.4
Cap
ped
leav
e
Sal
ary
ban
d
To
tal d
ays
of
cap
ped
leav
eta
ken
Ave
rag
e n
um
ber
of
day
s ta
ken
per
emp
loye
e
Ave
rag
e ca
pp
ed
leav
e p
erem
plo
yee
as a
t31
Dec
emb
er 2
005
Nu
mb
er o
f em
-p
loye
es w
ho
use
cap
ped
leav
e
To
tal c
app
ed
leav
e av
aila
ble
at
31 D
ecem
ber
200
5
Nu
mb
er o
f em
plo
yees
as
at31
Dec
emb
er 2
005
Ski
lled
(Lev
els
3–5)
Hig
hly
skill
ed p
rodu
ctio
n (L
evel
s 6–
8)
Hig
hly
skill
ed s
uper
visi
on (
Leve
ls 9
–12)
Sen
ior
man
agem
ent (
Leve
ls 1
3–16
)
To
tal
360
140
611
362 15
1 48
8
5 5 5 7 5 6
35 24 30 31 23 31
67 28 113 52 3
263
26 4
478
717
26 1
2414
656 969
76 9
13
760
361
877
474 43
2 51
5

DoA Annual report 2005/06 185
The
follo
win
g ta
ble
sum
mar
ises
pay
men
ts m
ade
to e
mpl
oyee
s as
a r
esul
t of l
eave
that
was
not
take
n.
TA
BL
E 8
.5
Lea
ve p
ayo
uts
Rea
son
To
tal a
mo
un
t (R
’000
)N
um
ber
of
emp
loye
esA
vera
ge
pay
men
t p
er e
mp
loye
e (
R)
Leav
e pa
yout
for
2004
/05
owin
g to
non
–util
isat
ion
of le
ave
for
the
prev
ious
cyc
leC
appe
d le
ave
payo
uts
on te
rmin
atio
n of
ser
vice
for
2004
/05
Cur
rent
leav
e pa
yout
on
term
inat
ion
of s
ervi
ce fo
r 20
04/0
5
To
tal
4
402
103
509
1
121 24 146
4 00
0
3 32
24
292
3 48
6
9. H
IV/A
IDS
AN
D H
EA
LT
H P
RO
MO
TIO
N P
RO
GR
AM
ME
S9
. H
IV/A
IDS
AN
D H
EA
LT
H P
RO
MO
TIO
N P
RO
GR
AM
ME
S
TA
BL
E 9
.1
Ste
ps
take
n t
o r
edu
ce t
he
risk
of
occ
up
atio
nal
exp
osu
re
Un
its/
cate
go
ries
of
emp
loye
es id
enti
fied
to
be
at h
igh
ris
k o
f co
ntr
acti
ng
HIV
an
d r
elat
ed d
isea
ses
(if
any)
Key
ste
ps
take
n t
o r
edu
ce t
he
risk
Labo
rato
ry w
orke
rs
Mea
t ins
pect
ors
Agr
icul
tura
l far
mer
s
Agr
icul
tura
l mac
hine
use
rsT
hese
peo
ple
can
be e
xpos
ed if
they
com
e in
con
tact
with
blo
od, d
ust,
etc.
Aw
aren
ess
prog
ram
mes
Pre
sent
atio
n on
OH
S (
as p
er th
e O
HS
Act
), H
IV a
nd A
ids
and
Hea
lthP
rom
otio
n du
ring
outr
each
pro
gram
mes
Not
man
date
d
Pro
visi
on o
f pro
tect
ive
clot
hing
and
equ
ipm
ent
Pre
sent
atio
ns o
n H
IV a
nd A
ids
prev
entio
nP
rovi
sion
of c
ondo
ms
TA
BL
E 9
.2
Det
ails
of
hea
lth
pro
mo
tio
n a
nd
HIV
/Aid
s p
rog
ram
mes
[ti
ck Y
es/N
o a
nd
pro
vid
e re
qu
ired
info
rmat
ion
]
Qu
esti
on
sY
esN
oD
etai
ls, i
f ye
s
p
rovi
sion
s co
ntai
ned
in P
art V
I E o
f Cha
pter
1 o
f the
Pub
lic S
ervi
ce
Reg
ulat
ions
, 200
1?
If s
o, p
rovi
de h
er/h
is n
ame
and
posi
tion.
XM
r Is
aac
Miti
, Sen
ior
Man
ager
: Hum
an R
esou
rces
Man
agem
ent
2. D
oes
the
depa
rtm
ent h
ave
a de
sign
ated
uni
t or
have
you
des
igna
ted
s
peci
fic s
taff
mem
bers
to p
rom
ote
the
heal
th a
nd w
ellb
eing
of y
our
e
mpl
oyee
s?
If s
o, in
dica
te th
e nu
mbe
r of
em
ploy
ees
who
are
invo
lved
in th
is ta
sk a
nd
th
e an
nual
bud
get t
hat i
s av
aila
ble
for
this
pur
pose
.
XS
ubdi
rect
orat
e: E
mpl
oyee
Hea
lth a
nd W
elln
ess.
One
OH
S O
ffice
r, o
ne
E
AP
pra
ctiti
oner
, one
Hea
lth P
rom
otio
n O
ffice
r an
d th
e H
ealth
and
Wel
lnes
s C
o-or
dina
tor.
•
The
re is
no
spec
ific
budg
et fo
r H
IV a
nd A
ids
Pro
gram
mes
.

Human resources management186
Qu
esti
on
sY
esN
oD
etai
ls, i
f ye
s
p
rom
otio
n pr
ogra
mm
e fo
r yo
ur e
mpl
oyee
s?
If
so,
indi
cate
the
key
elem
ents
/ser
vice
s of
the
prog
ram
me.
XE
AP
Pro
gram
mes
• S
tres
s m
anag
emen
t•
Sub
stan
ce a
buse
info
rmat
ion
• Li
fe s
kills
orie
ntat
ion
• T
raum
a m
anag
emen
t•
Fin
anci
al m
anag
emen
t•
Cou
nsel
ling
• H
IV a
nd A
ids
supp
ort
• A
lignm
ent w
ith th
e A
RT
dis
trib
utor
s•
Ref
erra
ls•
Adv
ocac
y•
Con
flict
man
agem
ent
• H
ealth
Pro
mot
ion
Pro
gram
mes
• Li
fest
yle
dise
ase
man
agem
ent
• V
olun
tary
cou
nsel
ling
and
test
ing
• A
war
enes
s ca
mpa
igns
• H
ealth
rel
ated
wor
ksho
ps•
Nut
ritio
n co
unse
lling
4. H
as th
e de
part
men
t est
ablis
hed
(a)
com
mitt
ee(s
) as
con
tem
plat
ed in
P
art V
I E.5
(e)
of C
hapt
er 1
of t
he P
ublic
Ser
vice
Reg
ulat
ions
, 200
1?
If s
o, p
leas
e pr
ovid
e th
e na
mes
of t
he m
embe
rs o
f the
com
mitt
ee
a
nd th
e st
akeh
olde
r(s)
that
they
rep
rese
nt.
XS
. She
zi –
Hum
an R
esou
rcs
Man
agem
ent
L. M
otlh
athu
di –
Hum
an R
esou
rces
Man
agem
ent
M. M
ubva
– H
uman
Res
ourc
es M
anag
emen
tS
. Dla
min
i –
Hum
an R
esou
rces
Man
agem
ent
P. M
arot
a –
Pro
cure
men
t and
Ass
et M
anag
emen
tM
. Leb
eloa
ne –
Hum
an R
esou
rces
Man
agem
ent
C. M
alot
he –
Wat
er U
se a
nd Ir
rigat
ion
Dev
elop
men
tS
. Mol
teno
s –
Wat
er U
se a
nd Ir
rigat
ion
Dev
elop
men
tR
. Hef
er –
Foo
d S
afet
y an
d Q
ualit
y A
ssur
ance
F.J
. Pot
giet
er –
Info
rmat
ion
and
Com
mun
icat
ion
Tec
hnol
ogy
C. N
ortie
r –
Agr
icul
tura
l Inf
orm
atio
n S
ervi
ces
T. Z
war
ts –
Ani
mal
Hea
lthM
. Mot
lhat
lhed
i – D
ebt M
anag
emen
t and
Dis
burs
emen
tsK
. Nok
eri –
Fin
anci
al S
ervi
ces
J. P
hang
iso
– A
gric
ultu
ral P
rodu
ct In
spec
tion
Ser
vice
sM
. Mog
oane
– In
tern
atio
nal R
elat
ions
A. S
eutlw
adi –
Agr
icul
tura
l Sta
tistic
sS
. Sko
sana
– F
ood
Saf
ety
and
Qua
lity
Ass
uran
ceC
. Ben
jam
in –
Edu
catio
n an
d T
rain
ing
K.S
. Mat
honj
wa
– S
ecur
ity S
ervi
ces
C. M
alah
lela
– F
ood
Saf
ety
and
Qua
lity
Ass
uran
ce
TA
BL
E 9
.2
Det
ails
of
hea
lth
pro
mo
tio
n a
nd
HIV
/Aid
s p
rog
ram
mes
[ti
ck Y
es/N
o a
nd
pro
vid
e re
qu
ired
info
rmat
ion
] (c
ontin
ued)

DoA Annual report 2005/06 187
Qu
esti
on
sY
esN
oD
etai
ls, i
f ye
s
5. H
as th
e de
part
men
t rev
iew
ed th
e em
ploy
men
t pol
icie
s an
d pr
actic
es o
f
y
our
depa
rtm
ent t
o en
sure
that
thes
e do
not
unf
airly
dis
crim
inat
e ag
ains
t
e
mpl
oyee
s on
the
basi
s of
thei
r H
IV s
tatu
s?
If
so,
list
the
empl
oym
ent p
olic
ies/
prac
tices
so
revi
ewed
.
XH
IV/A
ids
polic
y of
the
depa
rtm
ent
S
tigm
atis
atio
n cl
ause
add
ed
6. H
as th
e de
part
men
t int
rodu
ced
mea
sure
s to
pro
tect
HIV
pos
itive
em
ploy
ees
o
r th
ose
perc
eive
d to
be
HIV
pos
itive
from
dis
crim
inat
ion?
If
so,
list
the
key
elem
ents
of t
hese
mea
sure
s.
XH
IV/A
ids
Pol
icy
of th
e D
epar
tmen
t of A
gric
ultu
re in
corp
orat
ed:
Lega
l im
plic
atio
ns o
f dis
crim
inat
ion
expl
aine
d
P
lann
ing
for
the
Man
agem
ent t
rain
ing
and
supp
ort
Em
ploy
men
t Equ
ity A
ct
P
rom
otio
n of
Equ
ality
and
Pre
vent
ion
of U
nfai
r D
iscr
imin
atio
n
Act
200
0.
7. D
oes
the
depa
rtm
ent e
ncou
rage
its
empl
oyee
s to
und
ergo
vol
unta
ry
c
ouns
ellin
g an
d te
stin
g?
If
so,
list
the
resu
lts th
at y
ou h
ave
achi
eved
.
XT
he d
epar
tmen
t has
intr
oduc
ed v
olun
tary
cou
nsel
ling
and
test
ing
and
ther
e ha
s be
en a
pos
itive
res
pons
e. A
ccre
dite
d by
Dep
artm
ent o
f Hea
lth
8. H
as th
e de
part
men
t dev
elop
ed m
easu
res/
indi
cato
rs to
mon
itor
and
e
valu
ate
the
impa
ct o
f you
r he
alth
pro
mot
ion
prog
ram
me?
If
so,
list
thes
e m
easu
res/
indi
cato
rs.
XK
now
ledg
e, a
ttitu
de, p
ract
ices
stu
dy is
in p
rogr
ess.
Hum
an R
esou
rces
Man
agem
ent t
o co
nduc
t im
pact
ana
lysi
s bi
annu
ally
in
orde
r to
und
erst
and,
eva
luat
e an
d m
onito
r th
e ev
olvi
ng e
pide
mic
and
how
it w
ill im
pact
on
the
orga
nisa
tion
in r
elat
ion
to it
s st
ruct
ure,
ope
ratio
ns,
func
tions
, kno
wle
dge
and
skill
s.
10
. L
AB
OU
R R
EL
AT
ION
S1
0.
LA
BO
UR
RE
LA
TIO
NS
The
follo
win
g co
llect
ive
agre
emen
ts w
ere
ente
red
into
with
trad
e un
ions
with
in th
e de
part
men
t.
TA
BL
E 1
0.1
Co
llect
ive
agre
emen
ts
Su
bje
ct m
atte
r
Nil
TA
BL
E 9
.2
Det
ails
of
hea
lth
pro
mo
tio
n a
nd
HIV
/Aid
s p
rog
ram
mes
[ti
ck Y
es/N
o a
nd
pro
vid
e re
qu
ired
info
rmat
ion
] (c
ontin
ued)

Human resources management188
TA
BL
E 1
0.2
Mis
con
du
ct a
nd
dis
cip
linar
y h
eari
ng
s fi
nal
ised
, 1 A
pri
l 200
5 to
31
Mar
ch 2
006
Ou
tco
mes
of
dis
cip
linar
y h
eari
ng
sN
um
ber
% o
f to
tal
Cor
rect
iona
l cou
nsel
ling
Ver
bal w
arni
ng
Writ
ten
war
ning
Fin
al w
ritte
n w
arni
ng
Sus
pend
ed w
ithou
t pay
Fin
e
Dem
otio
n
Dis
mis
sal
Not
gui
lty
Cas
e w
ithdr
awn
To
tal
1 – 2 4 2 – – 1 3 5 18
5,5 –
11,1
22,2
11,1 – –
5,5
16,6
28,0
100,
0
TA
BL
E 1
0.3
Typ
es o
f m
isco
nd
uct
ad
dre
ssed
at
dis
cip
linar
y h
eari
ng
s
Typ
e o
f m
isco
nd
uct
N
um
ber
% o
f to
tal
Mis
use
of g
over
nmen
t veh
icle
Mal
prac
tice,
cor
rupt
ion
and
nepo
tism
Abs
cond
men
t
Dam
age
of g
over
nmen
t veh
icle
The
ft
Abs
ent w
ithou
t aut
horis
atio
n
Alc
ohol
abu
se
Mis
man
agem
ent o
f Sta
te fi
nanc
es
Insu
bord
inat
ion
Rap
e
Ope
ratin
g m
oney
loan
sch
emes
Ass
ault
Pre
judi
cing
the
disc
iplin
e
Pre
judi
cing
the
adm
inis
trat
ion
of th
e de
part
men
t
Illeg
al u
se o
f Sta
te p
rope
rty
Fra
ud
To
tal
1 2 1 5 1 3 1 1 3 18
5,5 –
11,1 5,5 28 5,5
16,6 5,5
5,5
16,1
100,
0
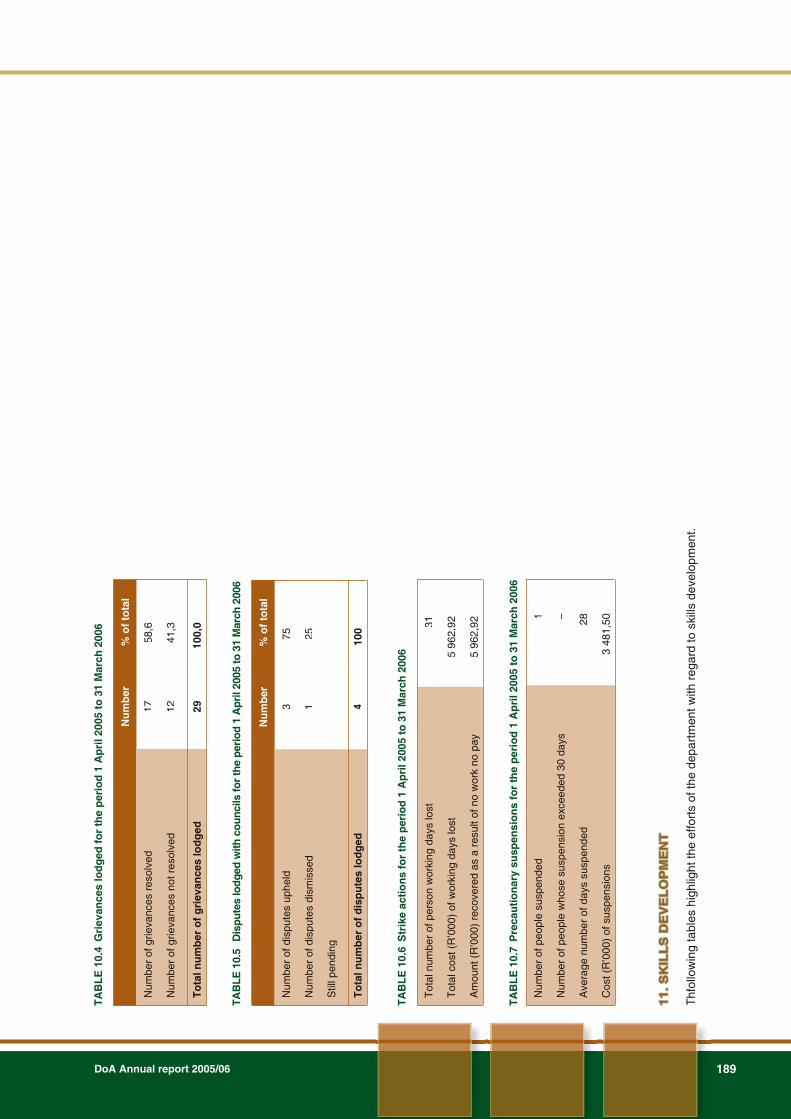
DoA Annual report 2005/06 189
TA
BL
E 1
0.4
Gri
evan
ces
lod
ged
fo
r th
e p
erio
d 1
Ap
ril 2
005
to 3
1 M
arch
200
6
Nu
mb
er%
of
tota
l
Num
ber
of g
rieva
nces
res
olve
d
Num
ber
of g
rieva
nces
not
res
olve
d
To
tal n
um
ber
of
gri
evan
ces
lod
ged
17 12 29
58,6
41,3
100,
0
TAB
LE 1
0.5
Dis
pute
s lo
dged
with
cou
ncils
for
the
peri
od 1
Apr
il 20
05 to
31
Mar
ch 2
006
Nu
mb
er%
of
tota
l
Num
ber
of d
ispu
tes
uphe
ld
Num
ber
of d
ispu
tes
dism
isse
d
Stil
l pen
ding
To
tal n
um
ber
of
dis
pu
tes
lod
ged
3 1 – 4
75 25 –
100
TA
BL
E 1
0.6
Str
ike
acti
on
s fo
r th
e p
erio
d 1
Ap
ril 2
005
to 3
1 M
arch
200
6
Tot
al n
umbe
r of
per
son
wor
king
day
s lo
st
Tot
al c
ost (
R’0
00)
of w
orki
ng d
ays
lost
Am
ount
(R
’000
) re
cove
red
as a
res
ult o
f no
wor
k no
pay
31
5 96
2,92
5 96
2,92
TA
BL
E 1
0.7
Pre
cau
tio
nar
y su
spen
sio
ns
for
the
per
iod
1 A
pri
l 200
5 to
31
Mar
ch 2
006
Num
ber
of p
eopl
e su
spen
ded
Num
ber
of p
eopl
e w
hose
sus
pens
ion
exce
eded
30
days
Ave
rage
num
ber
of d
ays
susp
ende
d
Cos
t (R
’000
) of
sus
pens
ions
1 – 28
3 48
1,50
11
. S
KIL
LS
DE
VE
LO
PM
EN
T1
1.
SK
ILL
S D
EV
EL
OP
ME
NT
Thf
ollo
win
g ta
bles
hig
hlig
ht th
e ef
fort
s of
the
depa
rtm
ent w
ith r
egar
d to
ski
lls d
evel
opm
ent.

Human resources management190
TA
BL
E 1
1.1
Tra
inin
g n
eed
s id
enti
fied
Occ
up
atio
nal
cat
ego
ries
Gen
der
Em
plo
ymen
tL
earn
er-
ship
s
Ski
lls p
ro-
gra
mm
es a
nd
oth
er s
ho
rt
cou
rses
Oth
er f
orm
s
of
trai
nin
g
To
tal
Legi
slat
ors,
sen
ior
offic
ials
and
man
ager
s
Pro
fess
iona
ls
Tec
hnic
ians
and
ass
ocia
te p
rofe
ssio
nals
Cle
rks
Ser
vice
and
sal
es w
orke
rs
Ski
lled
agric
ultu
re a
nd fi
sher
y w
orke
rs
Cra
ft an
d re
late
d tr
ade
wor
kers
Pla
nt a
nd m
achi
ne o
pera
tors
and
ass
embl
ers
Ele
men
tary
occ
upat
ions
Gen
der
subt
otal
s
To
tal
Fem
ale
Mal
e
Fem
ale
Mal
e
Fem
ale
Mal
e
Fem
ale
Mal
e
Fem
ale
Mal
e
Fem
ale
Mal
e
Fem
ale
Mal
e
Fem
ale
Mal
e
Fem
ale
Mal
e
Fem
ale
Mal
e
124 90 461
734
462
483
563
279 87 46 54 86
1 75
1
1 71
8
3 46
9
124 90 461
734
462
483
563
279 87 46 54 86
1 75
1
1 71
8
3 46
9

DoA Annual report 2005/06 191
TA
BL
E 1
1.2
Tra
inin
g p
rovi
ded
Occ
up
atio
nal
cat
ego
ries
Gen
der
Em
plo
ymen
tL
earn
er-
ship
s
Ski
lls p
ro-
gra
mm
es a
nd
oth
er s
ho
rt
cou
rses
Oth
er f
orm
s
of
trai
nin
g
To
tal
Legi
slat
ors,
sen
ior
offic
ials
and
man
ager
s
Pro
fess
iona
ls
Tec
hnic
ians
and
ass
ocia
te p
rofe
ssio
nals
Cle
rks
Ser
vice
and
sal
es w
orke
rs
Ski
lled
agric
ultu
re a
nd fi
sher
y w
orke
rs
Cra
ft an
d re
late
d tr
ades
wor
kers
Pla
nt a
nd m
achi
ne o
pera
tors
and
ass
embl
ers
Ele
men
tary
occ
upat
ions
Gen
der
subt
otal
s
To
tal
Fem
ale
Mal
e
Fem
ale
Mal
e
Fem
ale
Mal
e
Fem
ale
Mal
e
Fem
ale
Mal
e
Fem
ale
Mal
e
Fem
ale
Mal
e
Fem
ale
Mal
e
Fem
ale
Mal
e
Fem
ale
Mal
e
9 26 9 26 35
32 39 76 105
142
209
153 72 8 10 2 1 9 2
422
4 38
860
1 3 3 11 4 9 30 9 2 1 40 33 73
33 42 79 116
146
218
183 81 8 10 4 1 18 29 471
4 97
968

Human resources management192
12
. IN
JU
RY
ON
DU
TIE
S1
2.
INJ
UR
Y O
N D
UT
IES
The
follo
win
g ta
ble
prov
ides
bas
ic in
form
atio
n on
inju
ry o
n du
ties.
TA
BL
E 1
2.1
Inju
ry o
n d
uti
es
Nat
ure
of
inju
ry o
n d
uti
esN
um
ber
% o
f to
tal
Req
uire
d ba
sic
med
ical
atte
ntio
n on
ly
Tem
pora
ry to
tal d
isab
lem
ent
Per
man
ent d
isab
lem
ent
Fat
al
To
tal
19 19
100
100
13
. U
TIL
ISA
TIO
N O
F C
ON
SU
LT
AN
TS
13. U
TIL
ISA
TIO
N O
F C
ON
SU
LT
AN
TS
TA
BL
E 1
3.1
Rep
ort
on
co
nsu
ltan
t ap
po
intm
ents
usi
ng
ap
pro
pri
ated
fu
nd
s
Pro
ject
tit
leT
ota
l nu
mb
er o
f co
n-
sult
ants
wh
o w
ork
ed
on
th
e p
roje
ct
Du
rati
on
: W
ork
day
sC
on
trac
t va
lue
inR
and
1.
Ris
k as
sess
men
t 2
. A
men
dmen
t of t
he A
gric
ultu
ral P
ests
Act
, 198
3 3
. In
gero
p A
fric
a—S
uper
visi
on o
f the
upg
radi
ng o
f Lar
na D
awn
Dam
4.
J.F
. Kirs
ten—
App
rais
al o
f exi
stin
g la
nd r
efor
m p
roje
ct 5
. M
otsw
edin
g C
omm
unic
atio
n—V
ideo
sho
ot L
RA
D p
roje
cts:
Gau
teng
6.
Mot
swed
ing
Com
mun
icat
ion—
Vid
eo s
hoot
LR
AD
pro
ject
s: L
impo
po 7
. S
habu
gwan
e In
vest
men
ts—
Upg
radi
ng o
f the
Lar
na D
awn
Dam
8.
Dhl
adhl
a A
ssoc
iate
s C
onsu
lting
— A
ppoi
ntm
ent o
f con
trac
tor
for
land
ref
orm
pro
ject
s 9
. E
men
do T
own
and
Reg
iona
l Pla
nner
s— A
ppoi
ntm
ent o
f con
trac
tor
for
land
ref
orm
pro
ject
s10
. S
uppl
y ch
ain
man
agem
ent
11.
Pro
ject
pla
n fo
r im
plem
enta
tion
of In
tegr
ated
Sco
reca
rd F
ram
ewor
k
4 1 3 5 4 4 2 4 5 1 2
63
5 6 m
onth
s6
mon
ths
3 4 6 m
onth
s6
mon
ths
6 m
ont h
s20
57
403
908,
0010
000
,00
451
764,
4038
6 75
0,00
97 9
80,0
015
7 68
0,00
3 90
4 08
9,48
33 1
60,0
033
5 16
0,00
628
658,
2779
8 00
0,00
To
tal n
um
ber
of
pro
ject
sT
ota
l in
div
idu
al
con
sult
ants
To
tal d
ura
tio
n:
Wo
rk d
ays
To
tal c
on
trac
t va
lue
in R
and
1135
737
7 20
7 15
0,15
TA
BL
E 1
3.2
An
alys
is o
f co
nsu
ltan
t ap
po
intm
ents
usi
ng
ap
pro
pri
ated
fu
nd
s, i.
t.o
. HD
Is
Pro
ject
tit
leP
erce
nta
ge
ow
ner
ship
by
HD
I gro
up
sP
erce
nta
ge
man
agem
ent
by
HD
I gro
up
sN
um
ber
of
con
sult
ants
fro
m
HD
I gro
up
s th
at w
ork
on
th
e p
roje
ct
Ris
k as
sess
men
tP
roje
ct p
lan
for
impl
emen
tatio
n of
Inte
grat
ed S
core
card
Fra
mew
ork
79 100
93 100
4 1
No
cons
ulta
nts
wer
e ap
poin
ted
usin
g do
nor
fund
s du
ring
the
perio
d un
der
revi
ew.