Department of Agricultural Economics Purdue University 2012 Animal Outlook Chris Hurt...
31
Department of Agricultural Economics Purdue University 2012 Animal Outlook Chris Hurt [email protected] Purdue University August 19, 2011
-
date post
19-Dec-2015 -
Category
Documents
-
view
215 -
download
1
Transcript of Department of Agricultural Economics Purdue University 2012 Animal Outlook Chris Hurt...

Department of Agricultural EconomicsPurdue University
2012 Animal Outlook
Chris Hurt
Purdue University
August 19, 2011

Department of Agricultural EconomicsPurdue University
Congratulations
IF YOUR STILL STANDING

Department of Agricultural EconomicsPurdue University

Department of Agricultural EconomicsPurdue University
GRAIN AND FEED

Ethanol - From the 2005 crop, 7.8 million corn acres were needed to meet the ethanol needs (by-product adjusted). That climbed to 23.7 million U.S. corn acres in 2010, an increase of 15.9 million acres.
U.S. soybean exports to China required the production from 8.3 million acres of the 2005 crop, but 22.8 million acres of the 2010 crop—an additional 14.5 million acres.
Two Big Demand Shocks

Department of Agricultural EconomicsPurdue University
81
82
83
84
85
86
87
88
89
90
91
92
93
94
95
96
97
98
99
0 1 2 3 4 5 6 7 8 9 10
11
0
1,000
2,000
3,000
4,000
5,000
6,000
7,000Corn Use: USDA
FSI-NonFuel
Feed
Exports
Fuel
Mill
ion
bu
.

Change in World Area of Major Crops
70% from New Land30% from shifting

Department of Agricultural EconomicsPurdue University
2000-01
2001-02
2002-03
2003-04
2004-05
2005-06
2006-07
2007-08
2008-09
2009-10
2010-11
2011-12
1,800,000
1,900,000
2,000,000
2,100,000
2,200,000
2,300,000
World Total Grains Production and Use
Production
Use

Department of Agricultural EconomicsPurdue University
700,000
750,000
800,000
850,000
900,000868,809
896,055
f(x) = 51860.2261684277 ln(x) + 667975.103480246R² = 0.870728295736081
World Harvested Hectares Total: (Millions)
+ 27 million hectares, or about 3% more land: China, Africa, FSU, Ar-gentina, India, and Brazil

Department of Agricultural EconomicsPurdue University
GRAIN AND FEED
WILL SLOW

Department of Agricultural EconomicsPurdue University
2006 2007 2008 2009 2010 2011 2012 2013 2014 2015 2016 2017 20181,000.0
1,500.0
2,000.0
2,500.0
3,000.0
3,500.0
4,000.0
4,500.0
5,000.0
5,500.0 Corn to Meet RFS2500 Mil-lion Bu.
Per Year: 2005-10
155 Million Bu. Per Year: 2011-14
Trend Yields
0 Million Bu. Per Year: 2015-2022

Department of Agricultural EconomicsPurdue University
2000
01 02 03 04 05 06 07 08 09 100
100
200
300
400
500
600
700
800
900
1,000
192 164
283 305
436
357423
504
685
825
992
192164
283 305
436
357
423
504 509
615
921
U.S. Soybeans Destined for China: Million Bushels
All Purchases
Stocks Adjusted
U.S. Harvest Year
Mil
lio
n B
us
he
ls

Department of Agricultural EconomicsPurdue University
LIVESTOCK INDUSTRY ADJUSTMENTS TO
GRAIN SHOCKS

Department of Agricultural EconomicsPurdue University
70
71
72
73
74
75
76
77
78
79
80
81
82
83
84
85
86
87
88
89
90
91
92
93
94
95
96
97
98
99
00
1 2 3 4 5 6 7180
185
190
195
200
205
210
215
220
225
230
222.3
f(x) = 0.938085129664077 x + 185.643655761024R² = 0.8569559949652
Per Capita Total Meats and PoultryRetail Weight: USDA
Po
un
ds
pe
r ca
pita

Department of Agricultural EconomicsPurdue University
70
71
72
73
74
75
76
77
78
79
80
81
82
83
84
85
86
87
88
89
90
91
92
93
94
95
96
97
98
99
00
1 2 3 4 5 6 7 8 9 10
11
12
180
185
190
195
200
205
210
215
220
225 222.3
208.5
202.3
f(x) = 0.71765780730897 x + 188.757574750831R² = 0.692536306758222
Per Capita Total Meats and PoultryRetail Weight: USDA
Po
un
ds
pe
r ca
pita

Why is downsizing of the livestock sector not required today as it was in 2008?

Department of Agricultural EconomicsPurdue University
60
61
62
63
64
65
66
67
68
69
70
71
72
73
74
75
76
77
78
79
80
81
82
83
84
85
86
87
88
89
90
91
92
93
94
95
96
97
98
99
012345678910
11
20%
25%
30%
35%
40%
45%
50%
55%
60%
65%
70%
75%
80%Portion of Indiana Receipts from Crops and Animals
Crops
Animals
USDA & Purdue

Department of Agricultural EconomicsPurdue University
5 6 7 8 9 10 11 12$38
$43
$48
$53
$58
$63
$68
35
37
39
41
43
45
47
49
51
53
$50$47 $47 $48
$41
$55
$64 $65
Barrow & Gilt prices and Per Capita Supplies
Price Per Capita Supply

Department of Agricultural EconomicsPurdue University
1 2 3 4 1 2 3 4 1 2 3 4 1 2 3 4 1 2 3 4 1 2 3 4 1 2 3 46 7 8 9 10 2011 2012
$30
$35
$40
$45
$50
$55
$60
$65
$70
43
48
52 5350
39 40
53
57
42 43
39
50
60 60
50
68 69
62
65
6865
57
Estimated Hog Prices and Costs Per Live Hundredweight:
Hog Price
Costs
$/c
wt

Department of Agricultural EconomicsPurdue University
1 2 3 4 1 2 3 4 1 2 3 4 1 2 3 4 1 2 3 48 9 10 2011 2012
$0.00
$1.00
$2.00
$3.00
$4.00
$5.00
$6.00
$7.00
$8.00
$9.007.70
6.14
6.81
7.516.92
5.38
Estimated Hog Producer Breakeven Corn Price/Bushel Quarterly
$/b
us
he
l

Department of Agricultural EconomicsPurdue University
00 1 2 3 4 5 6 7 8 9 10 11 120
4000
8000
12000
16000
20000
24000
U.S. Pork Production and Domestic Available (Billion pounds)
ProductionDomestic UseNet TradeBi
llion
Pou
nds

Department of Agricultural EconomicsPurdue University
80
81
82
83
84
85
86
87
88
89
90
91
92
93
94
95
96
97
98
99
00
1 2 3 4 5 6 7 8 9 10
11
12
0
5
10
15
20
25
30
35Exports % of Domestic Production
Beef
Pork
Broilers
Turkey
Eggs
Corn
Pe
rce
nt

Department of Agricultural EconomicsPurdue University
77 80 83 86 89 92 95 98 1 4 7 1030,000
32,000
34,000
36,000
38,000
40,000
42,000July Beef Cows
Mill
ion
Hea
d

Department of Agricultural EconomicsPurdue University

Department of Agricultural EconomicsPurdue University
90919293949596979899 0 1 2 3 4 5 6 7 8 9 10114000.0
4500.0
5000.0
5500.0
6000.0
Beef Replacement Heifers: July 1M
illio
n H
ea
d

Department of Agricultural EconomicsPurdue University
5 6 7 8 9 10 11$78
$83
$88
$93
$98
$103
$108
$113
$118
40
45
50
55
60
65
70
$87$85
$92 $92
$83
$95
$113$116
Choice Steer per Capita Supplies and Prices
Price
Per Capita Supply
Department of Agricultural EconomicsPurdue University
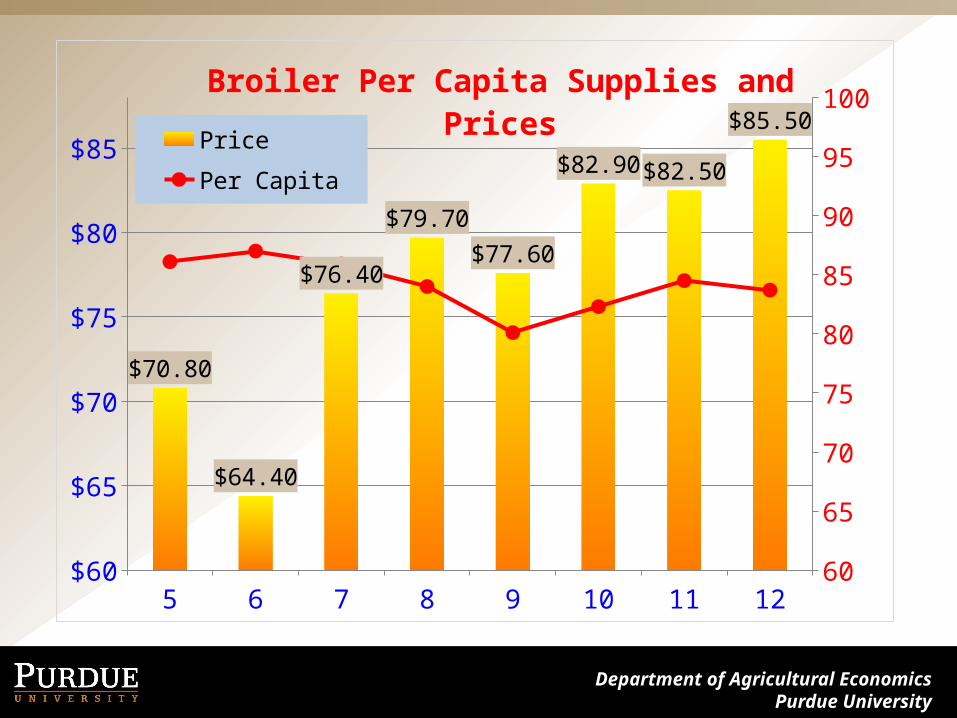
5 6 7 8 9 10 11 12$60
$65
$70
$75
$80
$85
60
65
70
75
80
85
90
95
100
$70.80
$64.40
$76.40
$79.70$77.60
$82.90 $82.50
$85.50
Broiler Per Capita Supplies and Prices
Price Per Capita

Department of Agricultural EconomicsPurdue University
5 6 7 8 9 10 11 12$60
$65
$70
$75
$80
$85
$90
$95
$100
10
12
14
16
18
20
22
$73.40$77.00
$82.10
$87.50
$76.50
$90.40
$100.50$97.00
Turkey Prices and Per Capita Supplies
Price
Per Capita

Department of Agricultural EconomicsPurdue University
Will High feed prices Persist??
19001905
19101915
19201925
19301935
19401945
19501955
19601965
19701975
19801985
19901995
20002005
2010$0
$200
$400
$600
$800
$1,000
$1,200 Real U.S. Corn Revenue Per Harvested Acre: 2010 = 100
Do
llars
Pe
r A
cre

Department of Agricultural EconomicsPurdue University
Agricultural policies for surplus vs. shortage?
Surplus• Most of U.S. History• Reduce Supply
– Set-asides– Soil Bank– CRP-Conservation
• Increase Demand– Food Stamps– School Lunch– Export Enhancement– Ethanol mandate/tax
credits
Shortage• Limited History• Increase Supply
– Release/reduce CRP– Flexible haying/grazing
CRP– Research & education– Production incentives
• Reduce Demand– Limit export incentives– No mandates or tax credits– Establish priorities

Department of Agricultural EconomicsPurdue University
Questions?