Department for International Development Transferring cash ... · and assets to improve their...
54
Department for International Development Transferring cash and assets to the poor REPORT BY THE COMPTROLLER AND AUDITOR GENERAL HC 1587 SESSION 2010–2012 9 NOVEMBER 2011
Transcript of Department for International Development Transferring cash ... · and assets to improve their...

Department for International Development
Transferring cash and assets to the poor
REPORT BY THE COMPTROLLER AND AUDITOR GENERAL
HC 1587 SESSION 2010–2012
9 NOVEMBER 2011

The National Audit Office scrutinises public spending on behalf
of Parliament. The Comptroller and Auditor General, Amyas Morse,
is an Officer of the House of Commons. He is the head of the NAO,
which employs some 880 staff. He and the NAO are totally independent
of government. He certifies the accounts of all government departments
and a wide range of other public sector bodies; and he has statutory
authority to report to Parliament on the economy, efficiency and
effectiveness with which departments and other bodies have used their
resources. Our work led to savings and other efficiency gains worth
more than £1 billion in 2010-11.
Our vision is to help the nation spend wisely.
We apply the unique perspective of public audit to help Parliament and government drive lasting improvement in public services.

Ordered by the House of Commons to be printed on 7 November 2011
Report by the Comptroller and Auditor General HC 1587 Session 2010–2012 9 November 2011
London: The Stationery Office £15.50
This report has been prepared under Section 6 of the National Audit Act 1983 for presentation to the House of Commons in accordance with Section 9 of the Act.
Amyas Morse Comptroller and Auditor General
National Audit Office
31 October 2011
Department for International Development
Transferring cash and assets to the poor

This report examines whether the Department is achieving value for money through transfers by reducing poverty and increasing well-being at reasonable cost. This involves reaching people in need and giving optimal support, in a timely and scheduled way, as well as assessing whether it knows the short- and longer-term effects of its interventions.
© National Audit Office 2011
The text of this document may be reproduced free of charge in any format or medium providing that it is reproduced accurately and not in a misleading context.
The material must be acknowledged as National Audit Office copyright and the document title specified. Where third party material has been identified, permission from the respective copyright holder must be sought.
Printed in the UK for the Stationery Office Limited on behalf of the Controller of Her Majesty’s Stationery Office2462785 11/11 65536

Contents
Key facts 4
Summary 5
Part One Expanding the use of transfers 12
Part TwoReaching those in need with transfers efficiently 20
Part ThreeImpacts of transfers 31
Part FourSustainability of transfer programmes 41
Appendix OneMethodology 44
Endnotes 45
The National Audit Office study team consisted of:
Mark Andrews, Neil Carey, Esme Gaussen and Helen Sharp.
This report can be found on the National Audit Office website at www.nao.org.uk/Transferring-Cash- and-Assets-to-the-poor
Photographs courtesy of xxxxxxxxxxxxxxxxxxxxxxxx
For further information about the National Audit Office please contact:
National Audit Office Press Office 157-197 Buckingham Palace Road Victoria London SW1W 9SP
Tel: 020 7798 7400
Email: [email protected]
Website: www.nao.org.uk
Twitter: @NAOorguk
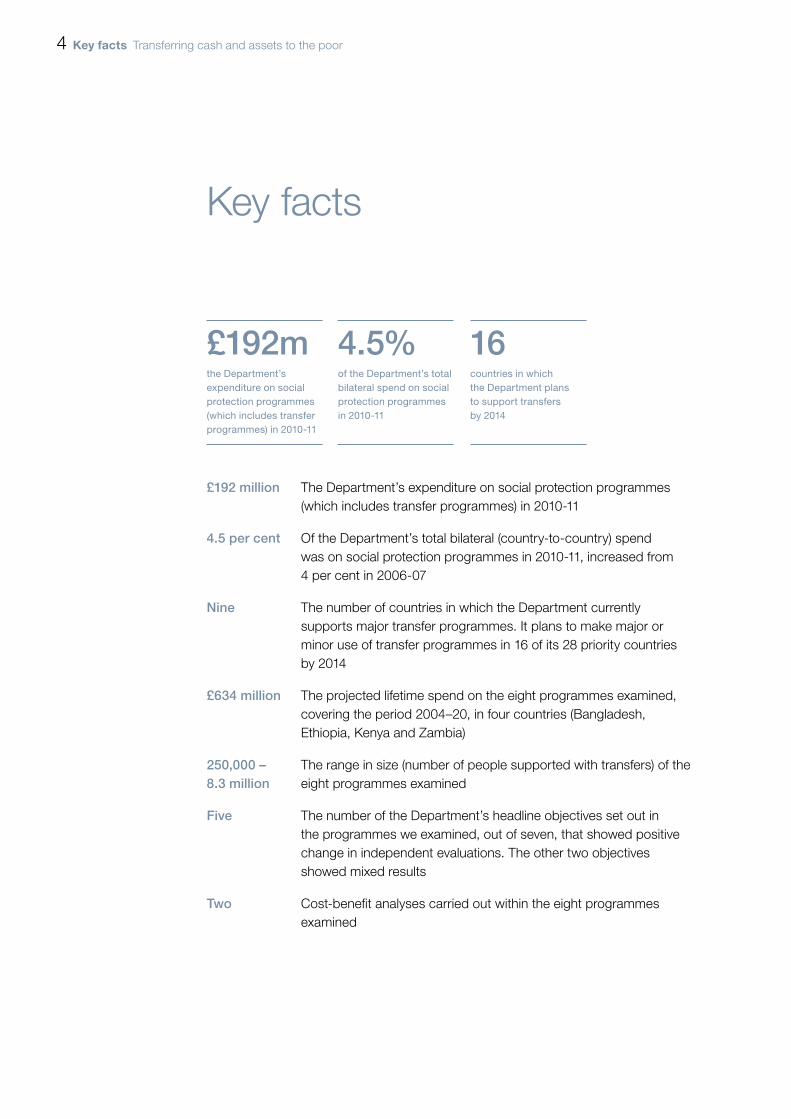
4 Key facts Transferring cash and assets to the poor
Key facts
£192 million The Department’s expenditure on social protection programmes (which includes transfer programmes) in 2010-11
4.5 per cent Of the Department’s total bilateral (country-to-country) spend was on social protection programmes in 2010-11, increased from 4 per cent in 2006-07
Nine The number of countries in which the Department currently supports major transfer programmes. It plans to make major or minor use of transfer programmes in 16 of its 28 priority countries by 2014
£634 million The projected lifetime spend on the eight programmes examined, covering the period 2004–20, in four countries (Bangladesh, Ethiopia, Kenya and Zambia)
250,000 – 8.3 million
The range in size (number of people supported with transfers) of the eight programmes examined
Five The number of the Department’s headline objectives set out in the programmes we examined, out of seven, that showed positive change in independent evaluations. The other two objectives showed mixed results
Two Cost-benefit analyses carried out within the eight programmes examined
£192mthe Department’s expenditure on social protection programmes (which includes transfer programmes) in 2010-11
4.5%of the Department’s total bilateral spend on social protection programmes in 2010-11
16countries in which the Department plans to support transfers by 2014

Transferring cash and assets to the poor Summary 5
Summary
1 Over the last decade, donor approaches to poverty reduction have focused on supporting developing country governments to deliver public services. Aid practitioners and donors, including the Department for International Development (the Department), are now increasingly interested in transferring resources directly to people living in poverty. This would complement support to public services like health or education. Direct transfers can include cash, food and livestock and use shorter and more transparent delivery chains than other aid approaches. Transfers place income, or the means to generate income, into the hands of the most poor and vulnerable people, and differ from more widely prevalent development models which aim to strengthen services, like health or education. Transfers can have a quicker impact on the lives of the poor than more traditional approaches aimed at strengthening public services.
2 Much international research shows that, when able to choose, people use cash and assets to improve their living standards, for example, buying food, searching for work or using education and health services. Experience from middle-income countries, such as Brazil and Mexico, since the early 1990s, show short term and sustained poverty reduction resulting from these interventions. The challenge for the Department has been to use this approach in the low-income countries in Africa and South Asia, which are its priorities and where there has been limited evidence on costs and outcomes. In 2010-11, social protection spending, which includes transfer programmes, was some £192 million, around 4.5 per cent of its bilateral (country-to-country) spend. It currently has major transfer programmes in nine countries.
3 This report examines whether the Department is achieving value for money through transfers by reducing poverty and increasing well-being at reasonable cost. This involves reaching people in need and giving optimal support, in a timely and scheduled way, as well as assessing whether it knows the short- and longer-term effects of its interventions. The report also considers the sustainability of transfer programmes in developing countries. Our examination included detailed work in four countries where the Department has major transfer programmes.

6 Summary Transferring cash and assets to the poor
Key findings
Reaching those in need with transfers efficiently
4 In programmes where evidence was available, we found targeting arrangements were robust, successfully identifying people who met the criteria of need. Within regions selected, high levels of community involvement in setting and applying criteria meant that decisions were transparent and accepted. The programmes are achieving this in particularly remote and challenging places. Evaluations found limited inclusion of ineligible people. The Department and its partners decide which regions and communities to cover, usually on the basis of poverty indicators. Programmes do not reach all of the poorest and potentially eligible people, due to financial or capacity constraints or the need to pilot programmes before expanding.
5 Many components of cost data are recorded, but the Department has not obtained sufficient cost analysis to establish whether the cost of delivering transfers is optimal and is under-informed about efficiency. We found some examples of cost analysis on programmes examined, but also important gaps:
• Pilot schemes have not clearly identified the cost of administering transfers once in steady state.
• The full cost of delivering transfers, including officials and communities’ time, is not systematically captured and analysed.
• In most programmes there was no quantified analysis balancing the costs of targeting against spending on transfers. More precise targeting costs more to administer and these costs should be considered when choosing between targeting methods, alongside political debates. The Department’s programmes have not made well-informed decisions on such trade-offs.
• Management information systems for transfer programmes are in their infancy. They focus mainly on progress towards targets for enrolling beneficiaries, rather than measuring performance in managing scheme entrants and leavers, or timely delivery of payments.
The Department recognises these issues and, in October 2011, produced guidance for country teams on measuring and maximising value for money in cash transfer programmes.

Transferring cash and assets to the poor Summary 7
6 Electronic payment can be a more efficient and reliable method for delivering transfers to isolated populations. It is not yet widely used in the Department’s programmes, although there are further plans to do so. Introducing electronic payment in low-income countries can be challenging, and needs existing financial institutions, phone networks and a framework of regulation that are receptive to poorer people. One of the eight programmes we examined, in Kenya, already used it and three more have plans. The Department has played a wider role in increasing access to financial services in Kenya. Electronic payments are accessible, reduce direct and hidden transaction costs, improve financial control and reduce risks of fraud or theft of funds. Conversely, manual payments are inherently prone to inefficiency and risk.
The impact and cost-effectiveness of transfers
7 There is evidence of clear benefits resulting from the Department’s longer-term programmes. Short-term impacts are clear in areas such as household diet, expenditure and investment. Evidence also appears positive, if less statistically robust, for longer-term effects like improved livelihoods, health and education. Of the eight programmes we examined, four were externally evaluated. These evaluations showed that for the seven Departmental headline programme objectives measured, five showed positive change, and the other two were mixed (see Figure 7). Examples of positive impacts for beneficiaries compared with non-beneficiaries reported by evaluations include:
• the Chars Livelihoods Programme in Bangladesh has increased real incomes of people living on isolated river islands (chars) by between 15 and 66 per cent on average;
• the Challenging the Frontiers of Poverty Reduction Programme in Bangladesh increased the value of livestock assets owned by households by some 12 times;
• the Productive Safety Nets Programme in Ethiopia reduced the period of food insecurity for beneficiaries by almost a month from the previous level of three months in each year;
• the Orphans and Vulnerable Children Programme in Kenya led to a 13 percentage point difference in poverty levels in terms of increased food consumption compared to a control group; and
• the Social Protection Expansion Programme Scheme in Zambia showed – albeit with measurement problems – that people had increased their spending on consumption by at least 50 per cent in the three pilot districts.

8 Summary Transferring cash and assets to the poor
8 The Department has commissioned extensive evaluations of transfer effects, which are robust overall, although some problems with measurement remain. Evaluations generally used comparisons against groups not receiving the transfers, which gives better evidence on results and attribution than we have reported on the Department’s other work. Remaining measurement problems include a minority of evaluations without control groups comparing beneficiaries with non-beneficiaries over time, and some inconsistencies between the Department’s intended indicators, its internal reporting, and the measures used in independent evaluation. Most evaluations have not yet shown how far benefits are sustained after transfers end.
9 The Department is gaining greater assurance that aggregate project benefits outweigh the costs, but it remains under-informed on key elements of cost-effectiveness. We found limited, robust quantified assessments of the cost effectiveness of the programmes we examined, but six of the seven newer transfer programmes designed since February 2009 have used cost-benefit analysis in investment appraisals. Comparisons between the Department’s proposed transfer approach and other options are inconsistent. A key omission is analysis of whether transfers are set at the optimal level. Global research shows that the transfer amount can have strong effects on impacts, but the Department’s programmes are generally set with reference to the cost of average household food needs, without analysis as to how far different payment levels might offer better benefits relative to cost. Increasing transfer values may be worthwhile if they have transformative effects on poverty, though affordability and political acceptability are also factors.
Adopting transfers across the Department’s country network
10 The Department began using transfers in the early 2000s, as individual projects in a few countries, but did not have an explicit strategy to develop and extend the use of transfers across its country network. For the last five years, transfers have been a growing, but still relatively small part of its bilateral programme. The Department’s spending on social protection programmes, (which includes transfer programmes), doubled from £95 million in 2006-07 to some £192 million by 2010-11, increasing from 4 to 4.5 per cent of rising total bilateral spend. The Department has not stated that transfers should always be considered as a component of country programmes. Transfers are a small part of the Department’s overall programme and it is not clear that the opportunities to use them have been maximised across the 28 priority countries.
11 Growth of the Department’s spend on transfers has been constrained by global limited experience of the approach in low-income countries, and by concerns about capacity and commitment in partner countries. In 2010, the Department considered bids from its country offices for spending over 2011–2015, and now plans to use transfers, to some extent, in 16 of its 28 priority countries. It rejected bids to use transfers where there was limited evidence of applicability and piloting in the countries in question, and inadequate or inconsistent information on delivery costs and risks. The Department’s country offices report barriers to introducing

Transferring cash and assets to the poor Summary 9
transfer programmes, including a lack of delivery capacity or funding in governments or implementing partners. However, the Department’s own experience in countries like Kenya and Bangladesh shows that limited government capacity is not necessarily an impossible barrier.
Sustaining progress in assisted countries
12 As well as delivering benefits to poor people through transfer programmes, the Department also aims to strengthen developing country governments’ support for implementing such schemes nationally. More broadly, the Department seeks to reinforce governments’ commitment to expanding social protection for the poor.
13 Financial sustainability remains a concern. Of the programmes we examined, country governments were funding transfers in two; in Zambia and Kenya. In Ethiopia and Bangladesh and the other programme in Kenya it is unclear how the programme will be sustained in the long term without continued donor support. Funding for transfers must compete against other calls on donor and national budgets.
14 Where partner governments have funded transfers, there can be pressures to expand coverage geographically before programmes reach all those in need in pilot areas. There is often a need to balance efficiency with government ownership and political buy-in. In Zambia, the Department and other donors resisted government pressure to expand the social protection programme too quickly. In 2011, the Government of Kenya announced major increases in its resources for social protection, including for orphans and vulnerable children. However, we did not find assessments of the costs of expanding the programme across most of Kenya while coverage remains incomplete in the initial areas that had the highest levels of orphans. Implementation before pilots are complete can adversely affect equity, efficiency and effectiveness, but can help broaden political support.
Conclusion on value for money
15 The Department is successfully using transfers to reach particularly impoverished populations in challenging places, through delivery chains that are shorter and more transparent than other, more traditional, aid interventions. Transfers show clear immediate benefits including reducing hunger and raising incomes. Where longer-term benefits were evaluated, in the two Bangladesh programmes, people stayed out of extreme poverty after transfers ended. The Department has recently focused more on cost-benefit analysis in project appraisals and is gaining greater assurance that aggregate project benefits outweigh the costs. However, it remains under-informed on some key elements of cost-effectiveness, with insufficient comparison of its approaches with other programme design options and too weak a grip on trade-offs. A greater focus here could lead to further benefit for given expenditure and more efficient delivery. Transfer programmes are demonstrating important characteristics of good value for money in terms of positive benefits for recipients, but significantly weaker management of key cost drivers means the Department has not optimised value for money.

10 Summary Transferring cash and assets to the poor
Recommendations
16 Even though transfer programmes should be tailored to each country, we see considerable scope for greater standardisation in the Department’s approach to considering and using transfers. In our view the Department should develop a clearer strategy for using transfer programmes. We make the following recommendations.
a The Department is rightly establishing significant monitoring and evaluation in its transfer programmes, particularly through sophisticated control trials, but important gaps remain. In gaining better evidence to inform investment choice, design and implementation, the Department should prioritise, taking specifics of the programme into account:
• Comparative cost-benefit analysis between transfers and other programme design options, to support stronger business cases.
• Assessing whether increasing the transfer values or changing the mix of programme components may transform household poverty more, e.g., by stimulating productive investment.
• Stronger and more consistent analysis of the costs of managing transfer programmes as they move through set-up phase to full roll-out, and of trade-offs in cost between tighter targeting and higher administrative costs.
• Improving measurement and outcome evaluation so all key indicators have baselines, and there is consistency between the Department’s objectives, indicators used in internal monitoring and those used in external evaluation.
• A more consistent approach to management information systems, especially the metrics used to assess the performance of targeting and payment.
b Transfers are a small part of the Department’s portfolio, and this may not reflect their potential, if well-delivered. To determine this, the Department should:
• Review transfers across its country network, and across business sectors, to identify the factors driving or impeding their use, and challenge country teams not using the approach.
• Share ongoing learning from cases where the Department’s transfer programmes, and those of others, have strengthened government commitment and capacity to introduce transfers.
• Clarify for country teams the level of evidence needed to support proposals for new pilot transfer programmes, given the strength of evidence available in other countries.

Transferring cash and assets to the poor Summary 11
c Electronic payment can be a more efficient and reliable method for delivering transfers to isolated populations. It is not yet widely used in the Department’s programmes, although there are further plans to do so. The Department should:
• Identify and address generic barriers and enablers to electronic payment, drawing on its experience, and communicate practical guidance around its network.
• Always evaluate the option of electronic payment, and where this is not available, consider how to reduce the risks and costs of manual systems.
d Some schemes are being rolled out to new areas before covering all those in need in pilot areas. Though expansion by partner governments partly represents donor success in influencing change, it can also bring risk and inefficiency. The Department should:
• State how it would address incompletely covered areas through retargeting, to address the inefficiency and inequity of patchy coverage, while considering affordability and political acceptability.
• Make sure that future pilots test complete transfer models which include arrangements for new entrants and leavers.
e The Department’s transfer programmes in Bangladesh had stronger links between transfers and complementary services than other programmes, and tracked impacts after transfers ended. The Department should:
• Ensure that initial design considers how impacts can be optimised and sustained; for example, by including training and support and providing services such as health and education, alongside the transfers.
• Learn from ongoing transfer programmes that show where integrating other services and support alongside transfers improves outcomes, and use this to design and improve other transfer programmes.
• Consistently evaluate whether people who no longer receive transfers experience sustained benefits.
f Transfer programmes in Ethiopia, northern Kenya and Bangladesh lack clear plans to move towards majority country government funding and ownership. The Department should:
• Express clearer strategies to work towards increasing government funding and ownership or, where this is not the aim, address the implications for sustained donor support.
• Evaluate the affordability of national implementation of transfer schemes, in the context of competing demands on country government resources.

12 Part One Transferring cash and assets to the poor
Part One
Expanding the use of transfers
Rationale for transfers
1.1 Transfers are support to poor and vulnerable people by providing regular or one-off, resources, distributed through agents such as government departments or non-governmental organisations. They are typically cash payments, food transfers or assets, such as livestock. Transfers differ from traditional development models which aim to strengthen services, like health or education, for poor citizens of developing countries (Figure 1). With transfers, people can use resources as they choose. Predictable transfers help them plan ahead and invest in their futures, as well as meet day-to-day needs. They can have a quicker impact on the lives of the poor. Transfers can be more quickly and transparently delivered than programmes to strengthen public services, but can also help people access such services, for example, by meeting transport costs or fees. Developing country governments, aid practitioners and donors, including the Department for International Development (the Department), are increasingly interested in what transfers can achieve.
1.2 Transfer programmes can have varied and multiple objectives, which cut across one or more of the Department’s traditional areas of activity. Poor households in low- and middle-income countries, face diverse risks such as crop and employment failure, natural disaster or illness, making it harder or impossible to improve their long-term standard of living.1 Transfers are generally targeted at the poorest households and at vulnerable groups, (the old, young and disabled) who often cannot access wider services.2 Transfers tackle household vulnerability and poverty by:
• Helping people maintain spending on food, healthcare and education in lean periods without needing to borrow, or sell assets like livestock.
• Allowing people to invest in productive assets to improve livelihoods.
• Supporting investment in children’s health and education to prevent passing on poverty to new generations.3

Transferring cash and assets to the poor Part One 13
Figure 1Transfers compared with traditional development aid
Source: National Audit Offi ce fi eldwork
Supporting the ‘Demand side’ through transfers(Transfer Programmes)
Supporting the ‘Supply side’ through public services (Traditional Development Aid)
Inputs Funding for transfers for beneficiaries
Funding for administration costs
Support for services Building Ministry capacity
Transfers for beneficiaries
e.g. Providing textbooks
e.g. Building classrooms
Value ChainOutputs
Loss through:
• inefficiencies in deliveryof training
• teachers dropping outof training
• teachers not deploying to rural/slum areas in greatest need
• teacher absenteeism from school
• teachers in school but not teaching
Government/Non-Governmental Organisation or Managing Agent
e.g. Food & nutrition
e.g. Health Services
Country Government Education MinistryUse funds for various purposes reflecting agreed objectives
Costs of school fees, uniforms, transport
BeneficiariesSpend transfers on various purposes reflecting choice and transfer objectives
Increased incomes and livelihoods…. and poverty reduction
Outcomes
Contributes to
Department’s Country Office
e.g. Training teachers
Time Lags
Net Teaching hours delivered
e.g. Access to Education
Increased pupil attendance at state (or low-cost private) schools
Increase in Net Teaching hours received in state schools
Improved course completion and attainment
Department’s Country Office
e.g. Investment in livestock

14 Part One Transferring cash and assets to the poor
Global experience of transfers
1.3 Transfers have mainly been used in middle-income countries which the Department does not aid. A growing body of research, mainly from countries such as Brazil, Mexico and South Africa, has examined cash transfer programmes such as grants to children, older people and families that have expanded since the 1990s.4 This shows both short-term and sustained poverty reduction to poor and vulnerable populations over the last ten years.5 Studies show that relatively small but sustained payments can have significant benefits. People tend to use money well, for example, on food, education, searching for work or using health services.6
1.4 Expanding cash transfer schemes in middle-income countries have generated government and donor interest in using the approach in low-income countries. A key issue for the Department over the last decade has been how to apply transfers to poorer and more challenging contexts in Sub-Saharan Africa and Asia. The Department has highlighted the limited evidence comparing benefits with costs and acknowledges that less is known about some transfer instruments (employment schemes) and outcomes in Sub-Saharan Africa.7
The Department’s use of transfers
1.5 Drawing on various sources (including centrally-commissioned research and other donors’ practice), the Department began implementing individual transfer projects in several countries in the early 2000s. Subsequently, the Department’s use of transfers has grown, but it remains a relatively small part of its bilateral (country-to-country) programme. It currently supports major transfer programmes in nine countries.8 Spending on social protection,9 which includes transfer programmes, doubled from £95.3 million in 2006-07, (4 per cent of bilateral spend)10 to some £192 million (Figure 2), (4.5 per cent of total bilateral spend)11 in 2010-11.12 Social protection comprises five spending classifications: social protection, social infrastructure/services, budget support, basic nutrition and food aid. The Department does not separately classify its spending on transfers within this total, nor do OECD classifications.
1.6 Growth in the Department’s transfer programmes was not underpinned by a specific strategy to develop and extend them, although there were commitments to expand social protection, which includes most use of transfers, in the 2006 and 2008 White Papers. From 2005, the Department responded to new transfer programmes by producing papers that reviewed global evidence on transfers, highlighting potential benefits and constraints. The papers did not state that transfers should be considered as a key component of country programmes. Since 2010, the Department has published a comprehensive review of evidence on cash transfers, and in October 2011 produced a guidance note for country offices on measuring and maximising value for money in cash transfer programmes. It has also funded development of a manual on cash transfers and social protection.13

Transferring cash and assets to the poor Part One 15
1.7 Some of the Department’s country offices have seen advantages to using transfers in their local contexts. In-country staff identify the most relevant objectives for transfer programmes in their countries as:
• reducing poverty and vulnerability;
• increasing access to, use of, and benefit from, services; and
• improving nutrition and food security.
1.8 Country offices also report barriers to implementation. Half of respondents from offices said a lack of administrative/delivery capacity of governments or implementing partners, and insufficient partner government resources, were barriers to implementation. Capacity barriers are not necessarily insurmountable; the Department supports large-scale transfer programmes in Bangladesh and northern Kenya without government financing or involvement in implementation.
Figure 2Department spending on social protection
Total spend (£m)
NOTES1 In agreement with the Department, we selected the most relevant classifications, wherein most transfer spending is captured.
2 Reduced spend in 2009-10 arose mainly from annual fluctuations in spend in Ethiopia, Bangladesh and Zimbabwe.
Source: Departmental management information
95.3 131.4 174.4 106.2 192.2
0
50
100
150
200
250
2006-07 2007-08 2008-09 2009-10 2010-11

16 Part One Transferring cash and assets to the poor
Projected use of transfers
1.9 In 2010, the Department changed the way it allocates money within its bilateral programme. A Bilateral Aid Review invited and evaluated bids from country teams stating indicative results that could be achieved, over the period 2011-12 to 2014-15, in priority sectors. Following the review, the Department plans some use of transfers in 16 of its 28 priority countries, with an emphasis on building sustainable, nationally owned systems.14 However, a lack of country-specific evidence and cost information led it to scale back plans in some countries.
1.10 Within the Bilateral Aid Review, transfers formed a key part of bids to address poverty, vulnerability and hunger.15 Take-up of bids was lower than in other sectors, though within this the Department accepted some higher-risk bids in fragile and conflict affected countries where it has not used transfers before. Our examination showed that:
• Bids for transfer programmes were defined principally in terms of volumes – the number of people to be reached – without consistent consideration of efficiency or effectiveness of delivery. By this measure, the Department’s total accepted offers would reach some 8.8 million recipients by 2015, though still only 3 per cent of those subsisting on under $1.25 per day (the internationally agreed poverty line) in priority countries.
• Accepted bids for transfers in seven countries, (Kenya, Bangladesh, Ethiopia, Zimbabwe, Uganda, Mozambique and Rwanda), exhibited common factors. These bids had a stronger base of existing transfers in the country, were able to produce some information on delivery costs, planned better evaluation of results and, in some cases, presented better evidence that the host government was ‘buying into’ transfers.
• In contrast, substantially less successful bids by three countries (Nigeria, Tanzania and Nepal), showed limited local evidence, relying instead on broader international experience, which reviewers questioned for relevance. Reviewers also identified inadequate or inconsistent information on delivery costs and implementation risks. Such bids were either rejected (Nepal) or scaled back for piloting.

Transferring cash and assets to the poor Part One 17
Scope of our study
1.11 We examined whether the Department is using transfers to reach the intended people, with the optimal level of support, in a timely way, at reasonable cost (Part Two) and whether it knows the short- and longer-term effects of its interventions on poverty and well-being (Part Three). We also examined whether transfer programmes are sustainable (Part Four). Our examination (Appendix One) covered the Department’s overall approach to transfers, drawing on detailed work in four countries where the Department has major transfer programmes; representing a projected £634 million of bilateral expenditure from 2004 to 2020 (Figure 3 overleaf).

18 Part One Transferring cash and assets to the poor
Figure 3Transfer programmes examined
Programme DFID share of lifetime cost
(£m)
Total Lifetime cost
(£m)
Dates Average annual total lifetime cost
(£m)
Other funders Main objectives Key implementing partners
Coverage
Bangladesh
Chars Livelihood Programme Phase 1
48 (100%) 48 2004 to 2010 8 None Sustainable livelihoods, food security
Private sector and NGO
Approx 250,000 people (55,000 households)
Challenging the Frontiers of Poverty Reduction
75 (63%) 120 2007 to 2013 20 Australia; Canada, Oxfam Netherlands; BRAC (Bangladeshi NGO)
Sustainable livelihoods NGO Approx 1.35 million people (270,000 households)
Chars Livelihood Programme Phase 2
70 (90%) 78 2010 to 2016 13 Australia Sustainable livelihoods Private sector and NGO
Approx 268,000 people (67,000 households)
Ethiopia
Productive Safety Nets Programme Phase 1
131 (7%) 911 (convertedfrom $1,427)
2004 to 2009 182 Six other international donors
Food security, reduction in vulnerability, community development
Government of Ethiopia
7.4 million people (1.5 million households)
Productive Safety Nets Programme Phase 2
213 (17%) 1,252 (convertedfrom $2,256)
2009 to 2014 250 Eight other international donors
Improved food consumption, increased productive assets; diversified source of income
Governmentof Ethiopia
8.3 million people (approx 1.66 million households)
Kenya
Hunger Safety Net Programme (phase 1 pilot)
31 (100%) (phase 2 expects to provide 59.1)
31 2007 to 2011 (phase 2 runsup to 2017)
8 None Improve access to food; protect assets; reduce the impact of shocks
Oxfam, Helpage, Equity Bank, World Bank, Australia
300,000 people(phase 1)
Orphans and Vulnerable Children Programme
25 (phase 2expects to provide 24)
No lifetimefigure available
2007 to 2011 (phase 2 runs up to 2017)
No figure available
Government of Kenya; World Bank
Promote fostering and adoption, child well-being, education, health and nutritional outcomes
Government of Kenya, World Bank, UNICEF
Total lifetime coverage unknown (54,938 households in 2011).
Zambia
Zambia Social Protection Expansion Programme
38 (52%) 73 (includesprojection forfinal 3 years)
2010 to 2020 7 Government of Zambia; Irish Aid; UNICEF
Reduce extreme poverty and inter-generational transmissionof poverty; improve child nutrition (child grant districts)
Government of Zambia
347,500 individuals (69,000 households)
NOTES1 Exchange rate conversion uses historic averages. Other sterling fi gures supplied by the Department.
2 Uneven annual spending and uncertain future projections for some programmes make it impossible to state the proportion of transfer spending covered by our analysis.
Source: National Audit Offi ce summarisation of departmental records

Transferring cash and assets to the poor Part One 19
Figure 3Transfer programmes examined
Programme DFID share of lifetime cost
(£m)
Total Lifetime cost
(£m)
Dates Average annual total lifetime cost
(£m)
Other funders Main objectives Key implementing partners
Coverage
Bangladesh
Chars Livelihood Programme Phase 1
48 (100%) 48 2004 to 2010 8 None Sustainable livelihoods, food security
Private sector and NGO
Approx 250,000 people (55,000 households)
Challenging the Frontiers of Poverty Reduction
75 (63%) 120 2007 to 2013 20 Australia; Canada, Oxfam Netherlands; BRAC (Bangladeshi NGO)
Sustainable livelihoods NGO Approx 1.35 million people (270,000 households)
Chars Livelihood Programme Phase 2
70 (90%) 78 2010 to 2016 13 Australia Sustainable livelihoods Private sector and NGO
Approx 268,000 people (67,000 households)
Ethiopia
Productive Safety Nets Programme Phase 1
131 (7%) 911 (convertedfrom $1,427)
2004 to 2009 182 Six other international donors
Food security, reduction in vulnerability, community development
Government of Ethiopia
7.4 million people (1.5 million households)
Productive Safety Nets Programme Phase 2
213 (17%) 1,252 (convertedfrom $2,256)
2009 to 2014 250 Eight other international donors
Improved food consumption, increased productive assets; diversified source of income
Governmentof Ethiopia
8.3 million people (approx 1.66 million households)
Kenya
Hunger Safety Net Programme (phase 1 pilot)
31 (100%) (phase 2 expects to provide 59.1)
31 2007 to 2011 (phase 2 runsup to 2017)
8 None Improve access to food; protect assets; reduce the impact of shocks
Oxfam, Helpage, Equity Bank, World Bank, Australia
300,000 people(phase 1)
Orphans and Vulnerable Children Programme
25 (phase 2expects to provide 24)
No lifetimefigure available
2007 to 2011 (phase 2 runs up to 2017)
No figure available
Government of Kenya; World Bank
Promote fostering and adoption, child well-being, education, health and nutritional outcomes
Government of Kenya, World Bank, UNICEF
Total lifetime coverage unknown (54,938 households in 2011).
Zambia
Zambia Social Protection Expansion Programme
38 (52%) 73 (includesprojection forfinal 3 years)
2010 to 2020 7 Government of Zambia; Irish Aid; UNICEF
Reduce extreme poverty and inter-generational transmissionof poverty; improve child nutrition (child grant districts)
Government of Zambia
347,500 individuals (69,000 households)
NOTES1 Exchange rate conversion uses historic averages. Other sterling fi gures supplied by the Department.
2 Uneven annual spending and uncertain future projections for some programmes make it impossible to state the proportion of transfer spending covered by our analysis.
Source: National Audit Offi ce summarisation of departmental records
20 Part Two Transferring cash and assets to the poor
Part Two
Reaching those in need with transfers efficiently
Global experience of targeting
2.1 Targeting is identifying and channelling benefits towards those in need. Effective targeting can save money by excluding the less needy and by maximising spending where it can make most difference, on the poorest and vulnerable. However, precise targeting can increase the administrative costs of identifying people, as well as costs to recipients, such as loss of productive time and intangible effects such as social tensions.16 Costs and demands on often limited administrative capacity and incomplete records in low-income countries, generally increase with precision targeting, requiring well-informed trade-offs.17
2.2 Targeting also needs to fit the programme purpose, such as poverty reduction for the poorest or improving child nutrition. Politics and social attitudes also intervene: in some countries there is less support for transfers to the productive poor than for the disabled, orphaned or elderly.18
Approaches to targeting
2.3 The eight programmes we examined in depth all used complex combinations of targeting methodologies (Figure 4 on pages 22 and 23). There was broad consistency in the approach and any inconsistencies were driven by different local circumstances.
2.4 Another important distinction in targeting is who an intervention is designed to reach (the eligible) and those who implementation actually reaches:
• The former concerns the categories of people to be reached, such as the elderly, the poorest or incapacitated, and why.
• The latter covers how recipients are identified and reached.

Transferring cash and assets to the poor Part Two 21
Performance on targeting
Coverage of programmes
2.5 For all programmes examined, the Department and its partners decided which regions, districts and communities to cover. Districts were generally selected using national data on poverty or food insecurity. These choices are driven by political decisions, government capacity constraints and decisions on affordability, which can be hard to untangle. As a result, programmes do not reach all of the poorest and potentially eligible. Also within selected areas, people meeting the eligibility criteria are excluded where numbers eligible exceed a pre-set quota, as in Ethiopia’s Productive Safety Net Programme.19
Selecting intended beneficiaries
2.6 Where evaluated, we found quantified evidence which showed that targeting methods were robust for the programmes we looked at:
• Independent evaluation of phase one of Ethiopia’s Productive Safety Net Programme in 2006 suggests that the scheme accurately targeted the most food insecure households, according to a number of criteria. For example, beneficiaries had assets worth between 42 per cent and 78 per cent less than non-beneficiaries.20 Targeting was unchanged in phase two.
• A 2010 independent evaluation of the Kenya Orphans and Vulnerable Children Programme (2007-09) found reasonably successful targeting –some 95 per cent of households met poverty criteria, with similar results reported in Zambia’s new Child Grant.21
• We found similar results for the Challenging the Frontiers of Poverty Reduction Programme in Bangladesh and the Kenyan Hunger Safety Net Programme.22 No quantitative targeting evaluation has been done of the Chars Livelihood Programmes in Bangladesh, although implementing partner verification checks concluded that targeting was robust.23
2.7 All eight programmes we examined included community-based targeting, whereby local people help decide criteria for eligibility and who meets them. Communities and beneficiaries in the four countries visited told us that community involvement in setting and applying criteria meant that decisions were transparent and accepted. We saw no evidence to suggest that targeting was unsound on programmes where targeting had not been systematically evaluated.

22 Part Two Transferring cash and assets to the poor Transferring cash and assets to the poor Part Two 23
Figure 4Targeting approaches
Targeting classification Bangladesh frontiers
of poverty
Bangladesh Chars Programme
Phase 1
Bangladesh Chars Programme
Phase 2
Ethiopia safety net Phase 1
Ethiopia safety net Phase 2
Kenya hunger safety net
Kenya orphans and vulnerable
children
Zambia social protection expansion
Level targeting is carried out
Initial selection of geographical areas (e.g. districts) for inclusion in the programme, based on relevant statistics, such as poverty or orphan numbers
Then, selection of households or individuals within selected areas
Who carries out targeting
Administrative targeting (i.e. by officials, usually applying defined categories (below))
Community-based targeting through informal local institutions or community groups
Self-selection by beneficiaries Those able
to workThose able
to workThose able
to workThose able
to work
Targeting approach used
Categorical targeting based on observable characteristics (e.g. disability, age, gender) Those unable
to workThose unable
to workTwo of
three pilotsChild grant
districts
Consensus ranking based on community observations of relative poverty One of
three pilotsNot child grant
districts
Proxies for poverty/wealth (proxy means testing/multiple proxy)
Full means testing of income or resources
Complete coverage of all within a location (e.g. all inhabitants of poorest locations where targeting would not be cost-effective)
Approach used for the whole programme Approach used for parts of the programme Approach not used on the programme
Source: Departmental documentation and National Audit Offi ce fi eld visits

24 Part Two Transferring cash and assets to the poor
Costs of targeting
2.8 Decisions about choice of targeting method also need to consider cost information. In general, costs of gathering information increase with more precise targeting. It is possible to compare the efficiency of different targeting methods, as in a 2008 report on targeting in the Zambia Social Protection Programme,24 but in most programmes, we did not find analyses balancing the costs of targeting against spending on transfers.25
Timely and predictable transfers
2.9 Ensuring timeliness of transfers is important, to give people confidence to plan their use and to maximise their effectiveness; for example, by investing in livestock or sending children to school. Performance reports of the Productive Safety Net Programme compiled by the Ethiopian Government, with inputs from all donors, have highlighted problems with transfer delays. Data from 2010 shows large differences in the time taken to transfer funds for manual cash transfers from federal to local government across different regions. Although data are not available for all regions, time taken ranged from 22 to 88 days across regions.26
2.10 In the absence of standard management reports on payment timeliness and predictability for Kenya’s Hunger Safety Net Programme we tested whether information systems could supply this. The information showed that about half of payments made in March/April 2011 were delayed until May/June. Transfer delays were not previously reported because the payment provider recorded payments as having been made within two months of the completion of preparation, rather than within the two-month period when people should have received transfers. Significant delays in payment appeared to have occurred in three of the thirteen payment rounds, though further analysis was required given these measurement difficulties.
Capturing data on transfer costs
2.11 When requested, the Department and its partners produced the breakdown shown in Figure 5, showing that direct costs are available. However, we did not find that such cost data was routinely analysed. Full costs are not generally captured;27 for example, the Department does not systematically capture and analyse government officials’ salaries, nor the impact on their other responsibilities. Neither does it spread the cost of set-up activities or capital items over their useful lives rather than when they were incurred. Figure 5 thus gives partial insight into what the full costs of programmes would be in the long term.

Transferring cash and assets to the poor Part Two 25
Figure 5Transfer programme costs in four countries
Programme Transfers to beneficiaries
Other services to beneficiaries
Cost of delivering transfers
Central overhead activities
(£m) (%) (£m) (%) (£m) (%) (£m) (%)
Bangladesh Chars Livelihood Programme (July 2010–June 2011)
The Department’s costs 5.37 61 1.45 16 0.19 2 1.86 21
Partner costs 0.60 77 0.16 20 0.02 3 0.00 0
Total costs 5.97 62 1.61 17 0.21 2 1.86 19
Bangladesh Challenging the Frontiers of Poverty Reduction (January–December 2010)
The Department’s costs 7.55 38 8.39 42 2.55 13 1.43 7
Partner costs 2.17 38 2.40 42 0.73 13 0.41 7
Total costs 9.72 38 10.79 42 3.28 13 1.84 7
Ethiopia Productive Safety Net (2010-11 actual)
The Department’s costs 36.00 70 10.40 20 5.10 10 0.00 0
Partner costs 181.52 78 33.00 14 18.15 8 0.00 0
Total costs 217.52 77 43.40 15 23.25 8 0.00 0
Kenya Hunger Safety Net (July 2010–June 2011)
The Department’s costs 4.88 69 0.00 0 0.47 7 1.71 24
Partner costs 0.0 0 0.00 0 0.00 0 0.00 0
Total costs 4.88 69 0.00 0 0.47 7 1.71 24
Kenya Orphans and Vulnerable Children (July 2010–June 2011)
The Department‘s costs 3.46 87 0.00 0 0.07 2 0.47 11
Partner costs 9.50 87 0.00 0 0.19 2 1.26 11
Total costs 12.96 87 0.00 0 0.26 2 1.73 11
Zambia Child Grant (2011)
The Department’s costs 1.10 48 0.00 0 0.30 13 0.90 39
Partner costs 1.70 46 0.00 0 0.40 11 1.60 43
Total costs 2.80 47 0.00 0 0.70 12 2.50 41
NOTE1 Ratios should be interpreted with care because programmes vary in their scope and stage reached, the type of transfer, and implementing partners used.
Source: National Audit Offi ce collation of Department data
26 Part Two Transferring cash and assets to the poor
2.12 The most extensive analysis of costs was in the 2010 evaluation of the 2007–2009 pilot programme for orphans and vulnerable children in Kenya, which included partner costs and cost-transfer ratios and attempted to distinguish initial set-up and roll-out costs from long-run continuing costs. It noted that the programme’s administrative costs, at 34 per cent of transfer value, were not directly comparable to costs from other countries.28 Government officials consider 34 per cent an overestimate, caused by wrongly incorporating one-off and set-up costs, and instead estimated long-term overheads at 15–20 per cent.29 A cost analysis of the Zambia Social Protection Programme from 2004-2008 calculated administration cost ratios ranging from 9.1 per cent to 26.6 per cent across five pilot districts. The analysis excluded partner government staff costs and did not differentiate set-up from continuing costs.30
Benefits of electronic payments
2.13 Globally there has been growing recognition that electronic payments can be an efficient and reliable delivery method, reaching previously financially excluded populations.31 Of 40 transfer programmes launched globally in the past decade (mostly in middle-income countries) almost half use electronic payments.32 One of the eight programmes we examined, in Kenya, used electronic payments, (Figure 6 on pages 28 and 29), though three more had planned or started procurement of systems.33
2.14 Manual payment arrangements are inherently prone to inefficiency and risk, particularly in isolated rural areas lacking banks (Figure 6). In Zambia’s Western Districts, where the Department supports delivery of child grants, difficulties include:
• Using local teachers and nurses as payment managers, diverting them from their core responsibilities and imposing hidden costs.
• Journeys for payment managers of up to six days to and from the nearest bank to collect cash. Officials stated that this had not led to theft or attacks, but acknowledged the risk.
• Weak standards for identifying beneficiaries, with dependence on hard-to-verify manual thumbprints and observation by community representatives to confirm that only eligible people collect payments.
• Basic and slow accounting, which relied on collating and reconciling manual schedules.

Transferring cash and assets to the poor Part Two 27
2.15 Conversely, the Hunger Safety Net Programme in Kenya delivers electronic payments using mobile terminals operated by local traders, and Smart Cards presented by beneficiaries. Key advantages of the system include:
• A much reduced burden on local officials, with less risk of fraud by those in authority.
• High standards of beneficiary identification using automated fingerprint scanners.
• Flexibility for beneficiaries to collect when they are able, or to hold balances on their card as savings.
• Automated, near-immediate accounting and platforms for delivering further government or financial services. The Department is considering delivering insurance against loss of livestock due to drought through the card, and Kenya’s Government is negotiating to use it to deliver other transfers.
2.16 Enabling electronic payment in low-income countries is a challenge. Early evaluations of the Kenyan scheme indicate that electronic payment is working well, though small numbers of people report problems with replacement of lost or defective cards, or identification of degraded fingerprints.34 Transaction fees are affordable, in the region of £1 per £17 payment.35 However, there are important requirements before electronic payments can be used:
• Providers must be ready to engage with poor and remote communities. The Department’s provider in Kenya is Equity Bank, an institution involved in small-scale finance and promoting mass banking. The commercial sector in Kenya is relatively vibrant, by Sub-Saharan African standards.
• A strategy for helping people in need beyond the practical reach of a bank network. Equity Bank has emphasised the need for a regulatory framework so accredited local traders can offer basic banking services. This is an opportunity the Bank has taken in Kenya but found unavailable in countries like Uganda. The Department has played a wider role in increasing access to financial services in Kenya, helping establish the enabling environment within which the Hunger Safety Net Programme’s electronic transfers could later be introduced.
• For a successful financial inclusion strategy beyond branch and ATM networks, a functioning, affordable and accessible mobile telephone network.

28 Part Two Transferring cash and assets to the poor Transferring cash and assets to the poor Part Two 29
Figure 6Examples of manual and electronic payment systems
Source: National Audit Offi ce fi eldwork in Kenya and Zambia
The Department (Lusaka)
The Department (Nairobi)
Community Representative
Beneficiary (or nominated substitute)
Beneficiary (or nominated substitute)
Pay Manager (Community teacher or nurse)
One pay point per community
Government Ministry
Government Ministry (Nairobi)
Nearest branch bank
Government district office
Bank Data Centre
Bank Branch
Manual Transfer Payment: Child Grant in Western Zambia Electronic Payment: Hunger Safety Net in Northern Kenya
Funds Funds
Funds
Funds
Management information Management information
Pay Manager: (2) returns with cash and beneficiary entitlement list.
Round trip up to 5 days to/from rural areas
Representative: (2) Observes payment, confirms beneficiary identity and receipt.
Representative: (1)Travels to notify recipient that transfer has arrived
Pay manager: (1) takes manual records of previous payments
Recipient provides manual thumbprint and collects cash at specified pay point
Payment records
Payment details
Electronic data exchange
Trader periodically replenishes cash
Recipient collects cash at any pay point on any date after availability
Recipient presents smart card and finger for biometric check
Movement of people/funds Movement of people/funds/electronic data Information flow Information flow
Pay Points
Local traders with electronic terminal
(Recycle business takings into cash for transfers. Credited at bank)

30 Part Two Transferring cash and assets to the poor
Managing expansion
2.17 Part of the Department’s role in supporting transfer schemes is to gain partner governments’ support for wider implementation of effective schemes nationally, and to reinforce commitment to social protection for the poor. Pilots are useful to show that payments can be delivered, and meet objectives, and illustrate how national implementation might work. In practice, though, moving from local pilots to regional or national implementation poses challenges.
2.18 In Kenya, the Department has supported pilots for cash transfers to orphans and vulnerable children since 2006 in parts of seven districts particularly affected by HIV and AIDS. Before evaluation of the pilot, the Kenyan Government extended partial coverage to 30 more districts, and then to 60 of the 72 districts in the country by mid-2011, at its own cost. The basic design of the pilot scheme carried forward key limitations into the rolled-out programme:
• Many new orphan households have been created since beneficiaries were selected in 2006-07, but there are no plans to enrol new entrants. In Kenya’s Homa Bay pilot district, officials said that new orphans now exceed those included. There is a budget trade-off between targeting new geographical areas and enrolling new households in existing areas. Nonetheless, a comprehensive programme needs a system for keeping enrolment up to date.
• The Department-supported pilot districts remain partially covered; households in only a minority of localities receive payment and the Department lacked information on the extent of gaps. At the time of our work there were no specific proposals in place for ‘back-filling’ to achieve complete coverage.
• Attempts in the pilots to test the effectiveness of education conditions had not worked well, leaving less-informed the choice of whether to include conditions in an upscaled scheme.36
2.19 In 2011, the Government of Kenya announced major increases in resources for social protection, including for orphans and vulnerable children.37 However, there was no evidence of assessments of the costs to efficiency, of expanding the programme nationwide leaving coverage in areas with the highest levels of orphans incomplete. Geographical expansion across political constituencies broadens support for schemes, but also limits the option to increase transfer payments, in the face of rising food prices.38
2.20 Such challenges are not unusual. In Zambia, the Department and other donors resisted government pressure to expand the social protection programme faster than seemed wise, given levels of administrative capacity and the need to test newer features. The partners capped the programme at 15 districts and agreed a gradual roll-out.39 In Ethiopia, the Department told us that the Productive Safety Net Programme started without piloting because the Ethiopian Government wanted to cover as many people as possible from the outset.40

Transferring cash and assets to the poor Part Three 31
Part Three
Impacts of transfers
3.1 The Department has put significant effort into evaluating the impacts of transfer programmes, and results show clear benefits for the income and consumption of poor people. Evidence of longer-term impacts on aspects like peoples’ health and education are more mixed, in part reflecting more limited evaluation evidence. Cost-effectiveness is less well understood.
3.2 Transfer programmes globally often have multiple objectives and a range of potential impacts, including unexpected wider effects.41 The clearest effects are immediate ones on household income and consumption, typically of food. There is less extensive, but growing, evidence about longer-term effects on nutrition, education and health. Impacts on local economies, economic growth and social cohesion are more indirect.42 We found similar levels of evidence in the eight Departmental programmes we examined, three of which are too new to demonstrate conclusive long-term impacts.
Effects on income, consumption and well-being
3.3 Overall, where the Department’s programmes have been running long enough for evidence to emerge, evaluations show clear benefits (Figure 7 on pages 32-34). Short-term impacts are evident on aspects such as household diet, expenditure and investment. Evidence also appears positive, if generally less statistically robust, for longer-term effects like improved livelihoods, health and education. There has been independent evaluation of four of the eight programmes we examined, showing positive change in five out of seven of the Department’s headline objectives, with the other two showing mixed results (Figure 7).

32 Part Three Transferring cash and assets to the poor
Figure 7Evaluation evidence
Programme Department’s objective indicators to measure impact on beneficiaries
External evaluation Department/delivery partner evaluation
Direction of
impact
Key findings Directionof
impact
Key findings
Bangladesh Chars Livelihoods Programme, Phase 1
Increased income and expenditure
Average income increase due to the programme is 19 per cent to 36 per cent for 2007 and 2008 joiners (***)
Increases in average real income between the time they joined the programme and September 2009 ranges from 15 per cent for current beneficiaries to 66 per cent for earlier joiners (who have now left the 18 month programme)
Increased resilience to shocks
Includes references to internal report findings (see right hand column), corroborated by interview testimony
Only 660 beneficiary families out of 11,200 surveyed evacuated their homes in the severe 2007 floods
Increased well-being
Increase in; family planning of some 28 per cent, access to tubewells of some 35 per cent and access to latrines of some 55 per cent between 2008 and 2011 for people who joined the programme in 2009
Reported food shortages fell on average 26 per cent between 2007 and 2009. By 2009, households reporting food shortages declined to less than 15 per cent
Analysis of children and women’s health outcomes did not look at change over time
Increased social capital and prevention of illegal social practices
Marriage and dowry payments have remained largely unchanged
Evidence from a one-off survey published in 2009 showed 90 per cent of current beneficiaries reported feeling more respected by others in the community compared to 64 per cent prior to joining the programme
Reported feeling of increased social status ranging from 42 per cent to 55 per cent. Earlier joiners have higher reported social status than current beneficiaries

Transferring cash and assets to the poor Part Three 33
Programme Department’s objective indicators to measure impact on beneficiaries
External evaluation Department/delivery partner evaluation
Direction of
impact
Key findings Directionof
impact
Key findings
Bangladesh Challenging the Frontiers of Poverty Reduction, Phase 2
Increase in productive assets
Livestock values increased on average by 14 times as a result of the programme between 2007 and 2009 (***)
Average increase in value of productive assets because of the programme is 142 per cent between 2007 and 2009
Increase in health outcomes for women
Not covered 29 per cent of women who received assets achieved an increase in Body Mass Index (BMI) of at least 1 unit
Increase in health outcomes for children
Not covered 39 per cent of boys and 34 per cent of girls gained weight above the average
Increase in primary school enrolment for children
Not covered Programme does not have a visible impact on primary education in the short term (2007-2009). Primary enrolment rates only 1 per cent more for beneficiaries than non-beneficiaries and drop out rates 1 per cent less. Overall, enrolment has increased for both groups (†)
Kenya Orphans and Vulnerable Children Programme
Increased number of beneficiary households receiving cash transfers
30,315 households were receiving financial support by mid-2009
Total number of beneficiary households is 54,938 in 2011
Increased number of beneficiary orphans aged 6-17 years enrolled in school
No evidence of increased enrolment in basic schooling, where levels were already 88 per cent
Secondary school enrolment increased 6 to 7 percentage points more in programme than non-programme areas (**)
Draws on data from external evaluation

34 Part Three Transferring cash and assets to the poor
Figure 7 continuedEvaluation evidence
Programme Department’s objective indicators to measure impact on beneficiaries
External evaluation Department/delivery partner evaluation
Direction of
impact
Key findings Directionof
impact
Key findings
Ethiopia Productive Safety Net Programme, Phase 1 and 2
Sustained increase in access to sufficient food (number of months out of the last 12 that households could easily satisfy food needs)
A 2011 study showed that where the household food insecurity was typically 3 months per year, at the average transfer level food security increased by an average of 0.88 months (varied across regions from 0.18 months in Oromiya to 1.56 in Tigray) (*)
A 2008 survey indicated that high levels of transfers and access to other food security programmes improved food security by 0.5 months between 2006 and 2008
Increase in child nutrition
Not covered Beneficiaries increased calories consumed by 16.7 per cent in comparison to non-beneficiaries
Key
Increase in indicator *** Statistically significant at the 1 per cent level (p<0.01)
Decrease in indicator ** Statistically significant at the 5 per cent level (p<0.05)
No change in indicator * Statistically significant at the 10 per cent level (p<0.1)
> 1 arrow Multiple sub indicators † Test for statistical significance carried out
Not measured
NOTE1 Statistical signifi cance at the 1 per cent level means the fi nding will only occur by chance one time in 100. This becomes one in 20 and one in 10 for
the 5 and 10 per cent levels respectively.
Source: National Audit Offi ce summarisation of Departmental documentation and external and delivery partner evaluations

Transferring cash and assets to the poor Part Three 35
3.4 Overall, the Department has obtained some extensive and sophisticated tracking of effects, using comparisons against groups which had not received transfers. This is more robust and independent evaluation than in other areas of the Department’s work, enabling better evidenced conclusions on results and attribution. Nevertheless, issues remain. Of ten evaluations examined,43 only eight had a control group comparing beneficiaries with non-beneficiaries over time. All used a baseline (the position before the programme started) for at least some of the indicators, but three did not have baselines for all indicators. We found some inconsistencies between the Department’s intended indicators, its internal reporting, and the measures used in independent evaluation.
3.5 Some of the most extensive evaluation has been of the Bangladesh Chars Livelihoods Programme for people living on isolated river islands (chars), supported by the Department since 2004. There are good results for the objectives of increasing resilience to floods and hunger, and increasing incomes, including indications that this is sustained after transfers cease. Food security has also increased,44 allowing people to spend a greater share of their budget on non-food items to build resilience, through accumulating livestock, savings or making loan repayments.45 Current beneficiaries, who joined in 2010, told us they can already spend more on clothing, medicine and children’s education because of increased incomes generated from their assets.46
3.6 The Kenyan Orphans and Vulnerable Children Programme aims to encourage fostering of children and promote their development, for example, by encouraging school attendance. The Department’s indicators for this programme (Figure 7) poorly capture the full objectives of the transfer scheme. However, data for 2007 to 2009 showed that while transfers had not increased fostering, they had led to a 13 percentage point difference in poverty levels47 between beneficiary and control group households. The programme has increased food consumption and dietary variety. Beneficiary households told us that after initial spending on school uniforms and food, they increasingly invested in small business activities, livestock and cultivation.48 Besides effects on enrolment (Figure 7) there were significant impacts on secondary school attendance in poorer and smaller households. There was no conclusive evidence of any increased health spending and improved health indicators, such as child growth and nutrition. However, trends appeared to be in the right direction and were usually better than in control areas.49 Early evaluation of Kenya’s Hunger Safety Net Programme, which began in 2010, is under way, but results are not yet available.

36 Part Three Transferring cash and assets to the poor
3.7 In Zambia, the Department’s current transfer programme began in 2010. Full evaluation will be available in 2013. In 2008, the Department evaluated earlier pilots in three districts where it supports transfers to reduce extreme poverty among the poorest 10 per cent of people.50 The evaluation was hampered by a lack of baseline data from the start of the pilots (a problem not repeated in the evaluation of the current transfer programme), and complicated by differences between the districts, such as land ownership and poverty, and between transfer schemes. However, data showed that transfers had increased consumption spending by at least 50 per cent for beneficiaries, compared with non-beneficiaries. Evidence of improved school attendance was limited to one district where a higher transfer was provided specifically to support participation in education.51
Optimal level of transfers
3.8 A key, and complex, decision in designing and managing a transfer scheme is setting the amount at a level sufficient to achieve the desired outcomes, while conserving heavily-constrained budgets and ensuring political acceptability. People’s vulnerability can be more strongly reduced if their income and assets exceed particular levels, commonly described in research as ‘thresholds’. Higher transfer levels may be worthwhile if they have a more transformative effect on poverty.52 Globally, some transfer schemes have had limited impact due to insufficient values, and transfer levels have been a key issue in the Department’s schemes we examined.53
3.9 We found limited evidence about optimal transfer levels in the eight programmes we examined. A 2011 evaluation of the Ethiopian Productive Safety Net Programme suggests varying levels of impacts on food security, livestock and other assets, given the different wages earned by recipients.54 One non-governmental organisation-led programme in Bangladesh incorporated experience on transfer levels from a previous government programme, establishing four transfer packages tailored to meet differing needs of people in varying degrees of poverty.55 A 2009 review compared the impacts of the four different transfer packages, but did not evaluate relative cost-effectiveness.56 However, in most cases Department-supported schemes have flat-rate transfer levels, informed by the cost of average household monthly food/consumption needs (Figure 8).
3.10 The programmes we examined did not analyse different transfer amounts, to assess whether these had different scales of intended impacts on the same people. Fully testing different transfer values would make piloting more expensive and complex, and can add to existing ethical issues over treating people differently. The Government of Ethiopia commissioned consultants to pilot prevailing transfers over different durations (three, six or nine months annually) in the Productive Safety Net Programme. The consultants report listed unquantified challenges and benefits and suggested applying different durations from 2011.57 In our view, programmes have been under-informed about how transfer values may be a key driver of cost-effectiveness.
Transferring cash and assets to the poor Part Three 37
Figure 8How transfer values were set and adjusted
Programme Basis of transfer calculation Transfer value Changes to transfers over time
Bangladesh
Chars Livelihood Programme Phase 1
Not recorded Initial package (2005-06) was an asset worth 13,000 Taka on average (approximately £112) per household plus a monthly cash stipend of 400 Taka (approximately £3.50) for first six months and 300 Taka (approximately £2.50) for following 12 months
Transfers increased and in 2008-09 the average asset value was 17,000 Taka and stipends were 600 Taka for first six months and 350 Taka for the next 12 months
Chars Livelihood Programme Phase 2
Not recorded Initial package (2009-10) was an asset worth 15,500 Taka on average per household, plus a monthly cash stipend of 600 Taka for first six months and 350 Taka for the next 12 months
None to date
Challenging the Frontiers of Poverty Reduction
The Asset transfer value varies up to a maximum dependent on personal capacities, household circumstances and local market conditions
Assets transferred ranged from 6,000–12,000 Taka (approximately £44–£88), plus a cash stipend of 10–15 Taka (less than £1) per day for around 18 months
The stipend increased to 25 Taka per day for all beneficiaries in 2008. Changes to asset prices not known
Ethiopia
Productive Safety Nets Programme Phase 1
Set at a level equivalent to recipients’ basic food needs and similar to previous years’ emergency food rations
6 Birr (approximately £0.50) or 3 kg grain per day of labour on employment schemes. Equivalent for incapacitated recipients who are not required to work for the transfer
Increased to 8 Birr in 2008 and 10 Birr in 2009
Productive Safety Nets Programme Phase 2
As above 10 Birr or 3 kg grain. Equivalent for incapacitated recipients who are not required to work for the transfers
None to date
Kenya
Hunger Safety Net Programme Phase 1 pilot
Based on the cost of meeting basic consumption requirements using five-year average staple food prices
2,150 Kenyan Shillings (approx £15) per household every two months
Increased to 3,000 Shillings every two months in September 2011
Orphans and Vulnerable Children Programme
Not recorded Ranges from 1,000 Kenyan Shillings per month (approximately £7.50) for one child to 2,000 Kenyan Shillings for three or more children
None to date
Zambia
Social Protection Expansion Programme
Based on the annual average price of a 50kg bag of maize, which allows a family of 6 at least a second meal a day
47,500 Zambian Kwacha per month (approximately £6) per household
Increased by 10 per cent in 2011
NOTE1 Exchange rate conversions to sterling use oanda.com historic averages. All other sterling fi gures are as supplied by the Department.
Source: Department documentation

38 Part Three Transferring cash and assets to the poor
3.11 With fixed levels of transfer in place, two recurrent issues arise:
• Steep increases in local and global food prices have caused major reductions in the buying power of cash transfers.58 Transfer schemes do not automatically adjust payment levels, even where this had been planned at business case stage, as in Kenya. An increase in the cash transfer is planned to align transfer rates with another scheme. Donors and governments sometimes respond with periodic increases. In Ethiopia, the public works wage rate has increased but lagged behind food prices. The daily wage rate for public works (Figure 8) was enough to purchase the intended 3 kg of maize in only 47 per cent of local markets in 2010.59
• A single amount is usually set for all households regardless of size or local context, for administrative simplicity. Evaluations reported variable impacts by household size60 and in different parts of the country.61
Integrating transfers with complementary support
3.12 Some Department-supported programmes include transfers in a package of support. Including complementary interventions in one scheme can enhance effectiveness. The Department supports two programmes in Bangladesh that couple transfers with services like healthcare, and savings and loans. The current phase of the Productive Safety Net Programme in Ethiopia increasingly integrates transfers with training and support in agriculture and small business management. We did not see such direct integration of transfers with complementary services in Kenya and Zambia, though the Department intends to include services like drought insurance in the same electronic payment system, in Kenya’s Hunger Safety Net Programme.
3.13 An obstacle to progress in integrating transfers with other support is the lack of a single registry, or database, of beneficiaries across different programmes. This makes it difficult to assess whether transfer beneficiaries are also receiving complementary or duplicated services like livelihoods training, from different agencies or aid donors. Fragmented delivery of social transfers and services is a concern in countries like Kenya, where three Ministries and a range of donors deliver support, and informed commentators see a single registry as part of the solution.
Measuring cost-effectiveness
3.14 The Department is relatively well-informed about the impacts of its programmes. However, good management also includes assessing the cost of achieving impacts, against targets or alternative options, and responding accordingly. Here the Department is less well-informed. Analysis of cost-effectiveness lags behind the assessment of impacts, due mainly to incomplete or inconsistent collation and analysis of costs.
3.15 The limited quantified assessment of cost-effectiveness partly reflects general practice in the Department when the transfer programmes we examined were proposed. Since the Department issued guidance in February 2009, the use of cost-benefit analysis in project appraisals has increased; to six of the seven transfer programmes designed since this point. These six examples showed elements of good analysis, but lacked
Transferring cash and assets to the poor Part Three 39
a consistent approach.62 Since January 2011, as part of an increased focus on value for money, the Department has required more rigorous business cases, comparing alternative options for delivering the proposed outcomes. We examined the two business cases for proposed transfer programmes submitted by September 2011. Both proposed support for transfer schemes already designed and led by multilateral agencies, and so reflected the strengths or limitations of the design choices taken by those partners rather than the Department. However, we found increased comparison of costs and benefits, against either a do-nothing counterfactual or between delivery options. Parts of the comparisons were quantified, other elements more qualitative.63 The Department produced in October 2011 a guidance note to encourage the systematic and consistent use of cost-effectiveness and cost-benefit analysis in transfer programmes.
Comparing transfers with other options
3.16 Well-evidenced comparisons between the cost-effectiveness of transfers and alternative types of intervention are rare, both in the Department’s programmes and in published research, although there are some examples.
3.17 The Department’s business cases for cash transfers to alleviate hunger usually project improved cost-effectiveness compared with traditional use of ‘in kind’ food supplies, using evidence from other schemes. For example, analysis of World Food Programme interventions in Malawi and Bolivia indicated that food aid is cheaper to deliver than cash transfers, because donors can buy and distribute food at lower cost than in local markets. However, when wider factors are considered, such as how people use cash to stimulate local agricultural production, cash transfers become more cost-effective than food aid.64 Our discussions with beneficiaries showed a strong preference for cash transfers, except where the value of the cash transfer had fallen relative to food prices. People identified problems with the availability, flexibility and dietary acceptability of food aid.65
3.18 The Department used a simple economic appraisal carried out by the World Bank when producing its proposal for the current phase of the Ethiopian Productive Safety Net Programme. This assessed the proposal against continuing to rely on emergency food aid. The projections made assumptions about the incidence and severity of droughts, and how people would progress from dependence on transfers, estimating savings at some $500 million over a six-year period. When asked, the Department could not provide evidence of how the World Bank had calculated this. The average number of people receiving food aid between 1994 and 2003 was 5.5 million, peaking at 12.3 million in 2003.66 Emergency food aid has continued, but the Department has not tracked how far changes in the take-up of food aid in programme areas can be attributed to the Safety Net Programme.
40 Part Three Transferring cash and assets to the poor
3.19 In 2008, an independent cost-benefit analysis of the Challenging the Frontiers of Poverty Reduction Programme calculated that the benefits were worth at least five times the cost.67 The analysis compared the costs to three other ultra-poor programmes in Bangladesh, including forecasted cost changes as the programme moved to a steady state. Although the methodology had to make important assumptions, it shows that cost–benefit analysis can be done on transfer programmes. In 2009, the Department carried out a cost-benefit analysis to appraise the second phase of the Chars Livelihoods Programme, calculating the benefits of continuing the programme as worth four times the cost.68
Comparing design options within transfer programmes
3.20 On the programmes we examined we found little quantified comparison of design options. One 2008 study in Zambia modelled the full targeting costs per beneficiary against reductions in poverty, to compare the cost-effectiveness of different targeting approaches.69 This evidence has since been used to recommend changes to the targeting methodology on the Zambia Social Protection Expansion Programme. The evaluation of Zambian cash transfers (introduced from late 2010) included plans for a cost–benefit analysis, with a systematic breakdown of the costs of delivering the transfer.70 However, though work on impacts began with a baseline survey in 2010, data gathering for cost collection and analysis has been deferred for a further year while the programme beds down and a new payment system is introduced.71

Transferring cash and assets to the poor Part Four 41
Part Four
Sustainability of transfer programmes
4.1 The Department normally supports development by delivering programmes through country government departments and agencies, but this is not always practical. In countries like Zambia, which are reaching or nearing middle-income status, the Department’s support for programmes is finite. Even in poorer countries, indefinite support from donors is not assured. Not all transfer programmes have set out a clear route to national implementation and funding. The Department supports developing management information systems for transfers, but these systems focus more on achieving targets of beneficiary numbers than the performance of targeting and payment services.
Affordability and capacity to deliver
4.2 The Department does not deliver programmes using its own staff. It supports a range of delivery partners to implement transfer programmes; including government departments, international and local non-governmental organisations, and private sector agents. The choice is usually driven by the country context and availability of capable partners. For example, in northern Kenya local government lacks capacity to deliver services, including transfers, and international non-governmental organisations have built up their capacity instead. In contrast, the Productive Safety Net Programme is run by the Government of Ethiopia, which has stronger local capacity to deliver.
4.3 Country government commitment to funding transfer programmes varied greatly across the programmes we examined. Zambia’s Finance Ministry has agreed to fund increasing spending on transfers over the next decade, and the Department is confident that rising government revenues can meet this cost. In Kenya the Government has already greatly expanded the Orphans and Vulnerable Children’s Programme beyond Department-supported pilot districts using national resources. The Government of Ethiopia manages the current Productive Safety Net Programme, but has not committed to longer-term domestic financing of it. The long-term status of the Programme is unresolved and donors remain concerned that most people will not be food-secure by the time the programme is scheduled to end in 2014. The Department’s programmes in Bangladesh are generally not delivered through, or funded by, the Government, which supports other transfer schemes. The Government provides staff, accommodation and some financial contributions to delivering the Chars Livelihoods Programme. The Department is working with other donors to support the Government to develop a comprehensive social protection strategy encompassing all transfer schemes, but no clear plans are in place yet.

42 Part Four Transferring cash and assets to the poor
4.4 The wider context is challenging. In Kenya and Zambia the Department’s business cases considered programmes to be affordable when implemented nationally because the cost of the transfers themselves lay within 0.3-0.5 per cent of Gross Domestic Product (GDP) or 2 per cent of government budgets. However, transfers sit within a wider context of affordability challenges. The costs of complete basic welfare systems, including social transfers, are estimated at 2 to 6 per cent of GDP. Research in 2011 using 2006-07 data has indicated shortfalls against social protection commitments as high as 93 per cent in five African countries, including 88 per cent in Kenya and 75 per cent in Ethiopia.72 Securing longer-term government commitments to spending on transfers requires increases in the resources available for social sector programmes, requiring difficult choices to reallocate scarce resources away from programmes not targeted on the poor, such as defence, or from other programmes such as health or education. Though evidence of impact can help to mobilise resources for transfer programmes, there are complex political challenges. The overall sustainability of funding for social protection, within which transfers sit, remains problematic.
4.5 Working with governments can help to strengthen government administrative capacity and build commitment to fund transfer programmes from national budgets, increasing the likelihood that programmes will be sustained after donor support has gone. The programmes delivered through government all included donor-funded capacity building. Where government capacity is weak, building capacity takes time and progress is not guaranteed. For example, transfer delivery in Ethiopia had more delays in 2010 than in 2008 or 2009, and the predictability of transfers is key to programme effectiveness.73 In Kenya, the Department has funded a Secretariat in the relevant ministry in Nairobi to oversee delivering the Hunger Safety Net Programme. It remains unclear whether local government will be able to take over service delivery from non-governmental organisations.
Financial management and risk
4.6 Good financial management in delivery partners gives assurance that funds have been used for their intended purpose. In some cases financial management remains weak and manual payment systems increase inherent risk. The Department is supporting the Government of Ethiopia to improve its financial management. However, audit reports continue to highlight some systemic and recurring internal control issues and differing rates of progress across the country.74 In Kenya in 2011, against a background of frauds in the Education Ministry,75 the Department obtained a fiduciary risk assessment of the Orphans and Vulnerable Children Programme. This showed a lack of:
• complete programme audits, regular financial reporting and monitoring and of systematic oversight of assets and resources;
• a functioning grievance and complaints system, relative to power held by district officials; and
• follow-up and implementation of previous fiduciary risk assessments.

Transferring cash and assets to the poor Part Four 43
4.7 Surveying beneficiaries can identify corruption and help manage it. From 2006, the Chars Livelihoods Programme surveyed the satisfaction of workers, focusing on levels of attempted and successful corruption. In response, the managing agents disciplined or blacklisted service deliverers found to be corrupt. Other measures included greater transparency on wage rates and a 24-hour telephone helpline for queries. By 2008, only 0.06 per cent of workers surveyed reported demands for ‘kickbacks’ compared to nearly 20 per cent in 2007.76
Operational management information systems
4.8 Sustainable transfer programmes also require timely and relevant management information on day-to-day performance. Comparison between districts and over time can identify anomalies and differences in efficiency, providing an informed basis for action. Key measures of system performance include:
• The number of beneficiaries being found ineligible, the reasons why, and handling of their exit.
• The number of new joiners, with reasons why they had previously not been included.
• The number of transfer payments not available for collection at the due time.
• The number of payments available but not collected by people.
• Analyses of repeatedly uncollected payments.
• Tracking of common issues, such as replacement times of lost or faulty beneficiary documentation.
4.9 Management information systems for transfer programmes are developing but currently weak. The systems in the programmes we examined primarily tracked individual cases and targeted growth in numbers of beneficiaries. They provided very limited aggregate statistical analysis on operational performance. The Department has no real efficiency measures to assess delivery performance against unit costs at district or location level. The Department has produced guidance for country teams that is intended to cover effective management information for cash transfers.
4.10 We requested management information for Kenya’s Hunger Safety Net Programme, which uniquely uses electronic payments since it began in 2008. The Department’s Kenya office mainly tracked enrolment against its target of 60,000 beneficiaries. The Department had not received aggregated statistical information on payment system performance from the Secretariat it established within the Kenyan Government (paragraph 2.10). At July 2011, standard management reports were still under development and ad hoc system queries had to be prepared in response to our questions. In Zambia, the Department is supporting a management information system for child grants which started payments in 2010. The information system does not address administrative performance, though some data could give reasons for new entrants previously excluded, or conversely on those leaving due to ineligibility, as well as the proportion of people lacking documentation.

44 Appendix One Transferring cash and assets to the poor
Appendix One
Methodology
We looked at four countries – Zambia, Kenya, Ethiopia and Bangladesh –selected by considering the extent of their experience with, and historic and planned spend on, transfers. Primary methods comprised:
Method Purpose
Reviewing project design, monitoring and evaluation documentation on eight Department-supported transfer programmes in the four countries.
To evaluate progress against the objectives for transfer programmes, and the lessons learned.
Interviews with:
• Central and local government officials, representatives of non-governmental organisations, and other donors in the respective countries.
• Beneficiaries, district officials and local service providers.
• London-based Department policy staff and teams designing or managing transfer programmes overseas.
• To gather views on progress in the use of transfers, challenges faced and lessons learned from Department-supported programmes.
• To identify issues faced in the delivery of transfers and to assess their impact on people.
• To follow up issues and to gather views on the operation of transfer programmes and performance of the Department.
Evaluating Departmental statistical, and financial data.
To identify levels of activity using transfers across the Department’s priority countries.
Literature review of academic, donor and non-governmental organisation publications.
To identify wider practice in the use of transfers and the consensus about ‘what works’ in relation to targeting, payment arrangements, and the impacts of programmes.
Online survey of heads of country offices and advisers in the Department’s priority countries.
To gather experience and perceptions of the wider cadre of staff, focusing on their awareness of transfer approaches, reasons for use and barriers to wider application.
A more detailed methodology is at: www.nao.org.uk
Transferring cash and assets to the poor Endnotes 45
Endnotes
1 DFID evidence paper, Cash transfers, April 2011, p.7.
2 Castro Leal et al., Public Spending on Health in Africa: do the poor benefit?, WHO 2000, pp.66–78.
3 Sampson 2009 article, original classification from Guhan 1994.
4 Social assistance in developing countries, July 2010, Chronic Poverty Research Centre.
5 IPC, 2007; Samson et al., 2004, 2007; Barrientos, 2005. Full ref on p.17 of DFID Cash transfers evidence paper.
6 Hanlon et al., Just give money to the poor, April 2010, p.4.
7 DFID Cash transfers evidence paper, April 2011, p.ii.
8 The nine countries are Ethiopia, Bangladesh, Zambia, Kenya, Zimbabwe, Mozambique, Malawi, Rwanda and Uganda (ongoing programmes, centred around a large transfer component, not humanitarian and £10 million or greater in programme value).
9 DFID quotes the OECD definition of social protection in its April 2011 Cash transfers evidence paper, p.1.
10 DFID Statistics in International Development, 2007, total bilateral spend of £2,562 million in 2006-07.
11 DFID Statistics in International Development, 2011, total bilateral spend of £4,254 million.
12 DFID’s project recording systems do not separately classify and identify cash and asset transfers.
13 Support to the South African Economic Policy Research Institute (EPRI) to develop and update a manual published in 2006. See Designing and implementing social transfer programmes, EPRI, 2006.
14 DFID Cash transfer evidence paper, April 2011, p.viii.
15 Though, by their nature, cash transfers are applied predominantly in poverty, vulnerability and hunger sectors, some DFID country teams are also exploring how to use cash transfers in areas like education and health.

46 Endnotes Transferring cash and assets to the poor
16 D. Coady et al., Targeting of transfers in developing countries, Washington DC: World Bank, 2004, pp.7-10.
17 ODI practical guide to good targeting, p.1., p.4.
18 ODI practical guide to good targeting, p.2.
19 Evaluation of Ethiopia’s Food Security Program: Documenting progress in the implementation of the Productive Safety Nets Programme and the Household Asset Building Programme, Descriptive report, IFPRI, 2011, p.3.
20 Devereux et al. (IDS), Ethiopia’s PNSP: Trends in transfers within targeted households, 2006, p.15.
21 Cash transfer programme for Orphans and Vulnerable Children (OVC), Kenya, operational and impact evaluation, Oxford Policy Management (OPM), October 2010, p.iii, p.27, table c2.
22 Hunger Safety Net Programme M&E targeting report, final draft, Oxford Policy Management (OPM) and Institute of Development Studies (IDS), June 2011, for Kenya and Targeting effectiveness of CFPR/TUP in scale-up environment, BRAC Research and Evaluation Department, February 2006, for Bangladesh.
23 K. Conroy, et al., Lessons from the Chars Livelihood Programme, Bangladesh, 2004-2010, 2010, p.8.
24 B. Watkins, Alternative methods for targeting social assistance to highly vulnerable groups, Kimetrica, February 2008.
25 Administrative, financial and opportunity costs that can fall to the Department and others involved such as government officials, volunteers etc.
26 PSNP and HABP third quarter performance report, June 2011, p.10.
27 For example, the Productive Safety Net Programme does not include the costs of the government staff who implement it.
28 Cash transfer programme for Orphans and Vulnerable Children (OVC), Kenya, operational and impact evaluation, Oxford Policy Management (OPM), October 2010, p.73, p.76, p.79.
29 Costs in Figure 5 are for a less than fully-functioning rolled-out scheme with no amortisation of set up costs, whereas the figures in the text relate to the average of the three year pilot phase, including set up costs, but not including re-targeting and other ongoing costs.
30 DFID Project Memorandum, Financial and technical support for the expansion of Social Protection Programmes in Zambia, February 2010, annex 5, table 5.2.

Transferring cash and assets to the poor Endnotes 47
31 Devereux and Vincent, Using technology to deliver social protection, 2010, p.367.
32 Pickens, Porteous, Rotman, Banking the poor via G2P payments, CGAP and DFID, 2009, p.4.
33 Kenya, Hunger Safety Net Programme uses electronic payment. Procurement of electronic systems under way in Kenya’s Orphan and Vulnerable Children grant and in Zambia’s Child Grant. There are plans for electronic payment in Ethiopia’s Productive Safety Net Programme.
34 A preliminary evaluation of the Hunger Safety Net Programme, Kenya, June 2011.
35 Contract with Equity Bank. Schedule for May 2011-April 2012. Reflects steady state payments after set-up costs.
36 Cash transfer programme for Orphans and Vulnerable Children (OVC), Kenya, operational and impact evaluation, Oxford Policy Management (OPM), October 2010, p3.8.
37 Budget speech, June 2011, para 87.
38 The aide memoire of the May 2011 joint review noted that the Government Treasury had been unable to accommodate a request to help meet the needs of larger households, para 16.
39 NAO fieldwork, May 2011.
40 NAO fieldwork, May 2011.
41 World Bank social protection discussion paper series, Assisting the poor with cash: design and implementation of social transfer programs, No 0223, September 2002, p.7.
42 DFID cash transfers evidence paper, April 2011, pp.ii-iii.
43 The evaluations were: (i) Cash transfer programme for Orphans and Vulnerable Children (OVC), Kenya, operational and impact evaluation, Oxford Policy Management (OPM), Oct 2010, (ii) Kenya Hunger Safety Net Programme, Oxford Policy Management and IDS (ongoing, but the programme is too new to yield results), (iii) Zambia Social Protection Expansion Programme, American Institutes for Research M&E (ongoing, but the programme is too new to yield results), (iv) Impact of social cash transfers on welfare, investment and education in Zambia, Tembo and Freeland, (v) The impact evaluation of Ethiopia’s Productive Safety Nets and Household Asset Building programme 2006-2010, International Food Policy Research Institute, 2011 forthcoming, (vi) An impact evaluation of Ethiopia’s Productive Safety Nets Program 2006 – 2008, IFPRI, March 2009, (vii) Impact assessment of the Chars Livelihoods Programme (CLP) Phase 1, HTSPE, 2011 forthcoming, (viii) CLP phase 1 final report, Maxwell Stamp PLC, Sep 2010, (ix) Evaluation of STUP 1 package of CFPR phase II, BRAC, April 2011, and (x) CFPR impact evaluation, LSE, 2011 forthcoming.

48 Endnotes Transferring cash and assets to the poor
44 CLP phase 1 final report, MSP, September 2010, p.5, p.40 (daily incomes for current beneficiaries do not include the stipend given as part of the programme), p.43.
45 Scott and Islam (CLP), Have recipients of asset transfers seen an increase in income and expenditure?, January 2010, pp.17–19.
46 NAO interviews with beneficiaries in Bangladesh, May 2011.
47 Cash transfer programme for Orphans and Vulnerable Children (OVC), Kenya, operational and impact evaluation, Oxford Policy Management (OPM), October 2010, p.44.
48 National Audit Office field visit Homa Bay District Kenya, June 2011.
49 Cash transfer programme for Orphans and Vulnerable Children (OVC), Kenya, operational and impact evaluation, Oxford Policy Management (OPM), October 2010, pp.48-49, p.51.
50 The pilots were implemented through a Programme Partnership Arrangement (PPA) with Care International. PPAs are outside the scope of this study but the evaluation of the pilots nonetheless provides important evidence.
51 Tembo and Freeland, Impact of social cash transfers on welfare, investment and education in Zambia, 2008, p.22, tables 4, 8, 12.
52 Slater, Holmes and McCord, Cash transfers and poverty reduction in Sub-Saharan Africa: pragmatism or wishful thinking?, Presentation at the CPRC Conference, Manchester, 8-10 September 2010, slides 13 and 14, available at www.chronicpoverty.org/uploads/assets/files/ten_years_ppts/slater_et_al.pdf
53 DFID cash transfers evidence paper, April 2011, Schemes in Mozambique (p.22), Honduras (p.22 and p.27) and PSNP in Ethiopia (p.57).
54 The impact evaluation of Ethiopia’s Productive Safety Nets and Household Asset Building programme 2006-10, International Food Policy Research Institute, 2011 forthcoming.
55 Challenging the Frontiers of Poverty Reduction, targeting the ultra poor, targeting social constraints, 2007–2011, phase 2 proposal, p.15.
56 An early assessment of the CFPR II support packages, BRAC Research and Evaluation Division, December 2009, p.35.
57 Productive Safety Net Programme, variable levels support pilot project: a terminal report and roll out plan, Dadimos Development Consultants PLC, May 2010.

Transferring cash and assets to the poor Endnotes 49
58 Cash transfer programme for Orphans and Vulnerable Children (OVC), Kenya, operational and impact evaluation, Oxford Policy Management (OPM), October 2010, pp.29-30.
59 Analysis on the adequacy of cash transfer of the Ethiopian Productive Safety Net Programme to protect beneficiary purchasing power, Ethiopian Development Research Institute, January 2011, p.16.
60 Cash transfer programme for Orphans and Vulnerable Children (OVC), Kenya, operational and impact evaluation, Oxford Policy Management (OPM), October 2010, p.29.
61 An impact evaluation of Ethiopia’s Productive Safety Nets Program, IFPRI, March 2009, p.4.
62 NAO analysis of six CBAs produced since February 2009 for project appraisals of transfer programmes in Pakistan, Occupied Palestinian Territories, Bangladesh, Uganda, Yemen and Zimbabwe.
63 NAO review of the DFID business cases for OPTs and Pakistan.
64 VFM in humanitarian aid for Kenya and Somalia, Coffey International Development, April 2011, pp.57–59. Audsley, Halme, Balzer, Comparing cash and food transfers, a cost-benefit analysis from rural Malawi, p.95.
65 National Audit Office field visits to the case study countries. Statement holds for Kenya and Zambia. In Ethiopia, the purchasing power of the local currency had fallen such that it could no longer purchase the equivalent food package, resulting in a preference for the food package, May–June 2011.
66 Food security programme, 2010-2014, Ministry of Agriculture and Rural Development, August 2009, figure 1, p.6.
67 Sinha, Gidwani and Das, Cost benefit analysis of BRAC’s CFPR/TUP programme, March 2008, p.17, p.20.
68 Chars Livelihoods Programme, Phase 2, project memorandum, DFID, Annex 9 economic appraisal, table 3.
69 B Watkins, Alternative methods for targeting social assistance to highly vulnerable groups, Kimetrica, February 2008, p.52.
70 M&E framework for social cash transfers in Zambia, American Institute for Research, February 2010, pp.19–20.
71 NAO fieldwork, June 2011.

50 Endnotes Transferring cash and assets to the poor
72 Hagen-Zanker and McCord, Affordability of social protection in the light of international spending commitments, Overseas Development Institute (ODI), 2011, table 5. Shows 2006-07 spend data against lowest (2.9 per cent) threshold for a basic package.
73 Ethiopia Food Security Programme joint review and implementation mission for the Productive Safety Net and Household Asset Building Programmes, 28 June–9 July, aide memoire, p.3.
74 Internal audit report, (consolidated corrective action on audit findings 2007-2009), Government of Ethiopia. Ethiopia Food Security Programme joint review and implementation mission for the Productive Safety Net and Household Asset Building Programmes, 28 June–9 July 2010, aide memoire, para 22, p.6.
75 Committee of Public Accounts 13th report of session 2010-2011, 23 December 2010, Summary, p.3.
76 Matthews, Haque and Marks (CLP), Chars Livelihoods Programme, 2008 infrastructure and employment programme customer satisfaction survey, an overview of levels of leakage, 2009, p.2, p.4, p.8.


Design and Production byNAO CommunicationsDP Ref: 009753-001
This report has been printed on Consort 155 and contains material sourced from responsibly managed and sustainable forests certified in accordance with the FSC (Forest Stewardship Council).
The wood pulp is totally recyclable and acid-free. Our printers also have full ISO 14001 environmental accreditation which ensures that they have effective procedures in place to manage waste and practices that may affect the environment.

Published by TSO (The Stationery Office) and available from:
Online www.tsoshop.co.uk
Mail, Telephone, Fax & Email TSO PO Box 29, Norwich NR3 1GN Telephone orders/General enquiries: 0870 600 5522 Order through the Parliamentary Hotline Lo-Call 0845 7 023474 Fax orders: 0870 600 5533 Email: [email protected] Textphone: 0870 240 3701
The Parliamentary Bookshop 12 Bridge Street, Parliament Square, London SW1A 2JX Telephone orders/General enquiries 020 7219 3890 Fax orders: 020 7219 3866 Email: [email protected] Internet: http//www.bookshop.parliament.uk
TSO@Blackwell and other Accredited Agents9 780102 976779
ISBN 978-0-10-297677-9
£15.50