Magnetic Susceptibility and Heavy Metal Contamination in ...

Density and Magnetic Susceptibility Values for Rocks in the Talkeetna Mountains and
djacent Region, South-Central Alaska
y Elizabeth A. Sanger1 and Jonathan M.G. Glen1
pen–File Report 03-268
003
logical Survey editorial standards or with the North American Stratigraphic Code. Any use of trade, firm, or product names is for descriptive purposes only and does not imply endorsement by the U.S. Government. 1 U.S. Geological Survey, 345 Middlefield Road, MS 989 Menlo Park, CA 94025
A B O 2 U.S. Department of the Interior U.S. Geological Survey ______________________________________________________________________________ This report is preliminary and has not been reviewed for conformity with U.S. Geo
TABLE OF CONTENTS
Abstract ........................................................................................................................................... 1 Introduction..................................................................................................................................... 1 Density Data.................................................................................................................................... 2 Magnetic Susceptibility Data.......................................................................................................... 2 Results And Discussion .................................................................................................................. 2
Magnetic Susceptibility .............................................................................................................. 2 Density ........................................................................................................................................ 3
Acknowlegments............................................................................................................................. 4 References Cited ............................................................................................................................. 5
FIGURES
Figure 1 Topographic map of the study area ........................................................................6 2 Lithologic map .......................................................................................................7 3 Simplified geologic map with density values.........................................................8 4 Simplified geologic map with magnetic susceptibility values ...............................9 5 Histogram of magnetic susceptibility values........................................................10 6 Susceptibility statistics, by rock type ...................................................................11 7 Detailed magnetic susceptibility statistics, by rock type......................................12 8 Histogram of grain density values........................................................................13 9 Grain density statistic, by rock type .....................................................................14 10 Detailed grain density statistics, by rock type......................................................15
TABLES
Table 1 Density measurements, by rock type....................................................................16 2 Magnetic susceptibility values, by rock type ......................................................17 3 Physical Property Data ........................................................................................18
APPENDICES
Appendix 1 Sample name abbreviation key.............................................................................37 2 Rock type abbreviation key..................................................................................38 3 Magnetic susceptibility statistics..........................................................................39 4 Magnetic susceptibility statistics, by rock type....................................................40 5 Grain density statistics..........................................................................................41 6 Grain density statistics, by rock type....................................................................42
ii

ABSTRACT
This report presents a compilation and statistical analysis of 306 density and 706 magnetic susceptibility measurements of rocks from south-central Alaska that were collected by U.S. Geological Survey (USGS) and Alaska Division of Geological and Geophysical Surveys (ADGGS) scientists between the summers of 1999 and 2002. This work is a product of the USGS Talkeetna Mountains Transect Project and was supported by USGS projects in the Talkeetna Mountains and Iron Creek region, and by Bureau of Land Management (BLM) projects in the Delta River Mining District that aim to characterize the subsurface structures of the region. These data were collected to constrain potential field models (i.e., gravity and magnetic) that are combined with other geophysical methods to identify and model major faults, terrane boundaries, and potential mineral resources of the study area. Because gravity and magnetic field anomalies reflect variations in the density and magnetic susceptibility of the underlying lithology, these rock properties are essential components of potential field modeling. In general, the average grain density of rocks in the study region increases from sedimentary, felsic, and intermediate igneous rocks, to mafic igneous and metamorphic rocks. Magnetic susceptibility measurements performed on rock outcrops and hand samples from the study area also reveal lower magnetic susceptibilities for sedimentary and felsic intrusive rocks, moderate susceptibility values for metamorphic, felsic extrusive, and intermediate igneous rocks, and higher susceptibility values for mafic igneous rocks. The density and magnetic properties of rocks in the study area are generally consistent with general trends expected for certain rock types.
INTRODUCTION
Specific aims of the ongoing State-Federal work in the Talkeetna Mountains and adjacent areas, figure 1, include: understanding the regional tectonic character of south-central Alaska, especially related to the development of the southern Alaska Orocline; determining the structural relationships between tectonostratigraphic terranes (including Kahiltna, Wrangellia and Peninsular terranes as well as smaller terranes such as Susitna, Broad Pass, and Maclaren, figure 2); understanding the character of major faults; and developing a geophysically-based regional mineral assessment for the Talkeetna Mountains and surrounding region that identifies the locations, size, and depth of buried sources of potential mineral targets.
Some important mineral source bodies and targets of interest include Cretaceous and Tertiary granitoid plutons, which intrude the flysch sequence in the Kahiltna assemblage/terrane, and ultramafic units associated with feeder zones to the Triassic Nikolai Greenstone flood basalts. Further information on the goals and progress of the Talkeetna Mountains Transect Project can be found at http://minerals.usgs.gov/west/projects/scentak.shtml.
1

DENSITY DATA
Densities were determined for the 306 samples in the study area using a precision electronic balance (figure 3). All rocks were weighed three times, dry in air (Wa), saturated in water (Ww) and saturated in air (Ws), and the data were then processed to calculate the grain density (D1), dry bulk density (D2) and saturated bulk density (D3) of each sample. Saturated measurements were performed after the samples had soaked in water for 24 to 48 hours. Saturated in air weights were made upon immediate removal of the sample from the water. Densities are reported in g/cm3 (table 1) and are calculated from the following formulas:
D1 = Wa/(Wa-Ww) grain
D2 = Wa/(Ws-Ww) dry bulk
D3 = Ws/(Ws-Ww) saturated bulk
MAGNETIC SUSCEPTIBILITY DATA
Volume corrected apparent magnetic susceptibility readings were determined for 706 rock outcrops or hand samples from the study area (figure 4, table2). Samples listed in table 3 are from datasets of various USGS and ADGGS scientists. Measurements collected by ADDGS scientists during 1999 were done in the field using a Scintrex susceptibility meter and supplemented with laboratory measurements when outcrop measurements were missing. Magnetic susceptibility readings of all other rock samples were measured in the laboratory using a Geophysica KT-5 susceptibility meter. Both instruments are accurate to 1 x 10⁻⁵ SI units, and all measurements were converted from SI to cgs by dividing the SI value by 4π.
Each magnetic susceptibility value in this report represents an average of multiple readings. Though care was taken during measurements (e.g., to measure on flat and broad surfaces of the sample or outcrop) surface roughness, weathering, and sample size may result in the reported susceptibilities being lower than the true susceptibilities. Both the Geophysica KT-5 and the Scintrex meters calculate volume susceptibility by assuming the sample shape is an infinite half-space. When available, we report measurements taken in the field over laboratory measurements because they closer approximate the half-space assumed by the instruments and because they integrate measurements made on several different outcrop surfaces (generally 12 to 15).
RESULTS AND DISCUSSION
Magnetic Susceptibility
Magnetic susceptibility depends largely on a rock’s magnetic mineral content. Mafic rocks generally have higher magnetic susceptibilities than felsic rocks because mafic rocks are typically more abundant in strongly magnetic minerals such as magnetite (Carmichael, 1982).
2

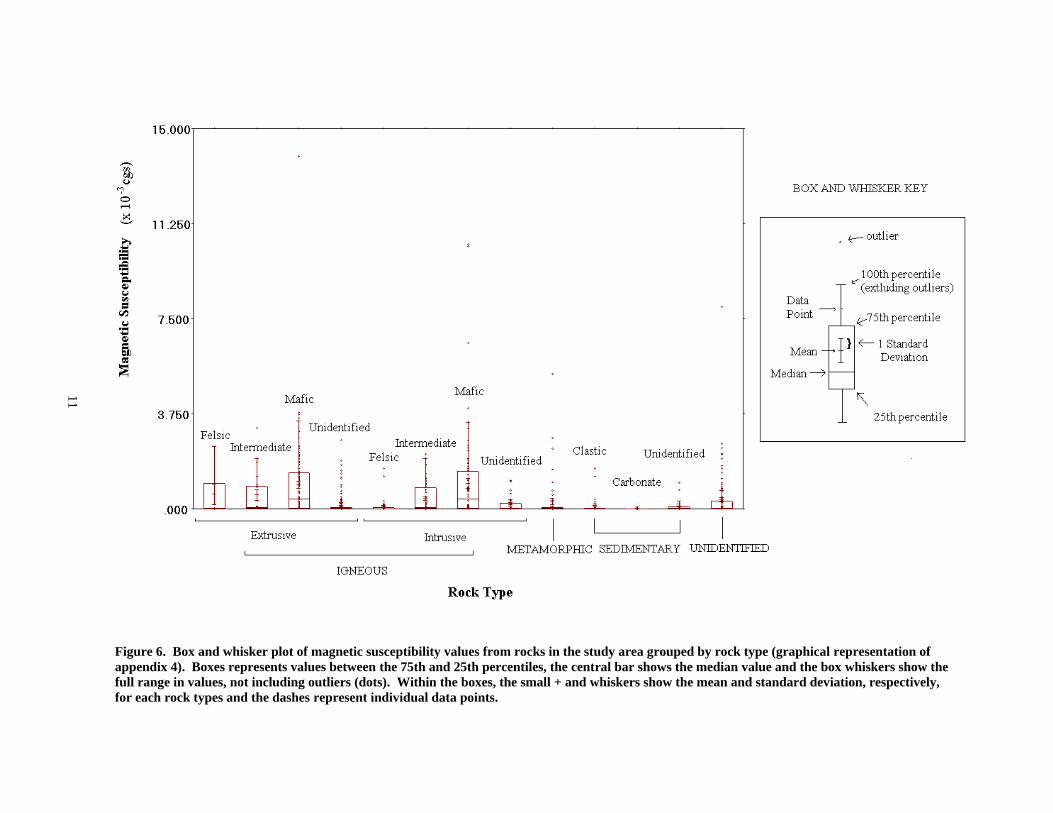
Rocks from the study area reflect this trend -- the highest average magnetic susceptibilities come from mafic igneous rocks, while the lowest calculated averages come from sedimentary as well as felsic and unidentified igneous rocks (table 2). Table 2 shows the minimum, maximum, mean, and standard deviation of magnetic susceptibility values for various rock types. Mafic extrusive and intrusive rocks average 0.96 and 1.01 x 10⁻³ cgs respectively, while carbonate and clastic rocks average from 0.01 to 0.14 x 10⁻³ cgs respectively. Felsic igneous rocks also exhibit relatively low magnetic susceptibilities: 0.10 x 10⁻³ cgs for intrusive rocks and 0.58 x 10⁻³ cgs for extrusive rock samples1.
Detailed statistics and Newman-Keuls multiple comparison tests were also calculated for the magnetic susceptibility and density values of rocks from the study area (appendices 3 and 4). The mean magnetic susceptibility value for all rocks from the study area is 0.49 x 10⁻³ cgs, with a standard deviation of 1.11 x 10⁻³ cgs (appendix 3). A modified Kolmogorov-Smirnov test (Lilliefor, 1967, appendix 4) suggests that the data are not normally distributed, which can be expected for magnetic susceptibility data undifferentiated by location or rock type. A histogram of susceptibility values, figure 5, show that the majority of values (about 82%) are between 1.0 x 10⁻³ cgs and the meter’s sensitivity, while an independent group analysis and Newman-Keuls multiple comparisons test (appendix 4, figures 6 and 7) indicate whether the differences between each group are statistically significantly at the 95% confidence level. Results show that susceptibility values for mafic rocks are significantly different from carbonate, clastic, and intrusive felsic rocks within 95% confidence, but that all other categories are not statistically significantly different at the 95% confidence level.
Density
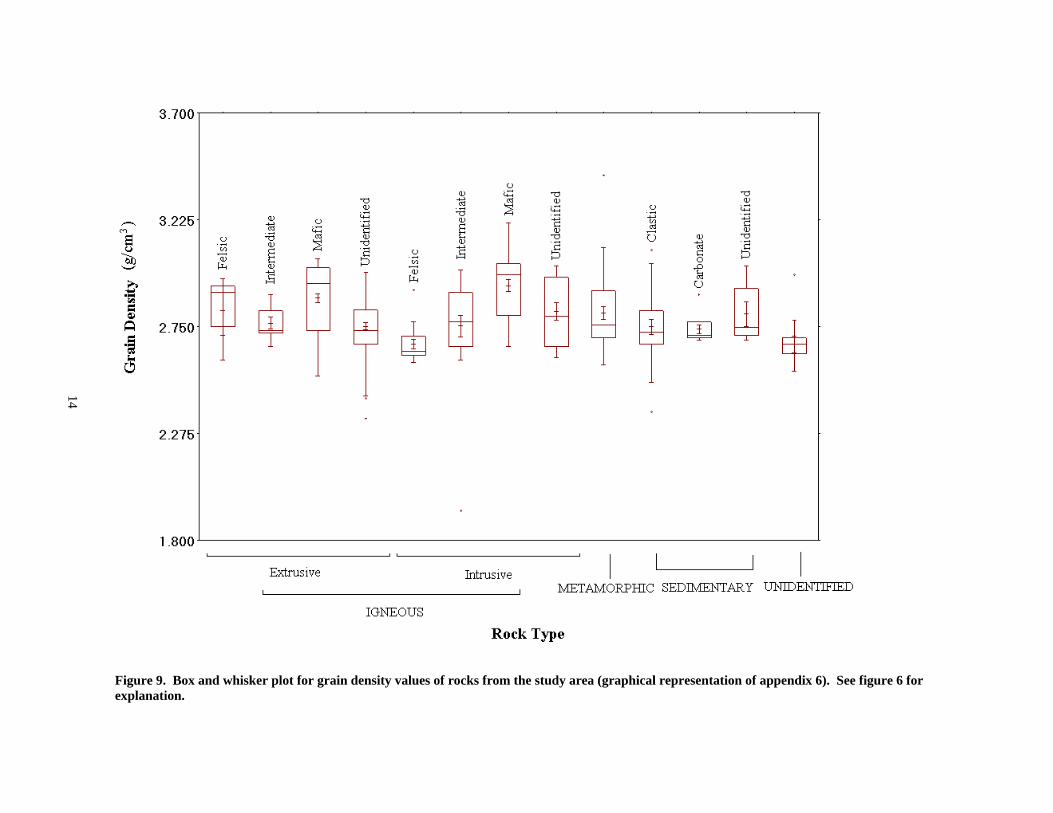
Density values for rocks in our study area are generally consistent with common trends (Johnson and Olhoeft, 1984) and show highest average grain densities for both extrusive and intrusive mafic igneous rocks at 2.88 and 2.93 g/cm3 respectively, and lowest mean grain density values for felsic intrusive rocks at 2.67 g/ cm3 (table 1). Because grain density is affected largely by a rock’s mineral composition and porosity, rocks rich in felsic minerals tend to have lower densities than rocks rich in mafic minerals. Igneous and metamorphic rocks tend to be denser than sedimentary rocks in part because of their composition, but also because they are generally less porous than sedimentary rocks.
Grain densities for the 306 individual samples in our study area range from 1.93 g/cm3 to 3.42 g/cm3, have a median of 2.75 g/cm3, an average of 2.80 g/cm3, and a standard deviation of 0.16 g/cm3 (appendix 5, figure 8). Statistics on various rock types show a maximum mean grain density of 2.93 g/cm3 for mafic intrusive rocks, and a minimum mean grain density of 2.67 g/cm3 for felsic intrusive rocks (table 1).
A modified Kolmogorov-Smirnov test that evaluates the distribution of values within a dataset suggests that density values of rocks from our study area are not normally distributed (appendix 5, figure 8). Analysis of grain density by rock type and Newman-Keuls multiple comparisons test (appendix 6, figure 7 and 8) indicate that the differences between the density values of most rock types for rocks in the study area are not statistically significant at the 95% confidence level,
1 The few number of felsic extrusive samples, 6, may provide a poor estimate of the mean magnetic susceptibility for this rock type and may explain why it is significantly higher than expected.
3

except between the mafic rock type groups (both intrusive and extrusive) and felsic intrusive rocks.
ACKNOWLEGMENTS
We thank: Peter Oswald for help with sample collection and field magnetic susceptibility measurements and for managing rock samples from a large portion of the sources included in this report; Melanie Werdon for providing field and laboratory magnetic susceptibility data from the Iron Creek area; Jeanine Schmidt, Peter Bittenbender, Steve Nelson, and Jim Reihle for help with sample collection and field magnetic susceptibility measurements; Jeanine Schmidt, Melanie Werdon, Peter Oswald, Skip Cunningham, Bruce Gamble, Steve Nelson, Jim Reihle, Mike O’Neill, Gar Pessel, and Rainer Newberry for contributing hand samples on which we performed rock property measurements for this report; and Ryan Wooley for assisting in laboratory rock property measurements. We are grateful to the BLM for their financial and logistical support in sample collection in the Delta River Mining District.
4

REFERENCES CITED
Carmichael, R. S., 1982, Magnetic Properties of Minerals and Rocks: CRC Handbook of Physical Properties of Rocks, Vol. 2, Ch. 2, ed. Carmichael, R. S..
Dallal, G. E., and Wilkinson, L., 1986, An Analytic Approximation to the Distribution Lilliefor's Test Statistic for Normality: The American Statistician, vol. 40, no. 4, p. 294-296.
Hoaglin, D. C., Mosteller, F., and Tukey, J.W., 1983, Understanding Robust and Exploratory Data Analysis: John Wiley & Sons, Inc. New York.
Johnson, G. R. and Olhoeft, G. R., 1984, Density of Rocks and Minerals: CRC Handbook of Physical Properties of Rocks, vol. 3, Ch.1, ed. Carmichael, R. S..
Lilliefor, H. W., 1967, On the Kolmogorov-Smirnov test for normality with mean and variance unknown: JASA, Vol. 62. p. 399-402.
Silberling, N.J., Jones, D.L., Monger, J.W.H., Coney, P.J., Berg, H.C. and Plafker, G., 1994, Lithotectonic terrane map of Alaska and adjacent parts of Canada.
Werdon, M.B., Szumigala, D.J., and Davidson, G., 2000, Generalized Geologic Map of Alaska, Department of Natural Resources, Division of Geological and Geophysical Surveys.
5

6
Figure 1. Shaded relief map of south-central Alaska showing the locations of rocks with density (yellow circles) and magnetic susceptibility (red triangles) measurements from the study area. Study areas outlined in red.

7
Figure 2. Generalized lithologic terrane map of south-central Alaska (modified from Silberling and others, 1994). Study areas outlined in red.

8
Figure 3. Simplified geologic map (modified from Werdon and others, 2000) showing the locations of rock samples with density measurements (orange circles). Symbol sizes are proportional to grain density.

9
Figure 4. Simplified geologic map (modified from Werdon and others, 2000) showing the locations of rock samples with magnetic susceptibility measurements (orange circles). Symbol sizes are proportional to magnetic susceptibility value.

10
Figure 5. Histogram of magnetic susceptibility values for rocks from the study area (graphical representation of appendix 3). Left y- axis shows percentage of entire data set; right y-axis shows the number of samples; x-axis is magnetic susceptibility in 10-3 cgs; italic numbers above bars give the number of samples with a susceptibility value within that interval, and the green dotted curve is a bell curve with its peak at the mean susceptibility value. The horizontal bar above the graph shows the distribution of values; black line = individual sample.
11
Figure 6. Box and whisker plot of magnetic susceptibility values from rocks in the study area grouped by rock type (graphical representation of appendix 4). Boxes represents values between the 75th and 25th percentiles, the central bar shows the median value and the box whiskers show the
ashes represent individual data points. full range in values, not including outliers (dots). Within the boxes, the small + and whiskers show the mean and standard deviation, respectively, for each rock types and the d

12
Figure 7. Detailed box and whisker plot for magnetic susceptibility values of rocks from the study area (graphical representation of appendix 4). See figure 6 for explanation.

13
Figure 8. Histogram of grain density values for rocks from the study area (graphical representation of appendix 5). Left y- axis shows percentage of entire data set; right y-axis shows the number of samples; x-axis is grain density in g/cm3; italic numbers above each bar gives the number of amples with a grain density value within that interval, and the green dotted curve is a bell curve with its peak at the mean density. The horizontal s
bar above the graph shows the distribution of values; black line = individual sample.
14
Figure 9. Box and whisker plot for grain density values of rocks from the study area (graphical representation of appendix 6). See figure 6 for explanation.

Figure 10. Box and whisker plot for grain densi . See figure explanation.
6 for
15
ty values of rocks from the study area (graphical representation of appendix 6)

16
rock types in this dataset (Red, high; yellow, moderate; lue, low).
in, minimum value; Max, maximum value; Ave, average value; SD, standard deviation]
Dry Bulk Density Grain Den ated Bul nsity
Table 1. Density values for rocks of the study area (in g/cm3). The average grain density value for each rock type is colored relative to the average densities of other b
[M
sity Satur k DeRock Type Count
Min Max Ave SD Mas SD Min Max SD Min Ave Ave
IG 225 1.83 11 2.76 0. 93 3.21 0.17 1. 3.12 0.18 NEOUS 3. 19 1. 2.81 92 2.78
141 1.83 2.75 0. .34 3.05 0.15 2. 3.04 0.17 Extrusive 3.03 19 2 2.80 05 2.77
3 2.53 2.76 0. .60 2.96 Felsic 2.90 20 2 2.82 0.19 2. 2.92 0.20 56 2.79
9 2.63 2.73 0. .66 2.89 Intermediate 2.87 09 2 2.76 0.08 2. 2.88 0.08 64 2.74
57 2.26 2.83 0. .53 3.05 Mafic 3.03 18 2 2.88 0.15 2. 3.04 0.17 36 2.85
ed 72 1.83 2.68 0. .34 2.99 Unidentifi 2.97 19 2 2.75 0.13 2. 2.98 0.17 05 2.71
84 1.91 2.78 0. .93 3.21 0.19 1. 3.12 0.19 Intrusive 3.11 19 1 2.82 92 2.79
15 2.45 2.61 0. .59 2.91 Felsic 2.89 11 2 2.67 0.08 2. 2.90 0.10 50 2.64
22 1.91 2.72 0. .93 3.00 Intermediate 2.98 22 1 2.75 0.22 1. 2.98 0.22 92 2.73
33 2.63 2.89 0. .66 3.21 Mafic 3.11 14 2 2.93 0.15 2. 3.12 0.14 64 2.90
14 2.53 2.77 0. .61 3.02 Unidentified 2.95 16 2 2.82 0.15 2. 2.97 0.15 58 2.79
M PHIC 38 2.45 2.74 0. .58 3.42ETAMOR 3.36 17 2 2.81 0.17 2. 3.38 0.17 50 2.77
SE 2.34 05 2.71 0. 37 3.09 0.14 2. 3.06 0.13 DIMENTARY 38 3. 15 2. 2.75 40 2.72
C 22 2.34 2.72 0. 37 3.09lastic 3.05 16 2. 2.75 0.16 2. 06 0.15 40 3. 2.73
Carbonate 10 2.45 2.84 2.66 0.11 2.69 2.89 2.74 0.06 2.54 2.86 2.69 0.09
Unidentified 6 2.51 2.98 2.74 0.17 2.69 3.02 2.81 0.13 2.57 2.99 2.76 0.15
UNIDENTIFIED 5 2.31 2.94 2.63 0.23 2.55 2.98 2.71 0.16 2.41 2.95 2.66 0.20

17
able 2. Magnetic susceptibility values for rocks from the study area; Min, minimum value; Max, maximum va sem
t
Tlue; Ave, average value; SD, standard deviation. Values of 0.00 reflect measurements below the instrument’snsitivity. The average susecptibility value for each rock type is colored red for high susceptibility, yellow for oderate susceptibility, or blue for low susceptibility.
Magnetic Susceptibili y (10-3 cgs) Rock un
in Max Ave SD pe Ty Co t
M
IGNEOUS 46 0 13.90 0.59 1.23 7 0.0
Extrusive 0 13.90 0.61 1.20 250 0.0
Felsic 6 0. 2.45 00 0.58 1.00
Intermed 0 1 3.18 iate 2 0.0 0.54 0.89
Mafic 1 13.90 123 0.0 0.96 1.53
Unidenti 1 0 2.72 fied 10 0.0 0.19 0.46
Intrusive 0 10.42 0.57 1.26 217 0.0
Felsic 3 0 1.60 4 0.0 0.10 0.31
Intermed 6 0 2.15 iate 5 0.0 0.41 0.60
Mafic 0 0 10.42 9 0.0 1.01 1.79
Unidentified 1.11 28 0.00 0.18 0.32
METAMO 3 0 5.31 RPHIC 5 0.0 0.30 0.89
SEDIMEN 0 0 1.59 0.11 0.30 TARY 6 0.0
Clastic 9 0 1.59 2 0.0 0.14 0.37
Carbonat 0 0 0.08 e 2 0.0 0.01 0.02
Unidenti 1 0 1.03 fied 1 0.0 0.19 0.35
UNIDENTI D 0 7.96 FIE 126 0.0 0.36 0.90
18
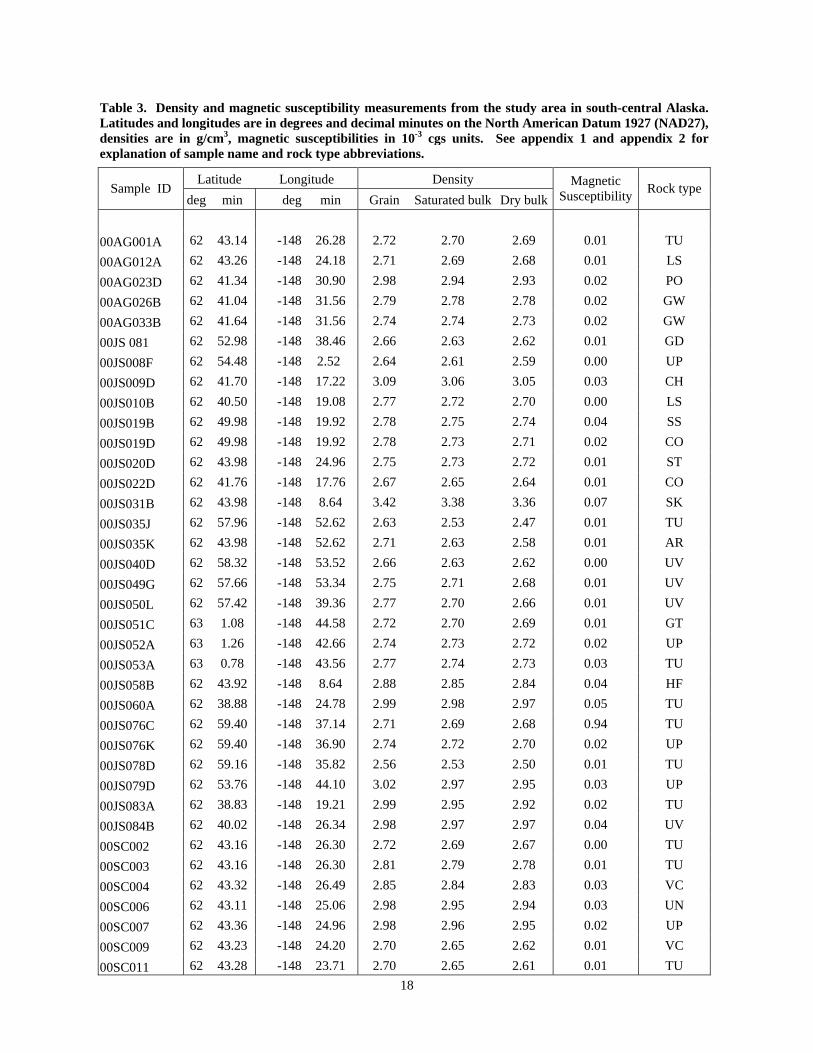
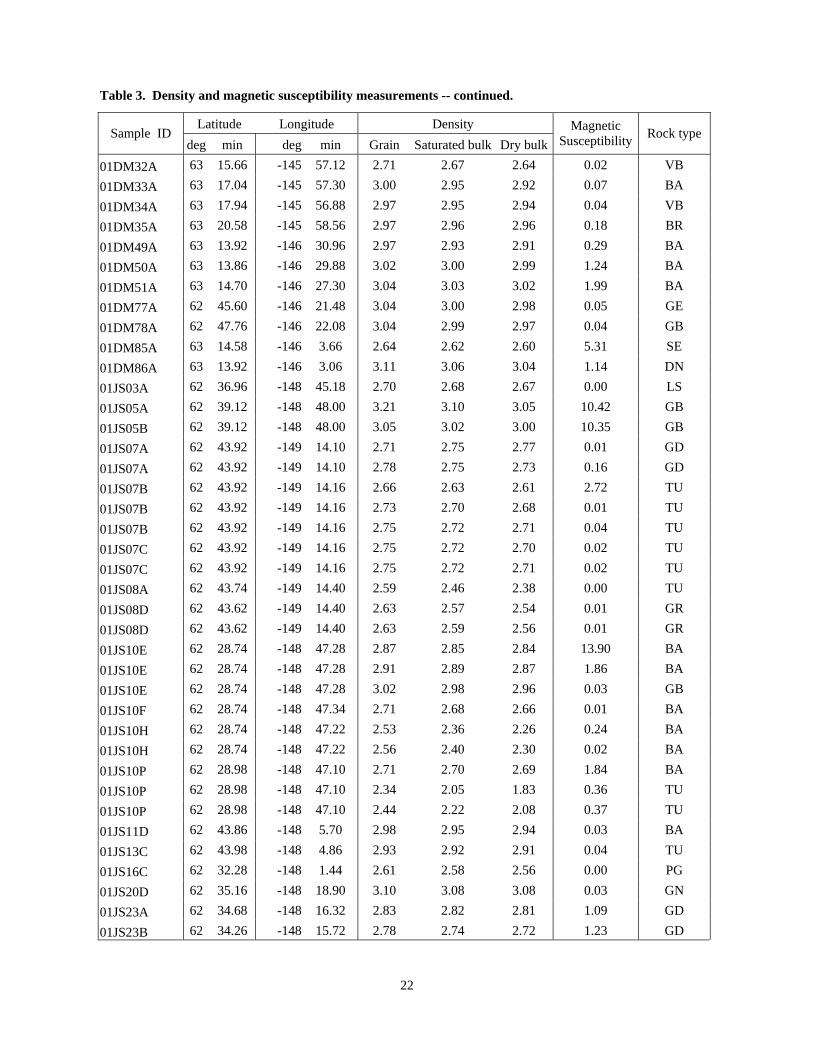
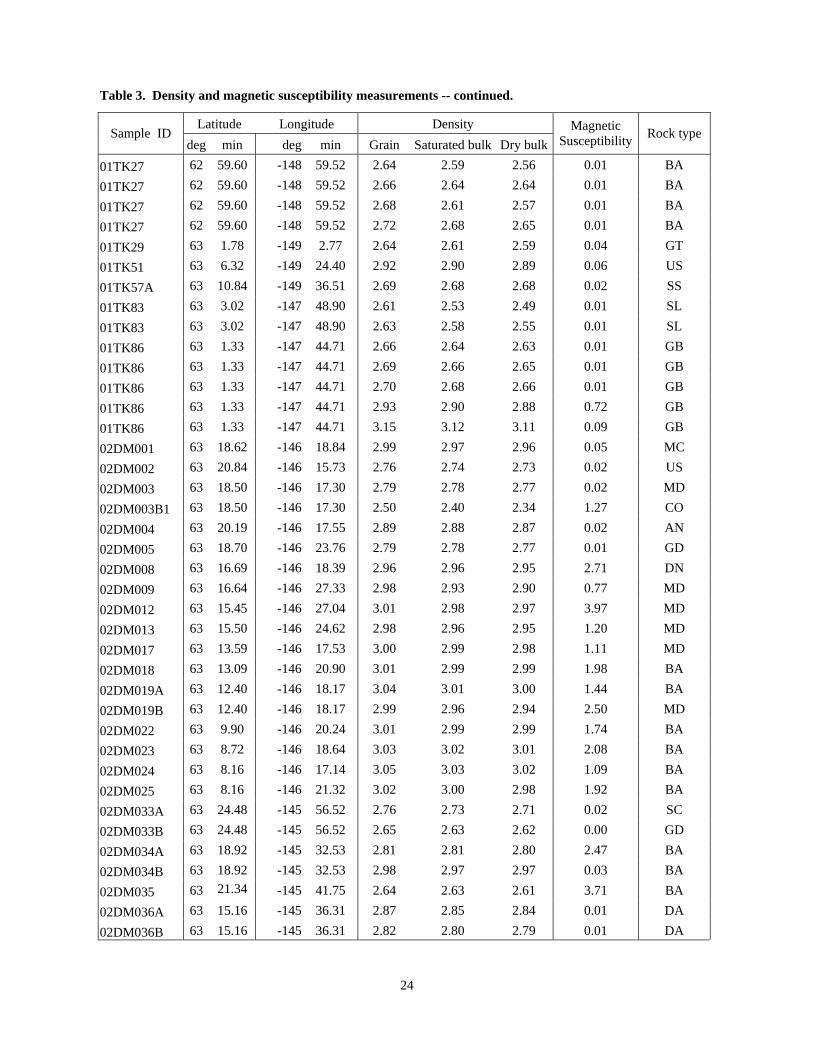
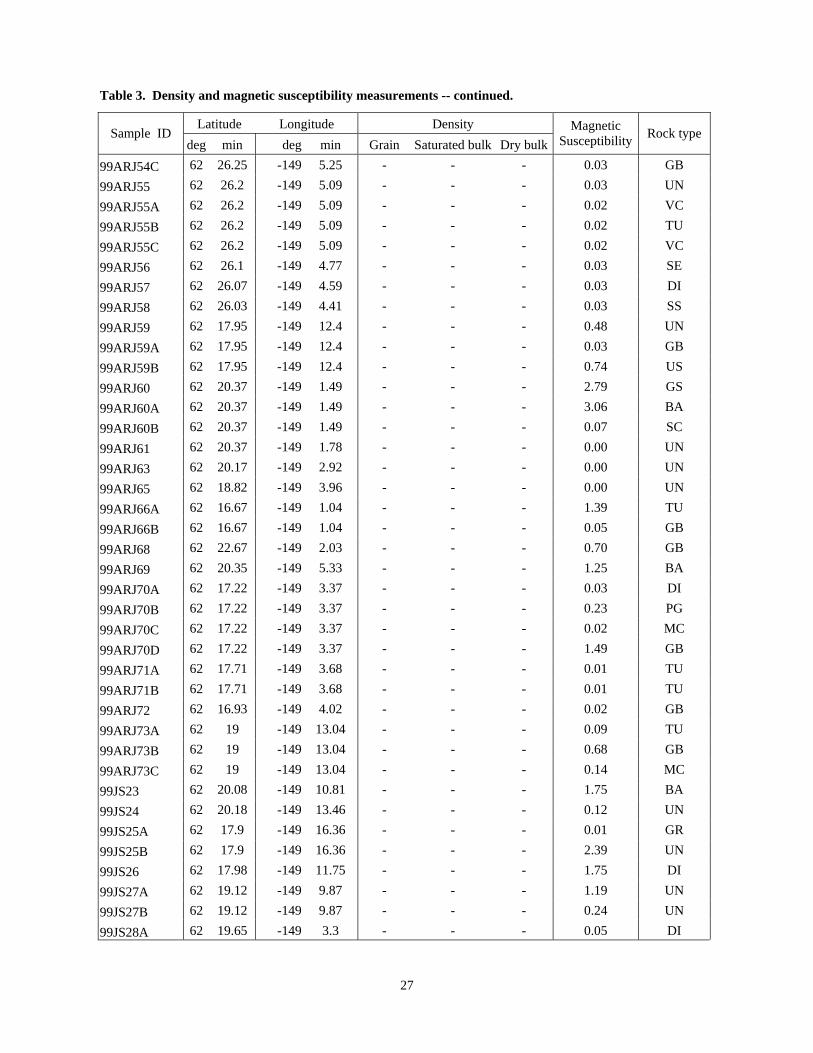
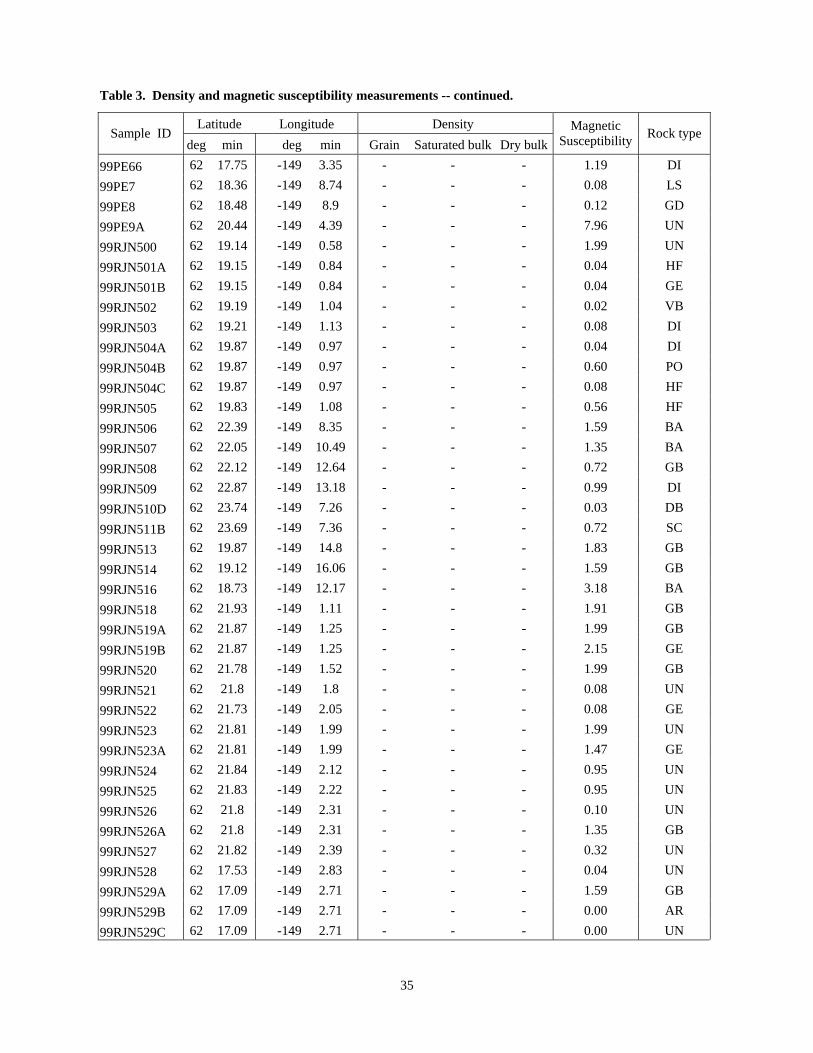
ea in south-central Alaska. Latitudes an lonTable 3. Density and magnetic susceptibility measurements from the study ar
d gitudes are in degrees and decim l minu North merica 927 d i m agnetic susceptibilities in 10
a tes on the A n Datum 1 (NAD27),ensities are n g/c 3, m -3 cgs units.
s. See appendix 1 and appe
explanation of l e an bb n
t it Density
ndix 2 for samp e nam d rock type a reviatio
La itude Long ude Sample ID
Satu ulk DM c
Susc Ro pe deg min deg min Grain rated b ry bulk
agnetieptibility ck ty
00AG001A 62 43.14 -148 26.28 2.72 2.70 2.69 0.01 TU 00AG012A 62 43.26 -148 24.18 2.71 2.69 2.68 0.01 LS
00AG023D 62 41.34 -148 30.90 2.98 2.94 2.93 0.02 PO 00AG026B 62 41.04 -148 31.56 2.79 2.78 2.78 0.02 GW
00AG033B 62 41.64 -148 31.56 2.74 2.74 2.73 0.02 GW 00JS 081 62 52.98 -148 38.46 2.66 2.63 2.62 0.01 GD
00JS008F 62 54.48 -148 2.52 2.64 2.61 2.59 0.00 UP 00JS009D 62 41.70 -148 17.22 3.09 3.06 3.05 0.03 CH
00JS010B 62 40.50 -148 19.08 2.77 2.72 2.70 0.00 LS 00JS019B 62 49.98 -148 19.92 2.78 2.75 2.74 0.04 SS
00JS019D 62 49.98 -148 19.92 2.78 2.73 2.71 0.02 CO 00JS020D 62 43.98 -148 24.96 2.75 2.73 2.72 0.01 ST
00JS022D 62 41.76 -148 17.76 2.67 2.65 2.64 0.01 CO 00JS031B 62 43.98 -148 8.64 3.42 3.38 3.36 0.07 SK
00JS035J 62 57.96 -148 52.62 2.63 2.53 2.47 0.01 TU 00JS035K 62 43.98 -148 52.62 2.71 2.63 2.58 0.01 AR
00JS040D 62 58.32 -148 53.52 2.66 2.63 2.62 0.00 UV 00JS049G 62 57.66 -148 53.34 2.75 2.71 2.68 0.01 UV
00JS050L 62 57.42 -148 39.36 2.77 2.70 2.66 0.01 UV 00JS051C 63 1.08 -148 44.58 2.72 2.70 2.69 0.01 GT
00JS052A 63 1.26 -148 42.66 2.74 2.73 2.72 0.02 UP 00JS053A 63 0.78 -148 43.56 2.77 2.74 2.73 0.03 TU
00JS058B 62 43.92 -148 8.64 2.88 2.85 2.84 0.04 HF 00JS060A 62 38.88 -148 24.78 2.99 2.98 2.97 0.05 TU
00JS076C 62 59.40 -148 37.14 2.71 2.69 2.68 0.94 TU 00JS076K 62 59.40 -148 36.90 2.74 2.72 2.70 0.02 UP
00JS078D 62 59.16 -148 35.82 2.56 2.53 2.50 0.01 TU 00JS079D 62 53.76 -148 44.10 3.02 2.97 2.95 0.03 UP
00JS083A 62 38.83 -148 19.21 2.99 2.95 2.92 0.02 TU 00JS084B 62 40.02 -148 26.34 2.98 2.97 2.97 0.04 UV
00SC002 62 43.16 -148 26.30 2.72 2.69 2.67 0.00 TU 00SC003 62 43.16 -148 26.30 2.81 2.79 2.78 0.01 TU
00SC004 62 43.32 -148 26.49 2.85 2.84 2.83 0.03 VC 00SC006 62 43.11 -148 25.06 2.98 2.95 2.94 0.03 UN
00SC007 62 43.36 -148 24.96 2.98 2.96 2.95 0.02 UP 00SC009 62 43.23 -148 24.20 2.70 2.65 2.62 0.01 VC
00SC011 62 43.28 -148 23.71 2.70 2.65 2.61 0.01 TU

19
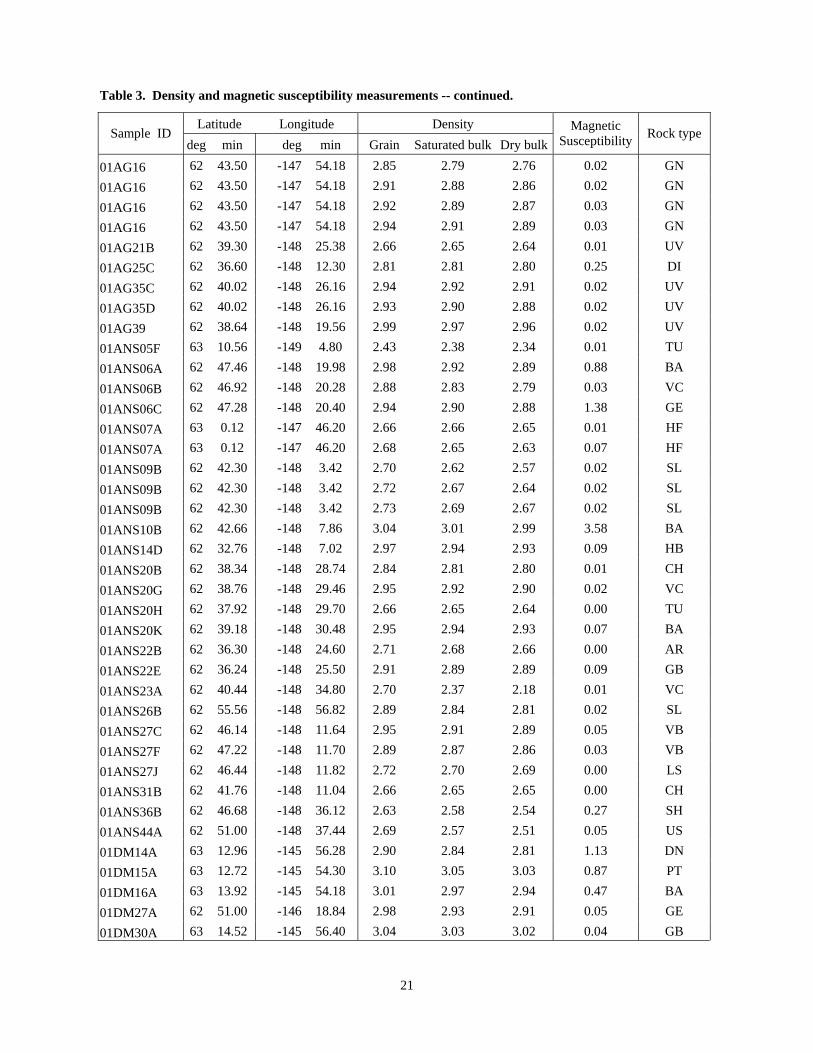
Table 3. Density and magnetic susceptibility measurements -- continued.
Latitude Longitude Density Sample ID
deg min deg min Grain Saturated bulk Dry bulkMagnetic
Susceptibility Rock type
00SC012 62 43.44 -148 23.65 2.70 2.66 2.64 0.00 LS 00SC013 62 43.48 -148 23.33 2.77 2.75 2.74 0.03 UP
00SC014 62 43.49 -148 23.11 2.69 2.59 2.52 0.01 LS 00SC015 62 43.63 -148 23.23 2.82 2.79 2.78 0.02 AR
00SC017 62 43.17 -148 26.13 2.97 2.95 2.94 0.02 UP 00SC018 62 43.19 -148 27.71 2.90 2.88 2.87 0.03 VC
00SC021 62 43.83 -148 23.10 2.93 2.92 2.92 0.01 BA 00SC022 62 43.68 -148 25.55 2.77 2.77 2.76 0.02 VC
00SC024 62 43.68 -148 25.55 2.73 2.70 2.68 0.00 US 00SC025 62 43.68 -148 25.55 2.88 2.85 2.83 0.04 VC
00SC026 62 42.17 -148 30.28 2.73 2.71 2.69 0.02 VC 00SC027 62 42.17 -148 30.28 2.78 2.74 2.72 0.02 TU
00SC029 62 59.38 -148 48.36 2.67 2.64 2.63 0.39 TU 00SC030 62 59.38 -148 48.36 2.69 2.68 2.66 0.02 TU
00SC031 62 58.09 -148 49.03 2.69 2.68 2.67 0.07 TU 00SC032 62 59.29 -148 50.92 2.99 2.93 2.89 0.02 UM
00SC033 62 58.20 -148 50.72 2.66 2.55 2.52 0.69 TU 00SC034 62 58.20 -148 50.72 2.67 2.64 2.62 0.26 TU
00SC035 62 58.67 -148 52.32 2.73 2.67 2.64 0.02 TU 00SC036 63 0.24 -148 53.20 2.68 2.63 2.60 0.01 GN
00SC037 62 57.84 -148 40.11 2.60 2.52 2.48 0.00 GR 00SC038 62 56.83 -148 41.46 2.60 2.54 2.51 0.00 GD
00SC039 62 56.83 -148 41.46 2.66 2.63 2.61 0.00 GD 00SC03A 62 43.16 -148 26.30 2.82 2.80 2.79 0.02 VC
00SC040 62 58.28 -148 53.62 2.82 2.80 2.79 0.02 UD 00SC041 62 58.28 -148 53.62 2.65 2.62 2.60 0.22 TU
00SC043 62 59.13 -148 50.78 2.66 2.63 2.61 0.01 TU 00SC044 62 59.13 -148 50.78 2.37 2.64 2.84 0.01 AR
00SC045 62 57.78 -148 49.82 2.65 2.61 2.59 0.32 TU 00SC046 62 57.67 -148 50.08 2.55 2.41 2.31 0.00 UN
00SC048 62 57.67 -148 50.08 2.75 2.67 2.62 0.02 UV 00SC049 62 40.82 -148 14.41 2.74 2.71 2.69 0.01 QV
00SC050 62 40.46 -148 14.55 2.68 2.65 2.63 0.01 AR 00SC051 62 40.46 -148 14.55 2.66 2.64 2.63 0.32 DA
00SC052 62 59.36 -148 47.85 2.70 2.68 2.67 0.19 TU 00SC053 62 59.45 -148 49.01 2.92 2.83 2.78 0.03 BR
00SC054 62 59.45 -148 49.01 2.73 2.68 2.65 0.05 DA 00SC055 62 59.50 -148 49.80 2.73 2.70 2.68 0.02 UV
00SC056 62 59.56 -148 49.82 2.74 2.70 2.68 0.19 GD

20
Table 3. Density and magnetic susceptibility measurements -- continued.
Latitude Longitude Density Sample ID
deg min deg min Grain Saturated bulk Dry bulkMagnetic
Susceptibility Rock type
00SC057 62 59.45 -148 49.67 2.76 2.74 2.72 0.02 DA 00SC058 62 59.43 -148 50.00 2.64 2.61 2.60 0.02 GR
00SC059 62 59.39 -149 50.14 2.62 2.58 2.56 0.00 GR 00SC060 62 59.15 -148 50.25 2.58 2.50 2.45 0.00 PH
00SC061 62 59.14 -148 50.81 2.60 2.56 2.53 0.00 RH 00SC062 62 59.27 -148 51.03 3.02 2.99 2.98 0.04 US
00SC065 62 39.47 -148 21.93 2.80 2.79 2.78 0.09 BA 00SC11A 62 43.28 -148 23.71 2.70 2.63 2.59 0.00 PH
00SC13A 62 43.48 -148 23.33 2.97 2.94 2.93 0.02 UP 00SC16A 62 43.75 -148 23.18 2.67 2.65 2.64 0.00 UV
00SC16B 62 43.75 -148 23.18 2.89 2.89 2.88 0.04 UP 00SC16C 62 43.75 -148 23.18 2.70 2.69 2.69 0.01 UN
00SC17A 62 43.17 -148 26.13 2.77 2.76 2.75 0.01 VC 00SC21A 62 43.83 -148 23.10 2.72 2.67 2.64 0.03 UV
00sc21B1 62 43.83 -148 23.10 2.68 2.62 2.59 0.01 UV 00sc21B2 62 43.83 -148 23.10 2.67 2.64 2.63 0.00 UV
00sc21B3 62 43.83 -148 23.10 2.68 2.64 2.62 0.01 UV 00SC21C 62 43.83 -148 23.10 2.94 2.92 2.91 0.03 DB
00SC22A 62 43.68 -148 25.55 2.83 2.81 2.80 0.02 TU 00SC22B 62 43.68 -148 25.55 2.77 2.72 2.70 0.02 VC
00SC24A 62 43.68 -148 25.55 2.71 2.68 2.66 0.00 US 00SC32A 62 59.29 -148 50.92 2.71 2.67 2.65 0.01 UM
00SC36A 63 0.24 -148 53.20 2.78 2.75 2.73 0.03 HF 00SC40D 62 58.28 -148 53.62 2.66 2.61 2.58 0.00 UP
00SC42A 62 59.38 -148 50.14 2.69 2.67 2.65 0.02 AR 00SC42B 62 59.38 -148 50.14 2.63 2.60 2.58 0.01 GD
00SC42C 62 59.38 -148 50.14 2.72 2.69 2.67 0.02 GN 00SC42D 62 59.38 -148 50.14 2.67 2.64 2.62 0.01 UN
00SC46A 62 57.67 -148 50.08 2.59 2.50 2.45 0.00 MO 00SC49A 62 40.82 -148 14.41 2.77 2.74 2.73 0.01 QV
00SC58A 62 59.43 -148 50.00 2.67 2.63 2.61 0.01 UV 00SC59A 62 59.39 -149 50.14 2.72 2.68 2.66 0.01 DA
00SC64A 62 39.47 -148 21.93 3.03 3.01 3.00 0.02 AR 00SC64B 62 39.47 -148 21.93 2.63 2.59 2.57 0.01 UN
00TK12 62 37.44 -148 17.24 2.73 2.71 2.70 0.02 BA 00TK12 62 37.44 -148 17.24 2.83 2.81 2.81 0.03 BA
01AG15 62 43.56 -147 53.46 2.87 2.83 2.81 0.03 GN 01AG15 62 43.56 -147 53.46 2.92 2.85 2.81 0.02 GN
01AG15 62 43.56 -147 53.46 3.09 3.02 2.98 0.32 GN
21
Table 3. Density and magnetic susceptibility measurements -- continued.
Latitude Longitude Density Sample ID
deg min deg min Grain Saturated bulk Dry bulkMagnetic
Susceptibility Rock type
01AG16 62 43.50 -147 54.18 2.85 2.79 2.76 0.02 GN 01AG16 62 43.50 -147 54.18 2.91 2.88 2.86 0.02 GN
01AG16 62 43.50 -147 54.18 2.92 2.89 2.87 0.03 GN 01AG16 62 43.50 -147 54.18 2.94 2.91 2.89 0.03 GN
01AG21B 62 39.30 -148 25.38 2.66 2.65 2.64 0.01 UV 01AG25C 62 36.60 -148 12.30 2.81 2.81 2.80 0.25 DI
01AG35C 62 40.02 -148 26.16 2.94 2.92 2.91 0.02 UV 01AG35D 62 40.02 -148 26.16 2.93 2.90 2.88 0.02 UV
01AG39 62 38.64 -148 19.56 2.99 2.97 2.96 0.02 UV 01ANS05F 63 10.56 -149 4.80 2.43 2.38 2.34 0.01 TU
01ANS06A 62 47.46 -148 19.98 2.98 2.92 2.89 0.88 BA 01ANS06B 62 46.92 -148 20.28 2.88 2.83 2.79 0.03 VC
01ANS06C 62 47.28 -148 20.40 2.94 2.90 2.88 1.38 GE 01ANS07A 63 0.12 -147 46.20 2.66 2.66 2.65 0.01 HF
01ANS07A 63 0.12 -147 46.20 2.68 2.65 2.63 0.07 HF 01ANS09B 62 42.30 -148 3.42 2.70 2.62 2.57 0.02 SL
01ANS09B 62 42.30 -148 3.42 2.72 2.67 2.64 0.02 SL 01ANS09B 62 42.30 -148 3.42 2.73 2.69 2.67 0.02 SL
01ANS10B 62 42.66 -148 7.86 3.04 3.01 2.99 3.58 BA 01ANS14D 62 32.76 -148 7.02 2.97 2.94 2.93 0.09 HB
01ANS20B 62 38.34 -148 28.74 2.84 2.81 2.80 0.01 CH 01ANS20G 62 38.76 -148 29.46 2.95 2.92 2.90 0.02 VC
01ANS20H 62 37.92 -148 29.70 2.66 2.65 2.64 0.00 TU 01ANS20K 62 39.18 -148 30.48 2.95 2.94 2.93 0.07 BA
01ANS22B 62 36.30 -148 24.60 2.71 2.68 2.66 0.00 AR 01ANS22E 62 36.24 -148 25.50 2.91 2.89 2.89 0.09 GB
01ANS23A 62 40.44 -148 34.80 2.70 2.37 2.18 0.01 VC 01ANS26B 62 55.56 -148 56.82 2.89 2.84 2.81 0.02 SL
01ANS27C 62 46.14 -148 11.64 2.95 2.91 2.89 0.05 VB 01ANS27F 62 47.22 -148 11.70 2.89 2.87 2.86 0.03 VB
01ANS27J 62 46.44 -148 11.82 2.72 2.70 2.69 0.00 LS 01ANS31B 62 41.76 -148 11.04 2.66 2.65 2.65 0.00 CH
01ANS36B 62 46.68 -148 36.12 2.63 2.58 2.54 0.27 SH 01ANS44A 62 51.00 -148 37.44 2.69 2.57 2.51 0.05 US
01DM14A 63 12.96 -145 56.28 2.90 2.84 2.81 1.13 DN 01DM15A 63 12.72 -145 54.30 3.10 3.05 3.03 0.87 PT
01DM16A 63 13.92 -145 54.18 3.01 2.97 2.94 0.47 BA 01DM27A 62 51.00 -146 18.84 2.98 2.93 2.91 0.05 GE
01DM30A 63 14.52 -145 56.40 3.04 3.03 3.02 0.04 GB
22
Table 3. Density and magnetic susceptibility measurements -- continued.
Latitude Longitude Density Sample ID
deg min deg min Grain Saturated bulk Dry bulkMagnetic
Susceptibility Rock type
01DM32A 63 15.66 -145 57.12 2.71 2.67 2.64 0.02 VB 01DM33A 63 17.04 -145 57.30 3.00 2.95 2.92 0.07 BA
01DM34A 63 17.94 -145 56.88 2.97 2.95 2.94 0.04 VB 01DM35A 63 20.58 -145 58.56 2.97 2.96 2.96 0.18 BR
01DM49A 63 13.92 -146 30.96 2.97 2.93 2.91 0.29 BA 01DM50A 63 13.86 -146 29.88 3.02 3.00 2.99 1.24 BA
01DM51A 63 14.70 -146 27.30 3.04 3.03 3.02 1.99 BA 01DM77A 62 45.60 -146 21.48 3.04 3.00 2.98 0.05 GE
01DM78A 62 47.76 -146 22.08 3.04 2.99 2.97 0.04 GB 01DM85A 63 14.58 -146 3.66 2.64 2.62 2.60 5.31 SE
01DM86A 63 13.92 -146 3.06 3.11 3.06 3.04 1.14 DN 01JS03A 62 36.96 -148 45.18 2.70 2.68 2.67 0.00 LS
01JS05A 62 39.12 -148 48.00 3.21 3.10 3.05 10.42 GB 01JS05B 62 39.12 -148 48.00 3.05 3.02 3.00 10.35 GB
01JS07A 62 43.92 -149 14.10 2.71 2.75 2.77 0.01 GD 01JS07A 62 43.92 -149 14.10 2.78 2.75 2.73 0.16 GD
01JS07B 62 43.92 -149 14.16 2.66 2.63 2.61 2.72 TU 01JS07B 62 43.92 -149 14.16 2.73 2.70 2.68 0.01 TU
01JS07B 62 43.92 -149 14.16 2.75 2.72 2.71 0.04 TU 01JS07C 62 43.92 -149 14.16 2.75 2.72 2.70 0.02 TU
01JS07C 62 43.92 -149 14.16 2.75 2.72 2.71 0.02 TU 01JS08A 62 43.74 -149 14.40 2.59 2.46 2.38 0.00 TU
01JS08D 62 43.62 -149 14.40 2.63 2.57 2.54 0.01 GR 01JS08D 62 43.62 -149 14.40 2.63 2.59 2.56 0.01 GR
01JS10E 62 28.74 -148 47.28 2.87 2.85 2.84 13.90 BA 01JS10E 62 28.74 -148 47.28 2.91 2.89 2.87 1.86 BA
01JS10E 62 28.74 -148 47.28 3.02 2.98 2.96 0.03 GB 01JS10F 62 28.74 -148 47.34 2.71 2.68 2.66 0.01 BA
01JS10H 62 28.74 -148 47.22 2.53 2.36 2.26 0.24 BA 01JS10H 62 28.74 -148 47.22 2.56 2.40 2.30 0.02 BA
01JS10P 62 28.98 -148 47.10 2.71 2.70 2.69 1.84 BA 01JS10P 62 28.98 -148 47.10 2.34 2.05 1.83 0.36 TU
01JS10P 62 28.98 -148 47.10 2.44 2.22 2.08 0.37 TU 01JS11D 62 43.86 -148 5.70 2.98 2.95 2.94 0.03 BA
01JS13C 62 43.98 -148 4.86 2.93 2.92 2.91 0.04 TU 01JS16C 62 32.28 -148 1.44 2.61 2.58 2.56 0.00 PG
01JS20D 62 35.16 -148 18.90 3.10 3.08 3.08 0.03 GN 01JS23A 62 34.68 -148 16.32 2.83 2.82 2.81 1.09 GD
01JS23B 62 34.26 -148 15.72 2.78 2.74 2.72 1.23 GD

23
Table 3. Density and magnetic susceptibility measurements -- continued.
Latitude Longitude Density Sample ID
deg min deg min Grain Saturated bulk Dry bulkMagnetic
Susceptibility Rock type
01JS24B 62 32.10 -148 13.02 2.98 2.94 2.93 0.05 GD 01JS24C 62 32.10 -148 13.02 3.08 3.02 2.99 0.05 GN
01JS27 62 37.62 -148 10.14 3.08 3.06 3.05 6.54 GB 01JS29 62 46.14 -148 38.94 2.78 2.76 2.74 0.03 BA
01JS39C 62 55.56 -149 3.66 2.71 2.61 2.55 0.01 SC 01JS46A 62 42.42 -148 19.56 2.71 2.69 2.69 0.00 GB
01JS49A 62 43.32 -148 24.18 2.70 2.67 2.66 0.00 GB 01JS50 62 43.20 -148 55.32 2.71 2.66 2.64 0.02 LS
01JS51B 62 42.30 -148 28.20 2.63 2.60 2.57 0.00 CO 01JS55C 62 40.80 -148 17.28 2.77 2.75 2.74 0.02 LS
01JS56D 62 40.74 -148 18.30 2.89 2.86 2.84 0.00 LS 01JS61C 62 45.90 -148 31.62 2.80 2.78 2.76 0.05 HF
01JS61D 62 45.90 -148 31.62 2.75 2.74 2.73 0.09 HF 01JS61E 62 45.90 -148 31.62 2.91 2.90 2.89 0.10 GR
01JS62B 62 44.46 -148 36.96 2.69 2.63 2.60 0.06 BA 01JS64A 62 49.44 -148 36.06 2.67 2.64 2.63 0.02 UV
01JS66A 62 46.86 -148 51.12 2.65 2.64 2.63 0.01 GR 01JS66B 62 46.86 -148 51.12 2.69 2.67 2.65 0.01 GT
01JS66D 62 46.86 -148 51.12 2.68 2.66 2.65 0.04 GN 01JS67B 62 45.90 -148 49.08 2.81 2.80 2.80 0.04 BA
01JS71F 62 45.60 -148 43.26 2.96 2.95 2.95 0.12 TU 01JS72 62 47.40 -148 45.48 2.62 2.59 2.57 0.01 GT
01MN06 62 44.04 -147 49.44 2.66 2.64 2.62 0.00 GD 01MN06 62 44.04 -147 49.44 2.76 2.74 2.72 0.05 GD
01MN06 62 44.04 -147 49.44 2.98 2.95 2.94 0.07 GD 01PJ42A 62 47.07 -148 49.11 2.62 2.60 2.58 0.00 GT
01PJ42B 62 47.07 -148 49.11 2.80 2.79 2.79 0.01 BA 01SC09A 62 39.36 -148 22.44 2.99 2.96 2.95 0.01 DI
01SC11B 62 39.42 -148 22.98 2.71 2.54 2.45 0.01 LS 01SC16B 62 39.84 -148 24.06 2.87 2.84 2.83 1.37 MC
01SC18 62 39.90 -148 24.18 3.02 2.97 2.95 0.02 GB 01TK01B 62 29.38 -148 23.73 2.68 2.66 2.65 0.33 GB
01TK04 62 30.27 -148 28.08 1.93 1.92 1.91 2.15 GD 01TK04 62 30.27 -148 28.08 2.75 2.72 2.71 1.39 GD
01TK06 62 32.69 -148 33.21 2.68 2.65 2.63 1.49 BA 01TK06 62 32.69 -148 33.21 2.72 2.68 2.66 1.27 BA
01TK06 62 32.69 -148 33.21 2.73 2.69 2.66 1.35 BA 01TK06 62 32.69 -148 33.21 2.74 2.66 2.62 1.27 BA
01TK26 62 57.91 -148 55.07 2.65 2.58 2.53 0.36 UP
24
Table 3. Density and magnetic susceptibility measurements -- continued.
Latitude Longitude Density Sample ID
deg min deg min Grain Saturated bulk Dry bulkMagnetic
Susceptibility Rock type
01TK27 62 59.60 -148 59.52 2.64 2.59 2.56 0.01 BA 01TK27 62 59.60 -148 59.52 2.66 2.64 2.64 0.01 BA
01TK27 62 59.60 -148 59.52 2.68 2.61 2.57 0.01 BA 01TK27 62 59.60 -148 59.52 2.72 2.68 2.65 0.01 BA
01TK29 63 1.78 -149 2.77 2.64 2.61 2.59 0.04 GT 01TK51 63 6.32 -149 24.40 2.92 2.90 2.89 0.06 US
01TK57A 63 10.84 -149 36.51 2.69 2.68 2.68 0.02 SS 01TK83 63 3.02 -147 48.90 2.61 2.53 2.49 0.01 SL
01TK83 63 3.02 -147 48.90 2.63 2.58 2.55 0.01 SL 01TK86 63 1.33 -147 44.71 2.66 2.64 2.63 0.01 GB
01TK86 63 1.33 -147 44.71 2.69 2.66 2.65 0.01 GB 01TK86 63 1.33 -147 44.71 2.70 2.68 2.66 0.01 GB
01TK86 63 1.33 -147 44.71 2.93 2.90 2.88 0.72 GB 01TK86 63 1.33 -147 44.71 3.15 3.12 3.11 0.09 GB
02DM001 63 18.62 -146 18.84 2.99 2.97 2.96 0.05 MC 02DM002 63 20.84 -146 15.73 2.76 2.74 2.73 0.02 US
02DM003 63 18.50 -146 17.30 2.79 2.78 2.77 0.02 MD 02DM003B1 63 18.50 -146 17.30 2.50 2.40 2.34 1.27 CO
02DM004 63 20.19 -146 17.55 2.89 2.88 2.87 0.02 AN 02DM005 63 18.70 -146 23.76 2.79 2.78 2.77 0.01 GD
02DM008 63 16.69 -146 18.39 2.96 2.96 2.95 2.71 DN 02DM009 63 16.64 -146 27.33 2.98 2.93 2.90 0.77 MD
02DM012 63 15.45 -146 27.04 3.01 2.98 2.97 3.97 MD 02DM013 63 15.50 -146 24.62 2.98 2.96 2.95 1.20 MD
02DM017 63 13.59 -146 17.53 3.00 2.99 2.98 1.11 MD 02DM018 63 13.09 -146 20.90 3.01 2.99 2.99 1.98 BA
02DM019A 63 12.40 -146 18.17 3.04 3.01 3.00 1.44 BA 02DM019B 63 12.40 -146 18.17 2.99 2.96 2.94 2.50 MD
02DM022 63 9.90 -146 20.24 3.01 2.99 2.99 1.74 BA 02DM023 63 8.72 -146 18.64 3.03 3.02 3.01 2.08 BA
02DM024 63 8.16 -146 17.14 3.05 3.03 3.02 1.09 BA 02DM025 63 8.16 -146 21.32 3.02 3.00 2.98 1.92 BA
02DM033A 63 24.48 -145 56.52 2.76 2.73 2.71 0.02 SC 02DM033B 63 24.48 -145 56.52 2.65 2.63 2.62 0.00 GD
02DM034A 63 18.92 -145 32.53 2.81 2.81 2.80 2.47 BA 02DM034B 2. 2. 2. 63 18.92 -145 32.53 98 97 97 0.03 BA
02DM035 63 21.34 -145 41.75 2. 2. 2. 64 63 61 3.71 BA 02DM036A 2. 2. 2. 63 15.16 -145 36.31 87 85 84 0.01 DA
02DM036B 2. 2. 2. 63 15.16 -145 36.31 82 80 79 0.01 DA

25
Table 3. Density and magnetic susceptibility measurements -- continued.
Latitude Longitude Density Sample ID
deg min deg min Grain Saturated bulk Dry bulkMagnetic
Susceptibility Rock type
02DM036C 2. 2. 2. 63 15.16 -145 36.31 73 71 70 0.02 DA 02DM038 63 16.09 -145 32.48 2. 2. 2. 69 68 67 0.01 AN
02DM039 63 18.60 -146 4.24 2. 2. 2. 67 64 62 0.01 UV 02DM040 63 17.96 -146 1.19 3. 3. 2. 04 01 99 0.04 BA
02DM045 63 14.53 -145 33.78 2. 2. 2. 71 70 70 0.01 BA 02DM053 63 6.08 -145 43.92 2. 2. 2. 90 87 86 0.02 GD
02DM054 63 5.62 -145 45.47 2. 2. 2. 96 92 90 0.02 FS 02DM060 63 6.29 -145 49.45 2. 2. 2. 96 93 91 0.04 GD
02DM061 63 7.68 -145 52.36 2. 2. 2. 99 95 93 0.65 BA 02DM062 63 7.03 -145 47.61 3. 2. 2. 00 98 98 0.05 DI
02DM068 63 0.08 -145 57.66 2. 2. 2. 97 94 92 0.03 UV 02DM070 63 12.74 -146 41.28 2. 2. 2. 80 77 76 0.69 BA
02DM072 63 14.07 -146 37.35 2. 2. 2. 99 98 98 2.22 BA 02DM077 63 18.33 -146 40.78 2. 2. 2. 74 70 67 0.03 SC
02DM078 63 14.91 -146 48.94 2. 2. 2. 73 70 68 0.02 SC 02DM085 63 6.58 -146 51.17 3. 2. 2. 00 99 99 0.11 BA
02DM086 63 6.55 -146 56.78 3. 3. 3. 03 02 02 3.46 BA 02DM090 63 21.02 -145 28.94 2. 2. 2. 71 69 68 0.01 SC
02DM091 63 19.40 -145 53.64 2. 2. 2. 92 92 91 1.13 DN 02DM092 63 20.29 -145 52.71 2. 2. 2. 74 73 73 0.00 UV
02DM093 63 19.70 -145 59.61 2. 2. 2. 99 98 98 0.12 GB 02DM094A 63 19.03 -146 29.14 2. 2. 2. 87 86 85 0.02 MD
02DM094B 63 19.03 -146 29.14 2. 2. 2. 90 88 86 0.02 FS 02DM095 63 17.65 -146 28.65 3. 3. 3. 01 00 00 0.14 BA
02DM096 63 20.79 -146 30.32 2. 2. 2. 76 74 72 0.02 SC 02DM097 63 20.26 -146 46.19 2. 2. 2. 95 91 90 0.02 SC
02DM098 63 17.47 -146 38.14 3. 3. 2. 00 00 99 1.11 BA 02DM099 63 16.65 -146 35.95 3. 3. 3. 04 04 03 2.07 BA
02DM100 63 17.56 -145 33.33 2. 2. 2. 77 75 74 1.72 TU 02DM102 63 19.99 -146 1.08 2. 2. 2. 74 72 71 0.03 TU
02DM103 63 21.35 -146 2.89 2. 2. 2. 77 75 73 0.02 SL 02DM104 63 20.30 -146 5.70 2. 2. 2. 73 72 72 0.02 BA
02DMA 63 16.09 -145 32.48 3. 3. 3. 03 03 02 0.05 MD 02DMB 63 0.19 -146 4.24 2. 2. 2. 72 71 71 0.02 MD
02DMC 63 17.96 -146 1.19 2. 2. 2. 80 79 79 0.03 MD 99ARJ25 62 20.11 -149 12.48 - - - 1.59 BA
99ARJ27 62 17.4 -149 15.71 - - - 1.59 GB 99ARJ28 62 17.91 -149 9.43 - - - 1.99 DI
99ARJ29 62 19.18 -149 10.55 - - - 2.39 GB

26
Table 3. Density and magnetic susceptibility measurements -- continued.
Latitude Longitude Density Sample ID
deg min deg min Grain Saturated bulk Dry bulkMagnetic
Susceptibility Rock type
99ARJ30 62 20.17 -149 3.73 - - - 0.00 LS 99ARJ30A 62 20.17 -149 3.73 - - - 1.03 US
99ARJ30B 62 20.17 -149 3.73 - - - 0.00 UN 99ARJ30C 62 20.17 -149 3.73 - - - 0.04 DI
99ARJ31 62 19.95 -149 3.55 - - - 0.06 GE 99ARJ32 62 19.85 -149 2.73 - - - 0.06 MC
99ARJ33 62 21.26 -149 3.26 - - - 1.03 BA 99ARJ34A 62 21.37 -149 3.92 - - - 0.40 UN
99ARJ34B 62 21.37 -149 3.92 - - - 0.56 GB 99ARJ34C 62 21.37 -149 3.92 - - - 0.06 GB
99ARJ35A 62 23.14 -149 4.59 - - - 0.20 DB 99ARJ35B1 62 23.14 -149 4.59 - - - 0.56 GB
99ARJ35B2 62 23.14 -149 4.59 - - - 0.09 BA 99ARJ37 62 23.89 -149 3.59 - - - 1.19 UN
99ARJ37A 62 23.89 -149 3.59 - - - 1.90 VC 99ARJ37B 62 23.89 -149 3.59 - - - 0.36 GE
99ARJ37C 62 23.89 -149 3.59 - - - 0.87 VC 99ARJ38 62 23.88 -149 3.23 - - - 0.08 UN
99ARJ38A 62 23.88 -149 3.23 - - - 0.20 UP 99ARJ38B 62 23.88 -149 3.23 - - - 0.01 UN
99ARJ39 62 23.71 -149 3.36 - - - 0.02 UN 99ARJ39A 62 23.71 -149 3.36 - - - 0.01 GB
99ARJ39B 62 23.71 -149 3.36 - - - 0.00 UD 99ARJ39C 62 23.71 -149 3.36 - - - 0.00 GT
99ARJ41 62 25.14 -149 3.35 - - - 0.02 GB 99ARJ42 62 25.27 -149 3.65 - - - 0.08 UN
99ARJ42A 62 25.27 -149 3.65 - - - 0.05 GT 99ARJ42B 62 25.27 -149 3.65 - - - 0.00 UN
99ARJ44 62 25.94 -149 4.18 - - - 0.02 UN 99ARJ44A 62 2 5.94 -149 4.18 - - - 0.02 SS
99ARJ44B 62 2 5.94 -149 4.18 - - - 0.00 BR 99ARJ46 62 23.73 -149 1.24 - - - 0.00 GR
99ARJ52A 62 26.55 -149 5.43 - - - 0.02 VC 99ARJ52B 62 26.55 -149 5.43 - - - 0.00 VC
99ARJ53 62 26.44 -149 5.38 - - - 0.02 UN 99ARJ53A 62 26.44 -149 5.38 - - - 0.02 VC
99ARJ54 62 26.25 -149 5.25 - - - 0.04 UN 99ARJ54A 62 26.25 -149 5.25 - - - 0.05 VC
99ARJ54B 62 26.25 -149 5.25 - - - 0.03 SE
27
Table 3. Density and magnetic susceptibility measurements -- continued.
Latitude Longitude Density Sample ID
deg min deg min Grain Saturated bulk Dry bulkMagnetic
Susceptibility Rock type
99ARJ54C 62 26.25 -149 5.25 - - - 0.03 GB 99ARJ55 62 26.2 -149 5.09 - - - 0.03 UN
99ARJ55A 62 26.2 -149 5.09 - - - 0.02 VC 99ARJ55B 62 26.2 -149 5.09 - - - 0.02 TU
99ARJ55C 62 26.2 -149 5.09 - - - 0.02 VC 99ARJ56 62 26.1 -149 4.77 - - - 0.03 SE
99ARJ57 62 26.07 -149 4.59 - - - 0.03 DI 99ARJ58 62 26.03 -149 4.41 - - - 0.03 SS
99ARJ59 62 17.95 -149 12.4 - - - 0.48 UN 99ARJ59A 62 17.95 -149 12.4 - - - 0.03 GB
99ARJ59B 62 17.95 -149 12.4 - - - 0.74 US 99ARJ60 62 20.37 -149 1.49 - - - 2.79 GS
99ARJ60A 62 20.37 -149 1.49 - - - 3.06 BA 99ARJ60B 62 20.37 -149 1.49 - - - 0.07 SC
99ARJ61 62 20.37 -149 1.78 - - - 0.00 UN 99ARJ63 62 20.17 -149 2.92 - - - 0.00 UN
99ARJ65 62 18.82 -149 3.96 - - - 0.00 UN 99ARJ66A 62 16.67 -149 1.04 - - - 1.39 TU
99ARJ66B 62 16.67 -149 1.04 - - - 0.05 GB 99ARJ68 62 22.67 -149 2.03 - - - 0.70 GB
99ARJ69 62 20.35 -149 5.33 - - - 1.25 BA 99ARJ70A 62 17.22 -149 3.37 - - - 0.03 DI
99ARJ70B 62 17.22 -149 3.37 - - - 0.23 PG 99ARJ70C 62 17.22 -149 3.37 - - - 0.02 MC
99ARJ70D 62 17.22 -149 3.37 - - - 1.49 GB 99ARJ71A 62 17.71 -149 3.68 - - - 0.01 TU
99ARJ71B 62 17.71 -149 3.68 - - - 0.01 TU 99ARJ72 62 16.93 -149 4.02 - - - 0.02 GB
99ARJ73A 62 19 -149 13.04 - - - 0.09 TU 99ARJ73B 1 62 19 -149 3.04 - - - 0.68 GB
99ARJ73C 62 19 -149 13.04 - - - 0.14 MC 99JS23 62 20.08 -149 10.81 - - - 1.75 BA
99JS24 62 20.18 -149 1 3.46 - - - 0.12 UN 99JS25A 62 17.9 -149 16.36 - - - 0.01 GR
99JS25B 62 17.9 -149 16.36 - - - 2.39 UN 99JS26 62 17.98 -149 11.75 - - - 1.75 DI
99JS27A 62 19.12 -149 9.87 - - - 1.19 UN 99JS27B 62 19.12 -149 9.87 - - - 0.24 UN
99JS28A 62 19.65 -149 3.3 - - - 0.05 DI

28
Table 3. Density and magnetic susceptibility measurements -- continued.
Latitude Longitude Density Sample ID
deg min deg min Grain Saturated bulk Dry bulkMagnetic
Susceptibility Rock type
99JS28B 62 19.65 -149 3.3 - - - 0.02 UN 99JS28C 62 19.65 -149 3.3 - - - 0.01 UN
99JS28D 62 19.65 -149 3.3 - - - 0.00 UN 99JS28E 62 19.65 -149 3.3 - - - 0.02 UN
99JS28F 62 19.65 -149 3.3 - - - 0.02 UN 99JS28G 62 19.65 -149 3.3 - - - 0.00 UN
99JS28H 62 19.67 -149 3.36 - - - 0.02 UN 99JS28J 62 19.75 -149 3.43 - - - 0.02 UN
99JS28L 62 19.81 -149 3.48 - - - 0.01 UN 99JS28M 62 19.85 -149 3.51 - - - 0.01 UN
99JS29A 62 21.07 -149 0.94 - - - 0.20 UN 99JS29B 62 21.07 -149 0.94 - - - 0.03 UN
99JS29D 62 21.16 -149 0.85 - - - 1.03 UN 99JS29E 62 21.17 -149 1.01 - - - 0.02 UN
99JS29G 62 21.24 -149 1.43 - - - 0.00 UN 99JS29H 62 21.24 -149 1.43 - - - 0.00 UN
99JS31A 62 23.59 -149 4.22 - - - 0.72 UN 99JS31B 62 23.59 -149 4.22 - - - 0.06 UN
99JS31C 62 23.59 -149 4.22 - - - 0.05 UN 99JS32A 62 23.94 -149 4.66 - - - 0.08 UN
99JS33A 62 24.9 -149 3.51 - - - 0.02 GB 99JS34A 62 25.04 -149 3.64 - - - 0.01 UN
99JS34B 62 25.07 -149 3.67 - - - 0.01 UN 99JS34C 62 25.11 -149 3.72 - - - 0.00 UN
99JS35A 62 24.62 -149 3.5 - - - 0.04 UN 99JS35B 62 24.68 -149 3.67 - - - 0.02 UN
99JS35D 62 24.69 -149 3.96 - - - 0.00 UN 99JS35F 62 24.69 -149 4.06 - - - 0.02 UN
99JS35G 62 24.69 -149 4.11 - - - 0.00 UN 99JS35H 62 24.71 -149 4.2 - - - 0.04 UN
99JS36A 62 22.95 -149 3.24 - - - 1.19 BA 99JS39A 62 24.7 -149 3.32 - - - 0.01 UN
99JS39B 62 24.71 -149 3.2 - - - 0.00 UN 99JS39C 62 24.69 -149 2.95 - - - 0.01 UN
99JS39E 62 24.6 -149 2.69 - - - 0.00 UN 99JS40A 62 24.33 -149 1.17 - - - 0.01 GB
99JS41C 62 23.14 -149 7.84 - - - 0.08 UN 99JS41D 62 23.1 -149 8.07 - - - 2.58 UN
99JS41E 62 23.08 -149 8.49 - - - 0.00 UN

29
Table 3. Density and magnetic susceptibility measurements -- continued.
Latitude Longitude Density Sample ID
deg min deg min Grain Saturated bulk Dry bulkMagnetic
Susceptibility Rock type
99JS41F 62 23.07 -149 8.67 - - - 0.00 UN 99JS42 62 19.07 -149 9.21 - - - 1.99 DI
99JS43 62 20.84 -149 2.71 - - - 0.02 UN 99JS44A 62 20.44 -148 59.8 - - - 0.10 UN
99JS44B 62 20.44 -148 59.8 - - - 0.00 UN 99JS44C 62 20.44 -148 59.8 - - - 0.01 UN
99JS44D 62 20.44 -148 59.8 - - - 0.01 UN 99JS45A 62 20.22 -149 0.89 - - - 0.01 UN
99JS45B 62 20.22 -149 0.89 - - - 0.02 UN 99JS46A 62 20.5 -149 3.23 - - - 0.04 UN
99JS46B 62 20.5 -149 3.23 - - - 1.43 UN 99JS46F 62 20.5 -149 3.23 - - - 2.39 BA
99JS46G 62 20.5 -149 3.23 - - - 2.39 UN 99JS47A 62 19.46 -149 4.11 - - - 0.00 UN
99JS48A 62 16.13 -149 1.59 - - - 0.95 UN 99JS48B 62 16.13 -149 1.59 - - - 0.95 DA
99JS49A 62 19.21 -149 1.58 - - - 0.26 DI 99JS49C 62 19.21 -149 1.58 - - - 0.01 UN
99JS49D 62 19.21 -149 1.58 - - - 0.04 UN 99JS49F 62 19.21 -149 1.42 - - - 0.00 UN
99JS49G 62 19.21 -149 1.42 - - - 0.01 UN 99JS49H 62 19.21 -149 1.42 - - - 0.01 UN
99JS49J 62 19.21 -149 1.23 - - - 0.01 UN 99JS50 62 19.83 -149 0.84 - - - 0.00 UN
99JS51 62 21.99 -149 8.19 - - - 0.79 UN 99JS52 62 21.82 -149 9.97 - - - 0.74 GB
99JS53A 62 22.2 -149 12.12 - - - 0.09 UN 99JS53B 62 22.2 -149 12.12 - - - 0.03 UN
99JS54A 62 22.41 -149 14.34 - - - 0.84 GB 99JS54B 62 22.41 -149 14.34 - - - 0.31 UN
99JS55A 62 23.07 -149 13.44 - - - 0.04 GD 99JS55B 62 23.27 -149 12.59 - - - 0.31 UN
99JS56 62 18.64 -149 15.18 - - - 0.01 GR 99JS57B 62 18.24 -149 14.75 - - - 0.02 UN
99JS58A 62 18.77 -149 13.67 - - - 0.04 UN 99JS58B 62 18.77 -149 13.67 - - - 0.86 UN
99JS59A 62 18.19 -149 8.2 - - - 0.90 DI 99JS61A 62 22.03 -149 0.42 - - - 2.15 UN
99JS61B 62 22.37 -148 59.72 - - - 0.80 UN

30
Table 3. Density and magnetic susceptibility measurements -- continued.
Latitude Longitude Density Sample ID
deg min deg min Grain Saturated bulk Dry bulkMagnetic
Susceptibility Rock type
99JS62 62 22.27 -149 2.43 - - - 0.37 UN 99JS63 62 22.55 -149 3.14 - - - 0.70 UN
99JS64A 62 21.13 -149 5.58 - - - 0.02 BA 99JS64B 62 21.13 -149 5.58 - - - 0.00 UN
99JS64C 62 21.06 -149 5.78 - - - 0.00 UN 99JS65A 62 17.17 -149 4.1 - - - 0.02 UN
99JS65B 62 17.17 -149 4.1 - - - 0.00 UN 99JS66A 62 17.41 -149 6.21 - - - 1.69 UN
99JS66B 62 17.41 -149 6.21 - - - 0.80 UN 99JS66C 62 17.49 -149 6.68 - - - 0.30 UN
99JS66E 62 17.48 -149 6.86 - - - 0.72 UN 99JS67 62 19.26 -149 11.93 - - - 0.09 UN
99MBW403 62 23.65 -149 17.5 - - - 0.45 GD 99MBW405A 62 23.83 -149 17.75 - - - 1.05 HF
99MBW406 62 23.91 -149 18.05 - - - 0.76 GD 99MBW407 62 24.01 -149 18.12 - - - 0.11 UP
99MBW408A 62 23.91 -149 18.52 - - - 1.50 VC 99MBW408B 62 23.91 -149 18.52 - - - 1.24 VC
99MBW410A 62 24.19 -149 18.92 - - - 0.96 GD 99MBW410B - 62 24.19 -149 18.92 - - 0.31 AP
99MBW411 62 20.14 -149 13.45 - - - 1.29 AN 99MBW414 62 19.56 -149 16.24 - - - 0.56 GB
99MBW415 62 19.6 -149 16.14 - - - 0.86 GB 99MBW416 62 18.54 -149 12.92 - - - 3.15 GB
99MBW418B 62 18.5 -149 10.58 - - - 1.29 MO 99MBW419A 62 21.1 -149 0.64 - - - 0.10 AN
99MBW419B 62 21.1 -149 0.64 - - - 0.05 GB 99MBW419C 62 21.1 -149 0.64 - - - 0.16 GR
99MBW420B 62 21.01 -149 0.72 - - - 0.05 AN 99MBW421 62 20.99 -149 0.74 - - - 1.50 GB
99MBW422 62 21.02 -149 1.05 - - - 0.05 GB 99MBW423 62 21.01 -149 1.13 - - - 0.00 GB
99MBW424 62 21.06 -149 1.19 - - - 0.00 UV 99MBW426 62 2 1.04 -149 1.21 - - - 0.00 LS
99MBW427 62 21.09 -149 1.34 - - - 0.04 TU 99MBW428 62 21.05 -149 1.31 - - - 0.09 AN
99MBW429 62 21.09 -149 1.45 - - - 0.00 LS 99MBW430A 62 21.08 -149 1.47 - - - 0.66 GE
99MBW430B 62 21.08 -149 1.47 - - - 0.01 UN

31
Table 3. Density and magnetic susceptibility measurements -- continued.
Latitude Longitude Density Sample ID
deg min deg min Grain Saturated bulk Dry bulkMagnetic
Susceptibility Rock type
99MBW431 62 21.08 -149 1.52 - - - 0.00 UN 99MBW432 62 21.11 -149 1.57 - - - 0.00 LS
99MBW433 62 21.14 -149 1.69 - - - 0.38 SH 99MBW434A 62 21.12 -149 1.72 - - - 1.85 AN
99MBW434B 62 21.12 -149 1.72 - - - 0.00 DO 99MBW434C 62 21.12 -149 1.72 - - - 0.00 DO
99MBW434D 62 21.12 -149 1.72 - - - 0.00 LS 99MBW435 62 21.13 -149 1.77 - - - 0.78 GB
99MBW436 62 21.15 -149 1.86 - - - 0.03 UV 99MBW437 62 21.51 -149 3.93 - - - 1.16 GE
99MBW438 62 28.59 -149 2 9.87 - - - 1.21 VB 99MBW439A 62 28.58 -149 29.85 - - - 0.28 VB
99MBW440 62 23.74 -149 4.84 - - - 0.14 GB 99MBW441A 62 23.77 -149 4.72 - - - 2.45 RH
99MBW442 62 23.81 -149 4.73 - - - 3.41 GB 99MBW446B 62 23.68 -149 4.51 - - - 0.00 PG
99MBW446C 62 23.68 -149 4.51 - - - 1.14 GB 99MBW449A 62 23.73 -149 4.52 - - - 0.04 GB
99MBW449B 62 23.73 -149 4.52 - - - 0.33 UP 99MBW450 62 23.69 -149 4.31 - - - 0.98 GD
99MBW452 62 25.17 -149 3.83 - - - 0.01 UN 99MBW453 62 25.2 -149 3.84 - - - 0.00 GR
99MBW454 62 25.22 -149 3.88 - - - 0.00 GR 99MBW455 62 25.27 -149 4 - - - 0.02 GB
99MBW456 62 25.34 -149 4.04 - - - 0.00 GR 99MBW457 62 25.36 -149 4.1 - - - 0.08 MC
99MBW458 62 25.45 -149 4.33 - - - 0.03 GR 99MBW459 62 25.2 -149 3.07 - - - 0.03 GB
99MBW460 62 25.29 -149 3.17 - - - 0.03 GB 99MBW464 62 25.53 -149 3.3 - - - 0.00 GR
99MBW465 62 25.6 -149 3.34 - - - 0.06 HF 99MBW468 62 25.08 -149 2.72 - - - 0.05 GB
99MBW469 62 25.01 -149 2.7 - - - 0.01 UP 99MBW470 62 25 -149 2.73 - - - 0.03 US
99MBW472 62 24.97 -149 2.65 - - - 0.03 GB 99MBW473 62 24.96 -149 2.61 - - - 0.01 US
99MBW474 62 24.95 -149 2.62 - - - 0.02 DI 99MBW475 62 24.93 -149 2.5 - - - 0.01 UN
99MBW476 62 24.92 -149 2.41 - - - 0.03 DI

32
Table 3. Density and magnetic susceptibility measurements -- continued.
Latitude Longitude Density Sample ID
deg min deg min Grain Saturated bulk Dry bulkMagnetic
Susceptibility Rock type
99MBW477 62 24.91 -149 2.36 - - - 0.04 AN 99MBW478 62 24.89 -149 2.35 - - - 0.02 DI
99MBW480 62 24.86 -149 2.28 - - - 0.03 BA 99MBW481 62 24.84 -149 2.23 - - - 0.01 GR
99MBW484 62 24.79 -149 1.95 - - - 0.02 UV 99MBW485 62 24.79 -149 1.93 - - - 0.05 GB
99MBW486 62 24.78 -149 1.83 - - - 0.01 UV 99MBW487 62 24.78 -149 1.84 - - - 1.09 UP
99MBW488 62 24.78 -149 1.75 - - - 0.02 MC 99MBW491 62 24.73 -149 1.2 - - - 0.05 GB
99MBW492 62 24.64 -149 1.1 - - - 0.01 DI 99MBW493 62 24.43 -149 0.92 - - - 0.05 BA
99MBW494 62 23.09 -149 7.43 - - - 0.06 BA 99MBW495 62 22.99 -149 7.37 - - - 0.24 BA
99MBW498 62 22.96 -149 7.28 - - - 0.93 BA 99MBW499 62 22.82 -149 7.22 - - - 0.02 VB
99MBW500 62 22.75 -149 7.24 - - - 2.11 BA 99MBW501 62 22.73 -149 7.23 - - - 0.02 BA
99MBW502 62 22.65 -149 7.24 - - - 0.60 VB 99MBW503 62 22.6 -149 7.34 - - - 1.42 BA
99MBW505 62 22.43 -149 7.18 - - - 0.03 VB 99MBW506 62 20.43 -149 19.87 - - - 1.78 GB
99MBW507 62 18.83 -149 11.16 - - - 2.29 GB 99MBW508 62 18.83 -149 11.04 - - - 3.80 BA
99MBW513 62 20.35 -149 1.34 - - - 0.01 UN 99MBW514 62 19.96 -149 1.6 - - - 1.11 DI
99MBW515 62 19.83 -149 1.48 - - - 0.01 MC 99MBW516 62 19.8 -149 1.45 - - - 1.01 RH
99MBW517 62 19.82 -149 1.44 - - - 0.10 UN 99MBW519 62 20.93 -149 6.18 - - - 0.01 GR
99MBW520 62 18.53 -149 6.38 - - - 0.19 FI 99MBW521 62 17.69 -149 4.92 - - - 0.01 HF
99MBW522 62 17.73 -149 4.99 - - - 2.37 HF 99MBW523 62 17.74 -149 4.84 - - - 0.03 DI
99MBW524 62 17.74 -149 4.83 - - - 0.23 GD 99MBW525 62 17.82 -149 4.78 - - - 0.66 DI
99MBW527A 62 21.48 -149 0.32 - - - 0.00 LS 99MBW527C 62 21.48 -149 0.32 - - - 1.55 PH
99MBW527D 62 21.48 -149 0.32 - - - 0.04 GE

33
Table 3. Density and magnetic susceptibility measurements -- continued.
Latitude Longitude Density Sample ID
deg min deg min Grain Saturated bulk Dry bulkMagnetic
Susceptibility Rock type
99MBW528 62 21.55 -149 0.39 - - - 1.25 GE 99MBW529A 62 21.53 -149 0.39 - - - 0.00 FV
99MBW532 62 21.61 -149 0.49 - - - 0.03 PH 99MBW534 62 21.62 -149 0.56 - - - 0.99 BA
99MBW535 62 21.62 -149 0.67 - - - 0.03 PH 99MBW537 62 21.63 -149 0.93 - - - 0.02 GE
99MBW540 62 22.23 -149 11.29 - - - 1.60 GR 99MBW541B 62 22.2 -149 12.93 - - - 0.75 GB
99MBW542 62 22.53 -149 12.63 - - - 1.19 DI 99MBW544 62 23.59 -149 6.88 - - - 0.03 AN
99MBW546A 62 23.67 -149 6.72 - - - 0.37 UN 99MBW546B 62 23.67 -149 6.72 - - - 0.17 GB
99MBW548 62 23.74 -149 6.58 - - - 0.20 BA 99MBW550B 62 23.84 -149 6.48 - - - 0.01 UP
99MBW551A 62 18.91 -149 15.49 - - - 0.00 UP 99MBW551B 62 18.91 -149 15.49 - - - 1.36 BA
99MBW551C 62 18.91 -149 15.49 - - - 0.47 VC 99MBW552 62 18.47 -149 15.33 - - - 0.47 GB
99MBW554B 62 19.52 -149 8.54 - - - 1.23 BA 99MBW556 62 23.88 -148 59.78 - - - 0.85 DA
99MBW557A 62 23.81 -148 59.77 - - - 1.83 BA 99MBW557B 62 23.81 -148 59.77 - - - 0.24 BA
99MBW558 62 23.60 -148 59.64 - - - 0.19 BA 99MBW559 62 23.54 -148 59.78 - - - 0.15 BA
99MBW563 62 20.56 -149 6.14 - - - 0.05 GB 99MBW575 62 18.62 -149 14.57 - - - 0.06 BA
99PE10A 62 20.39 -149 4.27 - - - 2.17 UN 99PE10B 62 20.39 -149 4.27 - - - 0.43 GE
99PE11A 62 20.38 -149 4.17 - - - 1.75 GE 99PE11B 62 20.38 -149 4.17 - - - 0.03 UN
99PE12 62 20.3 -149 4.02 - - - 0.01 CH 99PE14 62 21.55 -149 2.88 - - - 1.67 GB
99PE15 62 21.71 -149 2.9 - - - 0.48 BA 99PE16 62 21.79 -149 3.17 - - - 0.06 UN
99PE17 62 21.77 -149 3.45 - - - 2.39 GE 99PE2 62 23.81 -149 18.16 - - - 3.18 AN
99PE20 62 23.49 -149 3.87 - - - 1.59 GB 99PE20A 62 23.49 -149 3.87 - - - 0.61 GE
99PE20B 62 23.49 -149 3.87 - - - 0.03 UN

34
Table 3. Density and magnetic susceptibility measurements -- continued.
Latitude Longitude Density Sample ID
deg min deg min Grain Saturated bulk Dry bulkMagnetic
Susceptibility Rock type
99PE21 62 23.4 -149 3.76 - - - 0.01 MC 99PE22 62 23.28 -149 3.74 - - - 1.99 AN
99PE23 62 23.15 -149 3.77 - - - 0.00 FI 99PE24 62 23.01 -149 3.86 - - - 0.01 GR
99PE25 62 22.87 -149 3.8 - - - 2.79 GE 99PE26 62 24.47 -149 3.86 - - - 0.00 GB
99PE27 62 24.45 -149 4.06 - - - 0.10 US 99PE28 62 24.47 -149 4.15 - - - 0.04 GB
99PE29 62 24.48 -149 4.29 - - - 0.02 DI 99PE3 62 23.89 -149 18.35 - - - 0.03 BA
99PE30 62 24.41 -149 4.4 - - - 0.04 DI 99PE32 62 24.51 -149 4.65 - - - 0.03 DI
99PE34 62 24.22 -149 4.96 - - - 0.01 FP 99PE35 62 24.2 -149 5.24 - - - 0.04 DI
99PE36 62 24.25 -149 5.55 - - - 0.08 GR 99PE37 62 23.99 -149 0.07 - - - 0.02 TU
99PE38 62 24.02 -149 0.25 - - - 0.00 TU 99PE39 62 24.09 -149 0.68 - - - 1.99 BA
99PE4 62 23.97 -149 18.48 - - - 1.59 AR 99PE40 62 25.39 -149 1.79 - - - 0.03 GB
99PE40B 62 25.39 -149 1.79 - - - 0.04 LS 99PE45 62 25.13 -149 0.52 - - - 0.08 BA
99PE45B 62 25.13 -149 0.52 - - - 0.00 GR 99PE45C 62 25.13 -149 0.52 - - - 0.02 UP
99PE45D 62 25.13 -149 0.52 - - - 0.02 DI 99PE47 62 24.69 -149 0.69 - - - 0.02 GR
99PE48 62 24.41 -149 0.65 - - - 0.40 BA 99PE49 62 23.2 -149 7.47 - - - 0.08 TR
99PE5 62 20.26 -149 11.73 - - - 0.88 BA 99PE53 62 23.68 -149 7.35 - - - 0.05 GR
99PE54 62 23.74 -149 7.25 - - - 0.01 FI 99PE55 62 23.84 -149 7.16 - - - 0.08 TR
99PE59 62 20.3 -149 0.48 - - - 0.03 GE 99PE6 62 17.59 -149 15.96 - - - 1.35 BA
99PE60 62 20.28 -149 0.68 - - - 0.04 DI 99PE61 62 20.61 -149 3.52 - - - 1.59 GB
99PE63 62 20.67 -149 3.8 - - - 0.01 GE 99PE64A 62 18.17 -149 5.55 - - - 1.11 UP
99PE64B 62 18.17 -149 5.55 - - - 0.72 UP
35
Table 3. Density and magnetic susceptibility measurements -- continued.
Latitude Longitude Density Sample ID
deg min deg min Grain Saturated bulk Dry bulkMagnetic
Susceptibility Rock type
99PE66 62 17.75 -149 3.35 - - - 1.19 DI 99PE7 62 18.36 -149 8.74 - - - 0.08 LS
99PE8 62 18.48 -149 8.9 - - - 0.12 GD 99PE9A 62 20.44 -149 4.39 - - - 7.96 UN
99RJN500 62 19.14 -149 0.58 - - - 1.99 UN 99RJN501A 62 19.15 -149 0.84 - - - 0.04 HF
99RJN501B 62 19.15 -149 0.84 - - - 0.04 GE 99RJN502 62 19.19 -149 1.04 - - - 0.02 VB
99RJN503 62 19.21 -149 1.13 - - - 0.08 DI 99RJN504A 62 19.87 -149 0.97 - - - 0.04 DI
99RJN504B 62 19.87 -149 0.97 - - - 0.60 PO 99RJN504C 62 19.87 -149 0.97 - - - 0.08 HF
99RJN505 62 19.83 -149 1.08 - - - 0.56 HF 99RJN506 62 22.39 -149 8.35 - - - 1.59 BA
99RJN507 62 22.05 -149 10.49 - - - 1.35 BA 99RJN508 62 22.12 -149 12.64 - - - 0.72 GB
99RJN509 62 22.87 -149 13.18 - - - 0.99 DI 99RJN510D 62 23.74 -149 7.26 - - - 0.03 DB
99RJN511B 62 23.69 -149 7.36 - - - 0.72 SC 99RJN513 62 19.87 -149 14.8 - - - 1.83 GB
99RJN514 62 19.12 -149 16.06 - - - 1.59 GB 99RJN516 62 18.73 -149 12.17 - - - 3.18 BA
99RJN518 62 21.93 -149 1.11 - - - 1.91 GB 99RJN519A 62 21.87 -149 1.25 - - - 1.99 GB
99RJN519B 62 21.87 -149 1.25 - - - 2.15 GE 99RJN520 62 21.78 -149 1.52 - - - 1.99 GB
99RJN521 62 21.8 -149 1.8 - - - 0.08 UN 99RJN522 62 21.73 -149 2.05 - - - 0.08 GE
99RJN523 62 21.81 -149 1.99 - - - 1.99 UN 99RJN523A 62 21.81 -149 1.99 - - - 1.47 GE
99RJN524 62 21.84 -149 2.12 - - - 0.95 UN 99RJN525 62 21.83 -149 2.22 - - - 0.95 UN
99RJN526 62 21.8 -149 2.31 - - - 0.10 UN 99RJN526A 62 21.8 -149 2.31 - - - 1.35 GB
99RJN527 62 21.82 -149 2.39 - - - 0.32 UN 99RJN528 62 17.53 -149 2.83 - - - 0.04 UN
99RJN529A 62 17.09 -149 2.71 - - - 1.59 GB 99RJN529B 62 17.09 -149 2.71 - - - 0.00 AR
99RJN529C 62 17.09 -149 2.71 - - - 0.00 UN

Table 3. Density and magnetic susceptibility measurements -- continued.
Latitude Longitude Density Sample ID
deg min deg min Grain Saturated bulk Dry bulkMagnetic
Susceptibility Rock type
99RJN530A 62 16.71 -149 3.29 - - - 0.00 GT 99RJN530A 62 16.71 -149 3.29 - - - 0.12 UN
99RJN530B 62 16.71 -149 3.29 - - - 0.04 DB 99RJN530D 62 16.71 -149 3.29 - - - 0.06 UN
99RJN531 62 16.76 -149 3.19 - - - 1.59 UN 99RJN532 62 19.68 -149 12.8 - - - 1.19 MC
36

Appendix 1. Explanation of sample names for rocks from the study area
37

Append 2. Description of rock type abbreviations used for rocks from the study area. ix
Abbreviation Rock Type CountAN Andesite 11 AP Aplite 1 AR Argillite 9 BA Basalt 88 BR Breccia 3 CH Chert 4 CO Conglomorate 4 DA Dacite 9 DB Biabase 4 DI Diorite 30 DN Dunite 4 DO Dolomite 2 FI Felsic igneous 3 FP Felsic plutonic 1 FS Felsite 2 FV Felsic volcanic 1 GB Gabbro 74 GD Granodiorite 26 GE Greenstone 21 GN Gneiss 12 GR Granite 24 GS Greenschist 1 GT Granitic 8 GW Greywhacke 2 HB Hornblendite 1 HF Hornfels 13 LS Limestone 18 MC Mafic 10 MD Mafic dike 10 MO Monzonite 2 PG Pegmatite 3 PH Phyllite 5 PO Porphyry 2 PT Peridotite 1 QV Quartz vein 2 RH Rhyolite 3 SC Schist 9 SE Serpentinite 3 SH Shale 2 SK Skarn 1 SL Slate 7 SS Sandstone 4 ST Siltstone 1 TR Trachyte 2 TU Tuff 44 UD Unidentified dike 2 UM Unidentified metamorphjic 2 UN Unidentified 126 UP Unidentified plutonic 21 US Unidentified sedimentary 11 UV Unidentified volcanic 24 VB Volcanic breccia 10 VC Volcaniclastic 23
38

Appendix 3. Detailed statistics of magnetic susceptibility values for rocks from the study area (produWINKS 4.62 stat
ced by istical analysis program from TexaSoft). See figure 5 for graphical representation.
39

Appendix 4. Statistics on magnetic susceptibility values for rocks from the study area, grouped by rock type(produced by WINK 4.6 statistical analysis program by TexaSoft). See figures 6 and 7 for graphical representation.
40
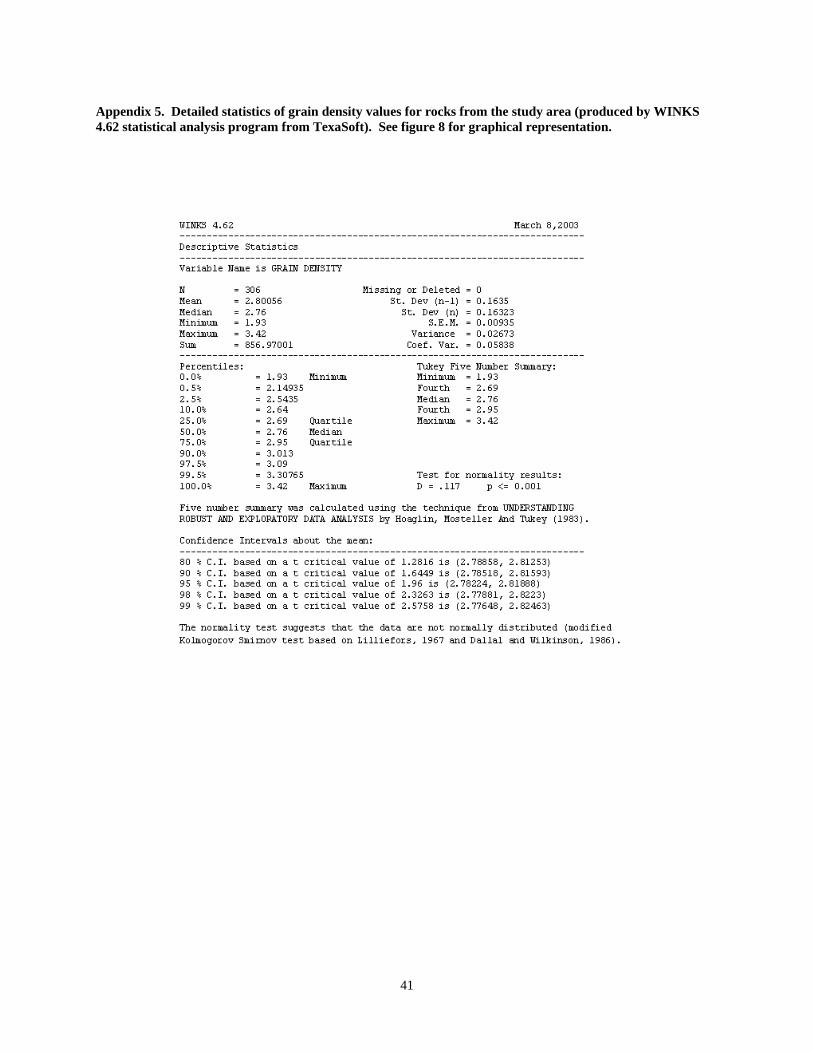
Appendix 5. Detailed statistics of grain density values for rocks from the study area (produced by W4.62 statistical analysis program from TexaSoft). See figure 8 for graphical representation.
INKS
41

42
Appendix 6. Statistics on grain density values for rocks from the study area, grouped by rock type (produced by WINK 4.6 statistical analysis program by TexaSoft). See figures 9 and 10 for graphical representation.