Defining the Microglia Response during the Time Course of ... · Defining the Microglia Response...
15
Defining the Microglia Response during the Time Course of Chronic Neurodegeneration James E. Vincenti, Lita Murphy, Kathleen Grabert, Barry W. McColl, Enrico Cancellotti, Tom C. Freeman, Jean C. Manson The Roslin Institute and Royal (Dick) School of Veterinary Studies, University of Edinburgh, Easter Bush, Midlothian, United Kingdom ABSTRACT Inflammation has been proposed as a major component of neurodegenerative diseases, although the precise role it plays has yet to be defined. We examined the role of key contributors to this inflammatory process, microglia, the major resident immune cell population of the brain, in a prion disease model of chronic neurodegeneration. Initially, we performed an extensive reanalysis of a large study of prion disease, where the transcriptome of mouse brains had been monitored throughout the time course of disease. Our analysis has provided a detailed classification of the disease-associated genes based on cell type of origin and gene function. This revealed that the genes upregulated during disease, regardless of the strain of mouse or prion protein, are ex- pressed predominantly by activated microglia. In order to study the microglia contribution more specifically, we established a mouse model of prion disease in which the 79A murine prion strain was introduced by an intraperitoneal route into BALB/cJ Fms-EGFP/ mice, which express enhanced green fluorescent protein under the control of the c-fms operon. Samples were taken at time points during disease progression, and histological analysis of the brain and transcriptional analysis of isolated microglia was carried out. The analysis of isolated microglia revealed a disease-specific, highly proinflammatory signature in addition to an upregulation of genes associated with metabolism and respiratory stress. This study strongly supports the grow- ing recognition of the importance of microglia within the prion disease process and identifies the nature of the response through gene expression analysis of isolated microglia. IMPORTANCE Inflammation has been proposed as a major component of neurodegenerative diseases. We have examined the role of key con- tributors to this inflammatory process, microglia, the major resident immune cell population of the brain, in a murine prion disease model of chronic neurodegeneration. Our study demonstrates that genes upregulated throughout the disease process are expressed predominantly by microglia. A disease-specific, highly proinflammatory signature was observed in addition to an up- regulation of genes associated with metabolism and respiratory stress. This study strongly supports the growing recognition of the important contribution of microglia to a chronic neurodegenerative disease process. O ver several decades, the neuron has been subject to the ma- jority of research into protein misfolding diseases, but it is now apparent that glial cells are important players in the neuro- degenerative process. Many protein misfolding diseases, includ- ing Alzheimer’s disease, Parkinson’s disease, and prion diseases, demonstrate activation of glial cells in the brain during the course of disease alongside accumulation of misfolded protein, but the precise role of the glial cells in the disease process is not known (1–4). Transmission of prion agents to mice provides an excel- lent model for studying the timing of events during a chronic process of a neurodegeneration associated with a misfolded protein. The time of inoculation defines the starting point for the disease process, and highly reproducible characteristics of mouse-adapted prions include the accumulation of a mis- folded host protein, gliosis, neuronal loss, the distribution of brain lesions, and the endpoint of terminal disease. Activation of glial cells, both astrocytes and microglia, has been exten- sively documented as an early event in the pathogenesis of protein misfolding diseases, occurring well before the onset of clinical disease (1, 5–7). Microglia are the major resident immune cell in the brain and in steady-state are considered a heterogeneous population with density differences across brain regions (8). They display region- dependent functional signatures, which are enhanced further by age (9). Under normal conditions microglia adopt a “resting” phenotype, where they continually survey their immediate envi- ronment with extended processes (10). After detection of a pathological insult or any disturbance to homeostasis, microglia adapt their phenotype from “resting” to “activated,” whereby they modify both morphology and biologi- cal function (10–12). Activated microglia have diverse functional phenotypes dependent on the nature of the stimuli that are not readily apparent from their morphology and include a much wider repertoire than the classically defined M1 and M2 pheno- types (13–16). It has also been proposed that microglia can readily switch from one phenotype to another (17–19) and are sensitive to peripheral immune system communication (20–22). It is also Received 16 October 2015 Accepted 23 December 2015 Accepted manuscript posted online 30 December 2015 Citation Vincenti JE, Murphy L, Grabert K, McColl BW, Cancellotti E, Freeman TC, Manson JC. 2016. Defining the microglia response during the time course of chronic neurodegeneration. J Virol 90:3003–3017. doi:10.1128/JVI.02613-15. Editor: B. Caughey Address correspondence to Jean C. Manson, [email protected]. Supplemental material for this article may be found at http://dx.doi.org/10.1128 /JVI.02613-15. Copyright © 2016 Vincenti et al. This is an open-access article distributed under the terms of the Creative Commons Attribution 4.0 International license. crossmark March 2016 Volume 90 Number 6 jvi.asm.org 3003 Journal of Virology
Transcript of Defining the Microglia Response during the Time Course of ... · Defining the Microglia Response...
Defining the Microglia Response during the Time Course of ChronicNeurodegeneration
James E. Vincenti, Lita Murphy, Kathleen Grabert, Barry W. McColl, Enrico Cancellotti, Tom C. Freeman, Jean C. Manson
The Roslin Institute and Royal (Dick) School of Veterinary Studies, University of Edinburgh, Easter Bush, Midlothian, United Kingdom
ABSTRACT
Inflammation has been proposed as a major component of neurodegenerative diseases, although the precise role it plays has yetto be defined. We examined the role of key contributors to this inflammatory process, microglia, the major resident immune cellpopulation of the brain, in a prion disease model of chronic neurodegeneration. Initially, we performed an extensive reanalysisof a large study of prion disease, where the transcriptome of mouse brains had been monitored throughout the time course ofdisease. Our analysis has provided a detailed classification of the disease-associated genes based on cell type of origin and genefunction. This revealed that the genes upregulated during disease, regardless of the strain of mouse or prion protein, are ex-pressed predominantly by activated microglia. In order to study the microglia contribution more specifically, we establisheda mouse model of prion disease in which the 79A murine prion strain was introduced by an intraperitoneal route intoBALB/cJFms-EGFP/� mice, which express enhanced green fluorescent protein under the control of the c-fms operon. Samples weretaken at time points during disease progression, and histological analysis of the brain and transcriptional analysis of isolatedmicroglia was carried out. The analysis of isolated microglia revealed a disease-specific, highly proinflammatory signature inaddition to an upregulation of genes associated with metabolism and respiratory stress. This study strongly supports the grow-ing recognition of the importance of microglia within the prion disease process and identifies the nature of the response throughgene expression analysis of isolated microglia.
IMPORTANCE
Inflammation has been proposed as a major component of neurodegenerative diseases. We have examined the role of key con-tributors to this inflammatory process, microglia, the major resident immune cell population of the brain, in a murine priondisease model of chronic neurodegeneration. Our study demonstrates that genes upregulated throughout the disease process areexpressed predominantly by microglia. A disease-specific, highly proinflammatory signature was observed in addition to an up-regulation of genes associated with metabolism and respiratory stress. This study strongly supports the growing recognition ofthe important contribution of microglia to a chronic neurodegenerative disease process.
Over several decades, the neuron has been subject to the ma-jority of research into protein misfolding diseases, but it is
now apparent that glial cells are important players in the neuro-degenerative process. Many protein misfolding diseases, includ-ing Alzheimer’s disease, Parkinson’s disease, and prion diseases,demonstrate activation of glial cells in the brain during the courseof disease alongside accumulation of misfolded protein, but theprecise role of the glial cells in the disease process is not known(1–4). Transmission of prion agents to mice provides an excel-lent model for studying the timing of events during a chronicprocess of a neurodegeneration associated with a misfoldedprotein. The time of inoculation defines the starting point forthe disease process, and highly reproducible characteristics ofmouse-adapted prions include the accumulation of a mis-folded host protein, gliosis, neuronal loss, the distribution ofbrain lesions, and the endpoint of terminal disease. Activationof glial cells, both astrocytes and microglia, has been exten-sively documented as an early event in the pathogenesis ofprotein misfolding diseases, occurring well before the onset ofclinical disease (1, 5–7).
Microglia are the major resident immune cell in the brain andin steady-state are considered a heterogeneous population withdensity differences across brain regions (8). They display region-dependent functional signatures, which are enhanced further byage (9). Under normal conditions microglia adopt a “resting”
phenotype, where they continually survey their immediate envi-ronment with extended processes (10).
After detection of a pathological insult or any disturbance tohomeostasis, microglia adapt their phenotype from “resting” to“activated,” whereby they modify both morphology and biologi-cal function (10–12). Activated microglia have diverse functionalphenotypes dependent on the nature of the stimuli that are notreadily apparent from their morphology and include a muchwider repertoire than the classically defined M1 and M2 pheno-types (13–16). It has also been proposed that microglia can readilyswitch from one phenotype to another (17–19) and are sensitive toperipheral immune system communication (20–22). It is also
Received 16 October 2015 Accepted 23 December 2015
Accepted manuscript posted online 30 December 2015
Citation Vincenti JE, Murphy L, Grabert K, McColl BW, Cancellotti E, Freeman TC,Manson JC. 2016. Defining the microglia response during the time course ofchronic neurodegeneration. J Virol 90:3003–3017. doi:10.1128/JVI.02613-15.
Editor: B. Caughey
Address correspondence to Jean C. Manson, [email protected].
Supplemental material for this article may be found at http://dx.doi.org/10.1128/JVI.02613-15.
Copyright © 2016 Vincenti et al. This is an open-access article distributed underthe terms of the Creative Commons Attribution 4.0 International license.
crossmark
March 2016 Volume 90 Number 6 jvi.asm.org 3003Journal of Virology
clear that a complicated interconnected network of central ner-vous system (CNS) cells contribute to the activated “profile” ad-opted by microglia with signaling from both astrocytes and neu-rons having particular impact (23–26).
The change of microglia from a resting to an activated state isone of the first pathological features of prion disease long beforethere is any evidence of neurodegeneration. Activated microgliaare widely distributed in the brain and are thought to expresslow levels of inflammatory cytokines but high levels of trans-forming growth factor beta 1 (Tgfb1) and prostaglandin E2(PGE2) (7, 27).
This study aims to investigate the role of microglia throughdetailed analysis of their morphology and gene expression duringthe course of prion disease, thereby providing new insights intothe pathophysiology of neurodegenerative disease. We used aprion disease agent as a model of neurodegeneration and take anunbiased whole-genome expression analysis approach, which hasallowed us to provide insight into the molecular processes centralto microglia during the neurodegeneration and highlight how thismay impact disease development. A strong myeloid associationwas attributed to disease-associated genes identified in our reanal-ysis, supporting the growing recognition of the importance of mi-croglia within the disease process. To further clarify the microglialcontribution, we isolated microglia from prion-infected mice andanalyzed their gene expression profiles.
MATERIALS AND METHODSReanalysis of published data. The Hwang data set (28) was downloadedfrom http://prion.systemsbiology.net. Quality control of these data wasperformed by Fios Genomics, Ltd. (Edinburgh, Scotland), using theArrayQualityMetrics (29), and 32 microarrays were removed due topoor quality, leaving 386, both infected and uninfected, for reanalysis.The removal of arrays did not affect the overall balance of the data setwith a mean average of 2.5 � 0.08 (standard error [SE]) arrays per timepoint. Data normalization was performed using the robust multiarrayaverage expression measure (30).
Initial inspection of the data showed that there were no age-relatedtrends present in the control animal data, and these were not included infurther analyses. Data from prion-infected animals were loaded into Bio-Layout Express3D (31), and a Pearson correlation matrix was calculated,comparing the expression data from each probe set on the array against allother probe sets (P2/2 pairwise calculations, where P is the number ofprobe sets).
A threshold of r � 0.75 was used, and the resultant correlation graphwas visualized. To identify groups of coexpressed genes, the graph wasclustered using the graph-based Markov clustering (MCL) algorithm (32)with the inflation value set at 2.2. The expression profile of each clusterwas inspected, clusters of genes differentially expressed during diseasewere isolated, and individual gene profiles were examined. Those with anunconvincing profile, i.e., their expression was weak or unrelated to dis-ease progression, were removed. This left a data set comprising 492 genesin which there was high degree of confidence that their expression wasupregulated during disease.
Determination of cell type of origin and function of disease-associ-ated transcripts. Cell origin was determined with reference to existingdata sets. A data set was compiled from data derived from a number ofpublished studies and included microglia, macrophage, and osteoclastmyeloid populations (33, 34); purified neuronal populations derivedfrom the cortex (cholecystokinin�ve, cholinergic, layer 5a, layer 5b, layer6, and prepronociceptin�ve); the striatum (dopamine receptor subtype 1medium spiny, and dopamine receptor subtype 2 medium spiny) and thecerebellum (basket, Golgi, Purkinje, stellate, unipolar brush); and astro-cytes, Bergman glia, and oligodendrocyte populations (35, 36). Finally,
data sets derived from macrophage cultures cultured with lipopolysaccha-ride (LPS) bacterial endotoxin (37) were included to allow for the identi-fication of genes associated with activation of the innate immune system.After normalization of the data, the 492 genes demonstrating differentialexpression in response to prion disease were identified in the compositedata set through matching of gene symbols and incorporated into anexpression file. Within BioLayout Express3D each gene could then be as-sessed for their expression in one or more of these cell types.
Gene ontology enrichment was determined by uploading the Af-fymetrix chip ID of the disease-associated genes to the online EnsemblBiomart data mining tool (http://ensembl.org/biomart) using the Musmusculus genes data set (Ensembl Genes 66). Filters were appliedrestricting results to the Affymetrix 430 2.0 chip probe sets. To increaseaccuracy for correct selection of function, filters for gene ontologyevidence code, domain and name were applied, with experimentalevidence codes preferred.
Animals and treatment. Groups of male and female BALB/cJFms-EGFP/�
mice, expressing enhanced green fluorescent protein (EGFP) under thecontrol of the c-fms operon (part of the Csfr1 promoter) (38), were sexmatched and housed under standard conditions in groups of three to five.Food and water access was ad libitum. All mouse experiments were re-viewed and approved by the local ethical review committee and per-formed under license from the UK Home Office in accordance with theUnited Kingdom Animal (Scientific Procedures) Act 1988. Mice aged 16weeks old were challenged by an intraperitoneal (i.p.) route with 0.02 mlof 1% (wt/vol) (in physiological saline) 79A-infected or normal brainmaterial (NBr) for a control. At time points 35, 100, 150, and 200 dayspostinoculation (dpi) mice were sacrificed (9 per group for immunohis-tochemical analysis and 4 per group for microglial extraction). All re-maining mice (12 and 8 per group, respectively) were assessed for clinicalsigns of prion disease from 150 dpi, and incubation times were calculatedaccording to previously described protocols (39). These mice were sacri-ficed during terminal disease, or earlier if welfare required. Tissue sectionsfrom these mice were assessed for spongiform degeneration according topreviously described procedures by a scientist blinded to experimentaldesign (40).
Tissue preparation and immunohistochemical analysis. Brains wereremoved at the selected time points. Those to be used for immunohisto-chemistry were perfusion fixed with saline, followed by 4% paraformal-dehyde (PFA; pH 7.4). Brain tissue was embedded in paraffin and cut intosections (6 �m). Antigen retrieval was performed in an autoclave at 121°Cfor 15 min in distilled H2O and then incubated in formic acid (98%) for 10min at room temperature. Endogenous peroxidase was blocked with 1%H2O2 (Sigma-Aldrich) in methanol for 10 min. All sections were blockedwith serum-free protein block (Dako) or normal goat serum prior toincubation with the primary antibody. Sections were immunostainedwith monoclonal antibody (MAb) 6H4 (Prionics) recognizing residues143 to 151 of murine PrP (0.5 �g ml�1) (41). Negative control slides weretreated overnight with mouse immunoglobulin control (Invitrogen). An-tibody binding was detected with Vector ABC kit (Vector Laboratories)and visualized with 3,3,-diaminobenzidine chromogen. All sections werecounterstained with hematoxylin.
Brains for microglia morphology assessment were removed and im-mersed in 4% PFA for 24 h and then rinsed in Hanks balanced salt solu-tion (HBSS) before incubation for a further 24 h in 20% sucrose solutionat 4°C. Tissues were rinsed with HBSS and snap-frozen in isopentaneat �40°C. Brains for microglial extraction were immersed in cold HBSSprior to processing (see “Microglial isolation procedure” below).
Quantification of microglia morphology/phenotype. Frozen braintissue was sectioned at 25 �m on a freezing block microtome, and sequen-tial sections 300 �m apart were taken for analysis. Quantification of mi-croglia activation status was established on cellular aggregation and mor-phology observed in BALBcJFms-EGFP/� sections based on the averagenumber of microglia per 0.05 mm2. Images for cell quantification werecaptured as a 50 optical slice z-stack at �10 magnification (Zeiss Plan-
Vincenti et al.
3004 jvi.asm.org March 2016 Volume 90 Number 6Journal of Virology
Neofluar 10�/0.30 objective) and compiled into a composite image usingImageJ software 1.48a. Quantification of the EGFP cell number was per-formed using particle analysis within ImageJ. Microglia radius was per-formed on �10 z-stack compiled (reporting z-stacks) images takenat �40 magnification (Zeiss Plan-Neofluar �40/1.30 objective) capturedfrom three standard locations within four brain regions: the dentate gyrus,cerebellum, medulla, and thalamus. There was a minimum of three miceper group, and additional images were recorded on adjacent sections if thetotal number of EGFP expressing microglia was below 50. Euclidean dis-tance mapping was utilized to quantify changes in morphology and wasperformed using the “region of interest” function within ImageJ.
Microglial isolation procedure. Brains harvested for microglial ex-traction were placed in cold HBSS and diced before processing immedi-ately. Brains were dissociated using a GentleMACS dissociator (MiltenyiBiotec) and a neural tissue dissociation kit P (Miltenyi Biotec). The finalcell pellet was resuspended in 16 ml of 35% Isotonic Percoll, split betweentwo 15-ml tubes, and carefully overlaid with 5 ml of ice-cold 0.1% diethylpyrocarbonate (DEPC)-treated HBSS. The resulting Percoll gradient wascentrifuged at 400 � g for 45 min at 4°C. The pellets were then suspendedand recombined into a final volume of 5 ml ice cold 0.1% DEPC-treatedHBSS. Cells were pelleted at 400 � g for 5 min at 4°C using no brake,resuspended in 90 �l of ice-cold MACS buffer (Miltenyi Biotec) and 10 �lof CD11b (microglia) microbeads (Miltenyi Biotec), and incubated at 4°Cfor 15 min with gentle rotation. After incubation with microbeads, the cellsuspension was washed in 1 ml of ice-cold MACs buffer at 300 � g for 5min at 4°C and then resuspended in 500 �l of ice-cold MACs buffer. Cellswere passed through magnetized LS columns (Miltenyi Biotec) accordingto the manufacturer’s protocol.
Verification of microglial purity. A subset of isolated cells predictedto be microglia were stained with phycoerythrin (PE) anti-mouse CD11b(Cambridge Bioscience) and allophycocyanin (APC) anti-mouse CD45(Cambridge Bioscience). Isotype controls were prepared using PE-ratIgG2b (Cambridge Bioscience) and APC-rat IgG2a (Cambridge Biosci-ence), and a subset of unstained cells served both as a negative control anda verification of the correct BALB/cJFms-EGFP/� genotype. Cell viability wasdetermined using SYTOX Blue dead cell stain (Thermo Fisher Scientific).All cell samples were analyzed on a BD FACSAria IIIu 4-laser/11 detectorcell sorter running BD FACSDiva software (BD Biosciences). Subsequentanalysis of fluorescence-activated cell sorting (FACS) data was also per-formed using Summit v4.3 software (Dako/Beckham Coulter).
Microarray analysis of isolated microglia. Isolated microglia cellswere treated with TRIzol Reagent (Life Technologies) according to themanufacturer’s protocol. Total RNA quality was checked on an Agilent2100 Bioanalyzer. RNA samples with RIN value of �7.0 were passed assuitable for analysis, and two representative samples at each time point forcontrol and disease were taken forward for analysis. RNA processing washandled by Ark Genomics [The Roslin Institute and R(D)SVS]. RNA wasconverted to amplified double-stranded cDNA containing biotin using aNuGen Ovation picoSL WTA labeling kit (NuGen). The cDNA sampleswere hybridized to Affymetrix Mouse Gene 1.1 arrays on a GeneTitaninstrument (Affymetrix). Data were quality controlled, RNA normalized,and subjected to network analysis as described above.
Microarray data accession number. The microarray data sets sup-porting the results in this article are available in the NCBI GEO repositoryunder accession number GSE72039.
RESULTSThe neurodegenerative disease process is associated with an in-flammatory response which is microglial in origin. Initially, weperformed a reanalysis of the data produced by Hwang et al. (28):a transcriptomics analysis of brains of multiple strains of miceinfected with different prion strains sampled at various stages ofdisease progression. These analyses were performed with a view toidentifying genes associated with neurodegenerative disease pro-gression. The Hwang data from diseased animals were analyzed
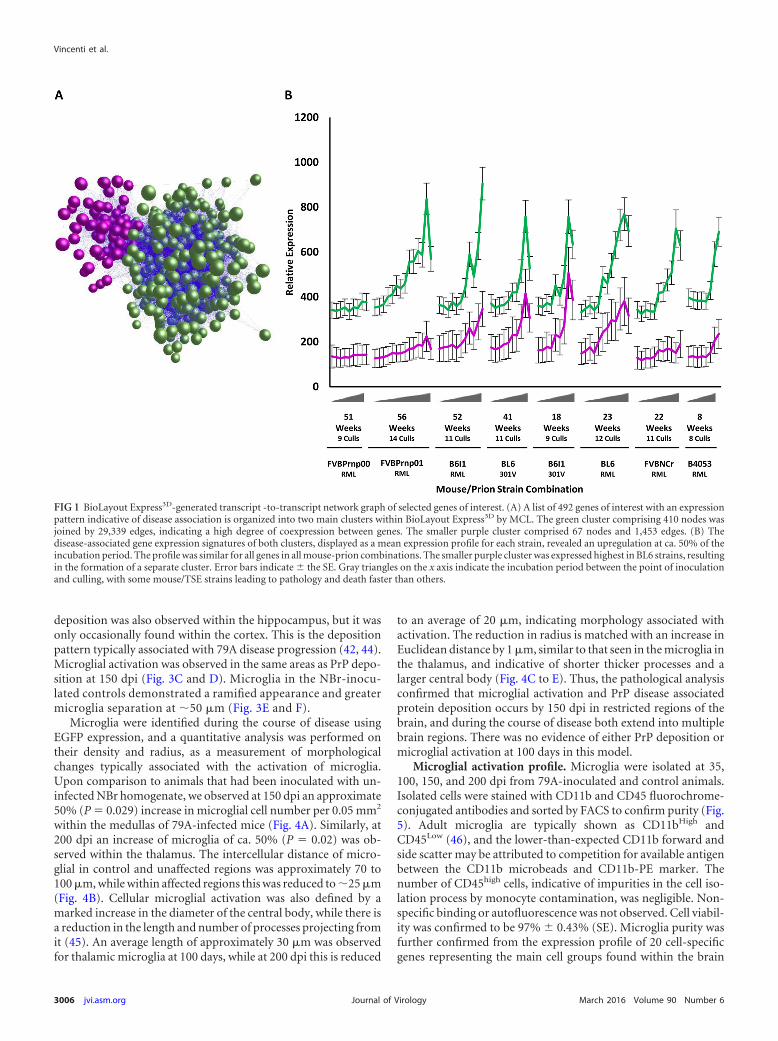
within BioLayout Express3D. A correlation graph was generatedusing a Pearson threshold of r � 0.75, consisting of 21,550 nodeswith 1,253,332 edges (Fig. 1A). Clustering with MCL yielded 416clusters. Each cluster represented genes that share a high degree ofcoexpression. The expression profile of the majority of the clustersrevealed they had an expression profile that was not linked to thedisease process. Two major clusters of genes did however exhibitan expression profile that increased with disease progression in allanimal-prion strain combinations (Fig. 1B). The largest of theseclusters comprised 377 genes and a second contained 115 genesthat were notable for their increased activation in C57BL/6 models(Fig. 1B). Following manual inspection of all individual profiles, atotal of 492 genes associated with prion disease development wereidentified (see Table S1 in the supplemental material). All genes ineach cluster followed a similar expression profile with an increasein expression starting at approximately halfway through the incu-bation period.
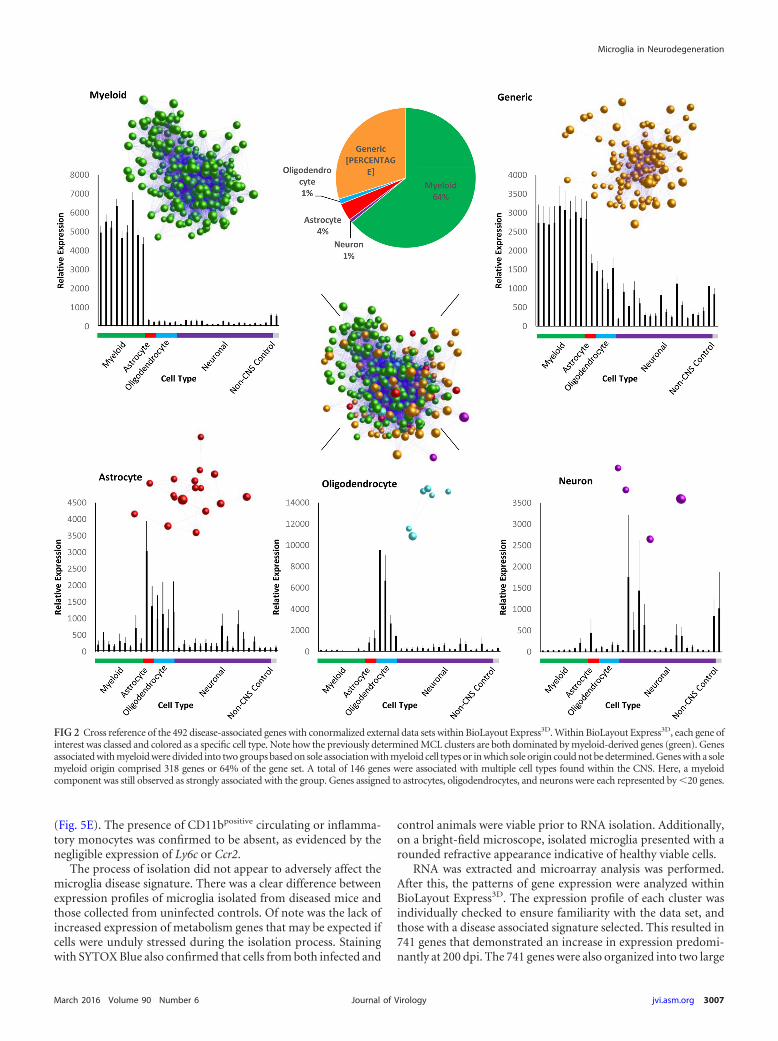
Once disease association was determined, we next attempted toidentify the cellular origin for each of the 492 differentially ex-pressed genes in question. This was done by examining the expres-sion of the disease-associated genes in the context of a panel ofisolated cell populations. Data sets were sourced from the GNFv3cell atlas (33, 34), RNA TRAP (35, 36), and serial macrophagecultures subjected to LPS (37). This revealed that 315 of the 492differentially expressed genes were solely or at least predominantlyexpressed by myeloid populations, thereby indicating the major-ity were likely expressed by microglia within the brain. In contrast,147 of the genes were expressed by multiple cell types, while only30 were found to be specific to astrocytes, oligodendrocytes, andneurons collectively (Fig. 2). The original study by Hwang et al.(28) identified 333 differentially expressed genes. By overlayingthese 333 genes onto our chosen external data sets within Bio-Layout Express3D it was found that 158 of the 333 genes wereattributed to a myeloid origin. A further 18 were attributed tononmyeloid cell types. The remaining genes were classed asgeneric, implying the origin could be any cell within the brainand as such do not rule out a microglial component.
Histological analysis of microglial activation and PrP depo-sition. After the identification of the predominantly myeloid ori-gin of the prion disease signature, we chose next to confirm thisobservation by performing an analysis of microglia isolated fromdiseased brains. Our aim was to verify these findings and to obtaina more detailed analysis of the activation of microglia during dis-ease. To do this, we chose a mouse-passaged prion agent, 79A,inoculated into BALB/cJFms-EGFP/� mice by an intraperitonealroute with 0.02 ml of 1% (wt/vol) 79A brain homogenate as ourmodel.
Clinical disease onset occurred 198.5 � 1.0 (SE) dpi with signs,including lethargy, hair unkempt/loss, and hunching, all reported.Terminal disease occurred 229 � 3.6 dpi. Pathological analysis ofthe vacuolation in the brain of terminal animals (n � 6) con-firmed clinical disease and indicated that vacuolation was wide-spread by terminal stage of disease presenting as typical for the79A prion strain (42, 43).
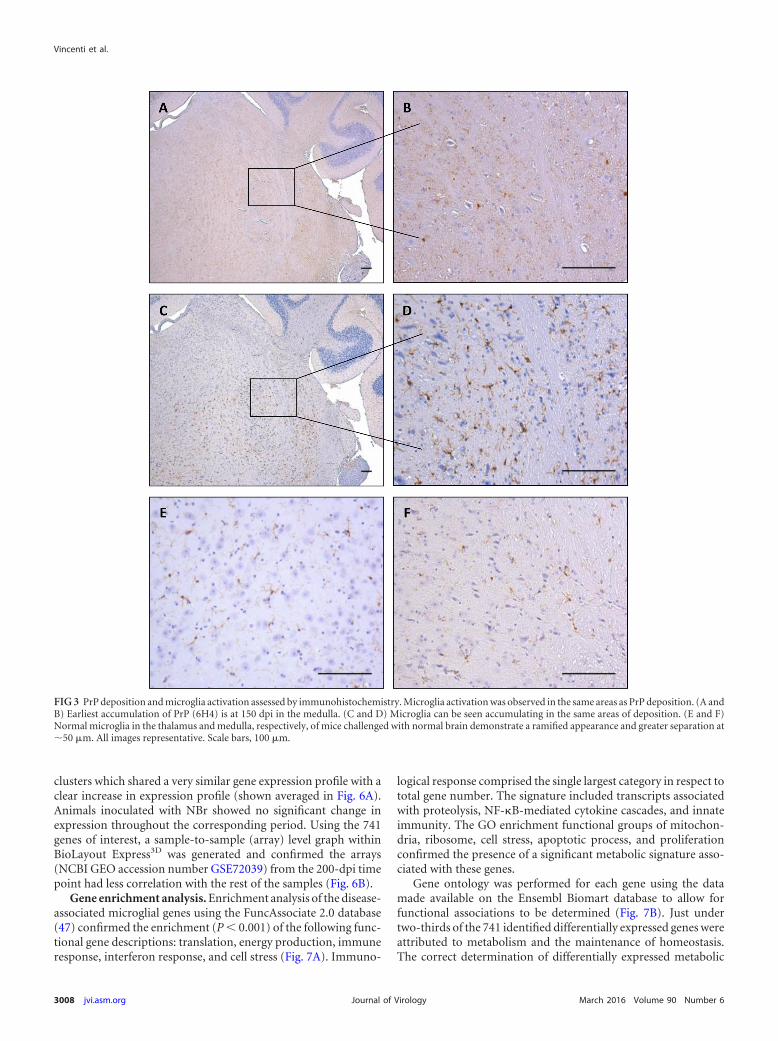
PrP deposition assessed by immunohistochemistry using the6H4 antibody was first detected in the infected mice at 150 dpi andrestricted to the medulla (Fig. 3A and B). PrP assessment at theterminal stage of disease identified heavy accumulation of finepunctate particles throughout the majority of the brain, strongestin the thalamus and extending into the medulla. To a lesser extent,
Microglia in Neurodegeneration
March 2016 Volume 90 Number 6 jvi.asm.org 3005Journal of Virology
deposition was also observed within the hippocampus, but it wasonly occasionally found within the cortex. This is the depositionpattern typically associated with 79A disease progression (42, 44).Microglial activation was observed in the same areas as PrP depo-sition at 150 dpi (Fig. 3C and D). Microglia in the NBr-inocu-lated controls demonstrated a ramified appearance and greatermicroglia separation at 50 �m (Fig. 3E and F).
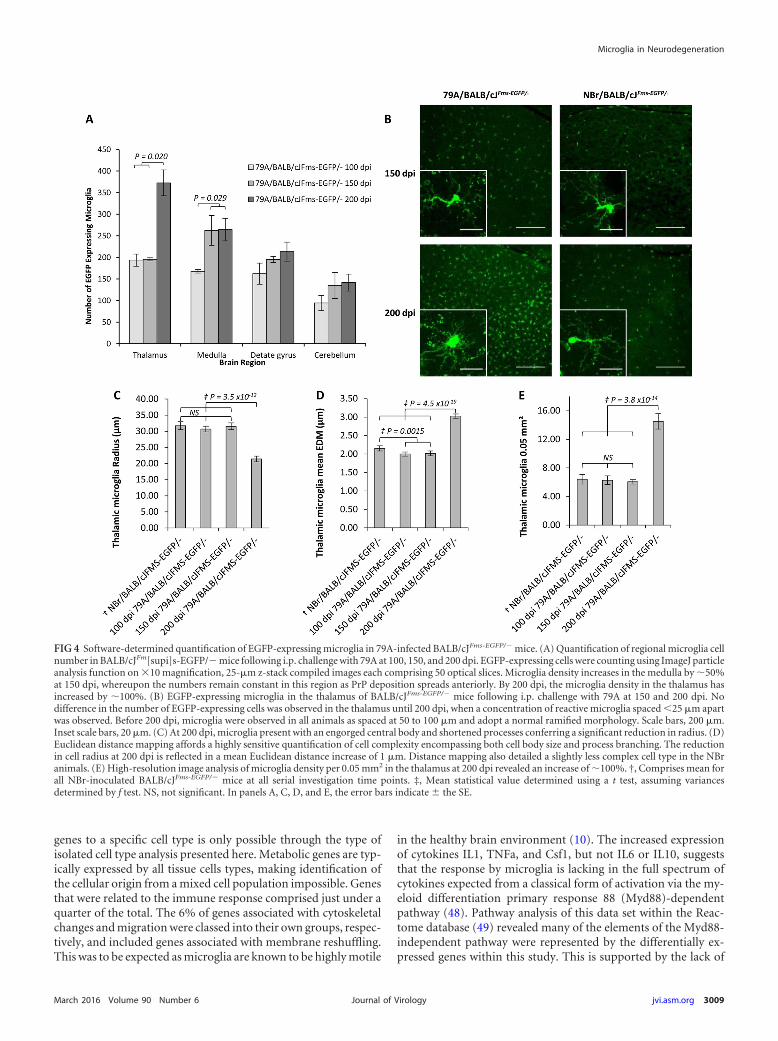
Microglia were identified during the course of disease usingEGFP expression, and a quantitative analysis was performed ontheir density and radius, as a measurement of morphologicalchanges typically associated with the activation of microglia.Upon comparison to animals that had been inoculated with un-infected NBr homogenate, we observed at 150 dpi an approximate50% (P � 0.029) increase in microglial cell number per 0.05 mm2
within the medullas of 79A-infected mice (Fig. 4A). Similarly, at200 dpi an increase of microglia of ca. 50% (P � 0.02) was ob-served within the thalamus. The intercellular distance of micro-glial in control and unaffected regions was approximately 70 to100 �m, while within affected regions this was reduced to 25 �m(Fig. 4B). Cellular microglial activation was also defined by amarked increase in the diameter of the central body, while there isa reduction in the length and number of processes projecting fromit (45). An average length of approximately 30 �m was observedfor thalamic microglia at 100 days, while at 200 dpi this is reduced
to an average of 20 �m, indicating morphology associated withactivation. The reduction in radius is matched with an increase inEuclidean distance by 1 �m, similar to that seen in the microglia inthe thalamus, and indicative of shorter thicker processes and alarger central body (Fig. 4C to E). Thus, the pathological analysisconfirmed that microglial activation and PrP disease associatedprotein deposition occurs by 150 dpi in restricted regions of thebrain, and during the course of disease both extend into multiplebrain regions. There was no evidence of either PrP deposition ormicroglial activation at 100 days in this model.
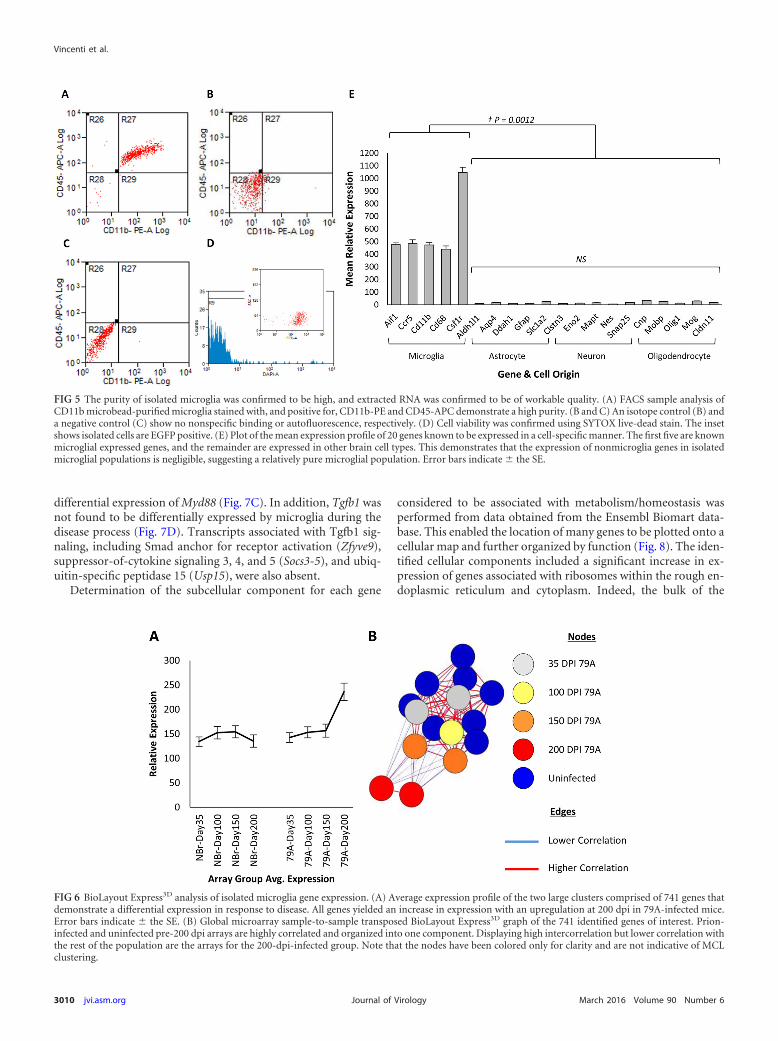
Microglial activation profile. Microglia were isolated at 35,100, 150, and 200 dpi from 79A-inoculated and control animals.Isolated cells were stained with CD11b and CD45 fluorochrome-conjugated antibodies and sorted by FACS to confirm purity (Fig.5). Adult microglia are typically shown as CD11bHigh andCD45Low (46), and the lower-than-expected CD11b forward andside scatter may be attributed to competition for available antigenbetween the CD11b microbeads and CD11b-PE marker. Thenumber of CD45high cells, indicative of impurities in the cell iso-lation process by monocyte contamination, was negligible. Non-specific binding or autofluorescence was not observed. Cell viabil-ity was confirmed to be 97% � 0.43% (SE). Microglia purity wasfurther confirmed from the expression profile of 20 cell-specificgenes representing the main cell groups found within the brain
FIG 1 BioLayout Express3D-generated transcript -to-transcript network graph of selected genes of interest. (A) A list of 492 genes of interest with an expressionpattern indicative of disease association is organized into two main clusters within BioLayout Express3D by MCL. The green cluster comprising 410 nodes wasjoined by 29,339 edges, indicating a high degree of coexpression between genes. The smaller purple cluster comprised 67 nodes and 1,453 edges. (B) Thedisease-associated gene expression signatures of both clusters, displayed as a mean expression profile for each strain, revealed an upregulation at ca. 50% of theincubation period. The profile was similar for all genes in all mouse-prion combinations. The smaller purple cluster was expressed highest in BL6 strains, resultingin the formation of a separate cluster. Error bars indicate � the SE. Gray triangles on the x axis indicate the incubation period between the point of inoculationand culling, with some mouse/TSE strains leading to pathology and death faster than others.
Vincenti et al.
3006 jvi.asm.org March 2016 Volume 90 Number 6Journal of Virology
(Fig. 5E). The presence of CD11bpositive circulating or inflamma-tory monocytes was confirmed to be absent, as evidenced by thenegligible expression of Ly6c or Ccr2.
The process of isolation did not appear to adversely affect themicroglia disease signature. There was a clear difference betweenexpression profiles of microglia isolated from diseased mice andthose collected from uninfected controls. Of note was the lack ofincreased expression of metabolism genes that may be expected ifcells were unduly stressed during the isolation process. Stainingwith SYTOX Blue also confirmed that cells from both infected and
control animals were viable prior to RNA isolation. Additionally,on a bright-field microscope, isolated microglia presented with arounded refractive appearance indicative of healthy viable cells.
RNA was extracted and microarray analysis was performed.After this, the patterns of gene expression were analyzed withinBioLayout Express3D. The expression profile of each cluster wasindividually checked to ensure familiarity with the data set, andthose with a disease associated signature selected. This resulted in741 genes that demonstrated an increase in expression predomi-nantly at 200 dpi. The 741 genes were also organized into two large
FIG 2 Cross reference of the 492 disease-associated genes with conormalized external data sets within BioLayout Express3D. Within BioLayout Express3D, each gene ofinterest was classed and colored as a specific cell type. Note how the previously determined MCL clusters are both dominated by myeloid-derived genes (green). Genesassociated with myeloid were divided into two groups based on sole association with myeloid cell types or in which sole origin could not be determined. Genes with a solemyeloid origin comprised 318 genes or 64% of the gene set. A total of 146 genes were associated with multiple cell types found within the CNS. Here, a myeloidcomponent was still observed as strongly associated with the group. Genes assigned to astrocytes, oligodendrocytes, and neurons were each represented by 20 genes.
Microglia in Neurodegeneration
March 2016 Volume 90 Number 6 jvi.asm.org 3007Journal of Virology
clusters which shared a very similar gene expression profile with aclear increase in expression profile (shown averaged in Fig. 6A).Animals inoculated with NBr showed no significant change inexpression throughout the corresponding period. Using the 741genes of interest, a sample-to-sample (array) level graph withinBioLayout Express3D was generated and confirmed the arrays(NCBI GEO accession number GSE72039) from the 200-dpi timepoint had less correlation with the rest of the samples (Fig. 6B).
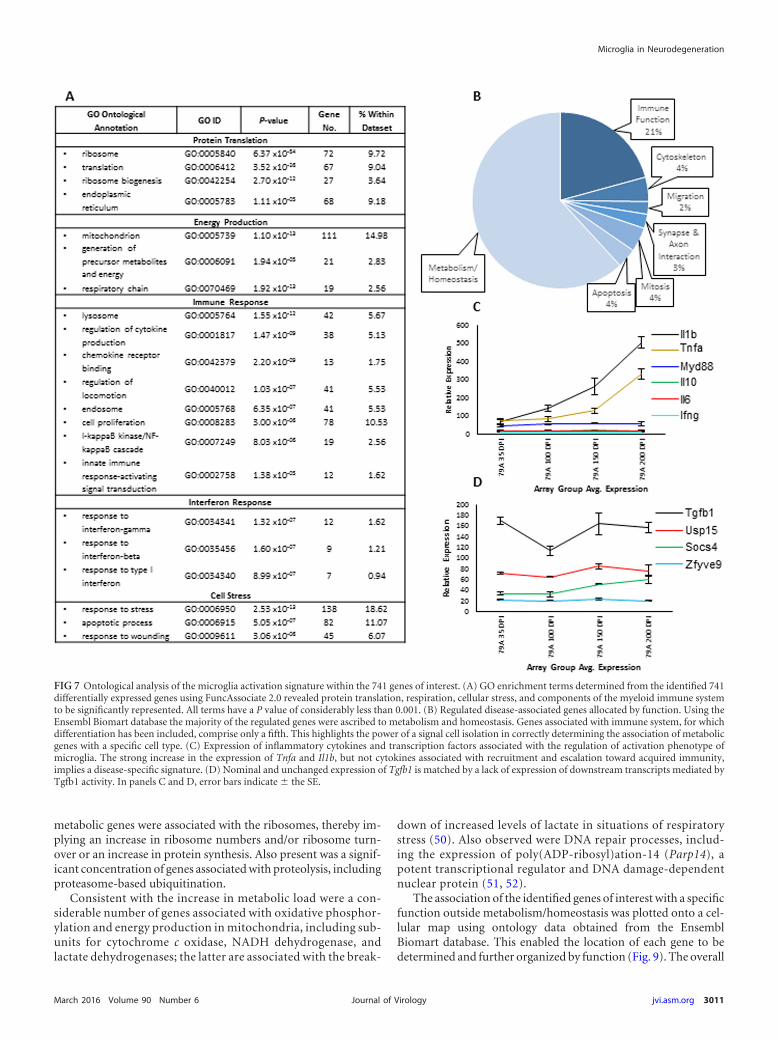
Gene enrichment analysis. Enrichment analysis of the disease-associated microglial genes using the FuncAssociate 2.0 database(47) confirmed the enrichment (P 0.001) of the following func-tional gene descriptions: translation, energy production, immuneresponse, interferon response, and cell stress (Fig. 7A). Immuno-
logical response comprised the single largest category in respect tototal gene number. The signature included transcripts associatedwith proteolysis, NF-�B-mediated cytokine cascades, and innateimmunity. The GO enrichment functional groups of mitochon-dria, ribosome, cell stress, apoptotic process, and proliferationconfirmed the presence of a significant metabolic signature asso-ciated with these genes.
Gene ontology was performed for each gene using the datamade available on the Ensembl Biomart database to allow forfunctional associations to be determined (Fig. 7B). Just undertwo-thirds of the 741 identified differentially expressed genes wereattributed to metabolism and the maintenance of homeostasis.The correct determination of differentially expressed metabolic
FIG 3 PrP deposition and microglia activation assessed by immunohistochemistry. Microglia activation was observed in the same areas as PrP deposition. (A andB) Earliest accumulation of PrP (6H4) is at 150 dpi in the medulla. (C and D) Microglia can be seen accumulating in the same areas of deposition. (E and F)Normal microglia in the thalamus and medulla, respectively, of mice challenged with normal brain demonstrate a ramified appearance and greater separation at50 �m. All images representative. Scale bars, 100 �m.
Vincenti et al.
3008 jvi.asm.org March 2016 Volume 90 Number 6Journal of Virology
genes to a specific cell type is only possible through the type ofisolated cell type analysis presented here. Metabolic genes are typ-ically expressed by all tissue cells types, making identification ofthe cellular origin from a mixed cell population impossible. Genesthat were related to the immune response comprised just under aquarter of the total. The 6% of genes associated with cytoskeletalchanges and migration were classed into their own groups, respec-tively, and included genes associated with membrane reshuffling.This was to be expected as microglia are known to be highly motile
in the healthy brain environment (10). The increased expressionof cytokines IL1, TNFa, and Csf1, but not IL6 or IL10, suggeststhat the response by microglia is lacking in the full spectrum ofcytokines expected from a classical form of activation via the my-eloid differentiation primary response 88 (Myd88)-dependentpathway (48). Pathway analysis of this data set within the Reac-tome database (49) revealed many of the elements of the Myd88-independent pathway were represented by the differentially ex-pressed genes within this study. This is supported by the lack of
FIG 4 Software-determined quantification of EGFP-expressing microglia in 79A-infected BALB/cJFms-EGFP/� mice. (A) Quantification of regional microglia cellnumber in BALB/cJFm[supi]s-EGFP/� mice following i.p. challenge with 79A at 100, 150, and 200 dpi. EGFP-expressing cells were counting using ImageJ particleanalysis function on �10 magnification, 25-�m z-stack compiled images each comprising 50 optical slices. Microglia density increases in the medulla by 50%at 150 dpi, whereupon the numbers remain constant in this region as PrP deposition spreads anteriorly. By 200 dpi, the microglia density in the thalamus hasincreased by 100%. (B) EGFP-expressing microglia in the thalamus of BALB/cJFms-EGFP/� mice following i.p. challenge with 79A at 150 and 200 dpi. Nodifference in the number of EGFP-expressing cells was observed in the thalamus until 200 dpi, when a concentration of reactive microglia spaced 25 �m apartwas observed. Before 200 dpi, microglia were observed in all animals as spaced at 50 to 100 �m and adopt a normal ramified morphology. Scale bars, 200 �m.Inset scale bars, 20 �m. (C) At 200 dpi, microglia present with an engorged central body and shortened processes conferring a significant reduction in radius. (D)Euclidean distance mapping affords a highly sensitive quantification of cell complexity encompassing both cell body size and process branching. The reductionin cell radius at 200 dpi is reflected in a mean Euclidean distance increase of 1 �m. Distance mapping also detailed a slightly less complex cell type in the NBranimals. (E) High-resolution image analysis of microglia density per 0.05 mm2 in the thalamus at 200 dpi revealed an increase of 100%. †, Comprises mean forall NBr-inoculated BALB/cJFms-EGFP/� mice at all serial investigation time points. ‡, Mean statistical value determined using a t test, assuming variancesdetermined by f test. NS, not significant. In panels A, C, D, and E, the error bars indicate � the SE.
Microglia in Neurodegeneration
March 2016 Volume 90 Number 6 jvi.asm.org 3009Journal of Virology
differential expression of Myd88 (Fig. 7C). In addition, Tgfb1 wasnot found to be differentially expressed by microglia during thedisease process (Fig. 7D). Transcripts associated with Tgfb1 sig-naling, including Smad anchor for receptor activation (Zfyve9),suppressor-of-cytokine signaling 3, 4, and 5 (Socs3-5), and ubiq-uitin-specific peptidase 15 (Usp15), were also absent.
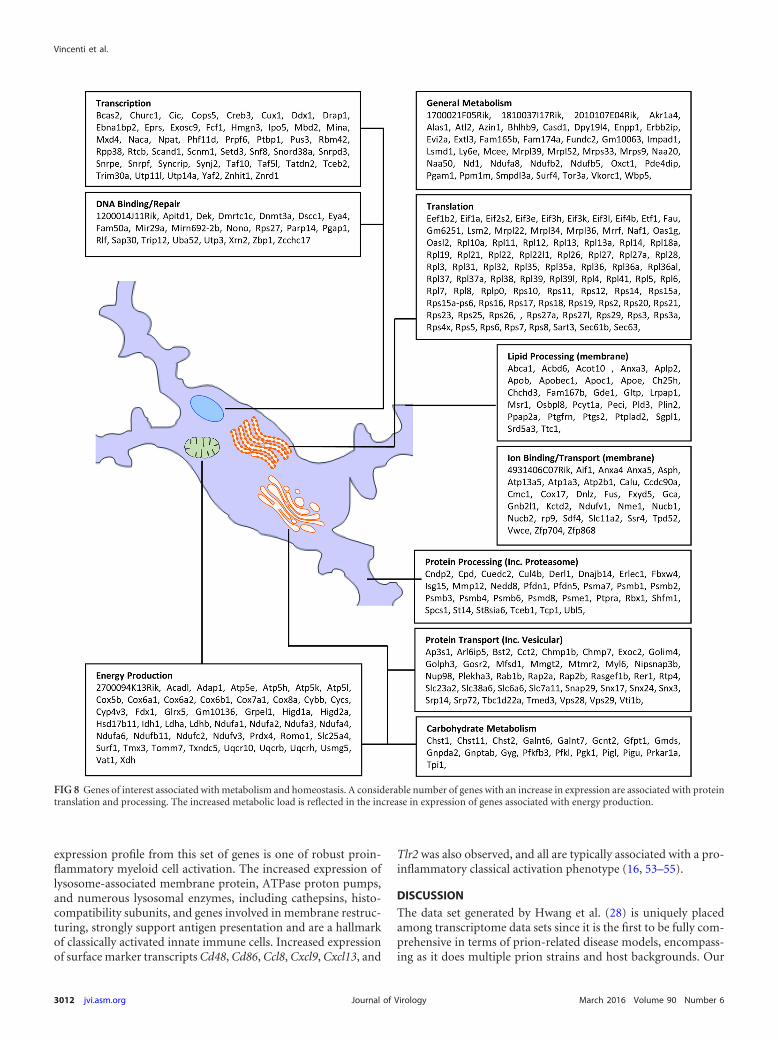
Determination of the subcellular component for each gene
considered to be associated with metabolism/homeostasis wasperformed from data obtained from the Ensembl Biomart data-base. This enabled the location of many genes to be plotted onto acellular map and further organized by function (Fig. 8). The iden-tified cellular components included a significant increase in ex-pression of genes associated with ribosomes within the rough en-doplasmic reticulum and cytoplasm. Indeed, the bulk of the
FIG 5 The purity of isolated microglia was confirmed to be high, and extracted RNA was confirmed to be of workable quality. (A) FACS sample analysis ofCD11b microbead-purified microglia stained with, and positive for, CD11b-PE and CD45-APC demonstrate a high purity. (B and C) An isotope control (B) anda negative control (C) show no nonspecific binding or autofluorescence, respectively. (D) Cell viability was confirmed using SYTOX live-dead stain. The insetshows isolated cells are EGFP positive. (E) Plot of the mean expression profile of 20 genes known to be expressed in a cell-specific manner. The first five are knownmicroglial expressed genes, and the remainder are expressed in other brain cell types. This demonstrates that the expression of nonmicroglia genes in isolatedmicroglial populations is negligible, suggesting a relatively pure microglial population. Error bars indicate � the SE.
FIG 6 BioLayout Express3D analysis of isolated microglia gene expression. (A) Average expression profile of the two large clusters comprised of 741 genes thatdemonstrate a differential expression in response to disease. All genes yielded an increase in expression with an upregulation at 200 dpi in 79A-infected mice.Error bars indicate � the SE. (B) Global microarray sample-to-sample transposed BioLayout Express3D graph of the 741 identified genes of interest. Prion-infected and uninfected pre-200 dpi arrays are highly correlated and organized into one component. Displaying high intercorrelation but lower correlation withthe rest of the population are the arrays for the 200-dpi-infected group. Note that the nodes have been colored only for clarity and are not indicative of MCLclustering.
Vincenti et al.
3010 jvi.asm.org March 2016 Volume 90 Number 6Journal of Virology
metabolic genes were associated with the ribosomes, thereby im-plying an increase in ribosome numbers and/or ribosome turn-over or an increase in protein synthesis. Also present was a signif-icant concentration of genes associated with proteolysis, includingproteasome-based ubiquitination.
Consistent with the increase in metabolic load were a con-siderable number of genes associated with oxidative phosphor-ylation and energy production in mitochondria, including sub-units for cytochrome c oxidase, NADH dehydrogenase, andlactate dehydrogenases; the latter are associated with the break-
down of increased levels of lactate in situations of respiratorystress (50). Also observed were DNA repair processes, includ-ing the expression of poly(ADP-ribosyl)ation-14 (Parp14), apotent transcriptional regulator and DNA damage-dependentnuclear protein (51, 52).
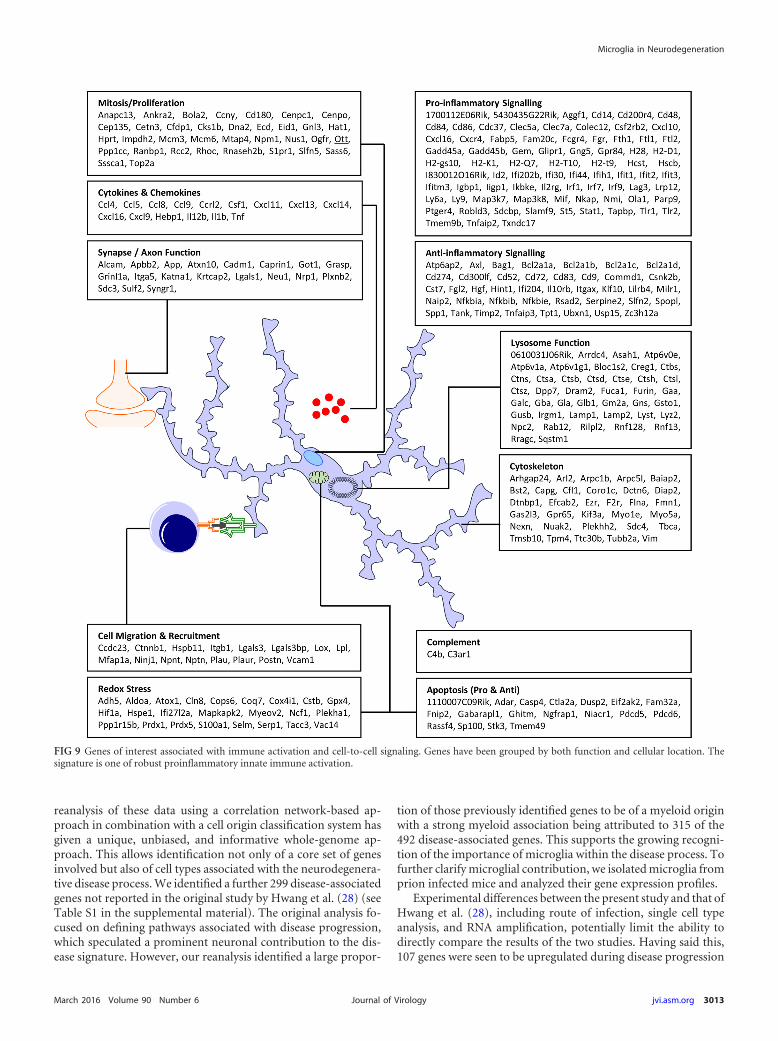
The association of the identified genes of interest with a specificfunction outside metabolism/homeostasis was plotted onto a cel-lular map using ontology data obtained from the EnsemblBiomart database. This enabled the location of each gene to bedetermined and further organized by function (Fig. 9). The overall
FIG 7 Ontological analysis of the microglia activation signature within the 741 genes of interest. (A) GO enrichment terms determined from the identified 741differentially expressed genes using FuncAssociate 2.0 revealed protein translation, respiration, cellular stress, and components of the myeloid immune systemto be significantly represented. All terms have a P value of considerably less than 0.001. (B) Regulated disease-associated genes allocated by function. Using theEnsembl Biomart database the majority of the regulated genes were ascribed to metabolism and homeostasis. Genes associated with immune system, for whichdifferentiation has been included, comprise only a fifth. This highlights the power of a signal cell isolation in correctly determining the association of metabolicgenes with a specific cell type. (C) Expression of inflammatory cytokines and transcription factors associated with the regulation of activation phenotype ofmicroglia. The strong increase in the expression of Tnfa and Il1b, but not cytokines associated with recruitment and escalation toward acquired immunity,implies a disease-specific signature. (D) Nominal and unchanged expression of Tgfb1 is matched by a lack of expression of downstream transcripts mediated byTgfb1 activity. In panels C and D, error bars indicate � the SE.
Microglia in Neurodegeneration
March 2016 Volume 90 Number 6 jvi.asm.org 3011Journal of Virology
expression profile from this set of genes is one of robust proin-flammatory myeloid cell activation. The increased expression oflysosome-associated membrane protein, ATPase proton pumps,and numerous lysosomal enzymes, including cathepsins, histo-compatibility subunits, and genes involved in membrane restruc-turing, strongly support antigen presentation and are a hallmarkof classically activated innate immune cells. Increased expressionof surface marker transcripts Cd48, Cd86, Ccl8, Cxcl9, Cxcl13, and
Tlr2 was also observed, and all are typically associated with a pro-inflammatory classical activation phenotype (16, 53–55).
DISCUSSION
The data set generated by Hwang et al. (28) is uniquely placedamong transcriptome data sets since it is the first to be fully com-prehensive in terms of prion-related disease models, encompass-ing as it does multiple prion strains and host backgrounds. Our
FIG 8 Genes of interest associated with metabolism and homeostasis. A considerable number of genes with an increase in expression are associated with proteintranslation and processing. The increased metabolic load is reflected in the increase in expression of genes associated with energy production.
Vincenti et al.
3012 jvi.asm.org March 2016 Volume 90 Number 6Journal of Virology
reanalysis of these data using a correlation network-based ap-proach in combination with a cell origin classification system hasgiven a unique, unbiased, and informative whole-genome ap-proach. This allows identification not only of a core set of genesinvolved but also of cell types associated with the neurodegenera-tive disease process. We identified a further 299 disease-associatedgenes not reported in the original study by Hwang et al. (28) (seeTable S1 in the supplemental material). The original analysis fo-cused on defining pathways associated with disease progression,which speculated a prominent neuronal contribution to the dis-ease signature. However, our reanalysis identified a large propor-
tion of those previously identified genes to be of a myeloid originwith a strong myeloid association being attributed to 315 of the492 disease-associated genes. This supports the growing recogni-tion of the importance of microglia within the disease process. Tofurther clarify microglial contribution, we isolated microglia fromprion infected mice and analyzed their gene expression profiles.
Experimental differences between the present study and that ofHwang et al. (28), including route of infection, single cell typeanalysis, and RNA amplification, potentially limit the ability todirectly compare the results of the two studies. Having said this,107 genes were seen to be upregulated during disease progression
FIG 9 Genes of interest associated with immune activation and cell-to-cell signaling. Genes have been grouped by both function and cellular location. Thesignature is one of robust proinflammatory innate immune activation.
Microglia in Neurodegeneration
March 2016 Volume 90 Number 6 jvi.asm.org 3013Journal of Virology
in both studies and were primarily associated with an innate im-mune response (see Fig. S1 in the supplemental material). Weadopted an intraperitoneal route of infection as a “more natural”route of infection rather than the more commonly used intracra-nial route to ensure that microglial activation was the result of aresponse to initial infection entering the CNS environment. Withan intracranial route of infection, the microglial response may becomplicated by the injection procedure, resulting in what has beentermed the “prepriming” of microglia (56-58). A peripheral routewould also encapsulate any microglial response to systemic in-flammation observed in prion disease following a peripheral routeof infection (59) but not following an intracerebral route of infec-tion (60). However, both studies arrive at the same conclusion:prion disease is associated with a chronic inflammatory response,with microglia being central to the disease process.
The increase in the levels of Il1b, Tnfa, and Csf1 strongly por-tray the microglial activation profile as proinflammatory and notone of atypical downregulation or resolution of inflammation(61). The presence of a significant increase in transcripts involvedwith proteasome activity and major histocompatibility complex-mediated antigen presentation, combined with expression ofCxcr3 ligand genes, offers a microglia activation state more akin toclassically activated macrophages. That said, the lack of expressionof Infg, Il6, and Il33 by microglia, all well-defined proinflamma-tory cytokines (62–64), suggests an atypical inflammatory re-sponse. Also of note, and crucial to the maintenance of a chronicresponse to inflammatory cytokines, was that the expression ofNfkb1 remained stable despite an increase in expression of Nfkb1inhibitors (Nfkbia, Nfkbib, and Nfkbie), which have been shown toinhibit formation of NFKB1 at the transcription stages (65).
The inflammatory phenotype typically associated with priondisease has been shown to be remarkably anti-inflammatory anddominated by the anti-inflammatory growth factor Tgfb1 follow-ing injection by an intracerebral (66) or a hippocampal stereo-tactic (7, 61) route. Found in the healthy brain, Tgfb1 is aconstitutively expressed protein intricately involved in micro-glia homeostasis (67–70). The lack of differential expression ofTgfb1 within this data set suggests a lack of active Tgfb1-mediatedsignaling as a significant contributor to the disease response bymicroglia. There was also lack of significant increase in expressionof Usp15, Zfyve9, or Socs3-5, indicating no increased translocationof SMAD2/3 proteins or mitogen-activated protein kinase signal-ing, which are core intracellular complexes of the TGFB1 signalingpathway (67, 71–73). Tgfb1 is required for the correct function ofthe blood-brain barrier and is itself unable to pass (74, 75). Thistherefore suggests that the increased expression of Tgfb1 noted inother studies is either attributable to the intracerebral inoculation orexpressed by another group of cells from within the CNS.
Microglia are known to intricately interact with neurons (76–78), and numerous genes associated with axon elongation, syn-apse regulation, and neurotransmitter release were observed toincrease in expression within the isolated microglia data set. Thispartners the expression of many axon and synapse genes withmicroglia and adds them to the growing body of evidence formicroglial involvement in neuron regulation (79–83). It has beenproposed that microglia kill prion-infected neurons in a mannerdependent upon the presence and degree of fibrillarity of mis-folded protein (84). This single cell data set supports the genera-tion of a neurotoxic response from microglia with increased ex-pression of Il1b, Tnfa, and caspase-4 (Casp4), indicating active
processing within caspase-1-mediated inflammasomes (85–87).Other proinflammatory genes found within this data set, and re-ported to be neurotoxic, include matrix metalloproteinase 12(Mmp12) (88) and prostaglandin-endoperoxide synthase 2(Ptgs2) (89). The latter is known to be expressed in prion disease(90, 91) and is a target of nonsteroidal anti-inflammatory drugsused in clinical trials to treat neurodegenerative diseases by inhib-iting prostaglandin synthesis (92).
Within this analysis microglia were shown to express a diseasesignature markedly more proinflammatory than that currentlyportrayed in the literature for prion disease and more akin to otherprotein-misfolding diseases, notably Alzheimer’s disease, inwhich microglia are observed as expressing a repertoire of proin-flammatory cytokines, including Tnfa, Il1b, and Il6 (93–95). Theincreased expression of cytokines Il1b, Tnfa, and Csf1, but not Il6in this data set suggests an activation profile that is specific toprion disease and likely also unique to the in vivo environmentsince cocultures of microglia and neurons in the presence ofPrP106�126 induces a stereotypic response with CD14-mediateddetection of damaged neurons and increased expression of Il6(96). This matches the stereotypic neurotoxic response ob-served in cocultures of neurons in the presence of LPS activatedmicroglia (97).
Our study demonstrated that genes upregulated throughoutthe disease process are expressed predominantly by microglia. Adisease-specific highly proinflammatory signature was observed,in addition to an upregulation of genes associated with metabo-lism and respiratory stress. These findings strongly support thegrowing recognition of the important contribution of microglia toa chronic neurodegenerative disease process. Protein misfoldingdiseases typically have a very long preclinical phase in which thereis a steady and progressive increase in misfolded protein deposi-tion, neuroinflammation, and synaptopathy as the disease pro-gresses. Thus, an understanding of the contributors to this pre-clinical phase provides opportunities for devising earlyintervention strategies to limit the pathology before damage be-comes irreversible.
ACKNOWLEDGMENTS
We acknowledge the extensive support and expertise of Aileen Boyle,Gillian McGregor, Dawn Drummond, and Sandra Mack for pathologyservices. We also thank Rebecca Hogan for animal care, Bob Fleming andDeborah Brown for assistance with bioimaging, and Lynesay McKay forassistance with Miltenyi Biotec equipment.
This study was funded by a DTA studentship from the BBSRC. Thefunders had no role in study design or data collection and interpretation.
None of the authors have any conflict of interest relating to this study.J.E.V., E.C., T.C.F., and J.C.M. designed the study. J.E.V. conducted
the research. J.E.V., T.C.F., and J.C.M. analyzed the data. J.E.V., T.C.F.,and J.C.M. wrote the manuscript. B.W.M., K.G., and L.M. provided toolsand expertise and provided a valuable review of the manuscript.
FUNDING INFORMATIONBiotechnology and Biological Sciences Research Council (BBSRC) pro-vided funding to James E. Vincenti under grant number BB/F01693X/1.
REFERENCES1. Williams AE, van Dam AM, Man-A-Hing WK, Berkenbosch F, Eikelen-
boom P, Fraser H. 1994. Cytokines, prostaglandins, and lipocortin-1 arepresent in the brains of scrapie-infected mice. Brain Res 654:200 –206.http://dx.doi.org/10.1016/0006-8993(94)90480-4.
2. Betmouni S, Perry VH, Gordon JL. 1996. Evidence for an early inflam-
Vincenti et al.
3014 jvi.asm.org March 2016 Volume 90 Number 6Journal of Virology
matory response in the central nervous system of mice with scrapie. Neu-roscience 74:1–5. http://dx.doi.org/10.1016/0306-4522(96)00212-6.
3. Ye X, Scallet AC, Kascsak RJ, Carp RI. 1998. Astrocytosis and amyloiddeposition in scrapie-infected hamsters. Brain Res 809:277–287. http://dx.doi.org/10.1016/S0006-8993(98)00833-6.
4. Jebelli J, Su W, Hopkins S, Pocock J, Garden GA. 2015. Glia: guardians,gluttons, or guides for the maintenance of neuronal connectivity?. Ann NY Acad Sci U S A. 1351:1–10. http://dx.doi.org/10.1111/nyas.12711.
5. Williams A, Lucassen PJ, Ritchie D, Bruce M. 1997. PrP Deposition,microglial activation, and neuronal apoptosis in murine scrapie. Exp Neu-rol 144:433– 438. http://dx.doi.org/10.1006/exnr.1997.6424.
6. Baker CA, Lu ZY, Zaitsev I, Manuelidis L. 1999. Microglial activationvaries in different models of Creutzfeldt-Jakob disease. J Virol 73:5089 –5097.
7. Cunningham C, Boche D, Perry VH. 2002. Transforming growth factor�1, the dominant cytokine in murine prion disease: influence on inflam-matory cytokine synthesis and alteration of vascular extracellular matrix.Neuropathol Appl Neurobiol 28:107–119. http://dx.doi.org/10.1046/j.1365-2990.2002.00383.x.
8. Lawson LJ, Perry VH, Dri P, Gordon S. 1990. Heterogeneity in the distri-bution and morphology of microglia in the normal adult mouse brain. Neu-roscience 39:151–170. http://dx.doi.org/10.1016/0306-4522(90)90229-W.
9. Hart AD, Wyttenbach A, Perry VH, Teeling JL. 2012. Age relatedchanges in microglial phenotype vary between CNS regions: grey versuswhite matter differences. Brain Behavior Immun 26:754 –765. http://dx.doi.org/10.1016/j.bbi.2011.11.006.
10. Nimmerjahn A, Kirchhoff F, Helmchen F. 2005. Resting microglial cellsare highly dynamic surveillants of brain parenchyma in vivo. Science 308:1314 –1318. http://dx.doi.org/10.1126/science.1110647.
11. Davalos D, Grutzendler J, Yang G, Kim JV, Zuo Y, Jung S, Littman DR,Dustin ML, Gan WB. 2005. ATP mediates rapid microglial response tolocal brain injury in vivo. Nat Neurosci 8:752–758. http://dx.doi.org/10.1038/nn1472.
12. Kozai, TD, Vazquez, AL, Weaver, CL, Kim, SG, Cui, XT. 2012. In vivotwo-photon microscopy reveals immediate microglial reaction to implan-tation of microelectrode through extension of processes. J Neural Eng9:066001. http://dx.doi.org/10.1088/1741-2560/9/6/066001.
13. Perry VH, Nicoll JAR, Holmes C. 2010. Microglia in neurodegenerativedisease. Nat Rev Neurol 6:193–201. http://dx.doi.org/10.1038/nrneurol.2010.17.
14. Mosser DM, Edwards JP. 2008. Exploring the full spectrum of macro-phage activation. Nat Rev Immunol 8:958 –969. http://dx.doi.org/10.1038/nri2448.
15. Xue J, Schmidt SV, Sander J, Draffehn A, Krebs W, Quester I, DeNardo D, Gohel TD, Emde M, Schmidleithner L, Ganesan H, Nino-Castro A, Mallmann MR, Labzin L, Theis H, Kraut M, Beyer M, Latz E,Freeman TC, Ulas T, Schultze JL. 2014. Transcriptome-based networkanalysis reveals a spectrum model of human macrophage activation. Im-munity 40:274 –288. http://dx.doi.org/10.1016/j.immuni.2014.01.006.
16. Martinez FO, Sica A, Mantovani A, Locati M. 2008. Macrophage acti-vation and polarization. Front Biosci 13:453– 461. http://dx.doi.org/10.2741/2692.
17. Palin K, Cunningham C, Forse P, Perry VH, Platt N. 2008. Systemicinflammation switches the inflammatory cytokine profile in CNS Walle-rian degeneration. Neurobiol Dis 30:19 –29. http://dx.doi.org/10.1016/j.nbd.2007.11.012.
18. Murray CL, Skelly DT, Cunningham C. 2011. Exacerbation of CNSinflammation and neurodegeneration by systemic LPS treatment is inde-pendent of circulating IL-1� and IL-6. J Neuroinflamm 8:50. http://dx.doi.org/10.1186/1742-2094-8-50.
19. Field R, Campion S, Warren C, Murray C, Cunningham C. 2010.Systemic challenge with the TLR3 agonist poly I:C induces amplifiedIFN /� and IL-1� responses in the diseased brain and exacerbates chronicneurodegeneration. Brain Behavior Immun 24:996 –1007. http://dx.doi.org/10.1016/j.bbi.2010.04.004.
20. Thomson CA, McColl A, Cavanagh J, Graham GJ. 2014. Peripheralinflammation is associated with remote global gene expression changes inthe brain. J Neuroinflamm 11:73. http://dx.doi.org/10.1186/1742-2094-11-73.
21. Lunnon K, Teeling JL, Tutt AL, Cragg MS, Glennie MJ, Perry VH. 2011.Systemic inflammation modulates Fc receptor expression on microglia
during chronic neurodegeneration. J Immunol 186:7215–7224. http://dx.doi.org/10.4049/jimmunol.0903833.
22. Combrinck MI, Perry VH, Cunningham C. 2002. Peripheral infectionevokes exaggerated sickness behaviour in pre-clinical murine priondisease. Neuroscience 112:7–11. http://dx.doi.org/10.1016/S0306-4522(02)00030-1.
23. Perry VH, Teeling J. 2013. Microglia and macrophages of the centralnervous system: the contribution of microglia priming and systemic in-flammation to chronic neurodegeneration. Semin Immunopathol 35:601–112. http://dx.doi.org/10.1007/s00281-013-0382-8.
24. Saura J. 2007. Microglial cells in astroglial cultures: a cautionary note. JNeuroinflamm 4:26. http://dx.doi.org/10.1186/1742-2094-4-26.
25. Lee M, Schwab C, McGeer PL. 2011. Astrocytes are GABAergic cells thatmodulate microglial activity. Glia 59:152–165. http://dx.doi.org/10.1002/glia.21087.
26. Cardona AE, Pioro EP, Sasse ME, Kostenko V, Cardona SM, DijkstraIM, Huang D, Kidd G, Dombrowski S, Dutta R, Lee JC, Cook DN, JungS, Lira SA, Littman DR, Ransohoff RM. 2006. Control of microglialneurotoxicity by the fractalkine receptor. Nat Neurosci 9:917–924. http://dx.doi.org/10.1038/nn1715.
27. Boche D, Cunningham C, Docagne F, Scott H, Perry VH. 2006. TGF�1regulates the inflammatory response during chronic neurodegeneration.Neurobiol Dis 22:638 – 650. http://dx.doi.org/10.1016/j.nbd.2006.01.004.
28. Hwang D, Lee IY, Yoo H, Gehlenborg N, ChoJ-H, Petritis B, Baxter D,Pitstick R, Young R, Spicer D, Price ND, Hohmann JG, DeArmond SJ,Carlson GA, Hood LE. 2009. A systems approach to prion disease. MolSyst Biol 5:252. http://dx.doi.org/10.1038/msb.2009.10.
29. Kauffmann A, Gentleman R, Huber W. 2009. arrayQualityMetrics–abioconductor package for quality assessment of microarray data. Bioin-formatics 25:415– 416. http://dx.doi.org/10.1093/bioinformatics/btn647.
30. Irizarry RA, Hobbs B, Collin F, Beazer-Barclay YD, Antonellis KJ,Scherf U, Speed TP. 2003. Exploration, normalization, and summaries ofhigh density oligonucleotide array probe level data. Biostatistics 4:249 –264. http://dx.doi.org/10.1093/biostatistics/4.2.249.
31. Freeman TC, Goldovsky L, Brosch M, van Dongen S, Mazière P,Grocock RJ, Freilich S, Thornton J, Enright AJ. 2007. Construction,visualisation, and clustering of transcription networks from microarrayexpression data. PLoS Comput Biol 3:2032–2042.
32. Dongen V. 2000. Performance criteria for graph clustering and Markovcluster experiments. Document INS-R0012. CWI (Centre for Mathemat-ics and Computer Science), Amsterdam, Netherlands.
33. Wu C, Orozco C, Boyer J, Leglise M, Goodale J, Batalov S, Hodge CL,Haase J, Janes J, Huss JW, III, Su AI. 2009. BioGPS: an extensible andcustomizable portal for querying and organizing gene annotation re-sources. Genome Biol 10:2009 –2010. http://dx.doi.org/10.1186/gb-2009-10-11-r130.
34. Su AI, Cooke MP, Ching KA, Hakak Y, Walker JR, Wiltshire T, OrthAP, Vega RG, Sapinoso LM, Moqrich A, Patapoutian A, Hampton GM,Schultz PG, Hogenesch JB. 2002. Large-scale analysis of the human andmouse transcriptomes. Proc Natl Acad Sci U S A 99:4465– 4470. http://dx.doi.org/10.1073/pnas.012025199.
35. Doyle JP, Dougherty JD, Heiman M, Schmidt EF, Stevens TR, Ma G,Bupp S, Shrestha P, Shah RD, Doughty ML, Gong S, Greengard P,Heintz N. 2008. Application of a translational profiling approach for thecomparative analysis of CNS cell types. Cell 135:749 –762. http://dx.doi.org/10.1016/j.cell.2008.10.029.
36. Heiman M, Schaefer A, Gong S, Peterson JD, Day M, Ramsey KE,Suarez-Farinas M, Schwarz C, Stephan DA, Surmeier DJ, Greengard P,Heintz N. 2008. A translational profiling approach for the molecularcharacterization of CNS cell types. Cell 135:738 –748. http://dx.doi.org/10.1016/j.cell.2008.10.028.
37. Lattin JE, Schroder K, Su AI, Walker JR, Zhang J, Wiltshire T, Saijo K,Glass CK, Hume DA, Kellie S, Sweet MJ. 2008. Expression analysis of GProtein-Coupled Receptors in mouse macrophages. Immunome Res4:1745–7580. http://dx.doi.org/10.1186/1745-7580-4-5.
38. Sasmono RT, Oceandy D, Pollard JW, Tong W, Pavli P, Wainwright BJ,Ostrowski MC, Himes SR, Hume DA. 2003. A macrophage colony-stimulating factor receptor-green fluorescent protein transgene is ex-pressed throughout the mononuclear phagocyte system of the mouse.Blood 101:1155–1163. http://dx.doi.org/10.1182/blood-2002-02-0569.
39. Dickinson AG, Meikle VM, Fraser H. 1968. Identification of a genewhich controls the incubation period of some strains of scrapie agent
Microglia in Neurodegeneration
March 2016 Volume 90 Number 6 jvi.asm.org 3015Journal of Virology
in mice. J Comp Pathol 78:293–299. http://dx.doi.org/10.1016/0021-9975(68)90005-4.
40. Fraser H, Dickinson AG. 1967. Distribution of experimentally inducedscrapie lesions in the brain. Nature 216:1310 –1311. http://dx.doi.org/10.1038/2161310a0.
41. Korth C, Stierli B, Streit P, Moser M, Schaller O, Fischer R, Schulz-Schaeffer W, Kretzschmar H, Raeber A, Braun U, Ehrensperger F,Hornemann S, Glockshuber R, Riek R, Billeter M, Wuthrich K, OeschB. 1997. Prion (PrPSc)-specific epitope defined by a monoclonal anti-body. Nature 390:74 –77. http://dx.doi.org/10.1038/36337.
42. Cancellotti E, Bradford BM, Tuzi NL, Hickey RD, Brown D, BrownKL, Barron RM, Kisielewski D, Piccardo P, Manson JC. 2010. Gly-cosylation of PrPC determines timing of neuroinvasion and targetingin the brain following transmissible spongiform encephalopathy infec-tion by a peripheral route. J Virol 84:3464 –3475. http://dx.doi.org/10.1128/JVI.02374-09.
43. Giese A, Brown DR, Groschup MH, Feldmann C, Haist I, KretzschmarHA. 1998. Role of microglia in neuronal cell death in prion disease. BrainPathol 8:449 – 457.
44. Bruce ME. 1993. Scrapie strain variation and mutation. Br Med Bull49:822– 838.
45. McGeer PL, Kawamata T, Walker DG, Akiyama H, Tooyama I, McGeerEG. 1993. Microglia in degenerative neurological disease. Glia 7:84 –92.http://dx.doi.org/10.1002/glia.440070114.
46. Ginhoux F, Greter M, Leboeuf M, Nandi S, See P, Gokhan S, MehlerMF, Conway SJ, Ng LG, Stanley ER, Samokhvalov IM, Merad M. 2010.Fate mapping analysis reveals that adult microglia derive from primitivemacrophages. Science 330:841– 845. http://dx.doi.org/10.1126/science.1194637.
47. Berriz GF, King OD, Bryant B, Sander C, Roth FP. 2003. Characterizinggene sets with FuncAssociate. Bioinformatics 19:2502–2504. http://dx.doi.org/10.1093/bioinformatics/btg363.
48. Akira S, Takeda K. 2004. Toll-like receptor signaling. Nat Rev Immunol4:499 –511. http://dx.doi.org/10.1038/nri1391.
49. Croft D, Mundo AF, Haw R, Milacic M, Weiser J, Wu G, Caudy M,Garapati P, Gillespie M, Kamdar MR, Jassal B, Jupe S, Matthews L, MayB, Palatnik S, Rothfels K, Shamovsky V, Song H, Williams M, Birney E,Hermjakob H, Stein L, D’Eustachio P. 2014. The reactome pathwayknowledgebase. Nucleic Acids Res 42:D472–D477. http://dx.doi.org/10.1093/nar/gkt1102.
50. Brooks GA, Dubouchaud H, Brown M, Sicurello JP, Butz CE. 1999.Role of mitochondrial lactate dehydrogenase and lactate oxidation in theintracellular lactate shuttle. Proc Natl Acad Sci U S A 96:1129 –1134. http://dx.doi.org/10.1073/pnas.96.3.1129.
51. Ame JC, Spenlehauer C, de Murcia G. 2004. The PARP superfamily.Bioessays 26:882– 893. http://dx.doi.org/10.1002/bies.20085.
52. Mehrotra P, Riley JP, Patel R, Li F, Voss L, Goenka S. 2011. PARP-14functions as a transcriptional switch for Stat6-dependent gene activation.J Biol Chem 286:1767–1776. http://dx.doi.org/10.1074/jbc.M110.157768.
53. Mantovani A, Sica A, Sozzani S, Allavena P, Vecchi A, Locati M. 2004.The chemokine system in diverse forms of macrophage activation andpolarization. Trends Immunol 25:677– 686. http://dx.doi.org/10.1016/j.it.2004.09.015.
54. Samuel D, Kroner A. 2011. Repertoire of microglial and macrophageresponses after spinal cord injury. Nat Rev Neurosci 12:388 –399. http://dx.doi.org/10.1038/nrn3053.
55. Elishmereni M, Levi-Schaffer F. 2011. CD48: A co-stimulatory receptorof immunity. Int J Biochem Cell Biol 43:25–28. http://dx.doi.org/10.1016/j.biocel.2010.09.001.
56. Dantzer R. 2004. Cytokine-induced sickness behaviour: a neuroimmuneresponse to activation of innate immunity. Eur J Pharmacol 500:399 – 411.http://dx.doi.org/10.1016/j.ejphar.2004.07.040.
57. Lemstra AW, Groen in’t Woud JCM, Hoozemans JJM, van Haastert ES,Rozemuller AJM, Eikelenboom P, van Gool WA. 2007. Microglia acti-vation in sepsis: a case-control study. J Neuroinflamm 4:4 – 4. http://dx.doi.org/10.1186/1742-2094-4-4.
58. Quan N, Banks WA. 2007. Brain-immune communication pathways.Brain Behavior Immun 21:727–735. http://dx.doi.org/10.1016/j.bbi.2007.05.005.
59. Newsom DM, Liggitt HD, O’Rourke K, Zhuang D, Schneider DA,Harrington RD. 2011. Cytokine antibody array analysis in brain andperiphery of scrapie-infected Tg338 mice. Comp Immunol Microbiol In-fect Dis 34:387–397. http://dx.doi.org/10.1016/j.cimid.2011.06.001.
60. Cunningham C, Wilcockson DC, Boche D, Perry VH. 2005. Compari-son of inflammatory and acute-phase responses in the brain and periph-eral organs of the ME7 model of prion disease. J Virol 79:5174 –5184.http://dx.doi.org/10.1128/JVI.79.8.5174-5184.2005.
61. Walsh DTP, Betmouni SD, Perry VHD. 2001. Absence of detectableIL-1� production in murine prion disease: a model of chronic neurode-generation. J Neuropathol Exp Neurol 60:173–182.
62. Romano M, Sironi M, Toniatti C, Polentarutti N, Fruscella P, Ghezzi P,Faggioni R, Luini W, van Hinsbergh V, Sozzani S, Bussolino F, Poli V,Ciliberto G, Mantovani A. 1997. Role of IL-6 and its soluble receptor ininduction of chemokines and leukocyte recruitment. Immunity 6:315–325. http://dx.doi.org/10.1016/S1074-7613(00)80334-9.
63. Schmitz J, Owyang A, Oldham E, Song Y, Murphy E, McClanahan TK,Zurawski G, Moshrefi M, Qin J, Li X, Gorman DM, Bazan JF, KasteleinRA. 2005. IL-33, an interleukin-1-like cytokine that signals via the IL-1receptor-related protein ST2 and induces T helper type 2-associated cyto-kines. Immunity 23:479 – 490. http://dx.doi.org/10.1016/j.immuni.2005.09.015.
64. Kakkar R, Hei H, Dobner S, Lee RT. 2012. Interleukin 33 as a mechan-ically responsive cytokine secreted by living cells. J Biol Chem 287:6941–6948. http://dx.doi.org/10.1074/jbc.M111.298703.
65. Arenzana-Seisdedos F, Thompson J, Rodriguez MS, Bachelerie F,Thomas D, Hay RT. 1995. Inducible nuclear expression of newly synthe-sized I�B negatively regulates DNA-binding and transcriptional activi-ties of NF-�B. Mol Cell Biol 15:2689 –2696. http://dx.doi.org/10.1128/MCB.15.5.2689.
66. Baker CA, Manuelidis L. 2003. Unique inflammatory RNA profiles ofmicroglia in Creutzfeldt-Jakob disease. Proc Natl Acad Sci U S A 100:675–679. http://dx.doi.org/10.1073/pnas.0237313100.
67. Abutbul S, Shapiro J, Szaingurten-Solodkin I, Levy N, Carmy Y, BaronR, Jung S, Monsonego A. 2012. TGF-beta signaling through SMAD2/3induces the quiescent microglial phenotype within the CNS environment.Glia 60:1160 –1171. http://dx.doi.org/10.1002/glia.22343.
68. Fadok VA, Bratton DL, Konowal A, Freed PW, Westcott JY, HensonPM. 1998. Macrophages that have ingested apoptotic cells in vitro inhibitproinflammatory cytokine production through autocrine/paracrinemechanisms involving TGF-�, PGE2, and PAF. J Clin Invest 101:890 –898. http://dx.doi.org/10.1172/JCI1112.
69. Lodge PA, Sriram S. 1996. Regulation of microglial activation by TGF-�,IL-10, and CSF-1. J Leukoc Biol 60:502–508.
70. Butovsky O, Jedrychowski MP, Moore CS, Cialic R, Lanser AJ, GabrielyG, Koeglsperger T, Dake B, Wu PM, Doykan CE, Fanek Z, Liu L, ChenZ, Rothstein JD, Ransohoff RM, Gygi SP, Antel JP, Weiner HL. 2014.Identification of a unique TGF-beta-dependent molecular and functionalsignature in microglia. Nat Neurosci 17:131–143. http://dx.doi.org/10.1038/nn.3599.
71. Heldin CH, Miyazono K, ten Dijke P. 1997. TGF-beta signalling fromcell membrane to nucleus through SMAD proteins. Nature 390:465– 471.http://dx.doi.org/10.1038/37284.
72. Tsukazaki T, Chiang TA, Davison AF, Attisano L, Wrana JL. 1998.SARA, a FYVE domain protein that recruits Smad2 to the TGF� receptor.Cell 95:779 –791. http://dx.doi.org/10.1016/S0092-8674(00)81701-8.
73. Inui M, Manfrin A, Mamidi A, Martello G, Morsut L, Soligo S, Enzo E,Moro S, Polo S, Dupont S, Cordenonsi M, Piccolo S. 2011. USP15 is adeubiquitylating enzyme for receptor-activated SMADs. Nat Cell Biol 13:1368 –1375. http://dx.doi.org/10.1038/ncb2346.
74. Kastin AJ, Akerstrom V, Pan W. 2003. Circulating TGF-beta1 does notcross the intact blood-brain barrier. J Mol Neurosci 21:43– 48. http://dx.doi.org/10.1385/JMN:21:1:43.
75. Dohgu S, Yamauchi A, Takata F, Naito M, Tsuruo T, Higuchi S, SawadaY, Kataoka Y. 2004. Transforming growth factor-beta1 upregulates thetight junction and P-glycoprotein of brain microvascular endothelial cells.Cell Mol Neurobiol 24:491– 497. http://dx.doi.org/10.1023/B:CEMN.0000022776.47302.ce.
76. Siskova Z, Tremblay ME. 2013. Microglia and synapse: interactions inhealth and neurodegeneration. Neural Plast 2013:425845. http://dx.doi.org/10.1155/2013/425845.
77. Tremblay M-È, Lowery RL, Majewska AK. 2010. Microglial interactionswith synapses are modulated by visual experience. PLoS Biol 8:e1000527.http://dx.doi.org/10.1371/journal.pbio.1000527.
78. Chen Z, Jalabi W, Hu W, Park HJ, Gale JT, Kidd GJ, Bernatowicz R,Gossman ZC, Chen JT, Dutta R, Trapp BD. 2014. Microglial displace-
Vincenti et al.
3016 jvi.asm.org March 2016 Volume 90 Number 6Journal of Virology
ment of inhibitory synapses provides neuroprotection in the adult brain.Nat Commun 5:4486. http://dx.doi.org/10.1038/ncomms5486.
79. Ji K, Akgul G, Wollmuth LP, Tsirka SE. 2013. Microglia actively regulatethe number of functional synapses. PLoS One 8:e56293. http://dx.doi.org/10.1371/journal.pone.0056293.
80. Miyamoto A, Wake H, Moorhouse AJ, Nabekura J. 2013. Microglia andsynapse interactions: fine tuning neural circuits and candidate molecules.Front Cell Neurosci 7:1– 6. http://dx.doi.org/10.3389/fncel.2013.00070.
81. Vukovic J, Colditz MJ, Blackmore DG, Ruitenberg MJ, Bartlett PF.2012. Microglia modulate hippocampal neural precursor activity in re-sponse to exercise and aging. J Neurosci 32:6435– 6443. http://dx.doi.org/10.1523/JNEUROSCI.5925-11.2012.
82. Schafer DP, Lehrman EK, Stevens B. 2013. The “quad-partite” synapse:Microglia-synapse interactions in the developing and mature CNS. Glia61:24 –36. http://dx.doi.org/10.1002/glia.22389.
83. Sogn C, Puchades M, Gundersen V. 2013. Rare contacts between syn-apses and microglial processes containing high levels of Iba1 and actin: apostembedding immunogold study in the healthy rat brain. Eur J Neuro-sci 38:2030 –2040. http://dx.doi.org/10.1111/ejn.12213.
84. Bate C, Reid S, Williams A. 2001. Killing of prion-damaged neuronesby microglia. Neuroreport 12:2589 –2594. http://dx.doi.org/10.1097/00001756-200108080-00059.
85. Franchi L, Eigenbrod T, Munoz-Planillo R, Nunez G. 2009. The inflam-masome: a caspase-1-activation platform that regulates immune re-sponses and disease pathogenesis. Nat Immunol 10:241–247. http://dx.doi.org/10.1038/nrm2665.
86. Martinon F, Tschopp J. 2007. Inflammatory caspases and inflam-masomes: master switches of inflammation. Cell Death Differ 14:10 –22.http://dx.doi.org/10.1038/sj.cdd.4402038.
87. Sollberger G, Strittmatter GE, Kistowska M, French LE, Beer HD. 2012.Caspase-4 is required for activation of inflammasomes. J Immunol 188:1992–2000. http://dx.doi.org/10.4049/jimmunol.1101620.
88. Bai Y, Zhu Z, Gao Z, Kong Y. 2014. TLR2 signaling directs NO-
dependent MMP-9 induction in mouse microglia. Neurosci Lett 571:5–10. http://dx.doi.org/10.1016/j.neulet.2014.04.025.
89. Minghetti I. 2004. Cyclooxygenase-2 (COX-2) in inflammatory and de-generative brain diseases. J Neuropathol Exp Neurol 63:901–910.
90. Minghetti L, Pocchiari M. 2007. Cyclooxygenase-2, prostaglandin E2,and microglial activation in prion diseases. Int Rev Neurobiol 82:265–275.http://dx.doi.org/10.1016/S0074-7742(07)82014-9.
91. Walsh DT, Perry VH, Minghetti L. 2000. Cyclooxygenase-2 is highlyexpressed in microglial-like cells in a murine model of prion disease.Glia 29:392–396. http://dx.doi.org/10.1002/(SICI)1098-1136(20000215)29:4392::AID-GLIA10�3.3.CO;2-3.
92. Vane JR. 1971. Inhibition of prostaglandin synthesis as a mechanism ofaction for aspirin-like drugs. Nat New Biol 231:232–235. http://dx.doi.org/10.1038/newbio231232a0.
93. Bhaskar K, Maphis N, Xu G, Varvel NH, Kokiko-Cochran ON, WeickJP, Staugaitis SM, Cardona A, Ransohoff RM, Herrup K, Lamb BT.2014. Microglial derived tumor necrosis factor-alpha drives Alzheimer’sdisease-related neuronal cell cycle events. Neurobiol Dis 62:273–285. http://dx.doi.org/10.1016/j.nbd.2013.10.007.
94. Griffin WS, Sheng JG, Roberts GW, Mrak RE. 1995. Interleukin-1expression in different plaque types in Alzheimer’s disease: significance inplaque evolution. J Neuropathol Exp Neurol 54:276 –281. http://dx.doi.org/10.1097/00005072-199503000-00014.
95. Tarkowski E, Blennow K, Wallin A, Tarkowski A. 1999. Intracerebralproduction of tumor necrosis factor-alpha, a local neuroprotective agent,in Alzheimer disease and vascular dementia. J Clin Immunol 19:223–230.http://dx.doi.org/10.1023/A:1020568013953.
96. Bate C, Boshuizen R, Williams A. 2005. Microglial cells kill prion-damaged neurons in vitro by a CD14-dependent process. J Neuroimmu-nol 170:62–70. http://dx.doi.org/10.1016/j.jneuroim.2005.08.021.
97. Chao CC, Hu S, Molitor TW, Shaskan EG, Peterson PK. 1992. Activatedmicroglia mediate neuronal cell injury via a nitric oxide mechanism. JImmunol 149:2736 –2741.
Microglia in Neurodegeneration
March 2016 Volume 90 Number 6 jvi.asm.org 3017Journal of Virology