Denied- Santander 2.14.17 v3 - Consumerist
30
DENIED An Assessment of Racial and Economic Disparities in Santander Bank’s Mortgage Lending February 2017
Transcript of Denied- Santander 2.14.17 v3 - Consumerist
DENIEDAn Assessment of Racial and Economic
Disparities in Santander Bank’s Mortgage Lending
February 2017

1
EXECUTIVE SUMMARY
In the United States, banks are barred from discriminatory practices like ‘redlining,’ in which they refuse loans to residents of low-income and communities of color,i and from discrimination when lending to any protected class. However, as evidenced by recent Housing and Urban Development and Justice Department settlements with Associated Bank and Hudson City Savings Bank, big banks continue to redline communities and use discriminatory lending practices, despite the statutes and regulations that were enacted to reduce or eliminate those practices.ii
Santander Bank – one of the world’s largest banksiii – has invested billions of dollars in the past eight years in building a massive U.S. fleet. In the Northeast, including Pennsylvania, Massachusetts and Connecticut, Santander has opened over 670 stores and serves an estimated 2 million U.S. customers.iv As part of this expansion, its U.S. mortgage lending operations have brought in over $560 million in the last five years, and Santander’s fee income increased to $1.2 billion last year.v Yet, analysis of the bank’s Home Mortgage Lending Act data reported each year to federal regulators reveals a disturbing pattern of racial and economic discrimination in Santander’s home mortgage lending.
In 2014, the City of Providence accused the bank of redlining and Santander was recently referred for investigation to the Justice Department for alleged auto loan markups to borrowers of color.vi
This assessment finds that Santander’s discriminatory practices are far more pervasive than previously understood. In 2014 and 2015, Santander has struggled to meet its lending requirements to low-income and communities of color in ten metropolitan areasvii throughout the northeastern U.S, where it serves more than two million people. The assessment also identifies significant disparities in Santander’s lending to Latino, African American and other borrowers of color, as well as to women and low-income borrowers. Four metropolitan areas in particular stand out with substantial problems in Santander’s lending to low-income and communities of color, as well as its lending to individual borrowers belonging to a protected class: Philadelphia, PA, Worcester, MA, Hartford, CT, and Camden, NJ.
KEY POINTS
v In 2014, Santander denied more than 26% of borrowers of color a mortgage loan, compared to an aggregate 17% denial rate by other banks in the same locations.
v In 2014, Santander denied nearly 30% of low-income borrowers a mortgage loan, compared to an aggregate 18% denial rate by other banks in same locations.
v In 2014 and 2015, Santander denied 24.9% and 20.6%, respectively, of African American borrowers.
v Philadelphia, PA: In low-income communities, Santander denied 37% of borrowers, compared to the market denial rate of 15% in 2015. That same year, Santander denied 32% of women borrowers in the city, which was 21% above other banks’ denial rate for women.
v Worcester, MA: In communities of color, Santander denied twice as many people as other banks. In 2014, Santander denied 50% of borrowers in communities of color. In 2015, the bank denied 40% of borrowers in communities of color.

2
v Hartford, CT: For every white borrower denied in 2015, Santander denied at least 4 Latino borrowers.
v Camden, NJ: In 2015, Santander originated 20% fewer loans for African Americans compared to other banks in the city. For every white borrower denied a mortgage loan, Santander denied about 3 African American borrowers in 2014 and 2015.
SANTANDER’S DISCRIMINATORY DENIAL RATES
The denial rate shows the rate at which a protected group of borrowers were denied loans in relation to rate at which the same group applied for loans. In 2014 and 2015, Santander’s mortgage denial rates were above the market’s rates, when accounting for market, or loan volume.viii
In 2014, Santander’s denial rates were worst for low-income borrowers and low-income communities; and the denial rates were significantly higher than the market rate. For a race or ethnic group, Santander’s denial rates were highest, or 30%, for African American and Asian borrowers, compared to a 20% denial rate in 2014 and a 17% denial rate in 2015 for all banks in the market.
Aggregate Denial Rate
Santander Bank Industry Average
2014 2015 Latinos 22.7% 18.4% African Americans 24.9% 20.2% Asians 24.9% 12.9% Women 20.0% 13.6% Persons of Color 26.6% 16.9% Low-Income 29.6% 18.3 Communities of Color 26.6% 20.9 Low-Income Communities 28.8% 18.3%
Latinos 16.6% 15.1% African Americans 20.6% 17.2% Asians 17.2% 11.8% Women 12.3% 11.9% Persons of Color 17.8% 14.5% Low-Income Communities 18.3% 16.3% Communities of Color 18.1% 17.6% Low-Income Communities 19.6% 15.9%
In 2015, Santander’s denial rate was worst among African Americans borrowers, for whom it was 21%, followed by 20% for borrowers from low-income communities. In both cases, Santander’s denial rate was several points ahead of the market’s denial rate.

3
SANTANDER’S DISCRIMINATORY DENIAL DISPARITY RATIO
The denial disparity ratio shows the ratio at which a borrower of color was denied a loan to a white borrower. When controlling for market, or loan volume size, Santander’s denial disparity ratios were the highest for borrowers of color as a group.
In 2015, Santander’s denial disparity ratio for African Americans was 3.2, meaning for every loan denied to a white borrower, more than three were denied to African American borrowers. This ratio doubled between 2014 and 2015.ix
Aggregate Denial Disparity Ratio
Latinos African Americans Asians Persons
of Color
Santander Bank 2014 1.4 1.5 1.3 2.0 2015 2.0 3.2 1.6 3.5
Industry Average 2014 1.7 1.9 1.1 1.2 2015 1.9 1.8 1.3 1.4
SANTANDER’S DISCRIMINATORY LENDING WORST IN FOUR METROPOLITAN AREAS
In four metropolitan divisions -- Philadelphia, PA, Worcester, MA, Hartford, CT, and Camden, NJ – Santander’s mortgage lending practices exhibit the worst racial and economic disparities in the northeast region. The appendix includes market statistics for the ten metropolitan areas.
PHILADELPHIA, PENNSYLVANIA
The Philadelphia metropolitan division consists of two counties, Philadelphia and Delaware. Philadelphia County has a significant African American population, with 43% of the total population. Twenty-six percent of African American families in Philadelphia County live below the poverty line. Latinos make up 13% of the Philadelphia County population and 39% of Latino families were living below the poverty line in the county in 2015. Forty-one percent of the population is white, and 9% of white families live under the poverty line.
In Delaware County, 21% of the population is African American and 19% of African American families live below the poverty line. Latinos constitute 3% of the population in Delaware County and 27% of Latino families were living below the poverty line in 2015. Seventy-one percent of the population is white, and 4% of white families live under the poverty line.x

4
LENDING TO LOW-INCOME AND COMMUNITIES OF COLOR
Santander’s lending performance in both Philadelphia’s low-income and communities of color deteriorated substantially between 2014 and 2015. While the loan application rates at Santander in Philadelphia were ahead of the market in 2014, Santander’s loan origination rate to persons residing in communities of color lagged 10% and in low-income communities, 13% behind the market in 2015.
Mortgage Origination Rate - Philadelphia, PA 2014 2015
Santander Bank
Communities of Color 72.2% 56.1%
Low-Income Communities 70.9% 53.7%
All Banks in Market
Communities of Color 64.7% 66.1%
Low-Income Communities 64.9% 67.0%
In Philadelphia’s low-income and communities of color, Santander’s loan denial rate was twice the market’s denial rate in 2015. In low-income communities Santander’s denial rate was 37%, compared to the market denial rate of 15%, and in communities of color Santander’s denial rate was 33%, compared to the market denial rate at 16%.
Mortgage Denial Rate - Philadelphia, PA 2014 2015
Santander Bank
Communities of Color 22.2% 33.3%
Low-Income Communities 21.8% 36.6%
All Banks in Market
Communities of Color 17.5% 15.6%
Low-Income Communities 17.2% 15.4%

5
LENDING TO WOMEN, LOW-INCOME AND BORROWERS OF COLOR
Santander’s lending with African Americans showed disturbing trends in 2015. Santander’s denial rates for African Americans were 26.1% in 2014, and 53.3% in 2015. This compares to the market’s denial rates of 21.1% in 2014 and 17.1% in 2015. Santander’s denial disparity ratio for African Americans was 3.7, meaning almost four African Americans were denied loans for every white borrower in Philadelphia. This denial disparity ratio was 1.3 above the market’s denial disparity ratio for African Americans, which was 2.4.
Denial Disparity Ratio - Philadelphia, PA
African Americans Borrowers of Color
Santander Bank 2014 1.5 2.1 2015 3.7 2.3
Industry Average 2014 0.9 1.7
2015 2.3 1.8
In 2015, Santander’s poor lending performance with low-income borrowers and women was notable. The market’s denial rate for low-income borrowers in Philadelphia in 2015 was 15.4%, while Santander’s denial rate for low-income borrowers was 33.3%. Similarly, disparities were evident with Santander’s loan denials to women borrowers. The market’s denial rate for women was 11.2%. Santander denied loans to women at a rate of 32.4%, which was 21% above the market’s denial rate for women.
Women and Low-Income Borrowers – Philadelphia, PA Women Low-Income
Denial Rate
Santander Bank 2014 14.4% 23.6% 2015 32.4% 33.3%
Industry Average 2014 12.4% 19.8% 2015 11.2% 15.4%
Origination Rate
Santander Bank 2014 78.9% 69.4% 2015 64.7% 59.6%
Industry Average 2014 71.2% 65.6% 2015 71.9% 65.4%

6
WORCESTER, MASSACHUSETTS
The Worcester area in Massachusetts has two counties, Worcester and Windham. In Worcester County, Latinos make up just over 10% of the population, while 29% percent of Latino families live below the poverty line. African Americans constitute 5% and 19% of African American families live below the poverty line. Eighty-five percent of the population is white, and 6% of white families lived below the poverty line in 2015.
In Windham County, Latinos constitute 11% of the population, while 29% percent of Latino families live below the poverty line. African Americans constitute 2% and 9% of African American families live below the poverty line. Ninety percent of the population is white, and 6% of white families lived below the poverty line in 2015.xi
LENDING TO LOW-INCOME AND COMMUNITIES OF COLOR
In Worcester, both Santander’s loan origination rates lagged behind the growth in the industry in communities of color.
Mortgage Origination Rate - Worcester, MA 2014 2015
Santander Bank
Communities of Color 50.0% 60.0%
Low-Income Communities 56.8% 61.9%
Industry Average
Communities of Color 44.5% 61.8%
Low-Income Communities 58.6% 70.5%
Santander’s denial rate was almost double the denial rate of the Worcester market in communities of color. While the market denial rates to persons living in communities of color were about 32% in 2014 and 19% 2015, Santander’s were 50% in 2014 and 40% in 2015.
Mortgage Denial Rate - Worcester, MA 2014 2015
Santander Bank
Communities of Color 50.0% 40.0%
Low-Income Communities 36.4% 19.0%
Industry Average
Communities of Color 32.1% 19.1%
Low-Income Communities 23.0% 14.7%

7
LENDING TO WOMEN, LOW-INCOME, AND BORROWERS OF COLOR
In 2015, a significant disparity in lending to borrowers of color as a whole was apparent in Worcester, where Santander denied borrowers of color loans 41% more than all banks in the market. Borrowers of color denial disparity ratio was 6.5, 5.1 more than the market denial disparity ratio.
In Worcester, disparities in lending to Latinos were also very apparent. Santander’s denial disparity ratio for Latino borrowers was 5.1, 3.6 above the market denial disparity ratio. Santander originated loans to Latinos 29% less than the market and denied Latinos loans 29% more than the market in 2015.
Mortgage Denial Disparity Ratio - Worcester, MA Latinos Persons of Color
Santander Bank 2014 1.8 1.5 2015 5.1 6.5
Industry Average 2014 1.5 1.4 2015 1.6 1.4
HARTFORD, CONNECTICUT
The Hartford area consists of three counties, Hartford, Middlesex, and Tolland Counties. Hartford has a significant Latino population, especially in Hartford County, where it was more than 16% of the total population in 2015. Twenty-eight percent of Latino families in Hartford County were estimated to be living below the poverty line in 2015. African Americans accounted for over 13% of the population in Hartford County in 2015, with over 17% of African American families estimated to be living under the poverty line. White persons accounted for 72% of the population, and just over 3% of white families were estimated to be living under the poverty line.
Middlesex and Tolland Counties had slightly smaller Latino and African American populations, with similar variances in family poverty.xii
8
LENDING TO LOW-INCOME AND COMMUNITIES OF COLOR
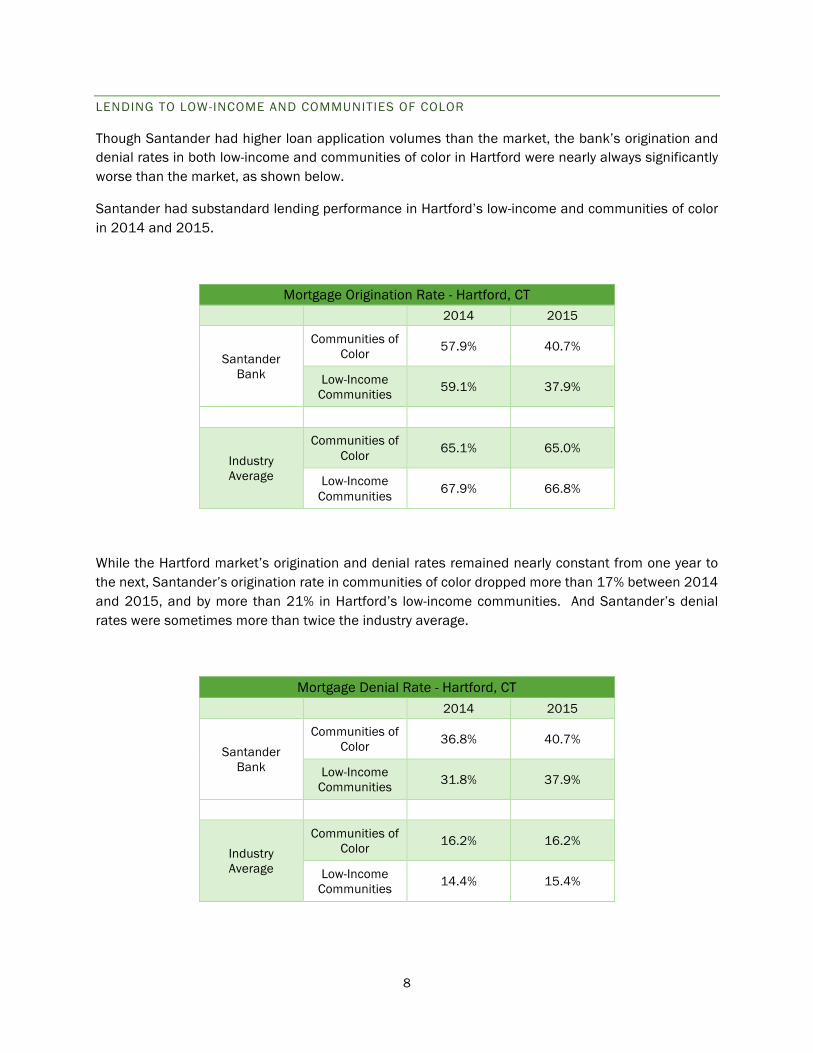
Though Santander had higher loan application volumes than the market, the bank’s origination and denial rates in both low-income and communities of color in Hartford were nearly always significantly worse than the market, as shown below.
Santander had substandard lending performance in Hartford’s low-income and communities of color in 2014 and 2015.
Mortgage Origination Rate - Hartford, CT 2014 2015
Santander Bank
Communities of Color 57.9% 40.7%
Low-Income Communities 59.1% 37.9%
Industry Average
Communities of Color 65.1% 65.0%
Low-Income Communities 67.9% 66.8%
While the Hartford market’s origination and denial rates remained nearly constant from one year to the next, Santander’s origination rate in communities of color dropped more than 17% between 2014 and 2015, and by more than 21% in Hartford’s low-income communities. And Santander’s denial rates were sometimes more than twice the industry average.
Mortgage Denial Rate - Hartford, CT 2014 2015
Santander Bank
Communities of Color 36.8% 40.7%
Low-Income Communities 31.8% 37.9%
Industry Average
Communities of Color 16.2% 16.2%
Low-Income Communities 14.4% 15.4%

9
LENDING TO WOMEN, LOW-INCOME, AND BORROWERS OF COLOR
The Hartford area had the starkest disparities in Santander’s lending in our analysis. Disparate treatment was especially evident for Latino borrowers. Santander’s denial disparity ratio for Latino borrowers was 4.3 for every white borrower in 2015. This ratio was 2.4 above the market’s denial disparity ratio. In both 2014 and 2015, Santander’s denial rate for Latinos was about 20% more than the market denial rate.
In 2015, Santander’s denial disparity ratio for African Americans was 6.4, 4.1 above the market’s denial disparity ratio. Santander’s origination rate for African American borrowers was 23% and 16% less than the market origination rate in 2014 and 2015, respectively. Santander’s denial rate for borrowers of color was twice the market denial rate. Finally, Santander’s denial disparity ratio for borrowers of color was 4.4; the industry average was 1.9.
Mortgage Denial Disparity Ratio - Hartford, CT
Latinos African Americans
Persons of Color
Santander Bank 2014 3.5 2.3 2.8 2015 4.3 6.4 4.4
Industry Average 2014 1.8 2.0 1.8 2015 1.8 2.3 1.9
There were also disparities in Santander’s lending to women. Santander’s denial rates for women were 15% and 17% more than the market’s denial rates in 2014 and 2015, respectively. Santander’s origination rate to women also lagged 19% behind the market in 2015.
Santander’s denial rate for low-income borrowers as a whole was 15% more than the market’s denial rate in 2015, and Santander’s origination rate disparity for low-income borrowers was 18% behind the market’s rate.
Women and Low-Income Borrowers – Hartford, CT Women Low-Income
Denial Rate
Santander Bank 2014 25.6% 23.0% 2015 26.5% 27.5%
Industry Average 2014 10.3% 13.6% 2015 13.6% 12.4%
Origination Rate
Santander Bank 2014 69.8% 70.5% 2015 55.1% 53.6%
Industry Average 2014 74.0% 70.1% 2015 74.2% 71.5%

10
CAMDEN, NEW JERSEY
The Camden area in New Jersey consists of three counties, Camden, Burlington and Gloucester Counties. In Camden County, African Americans account for over 19% of the population, while 18% of African American families live below the poverty line. Latinos make up over 15% of the population, while 30% of Latino families live below the poverty line. Sixty-three percent of the population is white, and 4% of white families live below the poverty line.
Sixteen percent of the population in Burlington County is African American, while 7% of African American families live below the poverty line. Latinos account for over 7% of the population, while 10% of Latino families live below the poverty line. Seventy-three percent of the population is white, and 3% of white families live below the poverty line.
Finally, in Gloucester County, African Americans make up over 10% of the population, while 16% of African American families live below the poverty line. Five percent of the population is Latino, while 15% of Latino families live below the poverty line. Eighty-two percent of the population is white, and 4% of white families live below the poverty line.xiii
LENDING TO LOW-INCOME AND COMMUNITIES OF COLOR
Santander’s disparities from the market were most evident in the bank’s loan origination rate to persons living in Camden’s communities of color, which were particularly bad in 2015.
Mortgage Origination Rate - Camden, NJ 2014 2015
Santander Bank
Communities of Color N/A 40.0%
Low-Income Communities 71.4% 55.6%
Industry Average
Communities of Color 57.9% 60.1%
Low-Income Communities 64.2% 64.9%
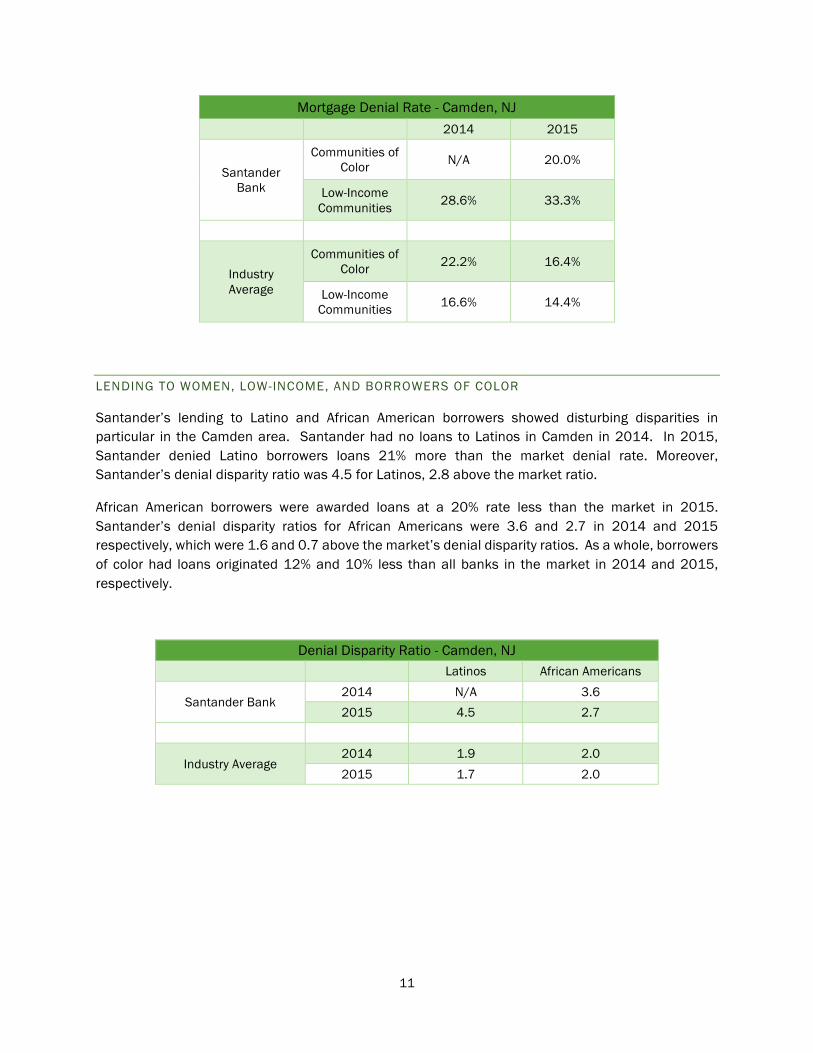
In Camden’s low-income communities, Santander’s loan origination rate declined 15% between 2014 and 2015. Santander’s loan denial rate to residents of Camden’s low-income communities was 12% more than the market in 2014 and 19% in 2015.
11
Mortgage Denial Rate - Camden, NJ 2014 2015
Santander Bank
Communities of Color N/A 20.0%
Low-Income Communities 28.6% 33.3%
Industry Average
Communities of Color 22.2% 16.4%
Low-Income Communities 16.6% 14.4%
LENDING TO WOMEN, LOW-INCOME, AND BORROWERS OF COLOR
Santander’s lending to Latino and African American borrowers showed disturbing disparities in particular in the Camden area. Santander had no loans to Latinos in Camden in 2014. In 2015, Santander denied Latino borrowers loans 21% more than the market denial rate. Moreover, Santander’s denial disparity ratio was 4.5 for Latinos, 2.8 above the market ratio.
African American borrowers were awarded loans at a 20% rate less than the market in 2015. Santander’s denial disparity ratios for African Americans were 3.6 and 2.7 in 2014 and 2015 respectively, which were 1.6 and 0.7 above the market’s denial disparity ratios. As a whole, borrowers of color had loans originated 12% and 10% less than all banks in the market in 2014 and 2015, respectively.
Denial Disparity Ratio - Camden, NJ Latinos African Americans
Santander Bank 2014 N/A 3.6 2015 4.5 2.7
Industry Average 2014 1.9 2.0 2015 1.7 2.0

12
ALLEGATIONS OF ABUSIVE OR DISCRIMINATORY PRACTICES
Banks have long ensured profitability through questionable techniques like directing lending to higher-income, predominantly white communities, or by steering protected classes of people into high-interest loans.xiv Santander Bank was accused by the City of Providence of redlining and deliberately reducing lending to borrowers of color in 2014. Santander Consumer, the subprime auto lending arm of the U.S. operations, has been referred to the Justice Department for investigation for alleged auto loan markups to borrowers of color. Banco Santander Puerto Rico, also part of U.S. banking operations, earned millions in fees off risky bond deals it underwrote to the Puerto Rican government, which facilitated Puerto Rico’s debt crisis. Former Santander executives used a revolving door with the island’s government bank, and greatly exacerbated the debt crisis.xv Finally, Santander was also implicated in the ‘robo-signing’ foreclosure scandal, one of the biggest scandals coming out of the mortgage crisis. The bank did not settle this case until 2016, though it was opened in 2011.
REDLINING IN PROVIDENCE, RHODE ISLAND
Santander was accused of redlining by the City of Providence, Rhode Island in 2014. In a federal suit, the city alleged Santander deliberately reduced its lending there after 2009 to African American and Hispanic borrowers while increasing lending to white borrowers. The lawsuit also alleged borrowers living in communities of color in Boston were refused loans at a much higher rate than those living in white neighborhoods in the same time period. Santander settled with the city several months later with a $1.3 million grant to the city.xvi
ALLEGATIONS OF DISCRIMINATORY LENDING PRACTICES AT SANTANDER CONSUMER
Santander Consumer, one the nation’s largest subprime auto lending companies, is also no stranger to allegations of discriminatory lending in the U.S. In 2015, the company was referred to the Justice Department for investigation for alleged auto loan markups to minority borrowers, in violation of the ECOA. xvii Prior in 2014, the Justice Department subpoenaed Santander Consumer to provide documents in part related “to the underwriting and securitization of nonprime auto loans since 2007,” according to the filing.xviii Other public officials have announced similar investigations.xix Santander Consumer has played a leading role securitizing subprime loans into asset-backed securities, which are then sold to investors as bonds.xx Experts are now predicting a looming bust in this market, although not on the same scale as the mortgage crisis, but which nonetheless could be harmful to millions of Americans.xxi
SANTANDER’S ROLE IN THE PUERTO RICAN DEBT CRISIS
The Committee for Better Banks and Hedgeclippers recently released a report, Pirates of the Caribbean: How Santander Exacerbated a Fiscal Catastrophe for the Puerto Rican People, which documents how Santander facilitated risky bond deals that helped saddle Puerto Rico with unsustainable debt. xxii The bond deals had unreasonable repayment terms, which ultimately pushed the island to default.
Santander earned millions in fees off these risky bond deals, even as the bank’s own executives moved to the Puerto Rican government in official roles that included structuring municipal bond deals and

13
selecting the underwriters – including Santander itself – for the bonds. The bank placed some of the troubled securities into Santander-managed closed-end mutual fund portfolios.xxiii The mutual funds were then sold to the bank’s customers as safe investments, even as Santander rushed them off their books.xxiv Today, many of the Santander-backed bonds are worthless, and most of the Puerto Rican bond-focused mutual funds have experienced catastrophic declines.
Pirates of the Caribbean illuminates former Santander executive Carlos M. Garcia’s involvement in a revolving door relationship between Banco Santander Puerto Rico and the island’s Government Development Bank.xxv Once CEO and President of Banco Santander Puerto Rico, Garcia’s portfolio moved to the U.S. in 2011. Garcia oversaw Sovereign’s rebranding and strategic projects to develop Santander’s U.S. banking franchise. Until 2013, Garcia was senior executive and Chief of Staff to the CEO at Sovereign Bank. He now serves as a member of the Puerto Rican control board. The Board will determine the island’s fiscal fate and decide whether banks like Santander will be held to account for their role in the debt crisis.
ROBO-SIGNING IN FORECLOSURES
Santander began its acquisition of Sovereign Bank in 2009, and it was renamed Santander in late 2013. In 2013 in his position as Chief of Staff, Carlos M. Garcia said, “Santander had planned to change Sovereign’s name since buying it in 2009 but had to fix several problems first.”xxvi
One of those problems was Sovereign’s implication in the ‘robo-signing’ scandal, one of the biggest and most problematic scandals of the mortgage crisis. In 2011, an interagency report alleged that Sovereign was one of several banks that used deceptive foreclosure practices, including ‘robo-signing,’ or the practice of having foreclosure documents endorsed by someone without personal knowledge of the events disclosed in the documents.xxvii Sovereign entered into a Consent Order with the Office of Thrift Supervision (OTS) over this allegation in 2011.xxviii
As part of their settlements, Sovereign and other banks agreed to hire an independent consultants to review 2009-2010 foreclosures, but after several years it became apparent these consultants were close to the banks and had collected more than $1.5 billion dollars in fees, but had made little progress identifying wronged homeowners.xxix In 2015, Santander was placed under new restrictions and was barred from purchasing mortgage loans for servicing or outsourcing them without prior approval.xxx In 2016 Santander agreed to pay $3.4 million in penalties and its restrictions were finally lifted.xxxi

14
SANTANDER BANK N.A.
Santander Bank is currently chartered in Delaware, headquartered in Boston, Massachusetts and is a regional bank in the northeastern U.S. The bank is part of the larger bank holding company Santander Holdings USA, Inc. and had over $90 billion in assets as of September 2016.xxxii Santander also has a significant presence in Puerto Rico, where the Spanish bank began its U.S. operations in 1976 as Banco Santander Puerto Rico. All U.S. banking operations have just been recently merged under the holding company.xxxiii Scott Powell is the current CEO and President of the holding company. He was appointed to these positions in March and July 2015, respectively.xxxiv
Santander has expanded its U.S. banking franchise rapidly since 2009. Income generated just from fees— a huge source of profit other than interest for banks —increased from $575 million in 2009 to $1.2 billion in 2016.xxxv This growth is demonstrated in the chart below. The ‘Other’ category grew due servicing and leasing fees from Santander Consumer.xxxvi
METHODOLOGY
The analysis for this report covers all mortgage lending in ten metropolitan areas in the northeast U.S. for 2014 and 2015. Using banks’ Home Mortgage Lending Act (HMDA) data reported each year to regulators, we assessed home purchase loans for owner-occupied, single family, and manufactured housing with a first lien. The assessment does not include home improvement loans or loans for refinancing.
In 2014 and 2015, there were 713,939 home purchase loan applications in these ten markets, and almost 510,080 loan originations. At Santander, there were over 9,787 home purchase loan
$0
$200
$400
$600
$800
$1,000
$1,200
$1,400
2009 2010 2011 2012 2013 2014 2015 2016
Net Fee Income at Santander Holdings USA2009 - 2016 (millions)
Account Fees Debit and Credit Card Fees
Investment and Insurance Contingent Risk and Commitment Fees
Other
15
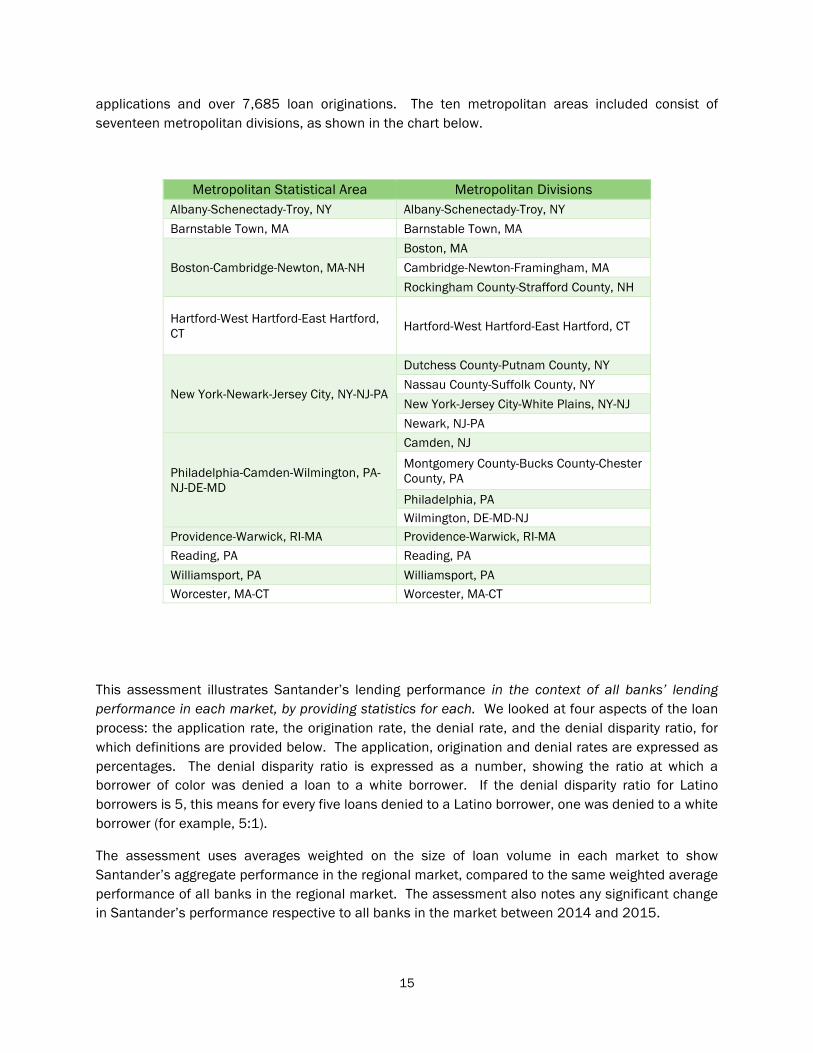
applications and over 7,685 loan originations. The ten metropolitan areas included consist of seventeen metropolitan divisions, as shown in the chart below.
Metropolitan Statistical Area Metropolitan Divisions Albany-Schenectady-Troy, NY Albany-Schenectady-Troy, NY Barnstable Town, MA Barnstable Town, MA
Boston-Cambridge-Newton, MA-NH Boston, MA Cambridge-Newton-Framingham, MA Rockingham County-Strafford County, NH
Hartford-West Hartford-East Hartford, CT Hartford-West Hartford-East Hartford, CT
New York-Newark-Jersey City, NY-NJ-PA
Dutchess County-Putnam County, NY Nassau County-Suffolk County, NY New York-Jersey City-White Plains, NY-NJ Newark, NJ-PA
Philadelphia-Camden-Wilmington, PA-NJ-DE-MD
Camden, NJ Montgomery County-Bucks County-Chester County, PA
Philadelphia, PA Wilmington, DE-MD-NJ
Providence-Warwick, RI-MA Providence-Warwick, RI-MA Reading, PA Reading, PA Williamsport, PA Williamsport, PA Worcester, MA-CT Worcester, MA-CT
This assessment illustrates Santander’s lending performance in the context of all banks’ lending performance in each market, by providing statistics for each. We looked at four aspects of the loan process: the application rate, the origination rate, the denial rate, and the denial disparity ratio, for which definitions are provided below. The application, origination and denial rates are expressed as percentages. The denial disparity ratio is expressed as a number, showing the ratio at which a borrower of color was denied a loan to a white borrower. If the denial disparity ratio for Latino borrowers is 5, this means for every five loans denied to a Latino borrower, one was denied to a white borrower (for example, 5:1).
The assessment uses averages weighted on the size of loan volume in each market to show Santander’s aggregate performance in the regional market, compared to the same weighted average performance of all banks in the regional market. The assessment also notes any significant change in Santander’s performance respective to all banks in the market between 2014 and 2015.

16
Definitions of terms used in analysis:
v Application Rate: the loan volume borrowers apply for in the market. Lower percentages indicate declining performance by a bank.
v Origination Rate: the loan volume banks originate to borrowers compared to the loan volume borrowers apply for in the market. Lower percentages indicate negative performance by a bank.
v Denial Rate: the loan volume banks deny to borrowers compared to the loan volume at banks borrowers apply for in the market. Higher percentages indicate declining performance of a bank.
v Denial Disparity Ratio: the rate at which a bank denies borrowers of color loans, compared to rate at which a bank denies white borrowers loans. The higher the ratio, the poorer performance of a bank.
WHO IS THE COMMITTEE FOR BETTER BANKS?
The Committee for Better Banks is a coalition of bank workers, community and consumer advocacy groups, and labor organizations coming together to improve conditions in the bank industry. We work for just wages, career paths and job security for front-line bank workers. Organizations involved include: Make the Road New York, New York Communities for Change (NYCC), Minnesotans for Fair Economy, Missourians Organizing for Reform and Empowerment, Jobs with Justice and local affiliates, the Communications Workers of America union (CWA) and UNI Global Union.

17
APPENDIX: STATISTICAL DATA FROM TEN METROPOLITAN STATISTICAL AREAS
Note: The New York-Newark-Jersey City, NY-NJ-PA, Philadelphia-Camden-Wilmington, PA-NJ-DE-MD, and Boston-Cambridge-Newton, MA-NH metropolitan statistical areas consist of eleven metropolitan divisions. For these MSAs, we provide weighted averages controlling for loan volume.
Albany-Schenectady-Troy, NY
Santander
All Banks in Market
Application Rate 2014 2015 2014 2015
Loan Number 114 172 9,983 10,975
Latinos 0.9% 1.7% 2.4% 2.2%
African Americans 1.2% 2.7% 3.1%
Asian 15.8% 20.3% 4.8% 4.8%
Women 42.1% 69.2% 32.5% 32.5%
Persons of Color 18.4% 23.8% 10.5% 10.3%
Communities of Color 1.2% 3.3% 3.0%
Low-Income Borrower 15.8% 22.7% 38.6% 41.1%
Low-Income Communities 3.5% 5.2% 12.2% 11.4%
Origination Rate 2014 2015 2014 2015
Loan Number 100 144 7,350 8,197
Latinos 100.0% 100.0% 69.4% 75.3%
African Americans 100.0% 67.5% 73.7%
Asian 83.3% 77.1% 75.5% 72.9%
Women 93.8% 82.4% 73.8% 75.0%
Persons of Color 81.0% 80.5% 71.0% 72.0%
Communities of Color 100.0% 60.9% 63.9%
Low-Income Borrower 66.7% 82.1% 66.8% 69.6%
Low-Income Communities 50.0% 55.6% 65.5% 66.7%
Denial Rate 2014 2015 2014 2015
Loan Number 12 11 1,027 1,068
Latinos 17.4% 10.0%
African Americans 18.1% 13.0%
Asian 16.7% 8.6% 11.7% 11.4%
Women 6.3% 8.4% 11.2% 9.9%
Persons of Color 19.0% 7.3% 15.5% 12.9%
Communities of Color 24.0% 19.4%
Low-Income Borrower 27.8% 10.3% 16.1% 14.7%

18
Low-Income Communities 50.0% 33.3% 16.6% 16.0%
Denial Disparity Ratio 2014 2015 2014 2015
Latinos 1.4 1.2
African Americans 1.4 1.5
Asian 1.3 1.4 0.9 1.3
Women 0.5 1.4 0.9 1.1
Persons of Color 1.4 1.2 1.2 1.5
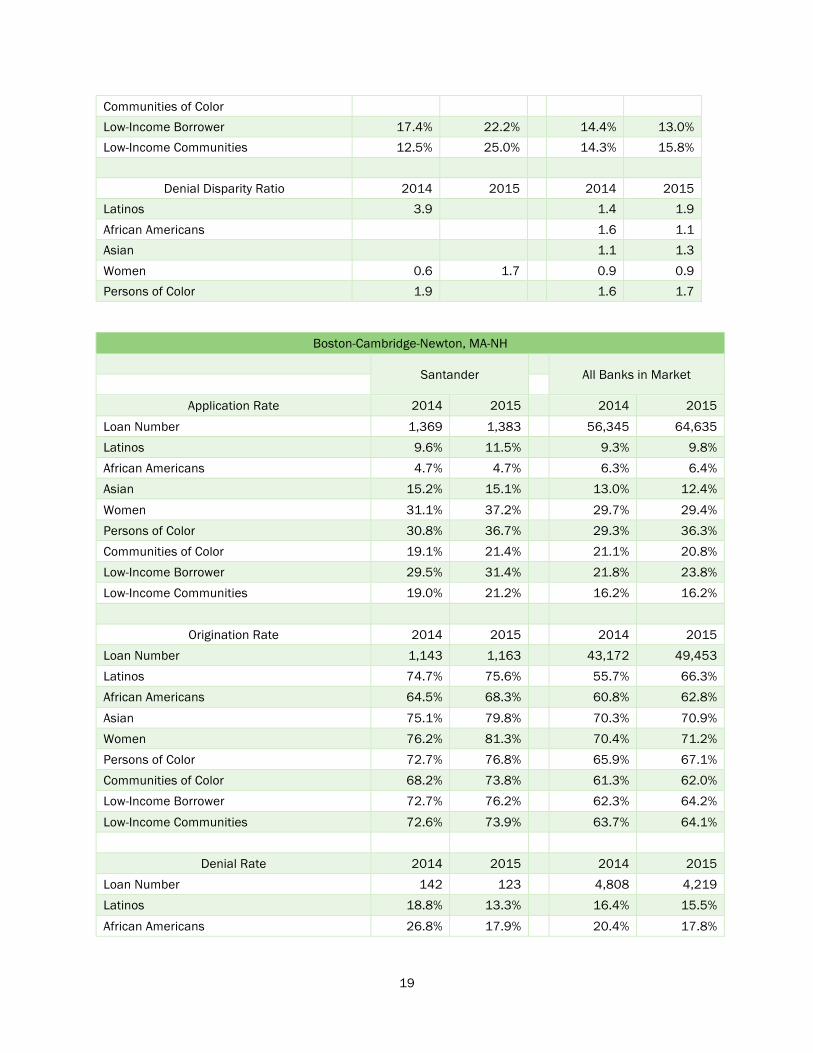
Barnstable Town, MA
Santander
All Banks in Market
Application Rate 2014 2015 2014 2015 Loan Number 67 76 2,499 2,868 Latinos 3.0% 2.7% 3.5% African Americans 1.5% 1.3% 2.2% 2.1% Asian 1.5% 1.5% 0.8% Women 38.8% 38.2% 31.1% 33.1% Persons of Color 6.0% 1.3% 7.0% 7.1% Communities of Color Low-Income Borrower 34.3% 35.5% 29.7% 35.4% Low-Income Communities 11.9% 5.3% 12.0% 11.2%
Origination Rate 2014 2015 2014 2015
Loan Number 54 67 1,931 2,218 Latinos 50.0% 77.6% 68.7% African Americans 100.0% 100.0% 64.8% 80.3% Asian 100.0% 78.4% 72.7% Women 80.8% 86.2% 76.9% 76.6% Persons of Color 75.0% 100.0% 72.0% 71.6% Communities of Color Low-Income Borrower 73.9% 77.8% 71.7% 75.2% Low-Income Communities 87.5% 75.0% 73.7% 71.1%
Denial Rate 2014 2015 2014 2015
Loan Number 9 8 245 264 Latinos 50.0% 16.4% 20.2% African Americans 18.5% 11.5% Asian 13.5% 13.6% Women 7.7% 13.8% 11.0% 9.4% Persons of Color 25.0% 18.3% 17.6%
19
Communities of Color Low-Income Borrower 17.4% 22.2% 14.4% 13.0% Low-Income Communities 12.5% 25.0% 14.3% 15.8%
Denial Disparity Ratio 2014 2015 2014 2015
Latinos 3.9 1.4 1.9 African Americans 1.6 1.1 Asian 1.1 1.3 Women 0.6 1.7 0.9 0.9 Persons of Color 1.9 1.6 1.7
Boston-Cambridge-Newton, MA-NH
Santander
All Banks in Market
Application Rate 2014 2015 2014 2015
Loan Number 1,369 1,383 56,345 64,635 Latinos 9.6% 11.5% 9.3% 9.8% African Americans 4.7% 4.7% 6.3% 6.4% Asian 15.2% 15.1% 13.0% 12.4%
Women 31.1% 37.2% 29.7% 29.4% Persons of Color 30.8% 36.7% 29.3% 36.3% Communities of Color 19.1% 21.4% 21.1% 20.8% Low-Income Borrower 29.5% 31.4% 21.8% 23.8% Low-Income Communities 19.0% 21.2% 16.2% 16.2%
Origination Rate 2014 2015 2014 2015
Loan Number 1,143 1,163 43,172 49,453 Latinos 74.7% 75.6% 55.7% 66.3% African Americans 64.5% 68.3% 60.8% 62.8%
Asian 75.1% 79.8% 70.3% 70.9% Women 76.2% 81.3% 70.4% 71.2% Persons of Color 72.7% 76.8% 65.9% 67.1% Communities of Color 68.2% 73.8% 61.3% 62.0% Low-Income Borrower 72.7% 76.2% 62.3% 64.2%
Low-Income Communities 72.6% 73.9% 63.7% 64.1%
Denial Rate 2014 2015 2014 2015 Loan Number 142 123 4,808 4,219 Latinos 18.8% 13.3% 16.4% 15.5%
African Americans 26.8% 17.9% 20.4% 17.8%

20
Asian 23.5% 11.5% 13.2% 11.8% Women 19.5% 8.9% 13.7% 12.2% Persons of Color 22.8% 13.0% 16.6% 14.4%
Communities of Color 23.6% 15.2% 16.3% 16.3% Low-Income Borrower 24.1% 15.5% 21.5% 18.6% Low-Income Communities 22.8% 15.5% 18.4% 16.1%
Denial Disparity Ratio 2014 2015 2014 2015
Latinos 1.1 1.5 1.5 1.4 African Americans 1.7 2.3 1.9 1.9 Asian 1.4 1.3 1.2 1.2 Women 1.2 1.1 1.3 1.3
Persons of Color 1.4 1.5 1.5 1.5
Hartford-West Hartford-East Hartford, CT
Santander
All Banks in Market
Application Rate 2014 2015 2014 2015
Loan Number 119 103 12,976 13,575 Latinos 12.6% 20.4% 7.0% 7.4% African Americans 7.6% 11.7% 6.2% 6.9% Asian 7.6% 3.9% 5.1% 5.4% Women 36.1% 47.6% 33.3% 34.9%
Persons of Color 28.6% 36.9% 18.8% 20.3% Communities of Color 16.0% 26.2% 10.3% 9.4% Low-Income Borrower 51.3% 67.0% 41.8% 42.7% Low-Income Communities 18.5% 28.2% 13.9% 13.0%
Origination Rate 2014 2015 2014 2015
Loan Number 63 68 9,619 10,149 Latinos 66.7% 47.6% 69.1% 69.2% African Americans 44.4% 50.0% 68.1% 66.1%
Asian 77.8% 100.0% 70.3% 70.0% Women 69.8% 55.1% 74.0% 74.2% Persons of Color 61.8% 55.3% 68.6% 68.3% Communities of Color 57.9% 40.7% 65.1% 65.0% Low-Income Borrower 70.5% 53.6% 70.1% 71.5%
Low-Income Communities 59.1% 37.9% 67.9% 66.8%
Denial Rate 2014 2015 2014 2015
21
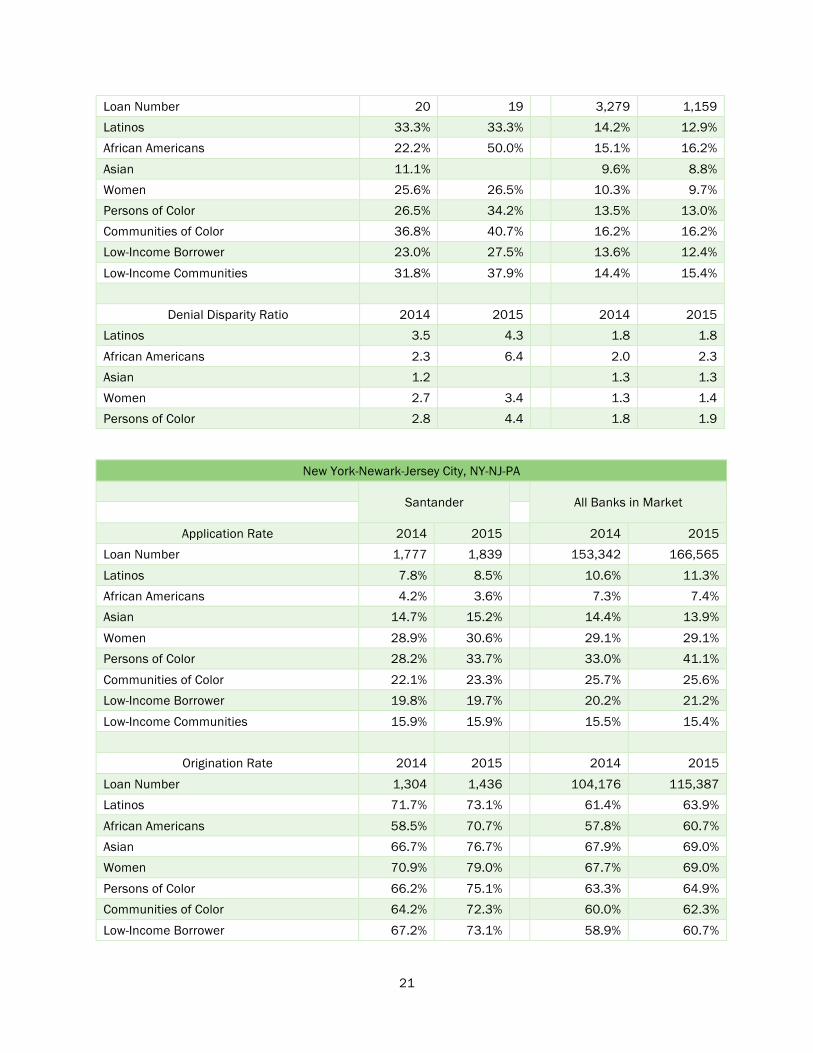
Loan Number 20 19 3,279 1,159 Latinos 33.3% 33.3% 14.2% 12.9% African Americans 22.2% 50.0% 15.1% 16.2%
Asian 11.1% 9.6% 8.8% Women 25.6% 26.5% 10.3% 9.7% Persons of Color 26.5% 34.2% 13.5% 13.0% Communities of Color 36.8% 40.7% 16.2% 16.2% Low-Income Borrower 23.0% 27.5% 13.6% 12.4%
Low-Income Communities 31.8% 37.9% 14.4% 15.4%
Denial Disparity Ratio 2014 2015 2014 2015 Latinos 3.5 4.3 1.8 1.8
African Americans 2.3 6.4 2.0 2.3 Asian 1.2 1.3 1.3 Women 2.7 3.4 1.3 1.4 Persons of Color 2.8 4.4 1.8 1.9
New York-Newark-Jersey City, NY-NJ-PA
Santander
All Banks in Market
Application Rate 2014 2015 2014 2015 Loan Number 1,777 1,839 153,342 166,565
Latinos 7.8% 8.5% 10.6% 11.3% African Americans 4.2% 3.6% 7.3% 7.4% Asian 14.7% 15.2% 14.4% 13.9%
Women 28.9% 30.6% 29.1% 29.1% Persons of Color 28.2% 33.7% 33.0% 41.1%
Communities of Color 22.1% 23.3% 25.7% 25.6% Low-Income Borrower 19.8% 19.7% 20.2% 21.2%
Low-Income Communities 15.9% 15.9% 15.5% 15.4%
Origination Rate 2014 2015 2014 2015
Loan Number 1,304 1,436 104,176 115,387 Latinos 71.7% 73.1% 61.4% 63.9%
African Americans 58.5% 70.7% 57.8% 60.7% Asian 66.7% 76.7% 67.9% 69.0% Women 70.9% 79.0% 67.7% 69.0%
Persons of Color 66.2% 75.1% 63.3% 64.9% Communities of Color 64.2% 72.3% 60.0% 62.3%
Low-Income Borrower 67.2% 73.1% 58.9% 60.7%
22
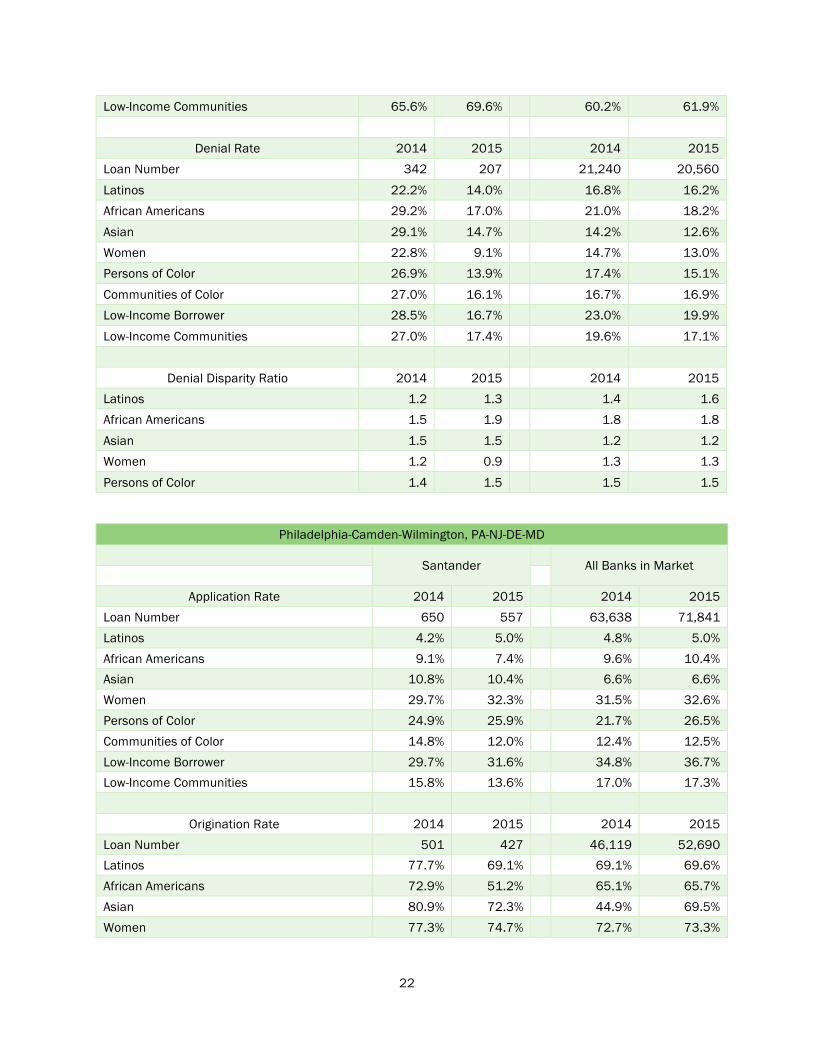
Low-Income Communities 65.6% 69.6% 60.2% 61.9%
Denial Rate 2014 2015 2014 2015
Loan Number 342 207 21,240 20,560
Latinos 22.2% 14.0% 16.8% 16.2% African Americans 29.2% 17.0% 21.0% 18.2%
Asian 29.1% 14.7% 14.2% 12.6% Women 22.8% 9.1% 14.7% 13.0% Persons of Color 26.9% 13.9% 17.4% 15.1%
Communities of Color 27.0% 16.1% 16.7% 16.9% Low-Income Borrower 28.5% 16.7% 23.0% 19.9%
Low-Income Communities 27.0% 17.4% 19.6% 17.1%
Denial Disparity Ratio 2014 2015 2014 2015 Latinos 1.2 1.3 1.4 1.6 African Americans 1.5 1.9 1.8 1.8
Asian 1.5 1.5 1.2 1.2 Women 1.2 0.9 1.3 1.3
Persons of Color 1.4 1.5 1.5 1.5
Philadelphia-Camden-Wilmington, PA-NJ-DE-MD
Santander
All Banks in Market
Application Rate 2014 2015 2014 2015 Loan Number 650 557 63,638 71,841 Latinos 4.2% 5.0% 4.8% 5.0% African Americans 9.1% 7.4% 9.6% 10.4% Asian 10.8% 10.4% 6.6% 6.6% Women 29.7% 32.3% 31.5% 32.6% Persons of Color 24.9% 25.9% 21.7% 26.5% Communities of Color 14.8% 12.0% 12.4% 12.5% Low-Income Borrower 29.7% 31.6% 34.8% 36.7% Low-Income Communities 15.8% 13.6% 17.0% 17.3%
Origination Rate 2014 2015 2014 2015
Loan Number 501 427 46,119 52,690 Latinos 77.7% 69.1% 69.1% 69.6% African Americans 72.9% 51.2% 65.1% 65.7% Asian 80.9% 72.3% 44.9% 69.5% Women 77.3% 74.7% 72.7% 73.3%

23
Persons of Color 73.0% 69.9% 66.8% 67.6% Communities of Color 85.3% 79.2% 65.7% 67.1% Low-Income Borrower 74.4% 69.1% 69.2% 69.7% Low-Income Communities 73.1% 74.8% 69.5% 70.1%
Denial Rate 2014 2015 2014 2015
Loan Number 64 73 6,429 6,658 Latinos 15.3% 18.4% 24.2% 12.8% African Americans 26.1% 41.7% 16.9% 15.8% Asian 12.4% 19.2% 19.4% 10.2% Women 14.1% 21.3% 10.7% 9.9% Persons of Color 21.4% 24.8% 15.1% 13.1% Communities of Color 24.3% 20.7% 16.9% 14.5% Low-Income Borrower 23.2% 24.0% 15.0% 13.6% Low-Income Communities 26.5% 27.8% 14.5% 13.1%
Denial Disparity Ratio 2014 2015 2014 2015
Latinos 0.9 1.9 1.9 1.8 African Americans 1.6 3.7 1.6 2.2 Asian 1.0 1.6 1.4 1.4 Women 0.9 1.7 1.0 1.4 Persons of Color 2.2 2.1 1.7 1.8
Providence-Warwick, RI-MA
Santander
All Banks in Market
Application Rate 2014 2015 2014 2015 Loan Number 349 490 16,324 18,707
Latinos 12.6% 15.5% 7.1% 7.6% African Americans 4.6% 4.9% 3.2% 3.4% Asian 4.0% 3.5% 2.2% 2.2% Women 45.8% 33.1% 31.5% 32.2% Persons of Color 21.8% 27.6% 13.0% 20.8%
Communities of Color 14.3% 12.7% 6.2% 6.0% Low-Income Borrower 53.3% 43.5% 34.8% 36.0% Low-Income Communities 24.1% 22.4% 17.2% 17.3%
Origination Rate 2014 2015 2014 2015
Loan Number 274 390 12,115 14,180 Latinos 56.8% 68.4% 63.6% 69.0% African Americans 62.5% 70.8% 62.7% 70.5%

24
Asian 71.4% 64.7% 75.1% 72.1% Women 72.5% 77.8% 73.9% 75.4% Persons of Color 60.5% 68.1% 65.5% 68.7%
Communities of Color 56.0% 69.4% 60.2% 67.2% Low-Income Borrower 70.4% 72.3% 68.4% 71.3% Low-Income Communities 60.7% 70.9% 67.7% 72.3%
Denial Rate 2014 2015 2014 2015
Loan Number 76 58 1,809 1,765 Latinos 34.1% 21.1% 18.3% 14.7% African Americans 31.3% 25.0% 20.8% 17.5% Asian 14.3% 17.6% 7.6% 10.8%
Women 21.9% 13.6% 10.9% 10.2% Persons of Color 30.3% 19.3% 16.9% 14.4% Communities of Color 34.0% 21.0% 19.2% 15.5% Low-Income Borrower 22.0% 19.2% 15.9% 13.9% Low-Income Communities 31.0% 20.0% 16.0% 13.6%
Denial Disparity Ratio 2014 2015 2014 2015
Latinos 2.3 2.3 1.9 1.8 African Americans 2.1 2.8 2.1 2.2 Asian 1.0 2.0 0.8 1.3
Women 1.5 1.5 1.1 1.3 Persons of Color 2.0 2.1 1.7 1.8
Reading, PA
Santander
All Banks in Market
Application Rate 2014 2015 2014 2015 Loan Number 44 99 4,374 4,921 Latinos 2.3% 21.2% 12.4% 13.1% African Americans 4.5% 2.0% 1.8%
Asian 36.4% 1.0% 1.3% 0.9% Women 6.8% 27.3% 28.0% 29.7% Persons of Color 43.2% 21.2% 5.1% 16.1% Communities of Color 6.8% 11.1% 15.9% 6.2% Low-Income Borrower 11.4% 42.4% 7.6% 42.7%
Low-Income Communities 15.9% 13.1% 42.5% 8.2%
Origination Rate 2014 2015 2014 2015

25
Loan Number 24 72 3,209 3,739 Latinos 100.0% 61.9% 67.7% 68.6% African Americans 100.0% 67.8% 68.5%
Asian 12.5% 73.2% 73.3% Women 100.0% 74.1% 73.8% 74.6% Persons of Color 26.3% 57.1% 68.2% 68.5% Communities of Color 54.5% 63.0% 65.1% Low-Income Borrower 40.0% 73.8% 67.8% 72.4%
Low-Income Communities 14.3% 15.4% 64.6% 67.4%
Denial Rate 2014 2015 2014 2015 Loan Number 18 22 518 515
Latinos 28.6% 19.8% 16.8% African Americans 21.8% 13.5% Asian 75.0% 100.0% 14.3% 15.6% Women 18.5% 13.0% 12.3% Persons of Color 63.2% 33.3% 19.4% 16.6%
Communities of Color 100.0% 27.3% 21.4% 18.9% Low-Income Borrower 60.0% 19.0% 15.9% 14.3% Low-Income Communities 85.7% 7.7% 19.7% 17.2%
Denial Disparity Ratio 2014 2015 2014 2015
Latinos 1.5 2.0 1.9 African Americans 2.2 1.5 Asian 2.9 5.1 1.5 1.7 Women 1.0 1.3 1.4 Persons of Color 2.4 1.7 2.0 1.9
Williamsport, PA
Santander
All Banks in Market
Application Rate 2014 2015 2014 2015 Loan Number 52 78 1,080 1,169 Latinos 3.8% 1.0% 0.7% African Americans 1.0% 0.8% Asian 3.8% 2.6% 1.0% 0.3% Women 30.8% 30.8% 24.7% 26.3% Persons of Color 7.7% 2.6% 3.6% 2.1% Communities of Color Low-Income Borrower 25.0% 34.6% 31.5% 39.3%

26
Low-Income Communities 5.1% 3.6% 2.9%
Origination Rate 2014 2015 2014 2015 Loan Number 43 67 863 948 Latinos 100.0% 70.0% 62.5% African Americans 100.0% 68.9% 77.8% Asian 28.6% 100.0% 72.4% 100.0% Women 100.0% 87.5% 75.1% 81.2% Persons of Color 50.0% 100.0% 69.3% 70.8% Communities of Color 70.8% Low-Income Borrower 66.7% 88.9% 71.9% 78.0% Low-Income Communities 33.3% 75.0% 69.4% 73.5%
Denial Rate 2014 2015 2014 2015
Loan Number 3 6 102 2,218 Latinos 100.0% 18.2% 25.0% African Americans 9.1% 11.1% Asian Women 12.5% 8.3% 9.7% 11.0% Persons of Color 50.0% 7.7% 20.8% Communities of Color Low-Income Borrower 15.4% 11.1% 14.4% 12.2% Low-Income Communities 25.0% 7.7% 17.6%
Denial Disparity Ratio 2014 2015 2014 2015
Latinos 16.0 2.0 2.9 African Americans 1.0 1.3 Asian Women 2.0 3.2 1.1 1.3 Persons of Color 0.0 0.9 2.4
Worcester, MA-CT
Santander
All Banks in Market
Application Rate 2014 2015 2014 2015 Loan Number 307 142 23,281 12,840 Latinos 4.6% 4.9% 4.7% 6.9% African Americans 1.6% 3.5% 2.1% 3.0% Asian 10.4% 8.5% 5.8% Women 28.7% 29.6% 30.1% 32.1% Persons of Color 16.6% 16.9% 11.7% 16.2%

27
Communities of Color 2.6% 3.5% 1.4% 1.3% Low-Income Borrower 38.4% 40.8% 36.9% 40.4% Low-Income Communities 14.3% 14.8% 14.8% 15.3%
Origination Rate 2014 2015 2014 2015
Loan Number 234 111 15,013 9,552 Latinos 64.3% 42.9% 58.9% 71.5% African Americans 100.0% 80.0% 54.6% 69.2% Asian 71.9% 91.7% 50.0% 72.3% Women 77.3% 71.4% 64.8% 74.3% Persons of Color 72.5% 75.0% 60.2% 71.0% Communities of Color 50.0% 60.0% 44.5% 61.8% Low-Income Borrower 67.8% 70.7% 58.2% 70.7% Low-Income Communities 56.8% 61.9% 58.6% 70.5%
Denial Rate 2014 2015 2014 2015
Loan Number 54 15 3,934 1,336 Latinos 28.6% 42.9% 23.2% 14.3% African Americans 25.6% 14.9% Asian 25.0% 8.3% 9.9% Women 15.9% 14.3% 16.9% 10.6% Persons of Color 23.5% 54.2% 21.2% 13.1% Communities of Color 50.0% 40.0% 32.1% 19.1% Low-Income Borrower 22.9% 17.2% 23.0% 14.2% Low-Income Communities 36.4% 19.0% 23.0% 14.7%
Denial Disparity Ratio 2014 2015 2014 2015
Latinos 1.8 5.1 1.5 1.6 African Americans 1.7 1.6 Asian 1.6 1.0 1.1 Women 1.0 1.7 1.1 1.2 Persons of Color 1.5 6.5 1.4 1.4
i In this report, we use ‘communities of color’ to describe “majority-minority census tracts” and ‘low-income communities’ to describe the commonly-used “low and moderate-income (LMI)” census tracts. The Census Bureau divides areas with close social and economic ties into Metropolitan Statistical Areas (MSAs), some of which are divided into Metropolitan Divisions (MDs). It further divides these areas into census tracts, which are roughly equivalent to the size of a neighborhood and consist of about 2,500 to 8,000 people. We define ‘communities of color’ as census tracts where the population is over 50% minority. We define ‘low-income
28
communities’ as a tract with median income less than 50% (low) or 80% (moderate) of median family income in the MD or MSA. See the MSA list from 2010 Census here and definitions on the FDIC website. ii See Ben Bernanke speech at Operation HOPE Global Financial Dignity Summit, Challenges in Housing and Mortgage Markets, November 15, 2012. Bernanke specifically points to redlining and pricing discrimination as the two key obstacles to economic recovery in the housing market. See also “Redlining is Alive and Well—and Evolving,” Brentin Mock, The Atlantic CityLab, September 28, 2015. See Hudson City Savings Bank Consent Order with CFPB and “HUD: Associated Bank ‘redlining’ settlement is largest ever,” Housing Wire, May 27, 2015. iii Santander Bank, NA, is part of Banco Santander, SA, a global bank based in Spain. iv See Santander US January to December 2016. v This figure is net mortgage banking income 2010-2015. See Santander’s 10-K reports filed with the Securities and Exchange Commission from 2010-2015. The fee income is explained in more detail in the report and is income from all Santander’s U.S. operations. vi “Providence drops suit vs. Santander over lending,” Jennifer McDermott, Associated Press, November 7, 2014. “CFPB Says Santander Violated Fair Lending Laws,” Auto Dealer, August 11, 2015. See “OCC Ends Consent Order on U.S. Bank, Santander.” vii The ten MSAs we included are then divided up into seventeen MDs. See the chart on page 3. viii To calculate aggregate rates across the market, we calculated the denial rates averaged and weighted according to loan volume. ix To calculate aggregate rates across the market, we calculated the denial disparity ratios averaged and weighted according to loan volume. x See Philadelphia and Delaware County American Community Survey 2015 at the Census Bureau. For these statistics we use “ACS Demographic and Housing Estimates,” and “Poverty status in the past 12 months of families, 2011-2015 American Community Survey 5-Year Estimates.” xi See Worcester and Windham County American Community Survey 2015 at the Census Bureau. For these statistics we use “ACS Demographic and Housing Estimates,” and “Poverty status in the past 12 months of families, 2011-2015 American Community Survey 5-Year Estimates.” xii See Hartford, Tolland and Middlesex County American Community Survey 2015 at the Census Bureau. For these statistics we use “ACS Demographic and Housing Estimates,” and “Poverty status in the past 12 months of families, 2011-2015 American Community Survey 5-Year Estimates.” xiii See Camden, Gloucester and Burlington County American Community Survey 2015 at the Census Bureau. For these statistics we use “ACS Demographic and Housing Estimates,” and “Poverty status in the past 12 months of families, 2011-2015 American Community Survey 5-Year Estimates.” xiv See footnote 4 and for example, “Predatory Lending: Redlining in Reverse,” Gregory Squires, National Housing Institute, January/February 2005, and “Justice Dept. Fights Bias in Lending,” Charlie Savage, The New York Times, January 13, 2010. xv See Pirates of the Caribbean: How Santander Exacerbated a Fiscal Catastrophe for the Puerto Rican people. xvi See “Providence sues Santander Bank over lending practices,” Boston Globe, May 29, 2014, Deirdre Fernandes, and “Providence drops suit vs. Santander over lending,” Jennifer McDermott, Associated Press, November 7, 2014. xvii “CFPB Says Santander Violated Fair Lending Laws,” Auto Dealer, August 11, 2015. xviii “Santander Consumer USA Receives DOJ Subpoena,” Auto Dealer, Brittany Marie Swanson, August 7, 2014. xix “Risky auto loans attract investors as consumers pay the price,” Post and Courier, David Wren, July 17, 2015. See also “New York City Agency Subpoenas 2 Santander Auto Lenders,” New York Times, Rachel Abrams, November 14, 2014. xx “Subprime Auto-Loan Loss Expectations Rise Results could spell trouble for the auto market and some lenders,” Wall Street Journal, AnneMaria Andriotis, July 12, 2016. xxi “Semiannual Risk Perspective From the National Risk Committee,” OCC, Spring 2016. “Fitch: US Auto ABS Metrics Solid, Used Vehicle Values Will Fall,” Business Wire, August 4, 2016. “Fitch: Reprieve for U.S. Subprime Auto Delinquencies Likely Short-Lived,” FitchRatings, April 14, 2016 “An Avoidable Crash in Car Loans,” New York Times, the Editorial Board, December 21, 2016. “Just Released: Subprime Auto Debt Grows Despite Rising Delinquencies,” Federal Reserve Bank of NY, November 30, 2016 xxii See Pirates of the Caribbean: How Santander Exacerbated a Fiscal Catastrophe for the Puerto Rican people. xxiii See First Puerto Rico Family of Mutual Fund’s annual reports for information about Puerto Rican bond holdings and values. xxiv See FINRA Sanctions Santander $64 Million for Puerto Rican Bond Supervisory Failures. xxv See Pirates of the Caribbean: How Santander Exacerbated a Fiscal Catastrophe for the Puerto Rican people.

29
xxvi See “Sovereign Bank Starts Over as Santander,” American Banker, Bonnie McGeer, August 26, 2013. See also Carlos M. Garcia’s resume, which states he was responsible for strategic projects to develop the U.S. banking franchise including rebranding to Santander from Sovereign in 2013. xxvii See “Interagency Review of Foreclosure Policies and Practices,” the Federal Reserve System, the Office of Comptroller and Currency, and the Office of Thrift Supervision, April 2011. xxviii See Consent Order #NE-11-17, Office of Thrift Supervision, in the matter of Sovereign Bank. xxix See ”Feds Replace Flawed Foreclosure Review With Vague $8.5 Billion Settlement,” ProPublica, January 8, 2013, Paul Kiel. See also “Banks That Failed to Fix Mortgage Services Face Restrictions,” the New York Times, Nathaniel Popper, June 17, 2015, and “Bank Deal Ends Flawed Reviews of Foreclosures,” the New York Times, Jessica Silver-Greenberg, January 10, 2013. xxx See Consent Order #2015-065, Office of the Comptroller of the Currency, in the matter of Santander Bank, N.A. xxxi See “OCC Ends Consent Order on U.S. Bank, Santander.” xxxii FDIC Call Report retrieved January 21, 2017. xxxiii Fixed Income Investor Presentation, Third Quarter 2016, Santander Holdings USA, Inc. xxxiv See 2016 SHUSA 10-K report. xxxv See Sovereign 4Q 2010 Results, Santander US 4Q 2012 Results, Santander USA 2014, Santander US January to December 2016. xxxvi Santander US: January to December 2015.