
Demystifying the Newest Equity Long-Short Strategies Making the Unconventional Conventional February...
24
Demystifying the Newest Equity Long-Short Strategies Making the Unconventional Conventional February 2007
-
Upload
hollie-kennedy -
Category
Documents
-
view
214 -
download
0
Transcript of Demystifying the Newest Equity Long-Short Strategies Making the Unconventional Conventional February...
Demystifying the Newest Equity Long-Short StrategiesMaking the Unconventional Conventional
February 2007

2
Outline
The case for higher active risk
Key questions about 130/30 strategies:
How do 130/30 strategies work?
How much shorting is appropriate?
What are the risks associated with shorting?
Why now?
What is the capacity of 130/30 strategies?
Who should invest?
Summary
Appendix

3
Active returns are uncorrelated with the market
For illustrative purposes only. The information above does not represent any GSAM fund or product. Source: GSAM
10%
11%
12%
13%
14%
15%
16%
17%
18%
0% 2% 4% 6% 8% 10% 12%
Active risk
To
tal
ris
k
Index fund
Even aggressive levels of active risk have a modest impact on total risk

4
Active risk: Cross sectional mean rolling 12-month tracking error
Source: CRSP Database (Center for Research in Security Prices)The information above does not represent any GSAM fund or product. The universe consists of US registered mutual funds, excluding index funds, in the US Large Cap, Mid Cap, Small Cap and Global Large Cap spaces.
US Large, Mid, Small and Global Large Cap excluding Index Funds (Weighted by Assets)
0%
2%
4%
6%
8%
10%
12%
14%
16%
1985 1989 1993 1997 2001 2005
Technology stock bubble

How do 130/30 strategies work?

6
The no-shorting constraint prevents managers from fully implementing their investment views
Active managers generate expected excess returns by overweighting and underweighting stocks relative to a benchmark
1%
Negative view
Target: -3% deviation
Realised:-1% deviation
0% -1%
Benchmarkweight
Portfolioweight
-2%
1% -3%
Benchmarkweight
Portfolioweight
Negative view
Target: -3% deviation
Realised:-3% deviation
For illustrative purposes only. The information above does not represent any GSAM fund or product.
Long-only manager Manager allowed to take short positions
7
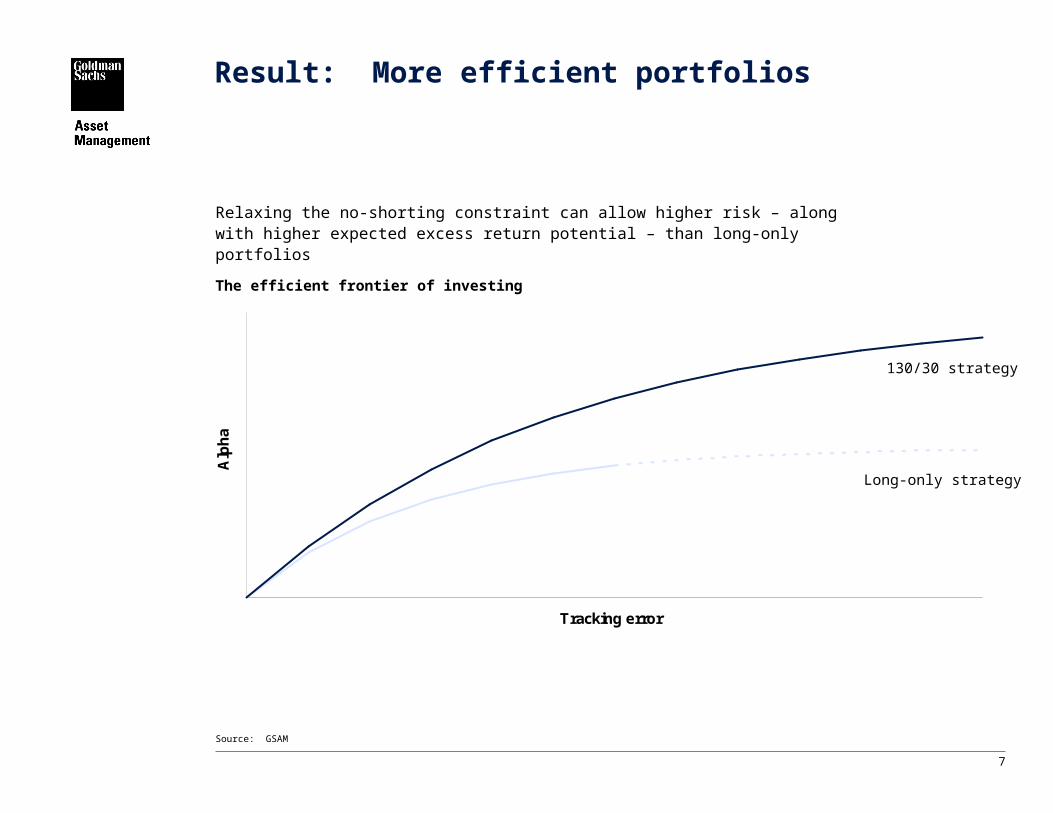
Result: More efficient portfolios
Relaxing the no-shorting constraint can allow higher risk – along with higher expected excess return potential – than long-only portfolios
Source: GSAM
The efficient frontier of investing
130/30 strategy
Tracking error
Alp
ha
Long-only strategy

8
Putting investors’ capital to work
Source: GSAM
130% long / 30% short target beta = 1
$100
$30
$130
$30$30
Buy long $100 with cash Sell short $30 Buy long $30 (financed byproceeds from short sales)
Stock portfolio with net valueof $100

How much shorting is appropriate?

10
Optimal amount of leverage varies
Determinants of the amount of shorting needed to achieve an attractive information ratio:
Target tracking error
Higher tracking error requires more shorting
Market risk environment
Higher market risk requires less shorting
Manager’s return generating process
Negative views and small-cap focus require more shorting

11
Declining benefits of leverage
The benefits of relaxing the no-shorting constraint decline as the amount of shorting increases
Source: GSAMInformation ratio measures the excess return (over the benchmark) per unit of tracking error.
Tracking error
Alp
ha
Long-only strategy
120/20 Strategy
140/40 Strategy
Constant information ratio

What are the risks associated with shorting?

13
Common concerns about shorting
Possibility of unlimited (i.e., very large) losses
Diversified positions (many small shorts)
Avoid expensive or hard-to-borrow stocks
Active weights determine active risk, not shorts
Upward trend in equity markets
Full market exposure (proceeds of shorts are invested in additional longs)
Leverage
Greater active risk, but similar market risk
Two stocks with different benchmark weights – one short and one long – but identical active weights
Active weight
-3%
Active weight
-3%

Why are 130/30 strategies attracting somuch attention now?

15
Recent events help explain the popularity of 130/30 strategies
Investors want more alpha
Low market returns following the internet bubble
Active risk has declined
Realized tracking error (and active returns) are low by historical standards
Less constrained strategies are gaining acceptance
Market-neutral and equity long-short hedge funds
What is the capacity of 130/30 strategies?

17
Global equities lending market
Sources: GSAM, the Risk Management Association
$0.0
$0.5
$1.0
$1.5
$2.0
$2.5
$3.0
$3.5
$4.0
$4.5
$5.0
1998 1999 2000 2001 2002 2003 2004 2005 2006
Len
dab
le a
sset
s (t
rilli
on
s)
$0
$100
$200
$300
$400
$500
$600
On
loan
(billio
ns)
On loan(right axis)
Lendable assets(left axis)

What types of investors are likely to find 130/30 strategies appealing?
19
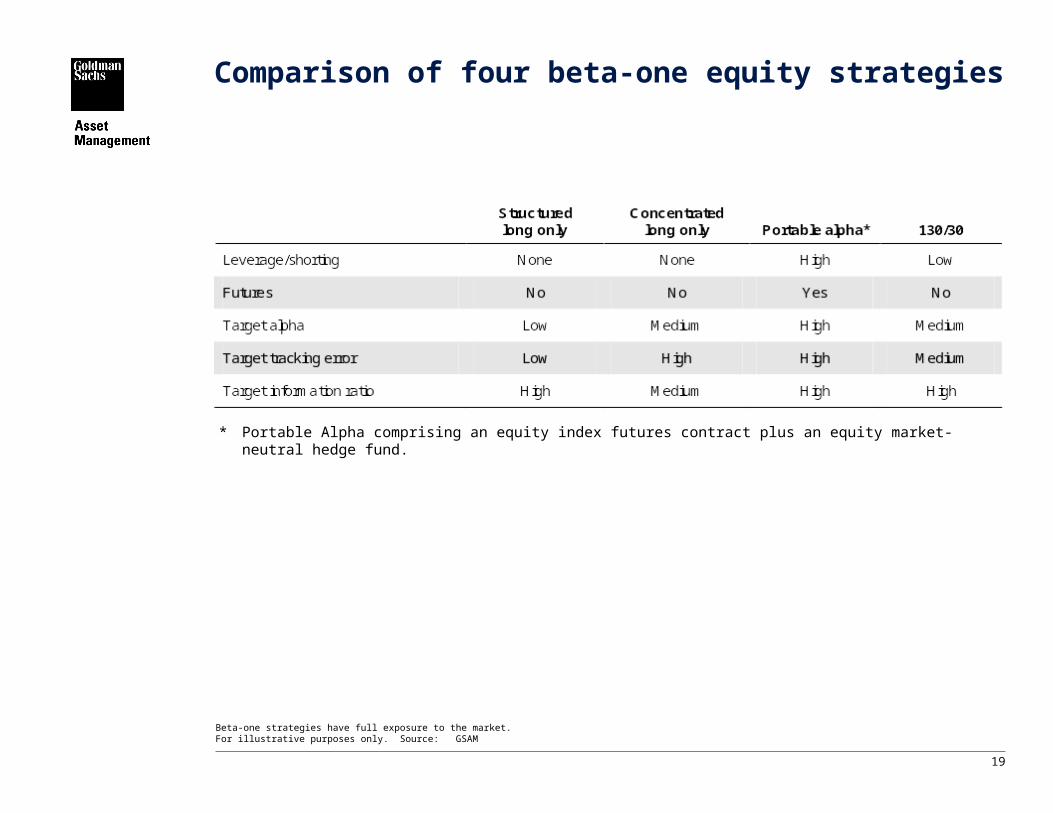
Comparison of four beta-one equity strategies
Beta-one strategies have full exposure to the market.For illustrative purposes only. Source: GSAM
* Portable Alpha comprising an equity index futures contract plus an equity market-neutral hedge fund.
20
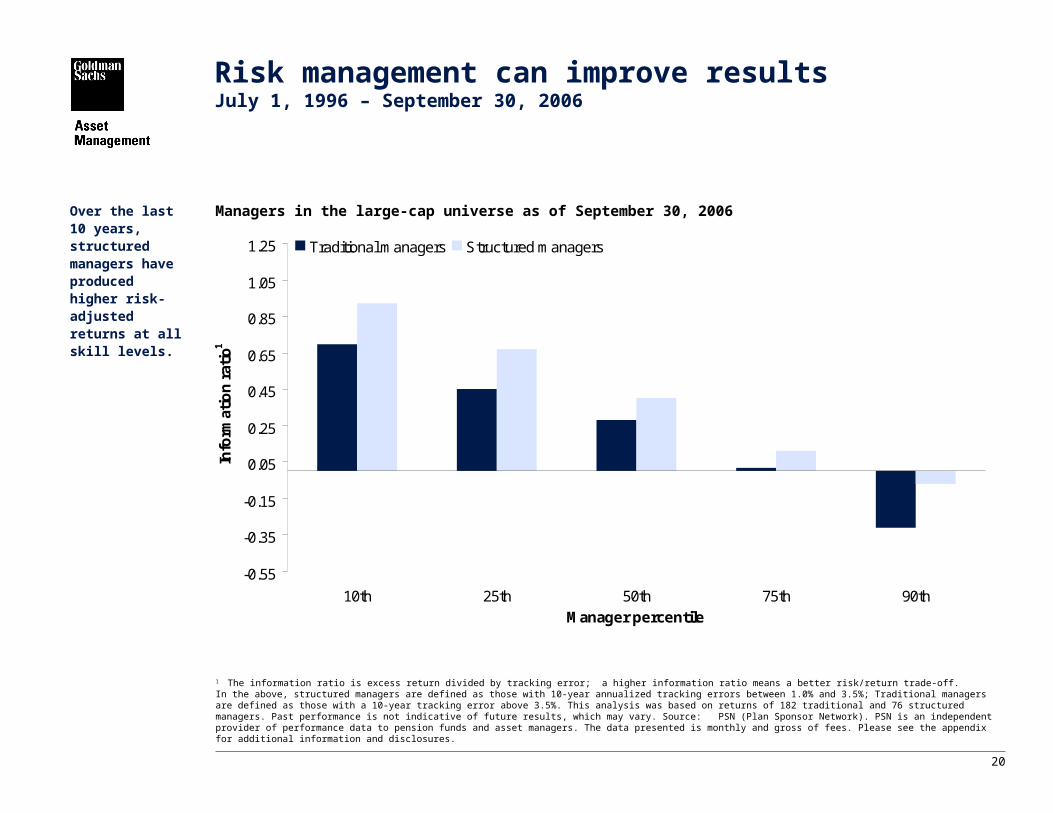
Over the last 10 years, structured managers have produced higher risk-adjusted returns at all skill levels.
1 The information ratio is excess return divided by tracking error; a higher information ratio means a better risk/return trade-off.In the above, structured managers are defined as those with 10-year annualized tracking errors between 1.0% and 3.5%; Traditional managers are defined as those with a 10-year tracking error above 3.5%. This analysis was based on returns of 182 traditional and 76 structured managers. Past performance is not indicative of future results, which may vary. Source: PSN (Plan Sponsor Network). PSN is an independent provider of performance data to pension funds and asset managers. The data presented is monthly and gross of fees. Please see the appendix for additional information and disclosures.
Risk management can improve resultsJuly 1, 1996 – September 30, 2006
Managers in the large-cap universe as of September 30, 2006
-0.55
-0.35
-0.15
0.05
0.25
0.45
0.65
0.85
1.05
1.25
10th 25th 50th 75th 90thManager percentile
Info
rmat
ion
rat
io1
Traditional managers Structured managers

Conclusion

22
Conclusion
Increasingly, investors are questioning the role of constraints, especially the no-shorting constraint
Short positions are the result of large underweights that allow portfolio managers to more fully express their negative views, and to better hedge their positive views
A 130/30 portfolio is a natural extension of existing equity strategies
Many managers and investors believe 130/30 strategies represent the future of equity investing

Appendix
24
Additional information
This material is provided for educational purposes only and should not be construed as investment advice or an offer or solicitation to buy or sell securities.
Opinions expressed are current opinions as of the date appearing in this material only. No part of this material may, without GSAM’s prior written consent, be
(i) copied, photocopied or duplicated in any form, by any means, or (ii) distributed to any person that is not an employee, officer, director, or authorized agent of the recipient.
This presentation has been communicated in the United Kingdom by Goldman Sachs Asset Management International which is authorized and regulated by the Financial Services Authority (FSA). This presentation has been communicated in Canada by GSAM LP, which is registered as a non-resident adviser under securities legislation in certain provinces of Canada and as a non-resident commodity trading manager under the commodity futures legislation of Ontario. In other provinces, GSAM LP conducts its activities under exemptions from the adviser registration requirements. In certain provinces GSAM LP is not registered to provide investment advisory or portfolio management services in respect of exchange-traded futures or options contracts and is not offering to provide such investment advisory or portfolio management services in such provinces by delivery of this material. This presentation has been issued or approved for use in or from Hong Kong by Goldman Sachs (Asia) L.L.C. This presentation has been issued or approved for use in or from Singapore by Goldman Sachs (Singapore) Pte. (Company Number: 198602165W). With specific regard to the distribution of this document in Asia ex-Japan, please note that this material can only be provided, upon review and approval by GSAM AEJ Compliance, to GSAM's third party distributors (for their internal use only), prospects in Hong Kong and Singapore and existing clients in the referenced strategy in the Asia ex-Japan region.
Although certain information has been obtained from sources believed to be reliable, we do not guarantee its accuracy, completeness or fairness. We have relied upon and assumed without independent verification, the accuracy and completeness of all information available from public sources.
Copyright © 2007 Goldman, Sachs & Co. All Rights Reserved. 07-1104