Demystifying Home Health Risk Adjustments (OASIS-D Update) · Once available, SHP will use the...
43
1 Chris Attaya VP of Product Strategy Zeb Clayton VP of Client Services Winning Wednesday Webinar Series Demystifying Home Health Risk Adjustments (OASIS-D Update)
Transcript of Demystifying Home Health Risk Adjustments (OASIS-D Update) · Once available, SHP will use the...
1
Chris AttayaVP of Product Strategy
Zeb ClaytonVP of Client Services
Winning Wednesday Webinar Series
Demystifying
Home Health
Risk Adjustments
(OASIS-D Update)

2
All presentations are recorded, so if you have
technical problems, all is not lost!
Enhancing Your Webinar Experience
Click the red arrow on the upper left to hide the GoToWebinar
control panel
To access the audio portion of the webinar, use your computer
speakers or call the number shown in the “Audio” section of the
GoToWebinar control panel
Make sure the volume on your speakers or phone is turned up
as high as necessary
If you call in to the webinar and experience poor audio quality,
please try hanging up and calling in again
Use the “Questions” section of the GoToWebinar Control Panel
to submit any questions you have during the webinar
Expand the “Handouts” section to download any relevant
webinar materials

3
• How and why risk adjustments are used in quality
reporting
• Changes to the risk adjustment model with OASIS-D
• Top and bottom covariates in the OASIS-D risk model
• Impact analysis and insights on the OASIS-D risk
model
• How should you use this information?
Objectives

4
How and why
risk adjustments are used
in quality reporting

5
• Risk-adjusted outcomes are utilized by CMS in many different areas,
including Home Health Compare, Quality of Patient Care star
ratings, CASPER reports, Value-Based Purchasing calculations, and
more.
CMS Reported Scores
6
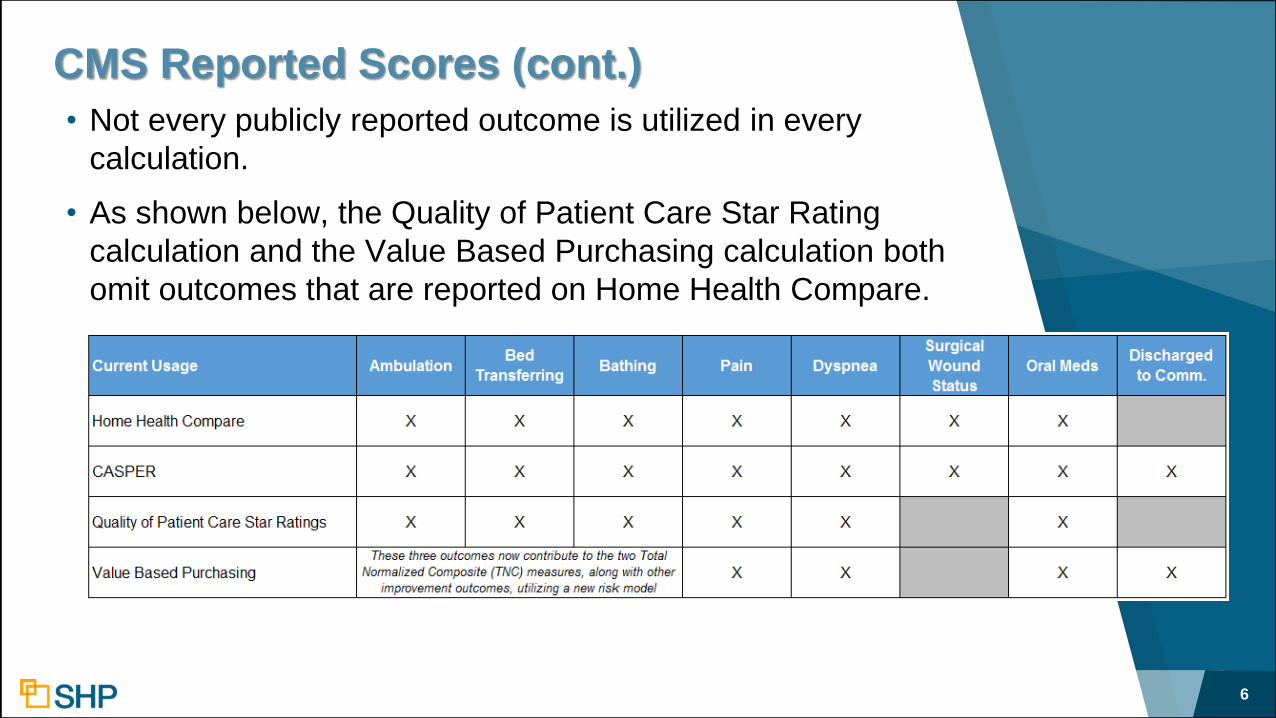
• Not every publicly reported outcome is utilized in every
calculation.
• As shown below, the Quality of Patient Care Star Rating
calculation and the Value Based Purchasing calculation both
omit outcomes that are reported on Home Health Compare.
CMS Reported Scores (cont.)

7
• The basic purpose of risk adjustment is to ensure a fair
comparison of outcomes by taking into consideration patient
characteristics at the start of a home care quality episode that
may affect the likelihood of specific outcomes during this
episode
• Used for OBQI improvement outcomes and the OASIS-based
Discharged to Community utilization measure
• Not used for process measures
• Each outcome has a unique risk model
• Outcomes scores include Medicare, Medicare Advantage,
Medicaid and Medicaid HMOs payers
• Only exception is Claims-based measures
Risk Adjustment – Why is it done?
8
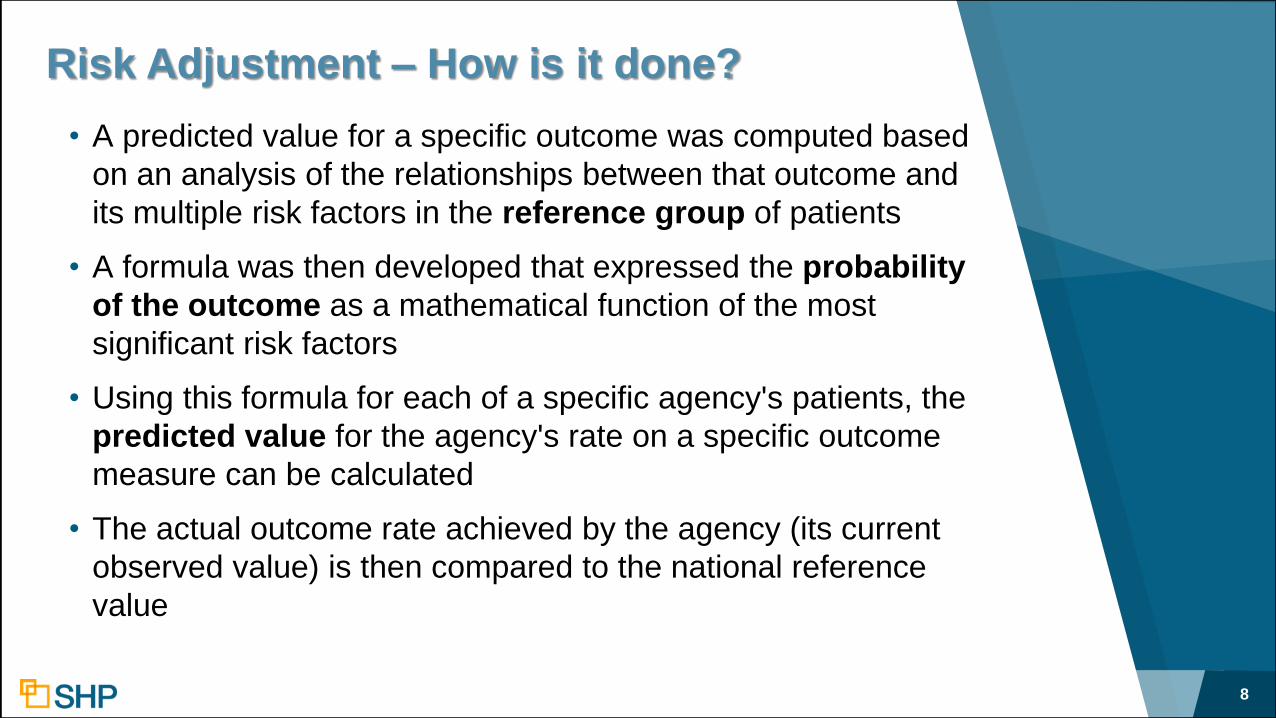
• A predicted value for a specific outcome was computed based
on an analysis of the relationships between that outcome and
its multiple risk factors in the reference group of patients
• A formula was then developed that expressed the probability
of the outcome as a mathematical function of the most
significant risk factors
• Using this formula for each of a specific agency's patients, the
predicted value for the agency's rate on a specific outcome
measure can be calculated
• The actual outcome rate achieved by the agency (its current
observed value) is then compared to the national reference
value
Risk Adjustment – How is it done?

9
An adjustment made to your outcome
scores by comparing your patient
characteristics to national averages.
Risk Adjustment – In English Please??

10
1. Observed outcome rate is calculated for all eligible patients
Agency(observed) = (# achieving outcome)/(# eligible for outcome)
2. For each of the same patients, a predicted outcome is calculated
based on statistical risk model and patient condition at SOC/ROC
3. Predicted outcomes are averaged across all the patients served in a
12 month period
Agency(predicted) = (Sum of predicted probability)/((# eligible for outcome)
4. National observed and predicted rates are calculated aggregating
across all eligible patients served by any HHA
5. Agency rate is risk adjusted by adding to the observed rate the
difference between the national predicted rate and agency predicted
Agency(risk adjusted) = Agency(observed) + (National(predicted) – Agency(predicted))
Risk-Adjustment Step-by-Step
11
• Logistic regression is a statistical technique commonly used
to analyze the relationship between multiple predictors (In this
case, risk factors) and a yes/no outcome (In this case,
improved/not-improved)
• Using this technique, a predictive model was constructed for
each outcome based on an analysis of risk factors and
outcomes using reference group data
• The predictive model is a mathematical formula that reflects
the influence of multiple risk factors on a particular outcome
Risk Model using Logistic Regression

12
• OASIS risk factors are patient characteristics identified at SOC or
ROC
• Each risk factor has multiple covariates, each with an associated
coefficient value that that can either raise or lower the likelihood
of the patient improving for the outcome in question
Note: We will be presenting the coefficients as probabilities so
that it’s easier to interpret the potential impact of each covariate.
• The higher the probability value for a risk factor (e.g. – over 50%),
the more likely the patient is to improve if the risk factor is present,
whereas a lower value (e.g. - below 50%), indicates that the
specified risk factor makes the patient less likely to improve
Risk Factors and Covariates
13
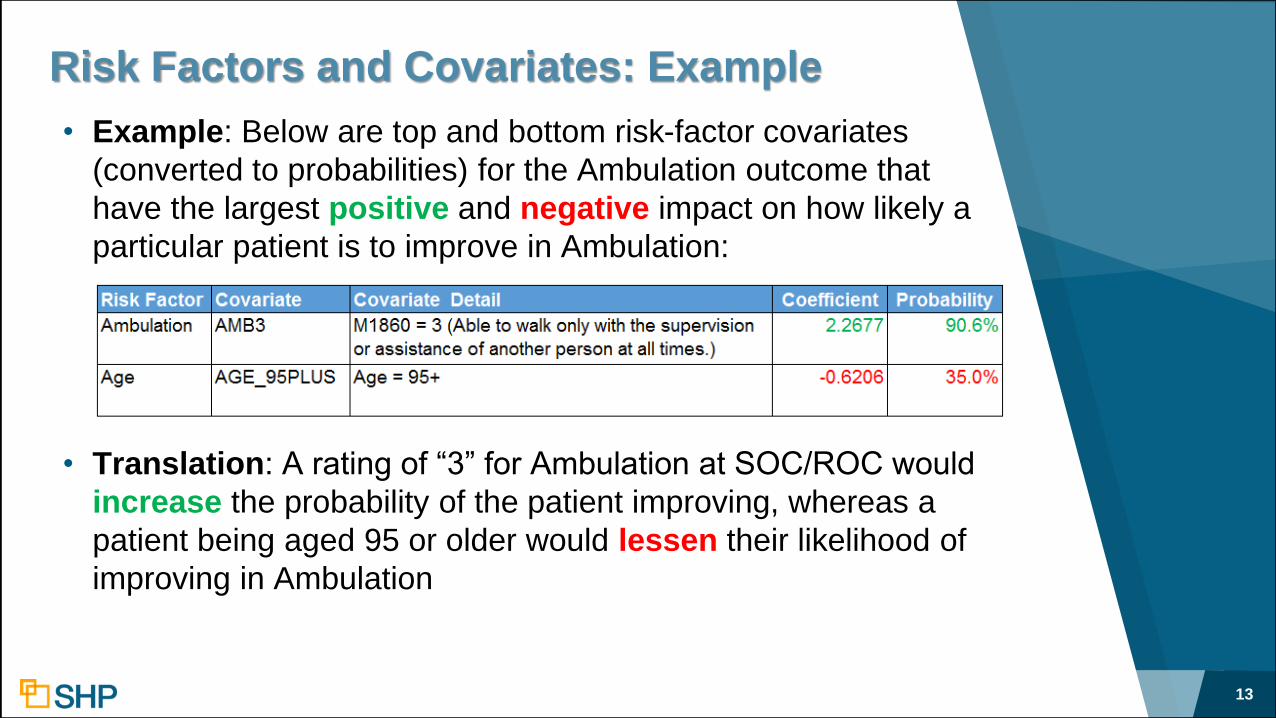
• Example: Below are top and bottom risk-factor covariates
(converted to probabilities) for the Ambulation outcome that
have the largest positive and negative impact on how likely a
particular patient is to improve in Ambulation:
• Translation: A rating of “3” for Ambulation at SOC/ROC would
increase the probability of the patient improving, whereas a
patient being aged 95 or older would lessen their likelihood of
improving in Ambulation
Risk Factors and Covariates: Example

14
• The values for each risk factor present for a specific patient
are aggregated and contribute to a single predicted
improvement score for the patient
• The higher the predicted improvement score, the more
likely that the patient is to improve, and vice versa
• The predicted improvement scores for each individual
patient are used to calculate your agency predicted score
• Therefore, having a large population of patients with patient
predicted values that are higher than the national predicted
score will result in your risk-adjusted score being lower than
your observed score, and vice-versa
Predicted Improvement Scores

15
• What does this tell us about risk-adjustment?
• For nearly all of the HHC outcomes, the single biggest factor
by far that causes your final risk-adjusted score to be lowered
is the severity of the rating for the outcome at SOC/ROC
Takeaway Regarding Risk-Factors

16
Changes to the risk
adjustment model with
OASIS-D

17
CY 2019 OASIS-D
▸ Effective January 2019, 70 data elements from 24 OASIS
items are no longer collected at SOC/ROC
▸ CMS was required to recalibrate the risk adjustment model to
include only OASIS items that will be present on OASIS-D
▸ Removed M-Items Included:
• Frequency of ADL/IADL Assistance: At least daily
• Conditions Prior to Treatment: Intractable pain
• Prior Functioning: Needed assistance with transfer
• Use of Telephone: Able to make and answer calls
• Patient Overall Status: Serious progressive conditions

18
CMS Activities to Update Models
▸Reviewed model risk adjustment factor (covariate)
definitions to identify those not supported by OASIS-D
▸Refined additional risk adjustment factors as needed,
based on statistical, clinical and other input
▸Recalibrated risk adjustment model parameters using
revised risk factors
▸Conducted clinical and technical reviews to retain risk
adjustment factors that were statistically and clinically
meaningful
▸Tested new risk adjustment model performance against
current models

19
• In general, there are more risk factors used for each outcome
under the new model, with the exception of the Surgical
Wound Status outcome, which has 18 less risk factors under
the new model
Risk Factors: Old Model vs. New Model

20
Top and bottom risk factor
covariates in the OASIS-D risk
model

21
• The SOC/ROC rating for Ambulation and Surgical Wound
Status are still the top risk factors for Ambulation
• New risk factors in the top-10 are: Pain and Anxiety
Top/Bottom Risk Factors: Ambulation

Ambulation SOC/ROC Rating Trends
22
• The % of episodes rated a “2” for Ambulation at SOC/ROC has
decreased consistently over time, while the % of episodes
rated a “3” has increased

23
• The SOC/ROC rating for Bathing still comprises the top 5 risk
factors for the Bathing outcome
• New risk factors in the top-10 are: Surgical Would Status, Toilet
Transferring and Pain
Top/Bottom Risk Factors: Bathing

24
• The SOC/ROC rating still comprises the top risk factors for the Bed
Transferring outcome, followed by Surgical Wound Status and
Therapy Need
• New risk factors in the top-10 are: any DX within the range Z00 to
Z99, Anxiety, and Disruptive Behavior Frequency
Top/Bottom Risk Factors: Bed Transferring

25
• The SOC/ROC rating still comprises the top risk factors for the
Pain outcome
• The seven risk factors below the 3 pain risk factors are all new
to the top-10
Top/Bottom Risk Factors: Pain

26
• The SOC/ROC rating still comprises the top risk factors for the
Dyspnea outcome
• New risk factors in the top-10 are: any DX within the range Z00
to Z99, Disruptive Behavior Frequency, and ROH = None
Top/Bottom Risk Factors: Dyspnea

27
• The SOC/ROC rating still comprises the top risk factors for
the Oral Meds outcome
• New risk factors in the top-10 are: Pain and Living
Arrangement (Lives Alone)
Top/Bottom Risk Factors: Oral Meds

28
• Therapy Need still comprises two of the top 3 risk factors for
the Surgical Wound Status outcome, but the therapy buckets
have been condensed and simplified
• The eight other risk factors are all new to the top-10
Top/Bottom Risk Factors: Surgical Wounds

29
Impact analysis and insights
on the OASIS-D risk model

30
Patient Predicted Analysis
▸ To demonstrate the effect of the new risk model, the comparison
below looks the average patient predicted rates for SOC/ROC
assessments from 2018 vs. SOC/ROC assessments from
1/2019 to 9/2019
▸ As noted in the last column, the average patient predicted rates
have gone up for all 7 outcomes

31
National Predicted Scores under OASIS-D
▸ Remember the calculation:
Agency(risk adjusted) = Agency(observed) +(National(predicted) – Agency(predicted))
▸ SHP calculates the Agency’s observed and predicted scores
based on the covariate logic provided by CMS
▸ Due to the fact that the National Predicted rates for each
outcome are not published by CMS, they must be calculated
each quarter by SHP (for 12 months ending)
▸ SHP calculates a National Predicted rate from the SHP national
database, and incorporates the most-recent publicly reported
Home Health Compare data from CMS in order to help adjust for
any differences between the SHP and CMS national
benchmarks

32
National Predicted Scores under OASIS-D
▸ Our hope is that CMS will be posting risk-adjusted scores based on
the new OASIS-D risk model in early 2020, which would include
outcome data from April 2018 – March 2019
▸ Once available, SHP will use the OASIS-D portion of the data to
calibrate 12-month SHP-only National Predicted rates for each
publication period that includes outcomes in 2019
▸ Due to this gap in data, and in order to avoid multiple changes to your
risk-adjusted scores, we chose to wait until 2020 to make changes to
the national predicted component of the risk-adjustment calculation
▸ Keep in mind that trends including both OASIS-C2 and OASIS-D data
may show a decline in risk adjusted scores starting in early 2019 that
will be adjusted once a National Predicted rate that includes OASIS-D
can be calculated.

33
National Predicted Scores under OASIS-D
▸ Tracking your observed scores trends will be important
▸ Comparing your percentile rank for both observed and risk
adjusted scores will reflect performance against your peers
▸ Reminder: Risk adjustment is calculated the same way for all
providers

34Institute of Medicine – Accounting for Social Risk Factors in Medicare Payment: Identifying Social Risk Factors – January 2016
Social Determinants of Health Framework

35
Social Determinants of Health Framework
• Additional Social Risk Factors are being proposed as
new questions on OASIS-E
• A1250 – Transportation
Has lack of transportation kept you from medical appointments,
meetings, work, or from getting things needed for daily living?
• B1300 - Health Literacy
How often do you need to have someone help you when you read
instructions, pamphlets, or other written material from your doctor
or pharmacy?
• D0700 – Social Isolation
How often do you fell lonely or isolated from those around you?

36
How should you use
this information?

OASIS Accuracy
• OASIS accuracy is key to financial success
Outcomes can only improve when SOC assessment
accurately reflects patient frailty and disability
• Enhance OASIS education
Repeat education at specified intervals
Validate knowledge received and retained
Utilize OASIS Q & As
OASIS Scrubbing
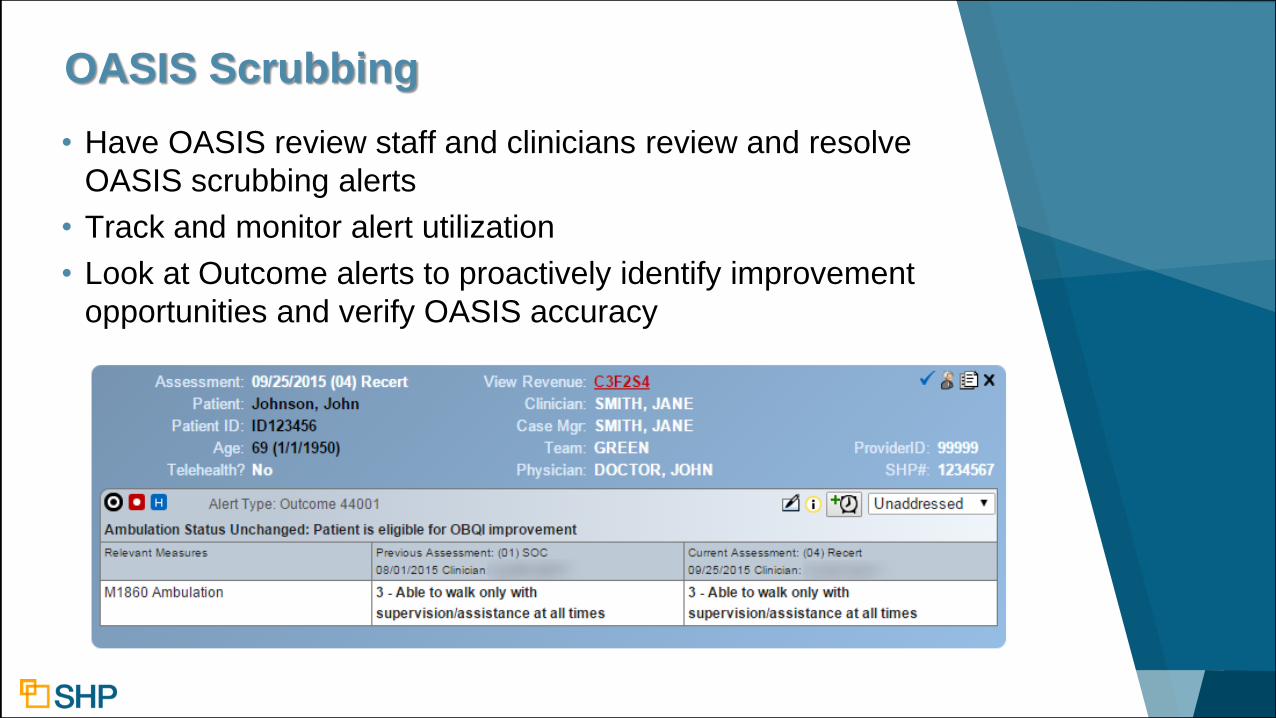
• Have OASIS review staff and clinicians review and resolve
OASIS scrubbing alerts
• Track and monitor alert utilization
• Look at Outcome alerts to proactively identify improvement
opportunities and verify OASIS accuracy

39
• It is important to resolve both the SHP critical and potential
OASIS alerts regularly for all patients
• The SHP resolution rate for potential alerts is typically less
often, but these inconsistencies can impact your risk
adjustments
• Certain OASIS items can affect the predicted improvement
rates for your patients depending on how scored and influence
the risk adjustments positively or negatively
• Managing alerts for all Medicare and Medicaid patients will
help ensure the accuracy is applied consistently in the risk
models
OASIS Potential Alerts

40
• The examples below demonstrate just a few of the SHP
“Potential” OASIS alerts that could impact your risk-adjustment
OASIS Potential Alerts

41
The $1,000,000 question: How do I “fix” my risk adjustment?
Answer: You don’t! Your risk-adjustment isn’t “right” or
“wrong”, it simply uses your OASIS answers to determine how
likely your patients are to improve.
Instead, focus on OASIS accuracy and do the best that you
can to ensure that your assessments accurately represent the
clinical condition of your patients.
The Takeaway

42
Questions?

43
Chris AttayaVP of Product Strategy
Zeb ClaytonVP of Client Services
Thank You for
Attending!
Winning Wednesday Webinar Series
Demystifying
Home Health
Risk Adjustments
(OASIS D Update)