Demonstration of Hydroslotter Technology on New York ... Library/Research/Oil-Gas... ·...
51
1 Demonstration of Hydroslotter Technology on New York Stripper Wells Final Report June 1, 2005 – December 31, 2006 By: Lewis (Skip) Taylor Hydroslotter Corporation Issued December 2006 DOE Award No. DE-FC26-04NT42098 Subaward No. 2984-HC-DOE-2098 Hydroslotter Corporation 10 Valleyview Court Kleinburg, Ontario L0J 1C0 Canada
Transcript of Demonstration of Hydroslotter Technology on New York ... Library/Research/Oil-Gas... ·...

1
Demonstration of Hydroslotter Technology on New York Stripper Wells
Final Report
June 1, 2005 – December 31, 2006
By: Lewis (Skip) Taylor
Hydroslotter Corporation
Issued December 2006
DOE Award No. DE-FC26-04NT42098
Subaward No. 2984-HC-DOE-2098
Hydroslotter Corporation 10 Valleyview Court Kleinburg, Ontario
L0J 1C0 Canada

Hydroslotter Corporation
Demonstration of Hydroslotter Technology on New York Stripper Wells ii
DISCLAIMER
This report was prepared as an account of work sponsored by an agency of the United States Government. Neither the United States Government nor any agency thereof, nor any of their employees, makes any warranty, express or implied, or assumes any legal liability or responsibility for the accuracy, completeness, or usefulness of any information, apparatus, product, or process disclosed, or represents that its use would not infringe privately owned rights. Reference herein to any specific commercial product, process, or service by trade name, trademark, manufacturer, or otherwise does not necessarily constitute or imply its endorsement, recommendation, or favoring by the United States Government or any agency thereof. The views and opinions expressed herein do not necessarily state or reflect those of the United States Government or any agency thereof.

Hydroslotter Corporation
Demonstration of Hydroslotter Technology on New York Stripper Wells iii
Demonstration of Hydroslotter Technology on New York Stripper Wells
Table of Contents
Disclaimer ii
Abstract iv
Executive Summary 1
Section A: Project Overview
Project Objectives
3
Project Background
4
Section B: Experimental
Overview of the Hydroslotting Method
6
Hydroslotting System Description
7
Accomplishments
8
Section C: Results and Discussion
Project Tasks and Work Completed
10
Economic Analysis
13
Conclusions and Recommendations
15
References
17
Appendix A: Scientific Principles of Hydroslotting
18
Appendix B: Typical Hydroslotting Procedure
28
Appendix C: Report on Geological and Field Data Investigation
32

Hydroslotter Corporation
Demonstration of Hydroslotter Technology on New York Stripper Wells iv
Abstract
The Stripper Well Consortium (SWC) sponsored this project, Demonstration of Hydroslotter Technology on New York Stripper Wells, to demonstrate an innovative stimulation technology named hydroslotting on marginal producing wells on three important plays in New York State: Onondaga, Medina, and Theresa. Under this project, Hydroslotter Corporation prepared, conducted, and evaluated demonstrations of its proprietary technology on four stripper wells in NY State. This report documents the project. Technical and economic conclusions for hydroslotting technology are made and are generally positive.

Hydroslotter Corporation
Executive Summary The overall program objective is to demonstrate hydroslotting on three different types of geological formations and four different wellbore environments in New York State. The three geological zones were the Onondaga, Medina, and Theresa formations. Special focus is to be paid to the precision, efficacy, performance, and cost of hydroslotting. The two ultimate objectives of this project were to gain greater acceptance for hydroslotting technology and to understand and decrease the costs of using hydroslotting technology on mature and depleted formations in oil and gas wells. The demonstration can be categorized into three broad sets of tasks: 1) to analyze each candidate well based on a geological / geo-physical process that includes a review of the gas field in general and in the immediate area in order to identify near-wellbore stress regimes and make recommendations for hydroslotting; 2) plan and demonstrate hydroslotting in different situations that present common challenges for all stimulation techniques; and 3) monitor the wells and make evaluations, conclusions, and recommendations. Hydroslotting is a method of increasing the productivity of oil, gas and hydro-geological wells that uses a proprietary hydrojet machine to remove drilling-related compression in the near-wellbore zone with a deep incision into the producing formation and re-distribute these support stresses outwards, thereby causing an artificial pressure drop and increased permeability in the near-wellbore zone. The hydroslotting method treats the formation with powdered cyclical re-agents to further clean out this zone. The raw data for this project was provided by the New York State Museum of Geology (Albany, NY). The data was compiled, organized and presented for analysis by Quest Energy (Buffalo, NY). Several meetings between Hydroslotter geo-scientists and Quest Energy resulted in the creation of a number of mappings, graphical, and spreadsheet presentations that assisted in the formation of hydroslotting reservoir models. The field demonstrations were located in western and upstate NY: two wells in the Medina formation in the town of Alden, Erie County, and in Darien, Genesee County, and two wells in Chautauqua County, in the town of Pomfret, on Onondaga and Theresa formations, were used to demonstrate the technology. A number of accomplishments were achieved during the course of the project. These are listed below:
• The interim report offered a fresh look at the Onondaga, Medina, and Theresa formations • Hydroslotter Corporation developed and refined a new universal geo-physical methodology • We eliminated more inefficiencies in analysis and design than in the hydroslotting procedure • Hydroslotter encountered and overcame three major procedural engineering impediments • The work performed under this project directly resulted in design and material improvements
The engineering on all the demonstrations experienced no technical glitches; the Theresa well demonstration required two procedures but otherwise also went smoothly. The perforation aspect of the technology was demonstrated on all wells but not the chemical aspect: instead lease water was used as the working fluid. The design and use of a chemical reagent on the formations in accordance with the patented method was finally disregarded after argument regarding lack of information on the wells, disagreement over the chemical treatment protocol, and financial restrictions.

Hydroslotter Corporation
Demonstration of Hydroslotter Technology on New York Stripper Wells 2
Actual technological and economic results were mixed. With further experience expected in the future in New York State, it is strongly believed that the productivity and reliability of the technology can increase. Conclusions and Recommendations 1. Hydroslotting can be commercially viable if several conditions are met. 2. While durability is important for the hydroslotter machine, it is a necessity for the nozzles. 3. It is recommended that new technologies such as hydroslotting be used to enter into the attic gas
reserves of the Medina formation. 4. It is recommended that the governmental and regulatory bodies in charge of collection of information
set stricter guidelines for reporting requirements. 5. Impediments to the development of this technology include the inefficiencies relating to geological /
geo-physical qualification process and hydroslot design, and not the actual procedure. 6. SWC leadership and partnership with industry plays a significant role in encouraging the use of
hydroslotting for stripper wells. 7. A critical leadership role for the SWC is to convince the industry and society at large that future gas
reserves will be produced from stripper well reservoirs.

Hydroslotter Corporation
Demonstration of Hydroslotter Technology on New York Stripper Wells 3
Demonstration of Hydroslotter Technology on New York Stripper Wells
Section A: Project Overview
Project Objectives The primary objective of this project was to test hydroslotter technology on three important New York plays: Onondaga, Medina, and Theresa formations. These formations were chosen because of their development and economic significance for the Appalachian Basin but also because they represent three different types of geologies: carbonates, tight gas sands, and shale gas sands. Tests were to be conducted in Chautauqua, Erie, and Genesee counties, New York. Originally, the objective was to demonstrate the technology in five (5) different types of wellbore environments, including:
• in a previously completed zone • near a gas-water contact • in a by-passed zone of pay • in a problematic or complicated well • in a previously fractured zone
When the proposal was formalized and accepted, Hydroslotter was requested to release one of the initiatives and concentrate on the other four. Hydroslotter chose to release the demonstration in a previously hydraulic fractured well. The reason for this choice was because it was left for a future demonstration. We had discovered in early 2005 that hydroslotting in combination with fracturing (or in a fractured zone) offers supplemental benefits that exceed the singular benefits of hydroslotting alone in certain geological formations. A patent was issued regarding this improvement in 2006. The work was planned into three main stages. The first stage was to select and assess candidate wells using geological and engineering analysis and treatment protocol calculations. The second stage was to conduct hydroslotting treatment procedures according to the objectives above on candidate wells selected for the project. The third stage was to monitor the selected wells and evaluate the effectiveness of the technology application for one year. In general, the four objectives were not difficult to complete and Hydroslotter was able to stay within the budget requirements of the project. This report models the results to show the economic benefits to operators, including reduced payout times, and increased well productivity and longevity.

Hydroslotter Corporation
Demonstration of Hydroslotter Technology on New York Stripper Wells 4
Project Background With the advent of high-pressure water-jets in the 1980’s, the world oil & gas industry soon figured out that water-jetting abrasive slurry straight through the walls of the casing would cleanly flush out all metal and debris and reach inside the oil-bearing formation and stimulate oil and gas wells better than did standard perforations. Very different from ideas and practices that were forming in the USA, primarily the Russians differentiated near-wellbore damage caused by drilling from compressive stresses caused by drilling, and concluded the latter to have a greater negative influence on near-wellbore permeability. This reality has been virtually ignored in western geo-physical academia. The USSR began developing their water-jetting concept into vertical slotting of the wellbore casing to reverse the negative effects of near-wellbore stress on permeability. The Russians created a method to deal with these compressive stresses, which was to precisely cut a “door-frame” shaped slice of pre-determined depth and vector through the casing and create a cavity in the hydrocarbon formation to a much greater horizontal depth. Slotting purportedly offered many benefits without the inherent disadvantages of the American methods. After the collapse of the Soviet Union in 1991 and subsequent decline in world oil prices, this new method, which Hydroslotter Corporation coined abrasive hydrojet slotting or “hydroslotting”, made no material advancements until we revived the idea and began R&D in early 2001. Originally the invention had numerous deficiencies. Primarily, the downhole hydroslotting tools were irreparably damaged, frequently and unexpectedly, making the method unreliable and expensive. The problem was that single, short applications routinely destroyed the down-hole tools. The original Russian prototype was virtually hand-made and of rudimentary design and could not hold up to continuous use. Two other problems were that technical documentation was not clear and all the historical field results could not be verified. We discovered through our extensive theoretical and field research, that hydroslotting is effective in all oil- or gas-bearing formations, but is only superior to other technologies in certain types of rock. From this investigation, we found that our technology counter-intuitively worked better in specific geologies with higher pressures. High pressure formations are generally found in deeper rock formations. This is not a “restriction,” but actually a predilection. In fact, being able to grasp where the technology excels best has allowed us to focus on many opportunities. We developed our mathematical models by playing with variables that included using raw data to calculate the reduction of density of the rock, the effects of slotting depths or changing the orientation of the slots, and designing chemical reagents for a variety of scenarios within the same formation interval. Our research on the tool design was very effective and we made strong inroads. We investigated various metallurgies, electronics, and sub-systems that could potentially be used in our 3rd-gen machines. Many times, research was challenging because we were contemplating things that had never been used before in the oil and gas industry. We were able to make informed decisions about new ideas that would help durability, stabilize working pressure, lengthen application times, and extend service life. Therefore the two main areas we focused on were design of new parts to increase efficiency and reduce wear (abrasion & corrosion), and making all parts stronger by using better metallurgies. We also experimented with multiple perforators to increase the slotting rate without surrendering efficiency or increases in cost or working pressure. The ultimate goal of the company was to commercialize the technology as quickly as possible in order to have the benefits widely available to the industry and society at large. However, it was apparent that many operators, especially those of marginal wells, had neither the discretionary capital nor the risk

Hydroslotter Corporation
Demonstration of Hydroslotter Technology on New York Stripper Wells 5
profile to invest in a new technology with unproven results. It was a business challenge that widespread acceptance would not occur until hydroslotting could be shown and verified to have worked in various geologies and wellbore environments – the more examples, the better – and could be marketed at a cost-effective price. In the beginning, this caused the company to direct its efforts on acquiring and re-working its own wells to demonstrate the technology, a business plan that was successful because the profits created from increased production continue to this day. The company pursued the assistance of the SWC to demonstrate the technology to operators in an independent and public forum. The successful application of hydroslotting in this type of forum would provide the credibility to prove that a large number of wells in various formations could benefit from hydroslotting. This could spur the future application of hydroslotter technology on thousands of wells and result in increased supplies of domestic natural gas and petroleum. A new prototype with increased durability, strength, and additional flexibility needed to be designed and constructed for the demonstration. To do this, we augmented the original Russian creation with North American engineering and superior materials, to create what we called a second-generation, intermediate or hybrid design. The goal was to create a more advanced third-generation prototype that would function properly in various oil and gas geologies and down-hole engineering environments and respond better to the restrictions and limitations of the method. In the end, Hydroslotter field tested the second-generation design for this SWC project. Technologically the demonstrations were a success, but economic analysis pointed to uncertain or moderate financial returns, which indicate that factors other than efficiency improvements may need to be considered to ensure profitability. Results and analysis of the field tests are described in this report.

Hydroslotter Corporation
Demonstration of Hydroslotter Technology on New York Stripper Wells 6
Section B: Experimental
Overview of the Hydroslotting Method Drilling and completion with standard perforation necessarily causes compression of stresses in the formation adjacent the casing (the “near-wellbore zone”), and often also causes damage. Both these factors inhibit or block the flow of fluids between the wellbore and formation. (It is not an indication that compressive stresses do not exist if is not noticeable with strong well production.) One solution to the damage associated with jet perforating is abrasive water jetting or “notching”. Notching makes shallow holes in the casing and cement and reaches a little farther into the oil- or gas-bearing rock and avoids the destructive effects of perforations. Abrasive fluid is pumped down the pipe string to the jet body and is directed against the inside of the casing with a nozzle(s), thereby cutting a hole. Returns of the fluid along with debris from the casing, cement, and formation are taken up the wellbore annulus. Companies researching this method include Halliburton, Schlumberger, Penetrators Canada, Centura Oil, Blast Energy Services, and Tempress Technologies, among others. Historically, the objective of notching is to create clean communication between the wellbore and formation only, so in practice it has always been used as a precursor to hydraulic fracturing or acidization. This is not much different from what was done some 50 years ago when water-jet perforation was invented. In contrast, hydroslotting goes two full steps beyond abrasive jetting with expectations to enhance productivity results on its own. Hydroslotting is distinct from notching because the water-jets are used for deliberate removal of pressure around the wellbore by adding a vertical component, and deep horizontal excavation to expand the drainage radius. Hydroslotting removes the mechanical compression stresses in the near-wellbore zone, which in turn eliminates the decisive influence they have on productivity. Hydroslotting creates a low-pressure area in the near-wellbore zone, creating an osmotic pressure difference from distant higher pressure areas, allowing fluids to move toward the well. The symmetrical and vertical design of the hydroslot, not the fact that it is made by water jets, is what increases permeability by 20-40 times in the near-wellbore zone. The deeper the horizontal excavation, the greater the drainage area and longer the commercial life of the well. An overview of the scientific principles of the hydroslotting method is discussed in Appendix A: Scientific Principles of Hydroslotting. In the marketplace, there is no other technology that achieves the objectives of hydroslotting or at the same price. It should be noted that only hydroslotting (and no other technology) transfers near-wellbore damage to the distant tips of slots as a method of maximizing productivity and extending a well’s life. It is evident that the marketplace needs better education about how a decrease in near-wellbore pressure causes an inverse boost in porosity, permeability, and productivity.
Hydroslotter Corporation
Demonstration of Hydroslotter Technology on New York Stripper Wells 7
Hydroslotting System Description The method for abrasive hydrojet perforating a well uses a standard service rig and a high-pressure pump unit, and requires a small crew and supporting equipment, including a BOP. Safety is the first priority in the operation of a hydroslotting procedure. The objectives of the procedure is to clean out the well to below the pay zone; log the well and correlate production zones; slot the selected intervals; apply the chemical treatment; and return the well to production. For small zones, the process requires one day of work or less, depending on the vertical length of the slotted intervals. Typically, the slotting procedure begins at the bottom of the targeted production zone. The tool is repositioned by raising the tubing for each new slot to be cut. The normal procedure used in hydroslotting a well is found in Appendix B: Typical Hydroslotting Procedure. The hydroslotter machine is a stand-alone device that is placed in the wellbore at the desired interval(s) on the end of drill or production tubing, and is removed at the end of all hydroslotting procedures. It weighs 160 lbs and is 10.1 feet long. When the operation is ready to begin and the pump pressure is increased to the working level (3000 – 6500 psi at surface), abrasive sand is added. The machine locks itself into place in the wellbore so that it cannot shake, turn, or move vertically, ensuring the cutting activity is smooth and consistent and at the correct interval depth. The machine diverts the abrasive slurry through sets of nozzles pointing directly at the casing, which takes a few minutes to cut through. Once through the casing, the cement bond and the rock formation behind the pipe flush away “like a knife through butter”. As the procedure continues, the internal throttle system causes the vertical descent of the nozzles at a speed that is needed to create a slot that is consistently deep and wide at all points. One important mechanical difference between the hydroslotter machine and the tools of competitors is that the slotting procedure is controlled at the point of engagement and not from the surface. It has been shown that controlling a vertical descent of nozzles from the surface results in an inconsistent cut that resembles “chicken scratch” with no predictability of any vertical depth or vector. A second important difference is the durability of the metallurgies used in the hydroslotter equipment. Hydroslotter Corporation manufactures all equipment to API Standards and at an ISO 9000 standards compliant facility. Hydroslotter machines are designed for versatility, to exceed the needs of the tasks at hand. Hydroslotter can furnish the equipment with or without certain specialized components that assist the customer in completing the well according to important geological and/or engineering pre-requisites. In addition, Hydroslotter can provide real-time development and recording systems to gather important real-time data about the procedure, the rock formation being hydroslotted, and the well.

Hydroslotter Corporation
Demonstration of Hydroslotter Technology on New York Stripper Wells 8
Accomplishments A number of accomplishments were achieved during the course of the project. These are listed below. 1. The interim report offered a fresh look at the Onondaga, Medina, and Theresa formations. In the Report on Geological and Field Data Investigation, attached as Appendix C hereto, reservoir models were created from complex analyses of gas exploitation and log data. Conclusions were able to be made about the Onondaga and Theresa formations, but data was generally insufficient because these formations are not well explored. The following conclusions were able to be made about the three formations:
• All three formations suffer from low pressure, where hydrostatic exceeds reservoir pressure • Total well production is sourced from less than 50% of the entire Medina reservoir • Gas production in the Medina could be increased by
o Primary completion of existing pay zones using hydroslotting o Secondary completion by hydraulic fracturing in poor drainage zones even after
hydroslotting o Selective exploitation of the top part of the Medina that is currently not the choice for gas
production (by-passed pay), which contains, on average, 30% of all Medina gas resources, with maximum and minimum ranges from 10 to 70%
o Drilling of additional new wells in the most prospective zones minimally or not impacted by the drainage of gas from nearby production wells.
• Gas production in the Onondaga could be increased by o Hydroslotting where conventional perforating was previously ineffective
• Upper Cambrian Theresa wells can be high producers with hydroslotting 2. Hydroslotter Corporation developed and refined a new universal geo-physical methodology. As presented in Appendix C: Report on Geological and Field Data Investigation, this methodology was able to correctly:
• Describe reservoir characteristics and natural fracture systems • Determine reservoir permeability, gas saturation, “filtration-capacitor” characteristics • Define effective thicknesses of gas saturation & filtration, porosity & gas saturation coefficients • Determine volumetric drainage areas and drainage radii and recoverable gas for existing wells • Create filtration model for all of Medina formation • Forecast increase in total cumulative gas production from infill drilling • Evaluate hydroslotting treatments and their impact on well drainage area and infill well potential
3. We eliminated more inefficiencies in analysis and design than in the hydroslotting procedure, contrary to what was expected. It was always believed that the greatest inefficiencies of the hydroslotting method would be found in the actual procedure on the basis that it contains the bulk of the expenses. In fact, the time and expense relating to the preparation of the procedure had the most room for improvement and cost reduction. Items include the construction of a mathematical model for each individual well to calculate optimal slot depths, vector dynamics, and chemical reagents for a variety of scenarios within the same formation interval; the development of the appropriate constitutive relationships to relate excavation geometry to permeability enhancement; and the resulting hydroslot design, which is needed to predict spatial permeability distribution as a function of the imposed perforation or slot. Going into the demonstration stage of the project, Hydroslotter Corporation had a strong understanding of stress redistribution, but there were still many unknowns that had to be learned and tested. Some of these unknowns may have been caused by the reticence of the Russian experts to reveal evidence of some education that was considered so basic and necessary that it had to be built from scratch. There were also

Hydroslotter Corporation
Demonstration of Hydroslotter Technology on New York Stripper Wells 9
cultural / hierarchical issues. Work on eliminating inefficiencies in this area continues. That being said, we demonstrated hydroslotting successfully and showed that, practically speaking, hydroslotting works. 4. Hydroslotter encountered and overcame three major procedural engineering impediments. First, hydroslotting a zone in which the hydrostatic pressure exceeds the formation pressure means that the drilling will be overbalanced and this hurts the formation. At the time, the hydroslotting procedure did not call for a lifting mechanism such as foam or nitrogen to lift the water out of the annulus, thereby creating an under-balanced drilling operation. The problem is that under-pressured formations indeed drink water. We now use these lifting mechanisms. Similarly, working fluid cannot be left in the hole overnight because the freshly cut formation will absorb the water and the water will take time to release. Second, the vertical stretch or shrink of the tubing while under pressure was not properly calculated. This could have happened from stretch under high pressure or if the string got “hung up” against the inside of the casing, if the hole was unknowingly deviated. In either case, our assumption that the jet was being properly directed was mathematically calculated but never checked in any of our jobs and generally, we must conclude that we may have been in error. We continue to use the formula, but verify the calculation with a logging procedure that is performed at working pressure. Third, we tested three different configurations. We tested different length slots. We purposely manipulated sand concentrations. We used three sets of perforators (6 nozzles altogether) for the first time. By reducing the number of nozzles to two (one perforator set) from six, the abrasion on the nozzles was accelerated. Our solution was to manufacture better nozzles but also testing of the variable components of the procedure continues. 5. The work performed under this project directly resulted in design and material improvements. One of the greatest achievements of the demonstrations was the understanding gained from working with the intermediate or second-generation tool. Using the guidance of our experience from this project, we were ready to begin designing the brand new “3rd generation” prototype – powerful, standardized, mobile, efficient, and flexible – with the following general goals:
• Durability (stronger metallurgies) for longer service life • Automated (to some degree) & fewer components for reliability • Better protection from sand invasion, wear & tear • Standardized to the industry API standard • Minimize costs of expensive surface equipment with longer continuous work • Make better use of the surface equipment, like pumping at maximum pressures
After each demonstration, we were able to take apart the chassis and make deductions. In real time, we saw the technology interact with the surface equipment, such as the rig, pump, sand blender, etc., and how to improve compatibility. By the last demonstration, we understood how to achieve an application cost reduction of more than 50%.

Hydroslotter Corporation
Demonstration of Hydroslotter Technology on New York Stripper Wells 10
Section C: Results and Discussion
Project Tasks and Work Completed Task 1: Analysis and Candidate Well Selection Hydroslotter first started its analysis from a historical point of view and in-depth consulting from Quest Energy. It was discussed that the common method for completing all wells in NY state is with hydraulic fracturing, and secondarily or following up with acidization or acid washes. Hydraulic fracturing is the preferred method because of the underground naturally fractured block system of the Medina formation, highly influenced by natural fractures. Hydraulic fracturing opens up the access to adjoining blocks beyond these natural fractures and creates an increased drainage radius. Very limited production can be created from completions using standard perforation only. Therefore, in known mature and/or stripper wells, hydroslotting was generally expected to create an enhancement in geological formations that would have started as poor producers in the first place. One of the initial problems encountered was lack of information and inability to collect available information. Generally, NY State reporting requirements are low: most well files do not contain even the most basic of initial information such as wellbore diagrams, core sample analyses, formation tops, gas pressure or other full-value gas dynamic analysis, and filings contain incomplete statements about flow tests or initial shut-in or reservoir pressures. Production information, if available, is often incomplete, missing relevant ongoing wellbore and line pressure information. Further complicating the collection of data was that the current operator purchased many of the wells being reviewed from a purportedly bankrupt previous operator, and neither had filed any permits nor submitted any secondary workover histories on the basis that the state did not require such information. Permits are only required for workover in the different zones of a well, or to change the designation of the producing formation. Two geological/geophysical reports were written for the project, one public and one private, showing the gas potential of all of the candidate wells and their neighbors in the immediate area. The private report was not submitted due to confidentiality of the subject matter: it identified wells with near-wellbore stress and made recommendations about hydroslotting and geographical locations for in-fill drilling. The public interim report, titled Report on Geological and Field Data Investigation, offered complex analysis, discussion, conclusions, and recommendations regarding the Onondaga, Medina, and Theresa formations. A significant characteristic of all three formations is that there is a correlation between total gas production of a well and the well’s initial reservoir pressure. The maximum gas production of any well is obtained from zones where initial reservoir pressure is the lowest. As discussed in the Report on Geological and Field Data Investigation, the calculated drainage radii of the wells in these formations suggest with a high probability that gas migrates from distant high-pressure areas of the reservoir to low-pressure areas where it is collected and extracted. In this respect, recommendations for hydroslotting are therefore somewhat positive. By lowering the near-wellbore pressure to a minimum, the effects of the compressive stresses are reversed and drainage is improved. Drainage parameters can practically define the total gas production and are characterized by very low rate of extraction compared to the total in-state gas of the reservoir.

Hydroslotter Corporation
Demonstration of Hydroslotter Technology on New York Stripper Wells 11
Counter-balancing this positive note is the geological challenge facing the hydroslotting method. In all three formations, the reservoir pressures are significantly lower than hydrostatic pressure. During the hydroslotting procedure, the weight of the column of fluid being circulated back up to the surface will be heavier than the formation can bear and lead to an overbalanced condition. This means that in each workover, significant fluid will be lost into the formation. The result of water invasion is reduced gas productivity as the wells produce water, and it will take time for them to clean themselves up. At the time of the demonstrations, there was no clear answer as to how to deal with the over-balanced nature of the method. Now, in order to create an under-balanced condition in the future, Hydroslotter now adds nitrogen or foam to the circulation to ensure that the formation pressure exceeds the hydrostatic and give the column of fluid the momentum to lift out quickly. In any event solutions were not known at the time and each hydroslotting workover was done in an over-pressured state, which caused production problems. Task 2: Technology Demonstrations The strongest recommendation was the expediency of carrying out hydrodynamic testing on the basis that it would assist in developing a program for hydroslotting as well as drilling new in-fill wells. The recommendation was resisted by the operator on the basis of cash flow requirements. Well into the program, the selection of wells was reduced to a narrow band with low potential for increased production. All were in an extremely mature or damaged state and/or ready to be plugged and abandoned. At the same time, these wells offered limited opportunity for Hydroslotter to gain further insight into the expansion or improvement of the technology. Nonetheless, having satisfied the technological requirements of the program, the decision was made to push forward. In the end, this decision was the right one because all workovers produced sufficient gas to be marginally profitable. The key objectives were not to show the value of re-working an entire well, but to show that hydroslotting could increase production in the different formations. Each demonstration succeeded in showing pressure increases and improved gas production. Equipment costs were inordinate for the purposes of these demonstrations. For financial reasons and issues with the operator, workovers were limited to one day per demonstration. Only in the case of the Theresa well was the workover extended to two days. 1. Our first Medina well demonstration. Drilled in May 1984 to TD 1358’, and completed at the interval 1190-1238’ ft., with 52 ft of effective pay, this well had the lowest initial reservoir pressure of only 380psi compared to all the other wells in the nearby area. The initial flow was 1057 mcfd, much higher than nearby wells. Cumulative production is 159,628 mcf. After hydroslotting the same zone, daily production increased from <10 mcfd to 35mcfd. However, water production also increased, producing over 450 barrels of working fluid in 2006. In the evaluation period, production declined to less than 15mcfd whenever a column of water would build in the tubing and restrict the flow. 2. The second Medina well demonstration. It is the classic example of a mature stripper well. Drilled in 1983 to TD 1300’ and completed at 1192 – 1242’, with 31 feet of effective pay, this well had initial flow was 975mcfd and cumulative gas production is 29,183mcf. After hydroslotting the same zone, performance increased 10x from 1.5 mcfd to 15mcfd and flush production was sustained for 3 months. Production continues at 5mcfd, which is a 50% sustained improvement over historical production. In 2006, the well has produced over 100 barrels of working fluid / water production. 3. The third demonstration was the Theresa well demonstration. Drilled in 1996 to a TD of 6174, this well produced 6744 mcf at 5478 – 5496’ at an ISIP of 1510 psi from 1996 to 1998 but sat idle until it was hydroslotted in August 2005. Several intervals appeared to be prospective for additional gas within

Hydroslotter Corporation
Demonstration of Hydroslotter Technology on New York Stripper Wells 12
the Theresa formation: (i) 5555 – 5560’, (ii) 5565 – 5572’, (iii) 5608 – 5611’, and (iv) 5623 – 5628’. The second interval was chosen as it was closest to the previous production and near a water layer. We hydroslotted using 3 sets of nozzles but mechanically could not optimize working pressure and shut down the procedure. Production increased to 75 mcfd followed by a rapid decline. The zone was re-slotted and resulted in an IP of 107 mcfd. Reducing the number of nozzles increases the slotting time and accelerates the abrasion on the nozzles. The objective of isolating and/or preventing water problems was successful. In the end, 8ft was slotted, which was sufficient to receive 2135 mcf before the well was shut-in again. 4. The Onondaga well demonstration. Drilled in 1996 to TD 3021’, this well’s inherently low pressure made the Onondaga Formation the toughest of the three NY formations to tackle because of the risk of overbalanced slotting. This gas well could have been damaged by the overbalanced procedure when it went under vacuum would have an adverse impact. Three small intervals totaling 12 feet of by-passed pay were slotted at (i) 1842 – 1848’, (ii) 1852 – 1855’ and (iii) 1865 – 1868’. This Onondaga formation well now produces 11mcfd, over production for the previous 5 years of 2-3 mcfd. The result has evidenced a major water problem, unloading over 3000 bbls in 2005 and over 250 bbls in 2006. Task 3: Evaluation of Results In the following year of monitoring, hundreds of barrels of water were produced from the wells on a declining basis. While it is clear that water production was a direct result of hydroslotting (in comparison to years prior to the workover, in which water production was zero), the quantification of gas production increases became more difficult due to operator issues. Results of the demonstration are shown below:
2005 20061 Cumulative Production
(mcfd / mmcf) Gas
(IP / mcf) Water (bbls)
Gas (mcfd / mcf)
Water (bbls)
Total Gas
mcf / (% inc.) Medina1 2 <17 / 159.6 35 / ~2700 120 12.5 / ~3700 450 6400 (+15%) Medina2 1.5 / 29.2 15 / 1034 0 5.2 / 1550 120 2584 (1000%) Theresa 0 / 6.744 100 / 1830 0 20 / 305 0 2135 (+32%) Onondaga 12.7 / 87.9 12 / 4336 3150 11 / 3300 250 7636 (+10%)
1 2006 figures may not correspond with official state figures that have not been released yet. 2 This figure is not total production, but volume increase attributable to slotting. As negotiated with operator. Total reported mcf vol. = 6193 (2005), ~ 5500 (2006).

Hydroslotter Corporation
Demonstration of Hydroslotter Technology on New York Stripper Wells 13
Economic Analysis Marginal quantities of gas increases in this demonstration should not be considered negative, because the absolute numbers relate to the fact that very little gas existed in-place. For example in the Theresa well, the relative increase should be regarded as a positive because hydroslotting increased the commercial life returns by 32% in comparison to conventional completion technologies. It is therefore surmised that if the reserves exist, hydroslotting can reach farthest into the drainage area to make the well a large producer in a way that no other technology can. This leads us to believe that only a fraction of total reservoir is being produced & BCFs of gas are unexplored. Analysis of the economics of the hydroslotting tool highlights a great obstacle to commercialization. Cost-based models understate the value of the technology. Costs to manufacture the machine are not individually expensive. Tests to date show a relatively long service life for the machines, and this trend in durability is expected to continue as the technology is further improved. Therefore on a rental basis the machine might have a pay-out in a week at $5,000 daily rental charge. The total billing cost of using the machine is more expensive than simple perforation, and less than hydraulic fracturing: these relations have not changed in the last three years. The daily total billing cost of the machine incorporates the cost of the supporting services needed to put it into operation. A third model using the development cost of the machine, because it required highly trained engineers and machinists with a large amount of testing is also ineffective. R&D costs do not continue in the preparation, trouble-shooting, maintenance, and operations on a continuing basis and R&D costs are expected to be recovered with proper marketing. The increased productivity from using the machine is disconnected from the costs of the hydroslotting machine or services. Depending upon the attributes of the well, productivity increases can have a wide range, from 15% to 200%, as seen in the results of this set of demonstrations. The first Medina well evidenced stabilized production with barely any improvement over the historical production while water was being produced. The second Medina well, on the contrary, showed a massive increase on a sustained basis, with an IP of 1000% the previous production and sustained production of 50% greater. Based on the market cost of the typical surface equipment to be used in a hydroslotting operation, the total billing cost approximates $10 per foot of depth per application, with a minimum application cost of about $20,000. (There is no price advantage for wells shallower than 2,000 ft.) Thus, for example, surface equipment may cost $50,000 on a 5,000 foot well for one day of work. The productivity of the machine is able to slot 36 feet in a 12 hour day, which allows time for rig-up and rig-down of high-pressure pumping equipment. This amount of slotting is sufficient to cover the majority of effective pay zones in all New York formations. Pay-outs required to justify hydroslotting in NY are calculated. The cost model assumes the paid-out cost of an operator equals the cost of the operation, plus the added surcharge for royalties (assume 20%) and wellhead expenses, divided by the price of gas (assume US$6.00). The formula below can be used to approximate the cost of a hydroslotting procedure.
Q = [ Cost + Royalty + Expenses ] / Gas Price Based on this formula, necessary production for an operator to cover the costs of a hydroslotting workover ranges between 3,500 mcf and 8,000 mcf for deeper formation intervals:
Onondaga cost = $20,000 = 3,500 MCF Medina cost = $25,000 = 4,400 MCF Theresa cost = $50,000 = 8,800 MCF

Hydroslotter Corporation
Demonstration of Hydroslotter Technology on New York Stripper Wells 14
In terms of technological improvement, the Theresa well was the outstanding performer, as the commercial life of the well was increased by 32%. The second Medina well was also an important producer except that the gross volumes of gas and drainage acreage available to the well were low (please refer to Report on Geological and Field Data Investigation for details. The Onondaga well, which was fracced two years earlier, expanded the drainage volume allowed hydroslotting to connect to this increase without creating expanded production. The expanded drainage volume increased reserves from 100mmcf by 50% to 150mmcf. Hydroslotting by-passed pay contributed only to drainage volume, evidenced by an increase in the wellhead pressure, although actual increased production is difficult to verify. In terms of return on investment, the Onondaga well can be considered to be the most successful, with a payout in approximately 7.8 months. On the other end of the spectrum, the Theresa well did not attain its minimum productivity requirements to become profitable, resulting in fact in a loss of nearly $48,000 according to the formula above. The Medina wells will be able to pay off the workovers in just less than one year, at 11.7 months. This marginal profit is not strong enough for widespread commercialization and forces Hydroslotter to continue research and development with an objective to reduce costs to a preferred pay-out time at less than 6 months. In terms of comparing hydroslotting to other technologies, the ball remains in the air. More wells require to be completed using this novel technology to show definitive answers. At present, financial comparisons are easier than technological comparisons. The relative economic cost of hydroslotting is more than simple perforation and marginally less than the cost of hydraulic fracturing, and less than the cost of completing a well using simple perforation followed by hydraulic fracturing. Technological comparison would be more easily facilitated if two operations were done side-by-side. On an absolute basis, hydroslotting can be deemed a success as a remedial technology, but has not been used yet as a primary completion technology on a newly drilled well. This is a goal for the future. Rising or buoyant gas prices are helpful to offset the increasing prices of oilfield service costs, especially rig costs, which rate of increase is astronomical. Due to improvements in the machine and especially in the durability of the nozzles and perforators, hydroslotting cost now has been reduced to the range of $6.00-7.00 per foot of depth. This estimate is based on an in-hole service life of 300 hours and the ability to hydroslot 1,000 feet of formation, as well as the technical supervisor of the machine. These new economics should show that many stripper wells can use hydroslotting economically in today’s price environment.

Hydroslotter Corporation
Demonstration of Hydroslotter Technology on New York Stripper Wells 15
Conclusions and Recommendations 1. Hydroslotting can be commercially viable if several conditions are met. Results of this demonstration effort show that generation of hydroslotter machine used can be economically successful in even the most difficult or marginal of stripper wells. However, it is important to note that from our experience in NY State, first and foremost, hydroslotting is not recommended for use in wells that produced, during their entire commercial lives, less gas than what would be required to pay for a single hydroslotting workover, because the risk-reward balance cannot be justified. 2. While durability is important for the hydroslotter machine, it is a necessity for the nozzles. All aspects of the downhole procedure rely completely on the robustness of the nozzles. Increasing the work load of the operation or the harshness of the downhole environment will require development of a new platform of more durable metallurgies and sub-components. After the demonstrations, Hydroslotter developed a new nozzle made of powerful ceramic carbide metallurgy, and hardened perforators with special alloys with exotic metals. The result of these upgrades has made for faster and deeper cutting (6000 psi and 0.3 lbs/gal). There is an economic saving in that no time is wasted pulling tubing out of the hole every second day and this maximizes the slotting time. The tool now regularly cuts between 15 and 20 feet deep without deterioration. It is clear that the machine can slot 80 hours continuously without deterioration, so money should be saved on surface equipment and pumping pressures can be maximized. 3. It is recommended that new technologies such as hydroslotting be used to enter into the attic gas reserves of the Medina formation. In many cases these reservoirs exceed 25% of the formation. For example, as discussed in Report on Geological and Field Data Investigation, it was shown that the listed analyzed wells had attic gas reserves of 30%, on average, where gas saturation exceeded 30% and porosity exceeded 11%. The upper reserves offer plenty of potential for gas exploitation and hydroslotting demonstration because of the low porosity characteristic. By-passed pay may be plentiful however; if the initial production of the main object of exploitation was low, then the economic collection of gas in the attic reservoir is going to be difficult, and review of offset wells and logs is necessary. All attic reserves are possible candidates with further evaluation. 4. It is recommended that the governmental and regulatory bodies in charge of collection of information set stricter guidelines for reporting requirements. At present, guidelines are grossly inadequate. If an operator wishes to acquire or work over a target well, access to information must be sufficient to determine with clarity whether there is any gas left in-place to pay for a workover. Production history, logs, and formation characteristics should be included in the very basic information that is needed. NYSDEC reporting requirements are currently not strict enough in this regard. 5. Impediments to the development of this technology include the inefficiencies relating to geological / geo-physical qualification process and hydroslot design, and not the actual procedure. Some of the inefficiencies may be attributable to normal growing pains or learning curves of a new technology, while others can be associated with cultural and hierarchical norms. We feel strongly that developing or educating the company with important scientific principles will be the foundation for future generations of the technology and is basic and necessary to improving the design and economics of the hydroslotting procedure. 6. SWC leadership and partnership with industry plays a significant role in encouraging the use of hydroslotting for stripper wells. The SWC has given Hydroslotter the platform needed to market the hydroslotting technology. Industry’s current R&D goals and (political) perception of future R&D requirements do not focus on technological operations in stripper wells and there was no other similar

Hydroslotter Corporation
Demonstration of Hydroslotter Technology on New York Stripper Wells 16
platform that could be used for the development of hydroslotting at a critical time in its growth... It is important that industry and the SWC collaborate to encourage the development and use of new technologies like hydroslotting to prepare for the future. 7. A critical leadership role for the SWC is to convince the industry and society at large that future gas reserves will be produced from stripper well reservoirs. The SWC’s prediction of future requirements to extract gas from stripper wells is correct. The US oil and gas industry must have the means to exploit reserves to meet the nation’s current and future demand. This will in turn have a significant impact on the US economy. In addition, the SWC’s focus on new technologies helps reduce the risk and offset chances for loss. On a broader note, the political vision of the government does not strictly agree with the vision of the SWC that the development of new oil & gas technologies will be an important factor in maintaining energy reserves in the future. It is vital that SWC maintain and that the industry support and strengthen the SWC’s leadership role to improve the production performance of the nation’s natural gas and oil stripper wells.

Hydroslotter Corporation
Demonstration of Hydroslotter Technology on New York Stripper Wells 17
References The principal author and editor of the Report on Geological and Field Data Investigation, was Dr. L. Marmorshteyn, Technical Director, Hydroslotter Corporation, in collaboration with Dr. V. Neiman and Dr. J. Basin.

Hydroslotter Corporation
Demonstration of Hydroslotter Technology on New York Stripper Wells 18
Appendix A: Scientific Principles of Hydroslotting
1. Introduction
There has been abundant research in USA and abroad that shows that the physical state of the area
immediately around a wellbore (near-wellbore zone or NWZ) in a fluid-producing interval or zone
significantly affects the well inflow during the process of drilling and exploitation of oil and gas
reservoirs. Therefore, stress concentration in the NWZ by definition also exerts critical influence. NWZ
stress is almost always caused in the drilling process, but NWZ stress is most evident in older or mature
wells, because the NWZ has undergone years of slow damage. Research has found that in vertical
wellbores, increased tangential stresses in the NWZ negatively affect the physical characteristics of the
formation rock. In particular, there is a considerable decrease in the permeability of the productive layers.
(It is understood that directional or horizontal wellbores will also sustain NWZ damage, but this has yet to
be demonstrated or quantified through publicly available research.) Further, Hydroslotter and other
investigators have shown through laboratory simulations of true physical conditions, this correlation
between formation permeability and pressure exerted upon it.
As a result, the method used by Hydroslotter, under which the pressure in the NWZ is essentially
decreased, reverses this dependence, creating an artificial condition in the NWZ where formation pressure
is reduced below what is found in the pre-drilling natural state, arousing a multi-fold increase in NWZ
permeability in the collector. This report describes the hydroslotting method, the results of industrial
hydroslotting demonstrations in New York State, and discusses further steps in discharging pressure in
the NWZ, overcoming mud invasion in newly drilled wellbores, and further increasing the area of
filtration, the drainage radius, and the use of hydroslotting in conjunction with other completion methods.

Hydroslotter Corporation
Demonstration of Hydroslotter Technology on New York Stripper Wells 19
1. The Near-Wellbore Zone
A hydrocarbon-producing rock formation begins a process of alteration after the stratum is
opened by a drill hole. As the rock adjusts to the presence of the wellbore, there is a transformation of the
properties in the collector immediately around the wellbore. The part of a collector adjusted to the well,
where the quality of reservoir has been changed, is called the near-wellbore zone (“NWZ”). The most
important practical impact of this process is the reduction of permeability of the collector in the NWZ.
The NWZ appears in various forms, especially in fractured and fractural-porous reservoirs, but in
practice, it is accepted as cylindrical in shape and is characterized by a relatively uniform radius and
height. For hydrodynamic calculations, in the absence of core samples and other physical materials with
which to test under laboratory conditions, the actual properties of the zone cannot be used. Instead, for
the simplification of hydrodynamic calculations, the formation rock inside the NWZ is mathematically
considered to be homogeneous and isotropic. Therefore, the hydrodynamic effects are estimated as if the
rock was homogeneous, and this causes calculations to differ seriously from the real characteristics of the
rock formation in the NWZ due to the actual heterogeneity, fluid movement, and non-isotropic stress.
The sizes and parameters of the NWZ change constantly throughout all the periods of a well’s
existence, from the state prior to drilling, to the drilling of adjacent wells, to the eventual plugging and
abandonment. The diameter of the NWZ ranges from less than a meter (approx. three feet) to rarely
exceeding a few meters, in porous formations. The condition of the NWZ defines the hydraulic
relationship between the well and the reservoir; despite its small size, it is the largest single influence on
well productivity. A large decrease in permeability in this zone during drilling or long-term preservation
of the well could lead to complete isolation of the well from the reservoir.
There is general agreement that wells drilled a longer time ago contain NWZ with greater damage
and size than in those wells drilled recently. Advancements in the oil and gas E&P industry have led to
better drilling methods to reduce compression of the rock in the NWZ, better drilling muds to reduce

Hydroslotter Corporation
Demonstration of Hydroslotter Technology on New York Stripper Wells 20
chemical and physical effects on the reservoir, and better perforation, fracturing, and other well
completion techniques to reduce plugging of porous channels by fines and emulsions.
There are a number of stimulation methods used for the remediation, recovery and/or increase of
the natural permeability in NWZ. The main methods of recovery or remediation include open flow
drainage, pumping of surface-active materials and thermal influence. The most widely used methods to
increase permeability include acid treatment and hydraulic fracturing.
Open flow drainage is the most widely applied method of well completion, providing good results
during well completion, especially in highly permeable collectors or those with relatively low penetration
of drilling mud. In low permeability collectors, open flow drainage cannot provide such positive effects
on its own and other methods need to be used.
Surface-active materials applied to the NWZ can eliminate emulsions, reduce clay-type minerals
swelling, and destroy fines or asphaltenes in the filtration channels and phase boundaries (gas/oil/water),
all of which promote a renewal of natural permeability. Generally, surface-active materials are used
jointly with other methods since their effectiveness on their own is not high enough.
Thermal methods are increasingly used in heavy oil collectors to reduce oil viscosity and clear the
filtration channels of paraffin or other resinous substances.
Acid treatment is widely used and is highly effective. The main disadvantage of acid treatment is
economic and related to the necessity of hydraulic connection between the well and reservoir, as well as
the fact that there is no single treatment for all collectors, especially in the case of heterogeneous
reservoirs. Besides this, when acid treatments fail, the ensuing decrease in collector permeability is often
irreversible. In numerous cases, this is just a result of incomplete removal of the reaction products,
especially in terrigeneous collectors.
Hydraulic fracturing creates bottom-hole zone fractures by injecting liquids at high pressure. Of
all the methods, it is the most technical and complex. Special proppant material, such as frac sand, is
added to liquid or gels, in order to fix open the apertures of the cracks. This is the most effective method
of increasing well productivity because the depth of influence extends up to tens or even a few hundred

Hydroslotter Corporation
Demonstration of Hydroslotter Technology on New York Stripper Wells 21
meters. However, the main deficiency of this method, of course, is the absence of control, direction, and
manipulation of the fracture(s). For example, a fracture will propagate in the most permeable rock of a
heterogeneous collector; orientation of the fracture is defined by the natural complex stress-strain
condition of the rock and orientation of natural fracturing; often the direction and extent of a fracture
cannot be predicted, especially in newer, softer deposits. The uncontrollability of the hydraulic fracturing
process can lead to the unwanted spreading of cracks to water-saturated collectors.
None of the present methods listed above eliminate the original reason for the decrease in
collector permeability – stress concentration around the near-wellbore zone.
2. The Relationship of Formation Pressure and Permeability.
The critical role of pressure on permeability. The major sources of natural formation pressure are
overburden, tangential, and lateral (pressure from all sides). The deeper the formation, the greater is the
pressure. In a well, or more specifically the near-wellbore zone (“NWZ”), the pressure that requires
being relieved is the difference of the overburden and hydrostatic pressures. For example, at a depth of
1000m (3300ft.), the pressure to be relieved might be 250atm – 100atm = 150atm (3700psi – 1500psi =
2200psi), to achieve proper unloading of the stress in the NWZ. Bearing in mind that the density of rock
increases by 1% and porosity decreases by 1% for every 100m (330ft.) of depth; permeability declines at
a much higher rate, approximately 10-20% per 100m (330ft). For example, if permeability at 1000m is 1
Darcy, then at 1500m (5000ft.), it will be one-third to one-half less, yet the hydrostatic pressure will only
have increased by 50atm (750psi). Therefore, in a lower zone of the same productive layer, but 500m
(1700ft.) deeper, the well productivity will be proportionally less due to this decrease in permeability.
An illustration of the critical role pressure plays on inflows of fluids is shown by the fact that the
different geometry introduced into the formation by drilling, doubles the pressure on the wellbore. In our
example, if the efficient formation pressure at 1000m (3300ft) is 150atm (2200psi), the pressure on the
wellbore walls will be over 300atm (4400psi). This is identical to a pressure increase that would be

Hydroslotter Corporation
Demonstration of Hydroslotter Technology on New York Stripper Wells 22
expected if the formation depth was tripled, i.e. if the well was deepened from 1000m (3300ft.) to 3000m
(9900ft.). There is a proportional drop in porosity, and likewise a drop in inflow of fluids. Conversely, if
a method could remove or reverse this pressure, it would be identical to a pressure decrease that would be
expected if the well was half as deep, from 1000m (3300ft.) to 500m (1700ft.).
The stress dependence of permeability is well established for hydrostatic stress state in laboratory
experiments under confining pressure. Compilation of some published data on a variety of rock types
(Gray and Fatt, 1963; Marmorshteyn, 1975; Yale, 1984; Walls et al, 1982; Morrow and Byerlee, 1988)
clearly demonstrates that rock matrix permeability decreases with increasing pressure and the magnitude
of this reduction is related to initial, low pressure permeability values. Permeability reduction curves
basically cluster rock types into two major groups (1) granular reservoir rocks with higher porosity and
initial permeability; and 2) low porosity/low permeability rocks with micro-crack related permeability.
The decrease in permeability caused by stress is much greater in the latter rock type and can reach
reduction 70 to 90% reduction at a very moderate mean stress of 100-150atm (1500-2200psi).
State of pressure around the wellbore. The drilling of a wellbore alters the pressure regime in the
NWZ from an isotropic state to anisotropic compression. The wellbore, the dominant factor in
determining near-wellbore stress, exerts considerable negative influence on permeability. The greater the
distance from the wellbore, the less will be the influence of the compressive and radial stresses caused by
the wellbore on the formation; at some distance the stresses caused by the wellbore will equal the stress
condition of the rock in its natural state, which can be approximated as hydrostatic pressure. The deeper
the well, the farther out from the wellbore will the zone exert its influence to its derivative limit; the stress
regimes in the zone of influence will dilate proportionally. Additionally, in all types of rock, the greater
the natural hydrostatic pressure, the less is the natural permeability and the possibility of inflow of fluids.
To calculate stress around a cylindrical hole at a certain depth z one needs to know the
overburden pressure Pz = µgz, where µ is the bulk rock density, g is 9.8 m/s2. There are also two
principal horizontal stresses Px (lateral pressure) and Py (tangential pressure), whereby P1 = Px + Py + Pz.
For deep wells in sedimentary basins characterized by extensional paleotectonic regime the stress state
Hydroslotter Corporation
Demonstration of Hydroslotter Technology on New York Stripper Wells 23
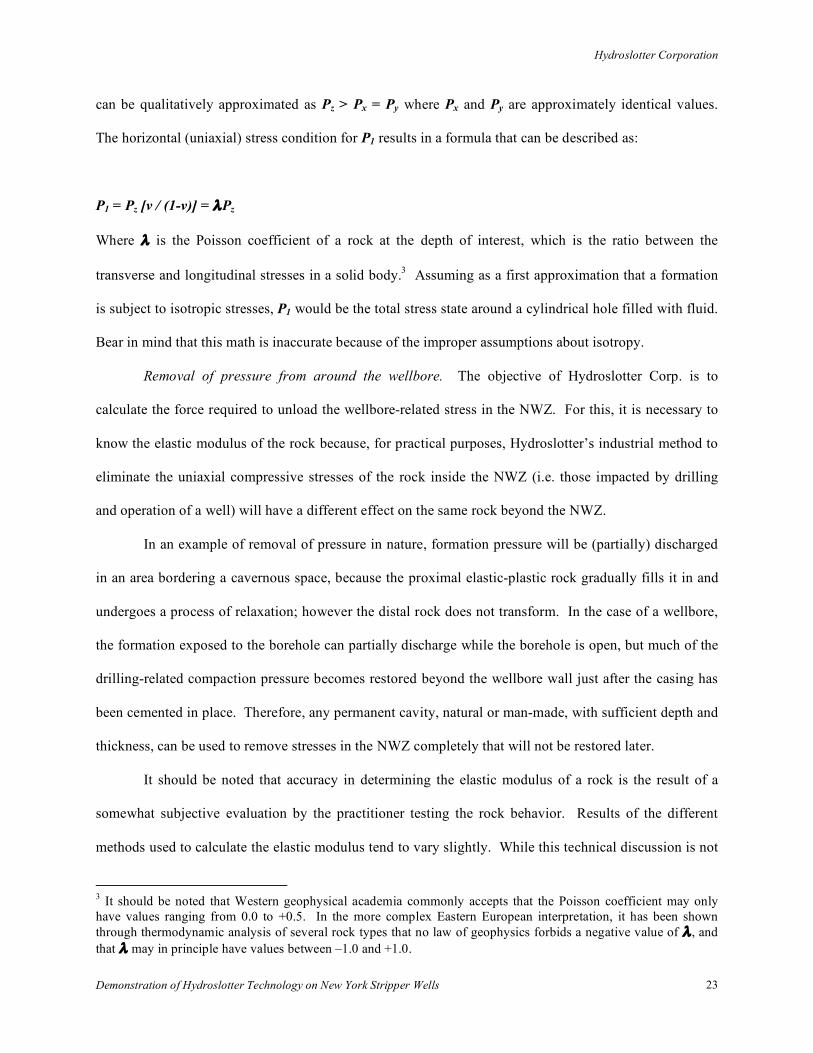
can be qualitatively approximated as Pz > Px = Py where Px and Py are approximately identical values.
The horizontal (uniaxial) stress condition for P1 results in a formula that can be described as:
P1 = Pz [v / (1-v)] = λPz
Where λ is the Poisson coefficient of a rock at the depth of interest, which is the ratio between the
transverse and longitudinal stresses in a solid body.3 Assuming as a first approximation that a formation
is subject to isotropic stresses, P1 would be the total stress state around a cylindrical hole filled with fluid.
Bear in mind that this math is inaccurate because of the improper assumptions about isotropy.
Removal of pressure from around the wellbore. The objective of Hydroslotter Corp. is to
calculate the force required to unload the wellbore-related stress in the NWZ. For this, it is necessary to
know the elastic modulus of the rock because, for practical purposes, Hydroslotter’s industrial method to
eliminate the uniaxial compressive stresses of the rock inside the NWZ (i.e. those impacted by drilling
and operation of a well) will have a different effect on the same rock beyond the NWZ.
In an example of removal of pressure in nature, formation pressure will be (partially) discharged
in an area bordering a cavernous space, because the proximal elastic-plastic rock gradually fills it in and
undergoes a process of relaxation; however the distal rock does not transform. In the case of a wellbore,
the formation exposed to the borehole can partially discharge while the borehole is open, but much of the
drilling-related compaction pressure becomes restored beyond the wellbore wall just after the casing has
been cemented in place. Therefore, any permanent cavity, natural or man-made, with sufficient depth and
thickness, can be used to remove stresses in the NWZ completely that will not be restored later.
It should be noted that accuracy in determining the elastic modulus of a rock is the result of a
somewhat subjective evaluation by the practitioner testing the rock behavior. Results of the different
methods used to calculate the elastic modulus tend to vary slightly. While this technical discussion is not
3 It should be noted that Western geophysical academia commonly accepts that the Poisson coefficient may only have values ranging from 0.0 to +0.5. In the more complex Eastern European interpretation, it has been shown through thermodynamic analysis of several rock types that no law of geophysics forbids a negative value of λ , and that λ may in principle have values between –1.0 and +1.0.

Hydroslotter Corporation
Demonstration of Hydroslotter Technology on New York Stripper Wells 24
directly important to the subject of the report, the general conclusion that requires transfer is that the
compaction in the entire depth of the NWZ must be neutralized, or if possible reversed, for the
hydroslotting effect to be optimized.
The depth and thickness of such a cavity can be calculated. In general, it can be said that the zone
of influence of the NWZ in elastic rock types extends outwards about two to three wellbore radii from the
wellbore. In elastic-plastic rocks, the zone of influence extends deeper into the formation, but the
maximum stress level does not abut against the wellbore. The maximum size and magnitude of a man-
made cavity that exceeds the size and magnitude of the NWZ, i.e. at the limit of collapse, can be predicted
using the Basin ratio, ϑ , which becomes a critical parameter in designing hydroslot structures in wells
with abnormal formation conditions, such as those that are high-pressured, mobilized, or unconsolidated.
Stress state around the hole with symmetrical longitudinal slots. The hydroslotting method
designs two fairly deep, artificial cuts parallel to the well axis across the whole thickness of the potential
pay zone. The effectiveness of this novel well completion technique is expected to be especially high in
low porosity/permeability gas reservoirs wherein the production rates are strongly influenced by fracture
permeability and formation damage. The theory is that the symmetric cuts relieve the radial stress around
the hole, bypass the formation damage zone, increase the drainage surface, and, as a consequence of all
these effects, significantly increase reservoir permeability. In what follows, we will discuss the physical
basis for this technique, geological prerequisites of its most effective utilization, and some representative
field results.
The schematic drawing of the situation is shown in Figure 1. Given a sufficient aperture 2t of the slots,
the hole with the two symmetric slots can be approximated by a straight cut with dimensions in the
vertical plane 2a by 2b.

Hydroslotter Corporation
Demonstration of Hydroslotter Technology on New York Stripper Wells 25
Figure 1: the stress state around a wellbore with longitudinal cuts.
2b 2t
2a
z x y
P1
d
2d 2d
P1
Figures 2(a) and 2(b) demonstrate the transfer of near-wellbore stress (in red) away from the near-wellbore zone out to the distant tips of the hydroslotter slots. Note that near-wellbore permeability from hydroslotting has increased to 5.0 times the original in situ permeability potential of the zone of interest of 1.0, compared to a decrease in permeability to 0.1 from standard perforation.

Hydroslotter Corporation
Demonstration of Hydroslotter Technology on New York Stripper Wells 26
If 2b/2a >= 2, the stress calculation around the cut is reduced to a plane strain problem solved by
Muskhelishvili (1953):
Where the Cartesian coordinates x, y, and z are oriented with respect to the cut as shown in Figure 1. The
slot, unlike a circular hole, results in a significant stress relief of the productive bed in the y-direction, i.e.
perpendicular to the cut. This is shown in Figure 2(b). Note that (i) all three stress components are
subject to reduction, (ii) the most dramatic effect is achieved for the Px stress component (2.5 fold
reduction on the wellbore wall) and (iii) the stress relief zone extends deep into the productive bed (up to
10 borehole radii). The minimal aperture 2t of the slot that would prevent the tips of the hydroslot from
closure for an elastic, isotropic bed in an isotropic field is given by (Nordgren, 1972):
2t =
For example, a slot with x-axis dimensions of 2a = 1 meter, at a depth of 3000m, where v = 0.25 is the
Poisson co-efficient and E = 5GPa is the Young modulus of the formation zone, one obtains 2t = 18mm.
It is noteworthy that while the minimum aperture required to enhance stress relief is 2t, for practical
purposes, the ratio of the aperture to the wellbore diameter exceeds 15 times, d/t >= 15. By increasing the
depth of the zone of interest to 7000m, the required dimensions become a = 50cm, b = 1m, and t =
36mm. The maximum concentration of stresses decrease between 20 and 40 times. There is no need for
a subsequent hydraulic fracture to induce greater near-wellbore permeability.
2a(Pz – P1)(1 – v2) E
(Px + Py) 2 Pz =
(y4 – 1)(1+ 2y2 + y4 – 4y2cos2θ) (y4 – 2y2cos2 θ + 1)2 Px = Pv – (Pv – Pf ) [ 1 – ]
(y2 – 1)3(y2 + 1) (y4 – 2y2cos2θ + 1)2 Py = Pv – Pf [ 1 – ]

Hydroslotter Corporation
Demonstration of Hydroslotter Technology on New York Stripper Wells 27
Effect of the stress state on reservoir permeability. Interesting that, unlike the cylindrical hole,
the artificial cut leads to a pronounced reduction in the vertical stress which is beneficial in terms of
including bedding-parallel micro-fissure permeability.
By making use of the stress distribution around the hole before and after cutting, one can map the
permeability as a function of distance away from the wellbore wall. For practical purposes of estimating
the effect of hydroslotting on the predicted rate of hydrocarbon production, it is probably sufficient to
visualize that the wellbore radius has expanded by several radii into the near-wellbore zone, where the
permeability around the hydroslot interval of the wellbore will be greater than that in the undisturbed
reservoir. The radius of this zone will be greater than the radius of effective permeability reduction due to
the former tangential stress around the cylindrical hole.

Hydroslotter Corporation
Demonstration of Hydroslotter Technology on New York Stripper Wells 28
Appendix B: Typical Hydroslotting Procedure
The objective of the procedure is to clean out the well to below the pay zone; log well and
correlate production zones; slot selected intervals; and return the well to production. Safety is
the first priority in the operation and maintenance of the hydroslotter.
Surface Equipment Checklist
Hydroslotter plus accessories
Workover Rig w/ shaker pit
Tanks to hold 2 wellbore volumes
High Pressure Pumping Unit(s) (5,000 psi)
Sand Blender w/ filters
Blow-Out Preventer (B.O.P.)
Tubing to depth of well (pressure 6,000+ psi
Additional tubing – 10 joints
Casing scraper – OD fits casing ID
Pup joints – two each of 2 ft., 4 ft., 6 ft.
Logging unit (Gamma / CCL service)
Pressure gauges and Valves – 2 each
Completion fluid
Quartz Sand 20/40 mesh
Gauge Ring
LAYOUT OF SURFACE EQUIPMENT
1. Wellhead
2. Pulp-cleaning filter.
3. Manifold unit.
4. Pump set.
5. Sand-mixing set.
6. Tank.

Hydroslotter Corporation
Demonstration of Hydroslotter Technology on New York Stripper Wells 29
Step-by-Step Procedure Checklist
1. MIRU workover or service rig. Spot rig, pump & miscellaneous equipment.
2. POOH with old tubing and packer. If applicable clean out cement retainers, bridge plugs, etc.
with power swivel, drill collars and metal muncher mill. Circulate junk to top and remove.
3. RU surface equipment to enable circulation of completion fluids and slurry. Reverse flow
connections are helpful but not necessary, i.e. forward and reverse circulation. All surface
equipment is connected with the block manifold configured to allow formation sludge to be
removed during the hydroslotting operation. Filters installed throughout connections to enable
changing mid-process without stopping circulation.
NOTE: Ensure wellhead fitted properly with standard blow-out prevention equipment (B.O.P.).
4. Tally & drift in hole with gauge ring on end of tubing to PBTD. Pull up off bottom.
5. Circulate hole with clean working fluid. Circulate bottoms up or until free of all debris in #1
(if applicable). POOH.
6. Tally & PU fully assembled hydroslotter machine DHA. Select positioning of hydroslotting
DHA (to be determined and coordinated by HSC) to lowest zone to be slotted.
7. RIH with Hydroslotter DHA on end of 1 jt. Tubing, 2 x 2’ pup joints, and remaining tubing.
8. Circulate well at low pressure to re-check that wellbore is clean.
9. RU high-pressure surface equipment in accordance with HSC recommended design, including
pump, blender, and recorder unit. Manifold in tanks, lay hard line to tubing. All equipment is to
be reviewed by HSC on location.
10. Hold safety meeting with all personnel. Review job and all safety issues. Review
parameters.
11. Pressure test tubing to 5000 psi for leaks using Hydroslotter test sub in DHA. Pressure down.
If test good continue; if not, replace failed joints.
12. RU wireline unit with Neutron / gamma ray / collar locator logging tool. RIH & log with
locator tool in target interval(s) & pay zone(s). Use centrator to orient direction of tool.
13. Pressure up tubing and correlate log again to 2 x 2’ pup jts. Use centrator to orient direction
of tool. Calculate & verify tubing stretch / shrink.
14. RD wireline loggers.

Hydroslotter Corporation
Demonstration of Hydroslotter Technology on New York Stripper Wells 30
15. Correct placement and direction of hydroslotter DHA across selected first target interval at
bottom of pay zone according to logs & centrator.
16. Close safety valve and pressure hard line.
17. Wash well and test pressure, flow for different scenarios and test surface equipment with
6,000 psi. Follow pump operator’s recommendations for pumping procedures. Lay return line
from backside to return to pits.
18. Forward circulate working fluid 1x tubing volume. Drop hydroslotter working ball to seal
off opening in bottom of hydroslotter and allow ball to seat. Set pressure to 1.3 times the pre-
calculated working pressure (P).
NOTE: Operation should do mechanically what was calculated mathematically in pretreatment
analysis, which is to optimize working pressure P. If P is approximated but not optimized, it
is strongly recommended that the hydroslotting operation be re-calculated before proceeding. If
recalculated procedure is not attainable, POOH, reconfigure hydroslotter, start again.
19. Slowly raise circulation to P. If any unexpected, abnormal, or unexplainable pumping
operation occurs, i.e. poor or no circulation, stop operation. POOH, fix problem, RIH again.
20. Function test hydroslotter for five (5) minutes with working fluid at rate of 1 barrel / minute
(bpm) for friction check. Increase pump pressure to 5,000 psi and monitor. Pump until satisfied
with hydroslotter tool performance.
21. Proceed to mix sand and begin slotting of first selected interval. Measure sand concentration
constantly for first ten minutes until concentration has stabilized. Monitor sand concentration
and filters to maintain appropriate sand concentration level.
22. Job to slot from bottom to top of interval. Estimated time is 50 – 60 minutes for each slot.
NOTE: During slotting, HSC engineers will control rate or any other changes to system.
23. Pull up to next slotting position at end of first slot. When hydroslotter is ready to be moved
to next interval, circulation should be started again with necessary P. Hydroslotter machine
remains in well until nozzles are destroyed or until necessary P can no longer be attained.
NOTE: TO PREVENT GETTING STUCK, TIME TO REPOSITION HYDROSLOTTER IN
BETWEEN SLOTS MUST NOT EXCEED FOUR MINUTES. IF REPOSITIONING
EXCEEDS FOUR MINUTES, WORKING FLUID SHOULD BE CIRCULATED AND
CLEANED OF ALL SAND BEFORE OPERATION RECOMMENCES ON NEXT SECTION.

Hydroslotter Corporation
Demonstration of Hydroslotter Technology on New York Stripper Wells 31
24. If necessary P can no longer be attained, POOH. Remove old nozzles and return to step 9.
When replacing nozzles, visually check integrity of hydroslotter machine.
25. After slotting, is completed, reverse circulate clean working fluid through hydroslotter
machine 2 wellbore volumes or until no sand appears in fluid returns. Watch for working ball to
come to surface.
26. Re-position hydroslotter tool at initial slotted intervals. Pump chemical reagents to slotted
formation as follows:
i. Pump chemical in tubing
ii. Pump working fluid
iii. Close casing head valve
iv. Pump working fluid
v. Wait 0.5 hour stop
vi. Bleed off pressure
vii. Open casing and tubing head valve
viii. Circulate well minimum 2 annular volumes of working fluid.
Move up hydroslotter DHA and treat each slotted zone.
27. RD & release pumper / blender.
28. POOH with work string and hydroslotter DHA. LD hydroslotter DHA.
29. RIH with packer & (other production DHA if required). Set & test packer.
30. Nipple down BOP and nipple up production tree / pumping head assembly.
31. RU swab unit to swab well. Swab well until flow starts on its own. Solids from slotting
process must be removed to prevent damage to rod pump in the case of an oil well.
32. Return well to production and monitor.
33. Disassemble hydroslotter according to standard procedure. Wash and dry hydroslotter.
Clean all working surfaces with diesel. Polish if necessary. Cover all parts with lubricant to
prevent rust. Check and change if necessary all screws, nozzles, and other worn parts. All
interior parts must be free of scratches, corrosion, or dents. Note any threads or parts damaged
or broken for repair & replacement. Package hydroslotter and prepare for transportation.
34. Mission complete!

1
Demonstration of Hydroslotter Technology on New York Stripper Wells: Report on Geological and Field Data Investigation
The main task of the geological and field data investigation was to estimate the possibilities and methods for gas recovery for Hydroslotter Corporation’s project with the Stripper Well Consortium. In upstate New York, we investigated production wells that are located in two main areas: Genesee County (60 wells) and Chautauqua County (15 wells), where the main production object is the Medina formation, which consists of Early Silurian sandstones; and we investigated all Chautauqua deeper wells for access to the Theresa formation, discussed in its own report. Although this report is based on the results of our analysis of log data and field-geological observations that were received in the process of drilling and exploitation of gas wells in Genesee County and Chautauqua County (mainly), it also represents Erie and Wyoming Counties (practically). Data analysis was difficult due to the blatant absence of minimum necessary initial information that is collected under New York State regulations; for instance, missing well bore diagrams, core sample analyses, full value gas-dynamical analyses, and regular measurements of bottom-hole and reservoir pressures, etc. Initial Data: • Geo-physical Investigation System (“GIS”) Log Results of 43 production wells • Annual gas production for 60 production wells in the period from 1985 to 2003. • The initial reservoir pressure of 18 wells for 1984. • The initial production (gas flow) of 21 wells and bottom-hole pressure of 14 wells. • A geographical map showing the locations of the wells • Another 100 wells are located in the immediate area, but well data was absent. Work Procedure: • Reviewed and analyzed the initial data, especially the log information to estimate gas
saturation intervals and their “filtration-capacitor” characteristics. • Determined the following characteristics about the Medina formation in the area and for each
of the 43 individual wells: the effective thicknesses of gas saturation (HN) and filtration thicknesses (HF), porosity coefficient (m) and gas saturation coefficient (SG).
• Determined possible volumetric gas drainage (Vdr) for 57 production wells. • Determined min./ near-max. drainage radius (Rdr) (for wells where linear gas reserves exist). • Created filtration reservoir model from complex analysis of gas exploitation and log data. Summary of Conclusions and Results: • Determined that total well production is sourced from less than 50% of the entire reservoir. • Displayed methods to increase gas production from the Medina formation by:
• Primary completion of existing pay zones using hydrojet slotting • Secondary completion by hydraulic fracturing in poor drainage zones even after slotting • Selective exploitation of the top part of the Medina that is currently not the choice for gas
production (by-passed), which contains, on average, 30% of all Medina gas resources, with maximum and minimum ranges from 10 to 70%
• Drilling additional wells drilling in the most prospective zones minimally or not impacted by the drainage of gas from nearby production wells.
1. Characteristics and Properties of the Gas Reservoir.

2
The object of gas production is Early Silurian sandstone of the Medina group. Structurally, the Medina object is confined to a monotonous monocline that slopes downward from the north to the south. The deepest absolute altitude of the lower face of this gas productive layer is in the well Foss 1 (652 ft.) and the highest is in the well George 2 (217 ft.). Therefore, the gas column is 400 ft., if one supposes that those wells are related to the same reservoir. We note, that water saturated sediments in the well Foss 1 are not evolved. The total average thickness of the Medina formation is 100 ft., with variations from 70 to 150 ft. along the area. The main exploitation object is the massive sandstone at the bottom of the group (“Object I”). The thickness of Object I varies from 35 to 85 ft. in different zones, with an average thickness of approximately 50 ft. The shale layer in this object is insignificant. In the upper part of the formation, above Object 1, there is another gas-saturated sandstone with less significance. This part contains, on average, 30% of the in-state gas that is available from the total thickness of the Medina group, with variations between 3-60%. This part of the section was not flow-tested. GIS logs and geological-field well data were used for characteristics of production sediments. As follows from the log data analysis, the porosity of the gas-saturated sandstones varied from 2 to 11% and gas saturation from 20 to 75%. Variation of rock characteristics of parameters m and SG are shown (Figures 1 and 2). For more than 80% of the gas-saturated part of the section, the value m varies in the interval 4-8% and on average is equal to 5.5% for 770 ft. of section. In this section approximately 65% of gas saturated rocks has a value SG of 40-75%, thus the most part of the gas-saturated rocks has value of SG that is inherent to sediments with waterless gas flow. However, approximately 35% of gas-saturated rocks has a gas-saturation of less than 40%. From practice, it is well known that for this value of SG from the well we can obtain water, water and gas, or neither. Water flow for the 20-year period is not registered. Because of the absence of flow test data for each interval, a criterion was developed for maximum possible gas saturated thickness, HN, in other words the layer’s ability to produce gas for the existing exploitation system, and also a criterion for filtration gas in gas-saturated thicknesses, HF. The gas filtration thickness is the layer’s thickness where the process of gas filtration can be described according to Darcy’s Law. First criterion. From analysis of data m and SG, it appears that these two parameters clearly show a correlation for layers where SG is more than 33-35% (depending on porosity) and separated layers for Objects I and II. On Figures I and II, we compare the values WG (WG = m*SG) and m, which also accounts for the correlation above. On Figure I, these parameters are compared for Object I, and on Figure II, for Object I. All points near Line I include rocks with maximum gas saturation; Lines II and III are the average correlation lines for Objects I and II; and all points below Line IV includes rocks with minimum gas saturation, where there is no connection between m and SG. In general, this analysis shows that the rocks in Object I and Object II can be characterized as low porosity granular, mostly hydrophilic, sandstones, with middle and fine grain sizes. From experience, it can be assumed that water and gas flow mobility in this type of rock, below Line IV, are characterized by very low, practically nil phase permeability for gas and water. It is possible that the gas in this rock is in a dispersed phase condition and has no connection to the water. From this rock, gas can still be partially extracted even after reservoir pressure has been

3
significantly reduced. The main feature of these gas-saturated sandstones is that gas saturation strongly depends on the elevation level in the section, but also on the characteristics of the producing layer. We can see that the upper object is mostly unsaturated, and this is registered in Object I in the well Kazmak 1. On the contrary, for well Buckenmeyer 2, the sandstone for Objects I and II is characterized as fully gas-saturated. It is possible that this feature of saturation has to do with the fact that the water and gas are not completely segregated in the reservoir. The maximum value of effective thickness, HN, is the sum of all rock thicknesses where SG > 33% (see Table 1). In the future, it would be expedient to check this criterion experimentally, to elaborate all active gas resources and more accurately estimate the exploitation system. Table 1. The main parameters for total and filtration gas reserves for Objects I and II.
Well Name
Object Depth, ft. Altitude, ft. HN (ft) Lg (ft) Lgf (ft) WG WG f
I 1329-1379 399-449 44 1.40 1.30 0.0279 0.0255 DLSP 2 II 1271-1321 15 0.40 - 0.0080 - DLSP 3 I 1330-1372 42 1.38 - 0.0330 -
I 1408-1457 433-482 41 1.29 - 0.0276 DLSP 4 II 1350-1399 14 0.31 - 0.0064 I 1362-1406 39 1.36 - 0.0310 DLSP 5 II 1306-1360 25 0.62 - 0.0115 I 1342-1400 412-470 49 1.62 - 0.0271 DLSP 6
II 1300-1340 12 N.D. I 1402-1454 442-494 50 1.6 - 0.0307 DLSP 7
II 1353-1400 10 N.D. I 1406-1448 456-498 42 1.39 - 0.0333 DLSP 8
II 1370-1404 10 N.D I 1366-1416 411-461 48 1.60 - 0.0320 DLSP 9
II 1310-1354 10 N.D I 1352-1400 442-470 32 0.89 0.59 0.0186 0.0122 DLSP 10 II 1314-1350 10 0.33 - 0.0091 I 1319-1370 389-440 42 1.22 - 0.0240 DLSP 11
II 1258-1311 24 0.60 - 0.0114 I 1320-1370 405-455 47 1.68 1.64 0.0337 0.328 DLSP 13 II 1262-1318 19 0.58 - 0.0104 I 1280-1344 310-434 56 1.86 - 0.0291 DLSP 14 II 1230-1272 9 N.D I 1284-1335 364-415 49 1.79 - 0.0351 DLSP 15 II 1228-1280 28 1.73 - 0.0140 I 1342-1384 404-448 39 1.28 - 0.0308 DLSP 16 II 1300-1336 14 N.D I 1364-1414 414-464 50 1.65 - 0.0330 DLSP 17 II 1310-1360 6 N.D
DLSP 18 I 1378-1420 428-470 37 1.02 - 0.0238 I 1338-1382 386-432 28 0.92 - 0.0210 DLSP 19 II 1310-1320 5 0.012 - 0.0012 I 1366-1410 406-450 37 1.15 - 0.0261 DLSP 20 II 1327-1362 11 0.34 - 0.0097 I 1189-1243 319-373 38 0.92 0.8 0.0170-0.0157 DLFC 1 II 1131-1177 6 0.56 - 0.0023 I 1198-1256 343-401 36 1.39 - 0.0239 DLFC 2 II 1142-1192 22 N.D

4
I 1186-1244 324-382 52 1.28 1.06 0.0197 0.0162 DLFC 3 II 1143-1181 14 0.31 - 0.0082 I 1188-1271 298-381 78 2.18 - 0.0263 DLFC 4 II 1156-1176 14 0.40 - 0.0020 I 1238-1274 358-404 40 1.11 0.92 0.0241 0.0201 DLFC 5 II 1180-1220 10 0.18 - 0.0046 I 1540-1589 500-549 42 1.18 0.82 0.0242 0.0167 Os 3 II 1488-1528 14 0.31 - 0.0077 I 1498-1542 481-530 38 1.27 1.39 0.0189 0.0316 Buck 2 II 1460-1496 16 0.71 - 0.0196 I 1434-1467 33 1.08 0.74 0.0270 0.0185 Kub 2 II 1374-1430 10 0.28 - 0.0050 I 1568-1616 508-566 42 1.48 1.33 0.0308 0.0277 Kurn 1 II 1530-1560 14 0.34 - 0.0113 I 1443-1512 458-527 56 1.58 1.07 0.0229 0.0155 BNT 1 II 1416-1426 5 0.12 - 0.0125 I 1640-1678 528-566 24 0.93 0.59 0.0244 0.0155 BigH 2 II 1590-1637 14 0.38 - 0.0082
Os 2 I 1545-1588 513-556 20 0.49 0.21 0.0113 A.Schm 1 I 1510-1564 538-592 23 0.58 0.36 0.0107 0.0067
1511-1554 561-604 35 1.80 1.49 0.0419 0.0346 W.Schm 2 II 1474-1508 24 0.84 - 0.0248 I 1175-1228 337-390 49 1.37 1.04 0.0258 0.0196 Zola 2 II 1146-1172 8 0.20 - 0.0078 I 1192-1242 327-377 31 0.84 0.73 0.0167 0.0146 Zola 1 II 1145-118 6 0.21 - 0.0042 I 1646-1674 624-652 15 0.27 0.152 0.0104 0.0054 Foss 1 II 1586-1640 17 0.32 - 0.0060 I 1498-1558 536-596 41 1.66 1.22 0.0276 0.0203 W.Schm 1 II 1447-1495 15 0.49 - 0.0103 I 1208-1246 348-400 29 0.87 0.48 0.0228 0.0126 Snyd 2 II 1153-1203 6 0.18 - 0.0036 I 1376-1420 465-509 10 0.44 0.174 0.010 0.0040 Kazm*1 II 1321-1373 15 0.31 - 0.0066
Kirkm 1 I 1346-1397 435-486 46 1.16 0.81 0.0227 0.0159 I 1483-1531 473-520 46 1.59 1.39 0.0331 0.0289 Buck 1 II 1422-1478 14 0.31 - 0.0056
Guerra 2 I 1521-1549 501-529 24 0.83 0.34 0.0180 0.0074 I 1168-1213 281-326 43 0.83 0.22 0.0181 0.0048 George 2 II 1104-1159 8 N.D I 1548-1592 498-541 38 2.19 - 0.0497 Pariso II 1492-1540 19 0.72 - 0.0179
Meiler 1 I 1530-1578 505-553 48 1.58 1.58 0.0329 0.0329 * Interval perforation 1321-1394 ft, including Objects I and II Second criterion. To determine the filtration thickness, HF, we determined the limited values WG, m and SG, from which we obtained the influx of gas into the existing production system. Table 2 shows how WG, m and SG, were determined, for more possible values. Maximum values of the limited parameters correspond to the maximum values of WG, m, and SG in the intervals of perforation from where gas was extracted. In this way, the average values of WG*, m*, and SG*, are from productive sections of wells where gas was extracted, from layers with relatively low required parameters (Table 2). Maximum values of the limited parameters

5
are WG* = 2.7%, m* = 5.0%, and SG* = 54%. According to lithological classification, possible permeability for this rock is 1.3md. The probable value of the limited parameters taken from results of estimation of maximum WG, m, SG in the condition that for influx, the necessary minimum thickness of an object-collector is 5, 10, or 15 feet. From Table 2 we see that if the minimum thickness in the well is > 10 ft, then probable values for the limited parameters are: WG*=2.0%, m*=4.4%, and SG*=45%. For these rocks, permeability is approximately 1md. The values calculated above do not contradict accepted ideas about conditions of productive formations that have influx of waterless gas and the filtration process can be described by Darcy’s Law. Table 2. Limited values of WG, m and SG, and more possible values. Well Name WG * max/m, % WG * m (%) WG * m (%) WG * m (%) 5ft 10ft 15ft Kub 2 4.0/7.7 3.9/6.6 3.4/6.7 3.1/6.8 from 14ft DLSP 10 3.5/6.3 3.5/7.0 3.2/6.7 2.8/6.2 Meiler 1 4.7/7.3 4.1/6.3 3.8/5.8 3.4/5.3 from 16ft Foss 1 2.5/4.8 2.5/4.8 1.8/4.8 1.8/4.7 George 2 3.1/5.2 3.1/5.3 2.1/4.4 1.8/4.4 Buckm 2 5.6/8.2 4.6/7.1 4.5/6.2 4.4/6.2 DLFC 1 4.4/6.1 3.2/5.7 2.8/5.4 2.6/5.5 Os 2 4.0/6.1 3.2/5.8 3.1/5.8 2.1/5.1 Kirkm 1 3.7/6.4 2.8/6.3 3.2/6.1 2.8/6.3 E.Kazm 1 3.5/6.2 2.3/5.0 2.1/5.6 1.8/4.7 A.Schm 1 3.5/6.5 3.3/6.6 2.8/5.7 2.4/5.4 Min from Wgmfx 2.6/3.1-3.5 2.3/2.8-3.1 2.0/2.1 1.8/2.1 SG *,% 53/60-54 46/50-45 51/48 =45 m,% 4.8-5.2 5.0/5.3 4.4/5.0 =4.4 WG * 2.7 2.5/2.3 2.2/2.5 =2.0 Kmd =1.3 =1.2 =1.05/1.2 =1.0

6
2. Estimation of capacity parameters of gas saturation in the Medina reservoir. According to the log data of the 43 wells, we estimated the capacity parameters: effective thickness (HN) and filtration thicknesses (HF), linear gas reserves in the limits HN and HF respectively, LGi and LGfi, and the concentration of the gas reserves on a unit basis (per foot of total thickness), respectively WG � and WGf� . These parameters are calculated according to the following formulas:
• Values of total line gas reserves for interval -LGi LGi = ΣHNi * WG i • Value of filtration line gas reserves – LG fi LG i= Σ HFi * WG i • Concentration gas reserves on the unit total thickness HO- W WG � and WG f� WG � = LGi / HO
WG f� = LGfi / HO
Practice shows that the parameter WG� , which is the concentration of gas reserves for total reservoir thickness by unit, is a more stable parameter that is commonly used because it enables an accurate evaluation of gas reserves by the volumetric method. Parameter Wgf� is characterized by the variability of the concentration of filtration of gas reserves by space. Enumerated parameters, excluding HF, for Object I, are shown in Table 1. Evaluation of filtration parameters was possible only for wells in which proper data was available. For Object II, the necessary data was absent: often this section does not have log data or other evaluations. Data analysis, shown in Table 1, demonstrates the following. Objects I and II are very not homogenous in the distribution of total and filtration gas reserves by area of reservoir. Research of gas reservoirs shows that even for very big reservoirs with very high filtration-capacity characteristics, the ratio of maximum and minimum WG� is more than 5 (in the case that average reservoir permeability is approximately 100 md). For Object I, the distinction between the best well, Pariso 1, and the worst well, Kazmak 1, is the same (see Table 1), but the sizes of reservoir around the Pariso 1 is small. The biggest value WGf� for this object is in the well W. Schmidt 2 (0.0346) and the smallest is in the well Kazmak 1 (0.004). For Object II, the maximum value of WG � is in the well W. Schmidt 2 (0.0248), and the minimum is in the well DLSP 19 (0.0012). Significant variations of Wg� and WGf by area indicate the high possibility that there are large sections of lithological blocks that have no gas-dynamical connection between them. For the main Object I, the 18 wells in the DLSP group is more homogeneous. For this zone, value variation Wg� is 0.0186-0.0351 with an average of 0.0293. The least homogeneous, by value WG, is the zone around the southern wells Big Hill 1 and Kazmak 1. Object II is less homogenous than Object I. Approximate characteristics of gas reservoir in this Object were

7
derived from the ratio of linear volumes in the Objects I and II, XII= LgII/LgI, because data of layer’s area are not defined. Results of this calculation are given in Table 3a. Table 3a. The ratio of the gas reservoirs between Object II and Object 1 (XII). Well Name XII Well Name XII 2DLSP 0.34 4DLSP 0.23 5DLSP 0.45 10DLSP 0.28 11DLSP 0.51 13DLSP 0.30 19DLSP 0.14 20DLSP 0.30 1DLFC 0.10 3DLFC 0.24 5DLFC 0.22 3Os 0.27 2BUCK 0.50 2Kubik 0.25 1 Kurn 0.24 1BNT 0.08 1 Bid Hill 0.42 2 W.Schm 0.65 2 Zola 0.15 1Zola 0.19 1 Foss 0.80 1 W.Schm 0.30 1 Kazm 1.14 1Buck 0.28 2 Snyd 0.20 1Pariso 0.31 15 DLSP 0.40 4 DLFC 0.18
From this data, it follows that lowest value of XII = 0.008 in the well BNT 1. and the highest XII
= 1.14 in the well Kazmak 1. Value XII for groups of wells that are close together are Table 3b. Wells Range of XII Average Number of wells DLSP 0.14-0.51 0.33 9 DLFC 0.10-0.24 0.18 4 BNT-Buck 0.08-0.50 0.29 3 Bid Hill-Os 0.24-0.43 0.30 5 Foss-Kazm 0.30-1.14 0.72 4 Zola-Snyder 0.15-0.20 0.18 3
For all wells, the average value for the Medina formation (28 wells ) is XII = 0.30. Therefore, Object II can become an additional object for gas exploitation in some of the reservoirs zones. The decision about developing Object II can be made after log analysis in each well.

8
3. Peculiarities of the Medina reservoir structure according to hydrodynamic observations. The amount of hydrodynamic observations in the productive wells is very limited. We have flow tests for three wells, completion reports for 18 wells, where flow and pressure have been recorded, and for 15 wells, the value of initial pressure data. Table 4 shows the results of permeability evaluation according to Dupuy’s formula in the supposition that the wells were revealed completely. For calculation of thicknesses, two values were used – HN and HF respectively, and possible minimum and maximum values for permeability were obtained. On Figures 1 and 2, permeability and volumetric gas saturation are compared. There is not enough data, but even from the data available (just 14 values), a system of double porosity of the Medina sandstone reservoir appears – porosity from pore space in the main gas-saturated volume, and also porosity created by cracks, faults, fractures, or other discontinuities in the earth. On Figures 1 and 2, it is shown that for low values, correlation between permeability and volumetric gas saturation exists as usual for granular rocks. At the same time, for permeability values higher than 10 md, there is no correlation. Therefore, according to the limited data, we can say the following about double porosity: gas-saturated low permeability block matrix (with permeability lower than 6md, averaging approximately 3md) and with added cracks into the matrix, not connected with porosity, but providing significantly increased permeability. Table4. Permeability of Object I according to the initial gas dynamical test of production wells Well Name Initial Flow,
Mcfd Pro, PSI ΔP, PSI ΣHN / ΣHF, ft Kn/Kf, md
1DLFC 790 500 38 36/32 14/15 2DLFC 957 540 30 53/- 17/- 3DLFC 1057 380 76 52/32 10/16 5DLFC 436 460 69 40/29 6/8 18DLSP 315 500 185 37/- 1.7/- 1Bid Hill 623 450 36 30/22 20/27 1BNT 486 480 80 56/40 3.5/5 1Buck 936 530 29 46/25 20/37 2Buck 276 530 38 36/36 6/6 1Kurn 301 570 43 42/38 4.5/5 2Os 322 530 48 20/16 10/12.5 3Os 164 520 41 42/32 3/4 2Kubik 79 450 41 33/29 2/2.5 1Ders 321 580 36 35/- 4.5/-
This conclusion corresponds to other data, which is shown below. Existing data of initial formation pressure (Pro) shows significant differences in Pro values in different parts of the reservoir. Measurements of Pro values varied in the interval 380PSI to 580PSI. To analyze the variations in these initial pressures, we evaluated the ratio of initial reservoir pressure (Pro) and hydrostatic pressure (αp) for two filtration models of the Medina reservoir:

9
1. The reservoir consists of separated blocks with no hydrodynamic connection between them or separated by layers where gas is filtering when the gradient pressure is greater than the initial (critical) pressure - Gg. For this model, the hydrostatic pressure, Pgd, was recorded at the middle point of the perforations, and the corresponding hydrostatic pressure is αP1. 2. The reservoir is one hydrodynamic pool, hydrodynamically connected with water-saturated rocks. Accordingly, the initial reservoir pressure for all wells corresponds to the hydrodynamic pressure at the level of the gas-water contact (we corrected for both the vertical distance between the gas-water contact to the point of measurement and the density of the gas). Accordingly, we named the ratio between reservoir pressure and hydrostatic pressure, αP2. In this variant, for the theoretical gas-water contact, the gas-saturated bed floor was taken from the well Foss 1, the lowest of all the considered wells. Results are shown in Table 5. Table 5. Corresponding reservoir and hydrostatic pressures for the Medina reservoir. Well Name Perforation Interval Pro, PSI αP1/αP2 Initial Prod’n /ΣQ,
MCF/dMMCF 8DLSP 1408-1445 450 0.73/0.63 315/30.2 10DLSP 1358-1394 480 0.80/0.67 546/69.5 13DLSP 1324-1364 450 0.77/0.63 386/60.1 18DLSP 1378-1420 500 0.82/0.70 315/58.7 1DLFC 1190-1238 500 0.95/0.70 790/75.5 2DLFC 1200-1248 540 1.02/076 957/78.7 3DLFC 1190-1238 380 0.72/0.53 1057/159.6 5DLFC 1231-1263 460 0.85/0.64 436/106.0 1BidH 1643-1676 450 0.62/0.62 623/44.2 1BNT 1447-1504 480 0.75/0.67 486/6.7 1Buck 1487-1528 530 0.81/0.74 936/24.4 2Buck 1498-1537 530 0.80/0.74 276/19.0 1Kurn 1570-1610 570 0.83/0.79 301/36.1 2Os 1548-1585 530 0.78/0.73 322/14.9 3Os 1543-1486 520 0.76/0.72 164/21.8 2 Kubik 1434-1467 451 0.71/0.63 79/8.0 1Ders 1503-1539 580 0.84/0.76 321/6.3 1Foss 1652-1672 535 0.75/0.74 -/11.6
From the calculations shown in Table 5, we conclude: • The value of initial reservoir pressure in the most
investigated wells is essentially lower than the hydrostatic pressure for both filtration reservoir models.
• In the drilled area, it appears that there are a number of gas-dynamic, isolated, lithological and tectonic blocks. For geological reasons, the blocks are evidently small sizes: it is practically impossible to find areas where two or more wells have constant initial pressures.

10
• In the closely situated wells, such as the DLSP and the DLFC wells for example, the pressure difference is not caused by some inaccuracy of measurement of reservoir pressure.
Hydrodynamic well isolation with anomalous low pressure indicates the high possibility of local escape of gas, depending on the existence of vertical cracks. The vertical drainage canals properly correspond to large values of total production, ΣQg, from the wells with lower initial formation pressure (See Table 5, Figure 4). As seen on Figure 4. the result is that for the last 20 years of exploration, wells located in zones of low formation pressure obtained maximum gas production. It is clear that registered on the Figure 4, correlation between ΣQg and Pro is complicated by possible detached blocks of different sizes, changing gas-production regimes etc. As previously discussed, this corresponds well to the model of double porosity, deduced from the comparison of permeability data and volumetric gas-saturation. The conclusion about the block structure of the Medina reservoir and the existence of faults or cracks is very important and needs to be checked very carefully.

11
4. Evaluation of the sizes of drainage zones by productive wells. Existing well data for the last 20-year period and results of the processed log data enables us to evaluate of the sizes of drainage zones for productive wells – in the first place for the explanation of the character of exploitation and second, the degree of extraction from the reservoir. These evaluations were made as follows. 1. Evaluation of drainage volume (Vdr) was calculated according to the formula of material balance:
ΣQ= AVdr (Po/Zo- Pk/Zk)293/(273+t), where ΣQ – total gas production from i well, Vdr – drainage volume from I well, Po – initial reservoir pressure, Zo – initial coefficient overpressure, Pk – final reservoir pressure ( taken Pk=80PSI), Zk – final coefficient overpressure; t – average reservoir temperature; A – scale coefficient taken for calculation. 2. Evaluation of drainage area (Sdr) and drainage radiuses (Rdr) were calculated for minimum (Sdr min, Rdr min) and maximum (Sdr max, Rdr max) variants: Sdr min= Vdr/Lgn, Rdr min= (Sdrmin/� )0.5
Sdr max= Vdr/Lgf, Rdr max =( Sdr max/� )0.5
In the calculation of Sdr and Rdr, we assume that the drainage zone has a cylindrical form with the height, Lgn (ft). Calculation of drainage parameters is shown on Table 6. We note that these calculations allow us to presume that:
1. Pressure in the stripped gas-saturated rocks (intervals from which gas was extracted) in the drainage zone of each well depleted to 80psi, independent of individual well characteristic
2. In the drainage zones of the wells, reservoir characteristics remained constant over the whole area and equal to the characteristics that were established according to log data.
3. Gas does not migrate from parts of the reservoir that are not involved in the exploitation, and not included in evaluation linear gas reserves calculation.
Table 6. Calculated parameters of drainage zones for production wells.
Well ΣQ, MCF
Pro, PSI
Vdr, MCF
Lgn/Lgf,ft Sdr/Sdrmax ac
Rdr/Rdr max,ft
3DLFC 159628 380 7505 1.28/1.06 135/163 1360/1550 5DLFC 105951 460 3735 1.11/0.92 77/94 1030/1140 1DLFC 95525 500 2947 0.92/0.80 73/80 1000/1050 2DLFC 78700 540 2188 1.39/1.21 36/41 700/710 10DLSP 69542 480 2290 0.89/0.59 59/89 900/1100

12
13DLSP 60188 450 2119 1.68/1.64 29/30 630/640 18DLSP 58739 500 1813 1.02/0.65 40/63 740/940 1 Big H. 44272 450 1590 0.93/0.59 47/62 800/930 1 Kurn 36171 570 970 1.48/1.33 15/16 440/470 8 DLSP 30234 450 1067 1.39/1.21 18/21 490/630 lBuck 24490 530 700 1.59/1.39 10/12 360/390 3 Os 21853 520 643 1.18/0.82 12/18 390/490 2 Buck 19028 530 544 1.39/1/39 9/9 34/36 2 Os 14951 530 428 0.49/0.21 24/38 570/710 1 Foss 11657 530 327 0.27/0.152 26/50 600/850 2 Kub 8033 450 289 1.08/0.74 7/9 300/340 1BNT 6700 480 219 1.58/1.07 3/5 200/250
1 Ders 6320 580 304 0.98/0.58 7/12 300/390
From Table 6, it follows that drainage parameters can practically define the total gas production and are characterized by very low rates of extraction compared to the total in-state gas of the reservoir. However, the significant variation of parameters complicates the use of average evaluations for characteristics of degree of exploitation of gas from the reservoir. In this connection average evaluations were made about the drainage parameters for 35 wells, using the correlation between ΣQ:Pro (Figure 4), the correlation between Vdr and ΣQg, and also the resulting correlation between Lgn and Lgf . Results of these evaluations are shown in Table 7. For this process of calculation, we selected 53 wells out of all the wells in the area. Table 7. Evaluation of parameters for zones drainage for production wells. Well Name ΣQ, MCF Vdr, MCF Lgn/Lgf,ft Sdrmin/Sdrmax,ac Rdrmin/Rdrmax,ft 4 DLFC 64593 1740 2.18/2.18 18/18 500/500 2DLSP 71159 2550 1.40/1.30 42/45 750/800 3DLSP 53159 1830 1.38/1.20 30/35 630/690 4 DLSP 62842 2070 1.29/1.05 37/45 700/800 5DLSP 38733 1270 1.36/1.10 22/27 550/600 6 DLSP 57412 1975 1.62/1.62 28/28 600/600 7 DLSP 35344 1110 1.60/1.60 16/16 460/460 9 DLSP 73992 2360 1.60/1.60 34/34 680/680 11 DLSP 64971 2330 1.22/0.90 44/60 780/900 14 DLSP 61157 2200 1.86/1.86 2727 590/590 15 DLSP 51282 1840 1.79/1.79 24/24 560/560 16 DLSP 53872 1720 1.28/0.95 31/42 650/750 17 DLSP 65573 2090 1.65/1.65 29/29 620/620 19 DLSP 36577 1235 0.92/0.53 31/54 650/860 20 DLSP 78835 2630 1.15/0.80 53/76 850/1020 lMeiler 29579 2070 1.58/1.58 30/30 630/630 2 Guerra 25485 845 0.83/0.34 23/56 550/900 1 Kazm 14901 495 0.44/0.17 22/57 540/900

13
IKirkm 6516 175 1.16/0.81 3.5/5.0 200/250 lW.Schm 2279 60 1.62/1.62 <1 110/110 2Snyd 24330 830 0.87/0.48 22/40 540/740 lZola 29183 975 0.84/0.73 27/34 600/670 2 Zola 35320 1180 1.37/1.04 20/26 510/600 2 George 30565 1020 0.83/0.34 28/68 600/970 2Wozn 25328 780 - 15/23 440/550 lUrq 18909 580 - 11/17 370/470 lKlosn 11956 370 - 6/10 280/370 1 Gamm 11582 375 7/11 300/380 10s 51353 1700 - 47/62 800/920 1 Graue 35375 1170 - 26/38 590/710 1 Guerra 25929 860 - 57/41 750/900 1 Sharpe 12657 420 - 6/11 280/380 2Foss 7653 255 - 4/7 220/300 1 Ch-Sm 7554 250 - 4/7 220/300 4 Ch-Sm 14667 490 - 40/57 740/900 lFry 23018 770 - 15/23 460/550 3 Hers 37473 1280 - 29/43 620/750 4 Hers 51478 1720 - 40/56 740/890 5 Hers 64817 2160 - 64.778 950/1050 Comparing the radial sizes of different drainage zones show that for wells DLFC 1, 2, 3, and 5, maximum drainage volume (Table 6) often overlaps over each other. The capacity characteristic of the rock of Object II, in these wells only, is approximately equal to the average capacity for Object I. However, when gas exploitation began in each well, their reservoir pressures were different. For the well DLFC 3, which produces the most gas in the area, the initial pressure was the least of all parts of the reservoir involved in extraction (See Table 6). The calculated drainage radius of the enumerated wells suggests with a high probability that gas migration from distant parts of the reservoir with higher pressure. According to the selected 53 wells, it is possible to make a square evaluation of the completeness of gas extraction by the coefficient of drainage: Kdr = Sdr / Sres, where S res – the area of the reservoir from which the drainage coefficient is calculated. The maximum drainage radius for all candidate wells is approximately equal to 1600 ft (Table 6), which is equal to half of the distance usually used in practice for the space between gas production wells. Accordingly, in the reservoir area, for the wells that were closer than 3200 ft, the borders of their zones was taken at 1600 feet from the point of each well’s location. This same condition was widespread for older wells to prevent offsetting gas to other wells, if they were located in the overlapping zone. Further, for all wells of overlapping zones, ΣSdr min and ΣSdr max have been calculated, using data from Tables 6 and 7. For one old well, the value Sdr=60 acres was accepted, corresponding to the average Sdr max for all new wells + 20 acres, where 20 acres is the root-mean-square deviation from average. In Table 8 is shown the results of the Kdr evaluation for 16 allocated

14
zones and in the sum for all zones, including 53 new wells and 21 old wells. Calculations testify to the rather low drainage areas of the reservoir that is obviously caused by the small sizes of blocks comprising the reservoir. Table 8. Sizes of drainage zones for group of productive wells. Well area Square,
ac Quantity of Wells New / Old
ΣSdr, ac max - min
Kdr,% max- min
Choate- Smith 235 2/0 64 - 44 0.27- 0.19 Fry 1-Zola 2 738 4/0 123- 84 0.17 -0.11 George 2 340 1/3 248- 208 0.73- 0.61 Hersee3-4 290 2/0 99 -69 0.34-0.24 Hersee 5 290 ½ 198 -184 0.68- 0.63 DLSP-DLFC 2950 22/3 1340 1095 0.45- 0.37 Wozniak-Urquhart 415 2/2 160 -146 0.38 -0.35 Bontragerl-Buckenmeyer 2 365 3/1 78- 75 0.17 0'15 Big Hill l-Ffammack 1 575 2/2 193 - 174 0.34- 0.30 Kurnik 1 415 1/1 76 - 75 0.18- 0.17 Guerral2-2 340 2/2 271 -213 0.80 0.63 Osuchal-3 Meiler 740 2/2 268 - 233 0.36 0.31 Kubik 2-Kirkman 1 850 ¾ 265- 257 0.31 -0.29 Foss2-Kazmarkl 480 2/0 64- 26 0.13- 0.05 Dersam 1-Schmidt 490 4/0 13 8 0.03 -0.02 Fossl 500 ½ 170- 146 0.30- 0.26 Total 10070 53/21 3323- 3035 0.33 -0.30

15
5. Discussion of results. The lead analysis of data logs and the results of geological field data allows us to categorize the following features of the Medina formation, which characterize the filtration model and allow us to formulate recommendations on the optimization of its development. 1. Object I consists of low-porosity, gas-saturated sandstones (porosity in interval 4-11%; gas saturation 40-70%). Permeability of rocks in the interval is 1-20 md. Gas-saturated rocks, visibly, have the double porosity system: matrix with permeability 1-6 md, on which cracks are imposed, with permeability of more than 10 md. Object I is characterized by significant non-homogeneity in the drilled zone. 2. Gas is present in the Medina reservoir in the area above of Object I. Productive sediments are the same as the rocks in Object I, which are characterized by very thin layers of sand. The gas reserves of this part of the section account for approximately 30% of the reserves of gas in Object I. These sediments above Object I were drilled in one production well, Kazmak 1, where gas exploitation in this well was made jointly with Object I. 3. The initial reservoir pressure in Object I is essentially different in difference parts of the reservoir and in most wells, the pressure is significantly lower than the hydrostatic. 4. In the closely disposed (nearby) wells, there are significant differences in initial reservoir pressure, from 380 to 540 psi, with distances between wells of 1500 ft. These differences are caused by the local escape of gas from the reservoir through vertical filtration canals (faults). 5. In Object I, there is a significant correlation between the total gas production by a well and the well’s initial reservoir pressure. The maximum gas production of any well was obtained from the zones where the initial reservoir pressure was the lowest. 6. The total gas production from the wells is defined by the existence of vertical faults or cracks and the existence of gas-saturated rocks with relatively higher capacity-filtration characteristics. Lower total gas production is caused by a lower quantity or degree of cracks in the rocks. 7. Geophysical characteristics and the functionality of a well indicates with a high degree of probability that well productivity is determined mostly by the number of cracks in the zone near the well’s location. Probably, the cracks in the reservoir and the existence of filtration canals (faults) in the sediments above Object I (possibly they had permeability only during a period of tectonic activity) caused gas to escape prior to commercial gas exploration. The reservoir represents a set of blocks, between which there is no hydro-dynamical communication. Thus the level of total gas production is defined by the sizes of the blocks and the degree of faults. 8. If the represented model of the reservoir can be confirmed, then it will be possible to expect an important increase in gas extraction, after revealing the zones of development cracks and hydro-dynamically isolated blocks. 9. In several parts of the reservoir, it is prospective to begin exploiting Object II.

16
6. Conclusions. 1. The results of our analysis show that within this reservoir, there exists significant gas reservoirs not currently involved in exploitation. 2. Object I is characterized by block structures and the existence of local zones of intensive cracks. 3. It is expedient to use distance methods (satellite or aerospace imaging) to reveal cracks in the zones available for drilling and add these results to the existing information about the Object. 4. To directly check the hydrodynamic isolation of the reservoir and the volumes of gas not currently involved in drainage, we need to complete a hydrodynamic flow test of the well Pariso 1, still not perforated. The well is located in sufficiently favorable conditions. The works should include perforation and an open flow test after the well has been shut-in 5-10 days. 5. It is expedient to carry out repeated or secondary hydrodynamic tests for the with the object of preservation control of filtration canals, made by commercial hydro-fracturing. This is especially important in wells with lower initial reservoir pressure and relatively small total gas production. On the basis of this data, we may develop a program for increasing the gas recovery rate and completeness of its extraction from the reservoir, and drill additional new wells. 6. Recommendations for hydrojet slotting are favorable, including all wells in Table 1, plus other wells in the surrounding Counties (if opportunity arises). Priority wells are shown in Table 9, including sections of preference. Note that, when it is prospective to enter a section, completion of hydrodynamical testing is necessary.