Demonstration of Critical Systems for Propellant ... of Critical Systems for ... hopper vehicle...
17
American Institute of Aeronautics and Astronautics 1 Demonstration of Critical Systems for Propellant Production on Mars for Science and Exploration Missions Diane L. Linne 1 , James R. Gaier 2 , Joseph G. Zoeckler, 3 and John S. Kolacz 4 NASA Glenn Research Center, Cleveland, OH 44135 Robert S. Wegeng 5 and Scot D. Rassat 6 Battelle Memorial Institute, Richmond, VA 99352 and D. Larry Clark 7 Lockheed Martin Space Systems, Denver, CO 80201 A Mars hopper has been proposed as a Mars mobility concept that will also demonstrate and advance in-situ resource utilization. The components needed in a Mars propellant production plant have been developed to various levels of technology maturity, but there is little experience with the systems in a Mars environment. Two systems for the acquisition and compression of the thin carbon dioxide atmosphere were designed, assembled, and tested in a Mars environment chamber. A microchannel sorption pump system was able to raise the pressure from 7 Torr to 450 Torr or from 12 Torr to over 700 Torr in two stages. This data now provides information needed to make additional improvements in the sorption pump technology to increase performance, although a system-level analysis might prove that some amount of pre- or post-compression may be a preferred solution. A mini cryofreezer system was also evaluated as an alternative method for carbon dioxide acquisition and compression. Finally, an electrolysis system was tested and successfully demonstrated start-up operation and thermal stability of all components during long-term operation in the chamber. Nomenclature ISRU = in-situ resource utilization MACS = Mars Atmospheric Chemistry Simulator PEM = proton exchange membrane PLC = programmable logic controller RGA = residual gas analyzer TSA = thermal-swing adsorption I. Introduction HE concept of using available resources at the exploration site to make propellant and life support consumables, known as in-situ resource utilization (ISRU), is often referred to as a game-changing, but high-risk technology. Most previous efforts at building components or systems of a Mars propellant production plant have focused on a scale suitable for a Mars sample return mission. While a sample return mission is the highest priority of the Mars 1 Senior Research Engineer, Power and In-Space Propulsion Division, MS 301-3, AIAA Associate Fellow. 2 Research Physicist, Space Environment and Experiments Branch, MS 309-2, AIAA Member. 3 Fluid Systems Engineer, Mechanical and Fluid Systems Division, MS 86-12. 4 Electrical Engineer, Electrical Systems Division, MS 86-5. 5 Chief Engineer, AIAA Associate Fellow. 6 Senior Development Engineer. 7 Senior Manager, Spacecraft Technology Development Lab, M/S P0560, AIAA Associate Fellow. T 51st AIAA Aerospace Sciences Meeting including the New Horizons Forum and Aerospace Exposition 07 - 10 January 2013, Grapevine (Dallas/Ft. Worth Region), Texas AIAA 2013-0587 This material is declared a work of the U.S. Government and is not subject to copyright protection in the United States. Downloaded by Diane Linne on January 7, 2013 | http://arc.aiaa.org | DOI: 10.2514/6.2013-587 https://ntrs.nasa.gov/search.jsp?R=20130010980 2018-05-14T17:02:32+00:00Z
Transcript of Demonstration of Critical Systems for Propellant ... of Critical Systems for ... hopper vehicle...

American Institute of Aeronautics and Astronautics
1
Demonstration of Critical Systems for Propellant Production on Mars for Science and Exploration Missions
Diane L. Linne1, James R. Gaier2, Joseph G. Zoeckler,3 and John S. Kolacz4 NASA Glenn Research Center, Cleveland, OH 44135
Robert S. Wegeng5 and Scot D. Rassat6 Battelle Memorial Institute, Richmond, VA 99352
and
D. Larry Clark7 Lockheed Martin Space Systems, Denver, CO 80201
A Mars hopper has been proposed as a Mars mobility concept that will also demonstrate and advance in-situ resource utilization. The components needed in a Mars propellant production plant have been developed to various levels of technology maturity, but there is little experience with the systems in a Mars environment. Two systems for the acquisition and compression of the thin carbon dioxide atmosphere were designed, assembled, and tested in a Mars environment chamber. A microchannel sorption pump system was able to raise the pressure from 7 Torr to 450 Torr or from 12 Torr to over 700 Torr in two stages. This data now provides information needed to make additional improvements in the sorption pump technology to increase performance, although a system-level analysis might prove that some amount of pre- or post-compression may be a preferred solution. A mini cryofreezer system was also evaluated as an alternative method for carbon dioxide acquisition and compression. Finally, an electrolysis system was tested and successfully demonstrated start-up operation and thermal stability of all components during long-term operation in the chamber.
Nomenclature ISRU = in-situ resource utilization MACS = Mars Atmospheric Chemistry Simulator PEM = proton exchange membrane PLC = programmable logic controller RGA = residual gas analyzer TSA = thermal-swing adsorption
I. Introduction HE concept of using available resources at the exploration site to make propellant and life support consumables, known as in-situ resource utilization (ISRU), is often referred to as a game-changing, but high-risk technology.
Most previous efforts at building components or systems of a Mars propellant production plant have focused on a scale suitable for a Mars sample return mission. While a sample return mission is the highest priority of the Mars
1 Senior Research Engineer, Power and In-Space Propulsion Division, MS 301-3, AIAA Associate Fellow. 2 Research Physicist, Space Environment and Experiments Branch, MS 309-2, AIAA Member. 3 Fluid Systems Engineer, Mechanical and Fluid Systems Division, MS 86-12. 4 Electrical Engineer, Electrical Systems Division, MS 86-5. 5 Chief Engineer, AIAA Associate Fellow. 6 Senior Development Engineer. 7 Senior Manager, Spacecraft Technology Development Lab, M/S P0560, AIAA Associate Fellow.
T
51st AIAA Aerospace Sciences Meeting including the New Horizons Forum and Aerospace Exposition07 - 10 January 2013, Grapevine (Dallas/Ft. Worth Region), Texas
AIAA 2013-0587
This material is declared a work of the U.S. Government and is not subject to copyright protection in the United States.
Dow
nloa
ded
by D
iane
Lin
ne o
n Ja
nuar
y 7,
201
3 | h
ttp://
arc.
aiaa
.org
| D
OI:
10.
2514
/6.2
013-
587
https://ntrs.nasa.gov/search.jsp?R=20130010980 2018-05-14T17:02:32+00:00Z
American Institute of Aeronautics and Astronautics
2
science community,1 the significant Earth launch mass required currently has this mission priced out of reach. Although the use of in-situ produced propellants can reduce the launch mass and therefore the cost, critical missions such as sample return seldom rely on unproven technologies. Equally unlikely is the prospect of getting a full-scale ISRU plant manifested on a Mars mission as a technology demonstrator alone without the promise of any science return for that mission. Therefore, we have proposed to focus on a low-cost science mission demonstration of in-situ propellants that will provide a stepping-stone approach to build confidence in using them in a sample return.2
This paper presents the test results for three critical systems of a Mars atmospheric processing plant tested in a Mars environment simulation chamber. Objectives included further developing each system to more accurately determine mass and power, and testing each system in the relevant low-pressure carbon dioxide environment to demonstrate performance.
II. Production Plant for Small Mars Hopper Previous research resulted in the design of a small vehicle that can carry with it a production plant while hopping
across the planet to different sites of scientific interest.3 This vehicle will expand our scientific reach and knowledge of the planet while simultaneously demonstrating the effectiveness of ISRU. The small hopper defined in the previous work can travel 2 km every 30 days with an estimated vehicle mass of 60 kg, including an estimated 11-kg production plant and 200-W power system. A 60-kg surface explorer would be 65 percent smaller than the 174-kg Mars Exploration Rovers yet could travel farther in a 6-month mission than Spirit travelled in 6 years. To enable this hopper vehicle production plant components must be small and low power. The critical first step in a Mars atmosphere processing plant is to gather low-pressure atmosphere carbon dioxide (CO2) and compress it by two orders of magnitude so that the chemical reactors can operate more efficiently. The two leading candidates, sorption pumps and cryofreezers, have both initially been designed as large and power intensive options. However, advances by industry have resulted in units that are two orders of magnitude smaller than conventional components through innovations in manufacturing techniques and thermal balance. These lightweight CO2 acquisition devices are the key to proving the viability of a small-scale production plant.
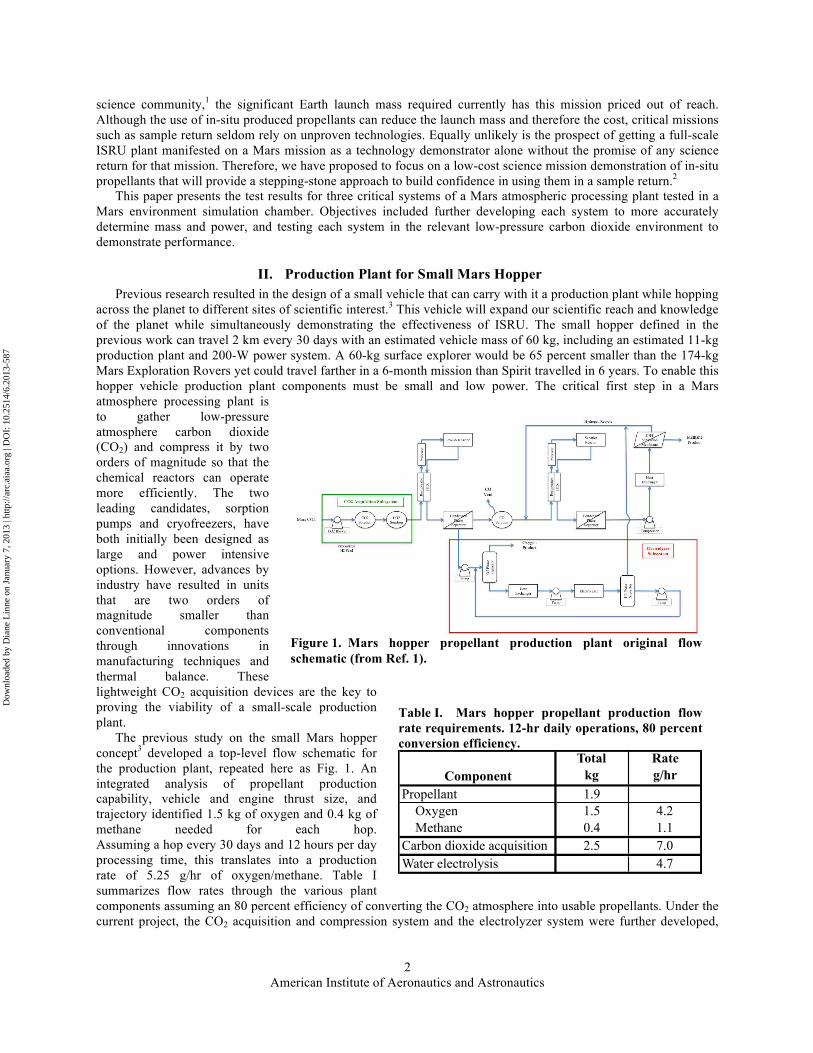
The previous study on the small Mars hopper concept3 developed a top-level flow schematic for the production plant, repeated here as Fig. 1. An integrated analysis of propellant production capability, vehicle and engine thrust size, and trajectory identified 1.5 kg of oxygen and 0.4 kg of methane needed for each hop. Assuming a hop every 30 days and 12 hours per day processing time, this translates into a production rate of 5.25 g/hr of oxygen/methane. Table I summarizes flow rates through the various plant components assuming an 80 percent efficiency of converting the CO2 atmosphere into usable propellants. Under the current project, the CO2 acquisition and compression system and the electrolyzer system were further developed,
Figure 1. Mars hopper propellant production plant original flow schematic (from Ref. 1).
Table I. Mars hopper propellant production flow rate requirements. 12-hr daily operations, 80 percent conversion efficiency.
ComponentTotalkg
Rateg/hr
Propellant 1.9 Oxygen 1.5 4.2 Methane 0.4 1.1Carbon dioxide acquisition 2.5 7.0Water electrolysis 4.7
Dow
nloa
ded
by D
iane
Lin
ne o
n Ja
nuar
y 7,
201
3 | h
ttp://
arc.
aiaa
.org
| D
OI:
10.
2514
/6.2
013-
587

American Institute of Aeronautics and Astronautics
3
built, and tested. For the CO2 acquisition and compression, two alternative technologies, sorption and cryofreezing, were both tested.
III. Test Facility All tests were conducted in the Mars Atmosphere Chemistry Simulation chamber (MACS). To minimize costs,
each system was tested separately, which allowed reuse of many supporting components and instrumentation.
A. Mars Atmospheric Chemistry Simulator The Mars Atmospheric Chemistry Simulator (MACS) is a stainless steel bell jar with a 200-L volume designed
to simulate atmospheric conditions on the Martian surface. One of the key design features is that all of the feedthroughs enter the chamber from the bottom, so the bell can be lifted cleanly off of the base plate. Therefore, all plumbing and electrical connections can be secured while the test equipment is fully accessible. In systems as complex as those described in this study ease of access is critical.
The Viking landers measured Martian atmospheric pressure to vary from 5 – 7.5 Torr,4 with the lower pressures measured during the summer and winter months when appreciable amounts of CO2 freeze out of the atmosphere, and the higher pressures when the CO2 is migrating between the poles. Tests were run using either CO2 or a “Mars gas” mixture that is 95.3 percent CO2, 2.7 percent N2, 1.6 percent Ar, 0.13 percent O2, and 0.07 percent CO which mimics the composition of the Martian atmosphere. The pressure within the chamber was measured using a Granville-Phillips Model 275 convectron. The pressure was maintained dynamically with gas being bled in through a leak valve and removed using an oil-free scroll pump. For the sorption pump and cryofreezer systems, a portion of the outlet gas was bled into a high vacuum sampling chamber maintained at 10-6 Torr using a 10-cm (4 inch) turbomolecular pump. The chamber gas composition was monitored using a Stanford Research System residual gas analyzer (RGA) quadrapole mass spectrometer.
Limited cooling during the sorption pump tests was provided using a 40-cm diameter cold plate cooled with a ethylene glycol/water mixture run through a recirculating chiller to maintain temperatures down to -5 °C. The plate stood about 28 cm off of the surface of the chamber base plate. Similarly, the helium cryocooler was cooled with the same recirculating chiller cooling a 15 cm × 17 cm aluminum baseplate to which the cryocooler was mounted.
B. Control System The production plant mechanical systems required an electrical control system for test sequencing and data
acquisition. To facilitate changeover between the three test setups, a small Programmable Logic Controller (PLC) and graphic operator interface panel were used for control and data acquisition. Wiring between the PLC inputs and outputs (I/O) and the production plant mechanical system inside the MACS chamber was completed for the first test setup, as was the PLC and operator interface programming. After testing was complete, the necessary wiring and programming changes for the second test were made inside the MACS chamber. This was repeated for the third test setup. Even though the number of devices controlled and recorded were small for these tests (less than 30 I/O channels), using a PLC and operator interface made changeovers between tests relatively quick and easy.
Most of the I/O connected to the PLC were used for experiment data. All temperatures were measured using type K thermocouples connected to analog input modules designed for thermocouples. All pressures were measured using capacitance-type pressure transducers that provide a voltage level output to analog input modules. Water flow was measured using a turbine flow meter, and gas flows with digital flow meters (manufactured by Sierra Instruments).
Some test functions were performed more efficiently outside of the PLC and operator interface. The electrolyzer was run manually by applying the required power directly from a low voltage, high current, DC power supply. The voltage and current data was recorded manually. In a similar fashion, the cryofreezer was driven by a stand-alone function generator that provided sine wave excitation of the cryofreeezer amplifier at the proper frequency and amplitude.
IV. Carbon Dioxide Sorption System The CO2 sorption pump was previously designed, fabricated and brought to TRL 4 by Battelle Memorial
Institute on a previous NASA project.5 The unit, pictured in Fig. 2, was designed as an integrated system incorporating micro-channels for heat exchange and meso-channels for the adsorption media, with the close contact of adsorbent and heat exchanger channels allowing for rapid thermal cycling and high CO2 throughput per unit adsorbent and hardware volume and mass. The micro- and meso-channel architecture consists of cells containing arrays of interwoven channels, with “scale-up” being accomplished by “numbering up” several cells in parallel.
Dow
nloa
ded
by D
iane
Lin
ne o
n Ja
nuar
y 7,
201
3 | h
ttp://
arc.
aiaa
.org
| D
OI:
10.
2514
/6.2
013-
587

American Institute of Aeronautics and Astronautics
4
The tendency of an adsorbent to have affinity for sorbed species that varies as a function of temperature and pressure is the basis of the CO2 sorption pump. Selective adsorbents tend to have a higher capacity for a target adsorbent species (e.g., CO2) when cool than when hot. Therefore, thermal cycles in which the sorbent is cooled during adsorption and heated during desorption are a means to capture CO2 at low pressures and subsequently release it in a more pressurized form for downstream processing. This is a thermal-swing adsorption (TSA) thermochemical compression process and is the principle of operation of the CO2 sorption pump.
The throughput or production rate of compressed CO2 in a TSA process is a function of the amount of sorbent in the system, the difference in sorbent capacity for adsorbate in a cooled, highly loaded state and a heated, less loaded state, and the frequency of cycling between these two end states. By cycling rapidly to achieve semi-continual CO2 delivery and sorbent regeneration, the specific productivity of the sorbent [(kg-CO2/s)/(kg-sorbent)] is increased over a conventional long-cycle TSA process. The required adsorbent mass scales linearly with the cycle time. Compact adsorbers are ideally suited to rapid thermal cycles, with entire cycles operating on the order of 2 - 4 minutes5 compared to 100 - 120 minutes for conventional TSA systems. As a result, the mass of sorbent and the device hardware are reduced.
On the previous project, two eight-cell sorption pumps were each fabricated with 15 adsorbent channels and designed to attain a throughput of ~120 g CO2/hr (10-times compression). Titanium was selected as the preferred hardware material in order to minimize hardware mass and make use of titanium’s strongly favorable thermal, chemical and mechanical characteristics. Testing included single-cell (Fig. 3) and eight-cell sorption pump experiments over a range of operating conditions with zeolite 13X as the adsorbent and a CO2:N2 feed at Earth atmospheric pressure. Factors investigated included cycle time, heat exchange fluid flow rate, and CO2:N2 feed gas composition and flow rate. Results included desorbed product gas throughput and composition, temperature profiles, and thermal recuperation efficiency.
Although the device was fabricated and preliminarily tested on the previous project, the project was prematurely shut down because of changing priorities within NASA programs and inadequate data was obtained in order to fully understand the operational characteristics of the system, especially under Mars atmospheric pressure conditions. This made testing of an individual cell within the MACS chamber an excellent opportunity to gather further test results so that improvements can be made to the system design when a funding opportunity presents itself. In particular, gaining additional data will allow us to improve the system simulation model, to aid in
Figure 2. Battelle’s diffusion-bonded, titanium, 8-cell CO2 sorption pump demonstrated at TRL-4.
Figure 3. Single cell sorption unit parted from the diffusion-bonded unit.
Table II. Mars hopper propellant production plant original mass estimates (from Ref. 1).
ComponentMass each
kgQuantity Total Mass
kgCO2 acquisition system 1.54 Gas feed blower 0.24 1 0.24 Microchannel sorption pumps 0.65 2 1.3
Electrolyzer system 2.08 Electrolyzer 1 1 1 Water pumps 0.36 3 1.08
Dow
nloa
ded
by D
iane
Lin
ne o
n Ja
nuar
y 7,
201
3 | h
ttp://
arc.
aiaa
.org
| D
OI:
10.
2514
/6.2
013-
587

American Institute of Aeronautics and Astronautics
5
improving its energy efficiency and to consider a broad range of compression ratios for Mars, such as might be appropriate if a degree of pre-compression or post-compression is provided through the inclusion of a mechanical compressor.
A. Carbon Dioxide Sorption System Design The green box in Fig. 1 above indicates the initial level of detail for the acquisition of the carbon dioxide
atmosphere and compression to pressures slightly above one standard Earth atmosphere. Table II lists the initial mass estimates based on this simplified flow sheet. Figure 4 shows the detailed flow sheet developed for this test program. At the center of the system is a single wedge (cell) from Battelle’s 8-cell sorption pump unit. To minimize pressure restrictions and total volume, a new cover plate was machined out of aluminum and close-mated to a butterfly valve. Carbon dioxide could then flow in through the butterfly valve during adsorption and exhaust out the side of the cover plate during desorption (Fig. 5). The desorbing CO2 then passes through two flow meters outside of the chamber and to a three-way valve. During the adsorption cycle, the 3-way valve directs any excess flow back into the chamber for venting. During the desorption cycle, the 3-way valve directs the evolving CO2 towards a needle valve which was manually controlled to set the desired back pressure. The RGA sample was taken before the gas was exhausted back into the chamber.
A simple muffin fan was used to supply fresh CO2 to the sorption pump. The requirements for the fan are to supply small amounts of CO2, on the order of 10’s of g/min, to the sorption pump with enough capability to overcome any resistance to flow through the microchannels containing the adsorbent. Extensive searching of existing fans, pumps, and blowers revealed that the conditions for this system are fairly unique. While simple fans such as the muffin fan selected are designed to move quantities of gas with small resistances, none were found that defined operation at the low pressures of the Mars atmosphere. Any pumps or blowers that are rated to pull at low pressures are designed as vacuum pumps, which exhaust to atmosphere. Since an outlet pressure only somewhat higher than a standard Earth atmosphere is required to feed the downstream chemical reactors, such a pump would negate the need for the sorption device, but at a significant cost in mass and power. The muffin fan selected is rated for 1000 g/min air with no resistance, 260 g/min developing 4.6 Torr head pressure, and a maximum head pressure capability of 6.2 Torr, all at standard temperature and pressure. However, no information was available for operation at less than 10 Torr of total pressure. The lack of specifications at low pressure operation was a major
Figure 4. Detailed CO2 sorption pump system flow sheet as tested.
Dow
nloa
ded
by D
iane
Lin
ne o
n Ja
nuar
y 7,
201
3 | h
ttp://
arc.
aiaa
.org
| D
OI:
10.
2514
/6.2
013-
587

American Institute of Aeronautics and Astronautics
6
concern in the design, and the initial tests in the test matrix were structured to test the fan’s capabilities at Mars environmental conditions.
In order to provide the thermal swing necessary for the adsorption/desorption cycles, two baths were filled with a 50/50 mixture of water and ethylene glycol. The cold bath was set to -20 °C, and the hot bath was set to 100 °C. Both baths had a pump capacity greatly in excess of the few hundred ml/min required to affect the thermal swing in the sorption pump. Therefore, a recirculating loop was installed for both hot and cold lines to keep the baths at temperature. For the cold system, the recirculating loop passed through the cold plate in the chamber before returning to the bath. Plastic lines were used from the bath up to the 3-way valves controlling the switching of hot/cold fluid to minimize the amount of thermal mass heat sink in the system. However, the metal lines from the three-way valve to the sorption pump, as well as the aluminum cover plate, still provided significant thermal resistance, resulting in much slower thermal response time than demonstrated during initial testing at Battelle where the lines and cover plate were all plastic. This relatively excessive thermal mass will show up as an inefficiency in the overall energy balance of the system and needs to be carefully evaluated in future designs.
Table III lists the mass of each component, including the instrumentation, but not including special test equipment such as the hot and cold baths. The new mass of 4.5 kg is three times the original estimate of 1.5 kg (Table II). While the mass estimate created here is more accurate in that it includes a more complete list of components, these components are all off-the-shelf. System mass is typically significantly reduced from conceptual design phase to flight phase.
B. Carbon Dioxide Sorption System Experimental Results
Initial tests on the heat exchange system were run to identify the optimum cycle time and coolant flow rate to achieve fast temperature swings from hot to cold. Cycle
Figure 5. Single-cell sorption pump connected to butterfly valve, muffin fan, and heat exchanger lines.
Table III. Detailed mass of sorption pump system. Item
Designation Description
SB101 Fan/blower
SV101 valve, butterfly
Sorption PumpSingle cell microchannel sorption pump
SV102valve, solenoid, 3-way, NO, latching
SV103valve, solenoid, 2-way, latching
SV104 valve, 10 turn throttle valve
SV105 3-way valve
SV106 3-way valve
SV107 valve, throttle
SV108 valve, throttle
SV109 valve, throttle
SFM101 flow meterSFM102 flow meter, turbine
Sorption Acquisition System Total
Actual mass kg
0.11
1.07
0.43
0.65
0.51
0.12
0.24
0.24
0.24
0.700.22
4.5
Figure 6. Thermal profiles in single-cell sorption pump.
Dow
nloa
ded
by D
iane
Lin
ne o
n Ja
nuar
y 7,
201
3 | h
ttp://
arc.
aiaa
.org
| D
OI:
10.
2514
/6.2
013-
587

American Institute of Aeronautics and Astronautics
7
time as used here is the time for both an adsorb (cold) and a desorb (hot) period. Previous experiments performed at Battelle on a single wedge with all plastic lines and cover plate determined that a coolant flow rate around 85 mL/min and cycle times of 2 minutes were sufficient to achieve strong temperature swings. The Battelle tests showed that longer cycle times or greater flow rates provided little additional temperature swing (see fig. 3.7 in Ref. 5). However, the addition of short lengths of metal lines and especially the switch to the aluminum cover plate resulted in a much slower thermal response, and after testing several lower flow rates consistent with previous results it was decided to operate the heat exchange system with the maximum attainable flow rate with 4-minute cycle times. Figure 6 shows the thermal profiles obtained in these initial tests.
One variable of interest in the design and operation of sorption beds is the ‘breakthrough’ time, or the time at which the sorbent material is saturated and any additional gas supplied merely flows through the bed. Breakthrough time is typically measured by operating for long adsorption cycles and observing when the downstream flow rate increases sharply, indicating that the incoming gas is no longer being adsorbed. A series of tests were performed to measure the capability of the muffin fan to provide a supply of low pressure gas at a sufficient head pressure to flow through the sorption pump and determine the nominal flow rate that could be expected after ‘breakthrough.’ With the heat exchanger running hot to ensure no adsorption was occurring, the muffin fan was repeatedly turned on and off and the flow meters monitored. No flow rate was observed while the MACS chamber pressure was varied from 7 to 70 Torr (the flow meter minimum reading capability is 0.003 g/min). The sorption pump was then bypassed and the tests repeated. With no resistance in the line, the muffin fan provided a head pressure of approximately 0.2 Torr at 7 Torr chamber pressure, 1 Torr at 70 Torr chamber pressure, and 5.8 Torr at 740 Torr chamber pressure. The only condition that produced a readable flow rate was 0.068 g/min at 740 Torr chamber pressure. Therefore, due to the inability of the fan to produce sufficient forcing flow, a measure for breakthrough time was not possible in tests at the nominal conditions of 7 and 70 Torr starting pressure. Later tests performed with the MACS chamber set at 130 Torr did show a repeatable flow rate of 0.006 g/min with flow through the sorption pump, and a measure of breakthrough time was obtained and will be discussed later in this section.
Initial performance tests on the sorption system were performed using pure CO2 to establish a baseline for later tests with a Mars gas mixture. The RGA confirmed that the sorption pump must be cycled through 3 to 4 temperature cycles before the maximum amount of CO2 was pumped. The cycling was independent of whether pure CO2 or Mars gas was used. This is consistent with two classes of binding sites, one tight binding for CO2 and the other more labile. The tight binding sites must all fill before the more labile binding sites become available. Alternately, binding of CO2 onto the sorbent may open up additional sites.
Use of the sorption pumps to acquire and compress the Mars CO2 atmosphere is envisioned as two-stage compression, with each pump unit providing a compression ratio of approximately 10-to-1. Therefore, tests performed with the MACS chamber pressure set at 7 Torr had a performance goal of 70 Torr outlet pressure. To test ‘second stage’ operation, the MACS chamber pressure was set to 70 Torr, with a target outlet pressure of 700 Torr or greater. Figure 7 shows results from initial tests at 7 Torr chamber pressure, with both 4- and 6-minute cycles. Outlet pressures around 50 Torr were obtained with the 4-minute cycle, and slightly greater than 60 Torr with the 6-minute cycle. During the 4-minute desorb cycles, the pressure was still rising when the heat exchanger flow was
switched back to cold, whereas a pressure peak was reached on the 6-minute cycles. As discussed earlier, a reduction in metal heat-sink mass is recommended to increase the thermal swing rate thereby effecting an increased desorption rate. The figure also shows that during the
Figure 7. Initial sorption pump performance with CO2 at 7 Torr ambient pressure.
Figure 8. Initial ‘second-stage’ sorption pump performance with CO2 at 70 Torr ambient pressure.
Dow
nloa
ded
by D
iane
Lin
ne o
n Ja
nuar
y 7,
201
3 | h
ttp://
arc.
aiaa
.org
| D
OI:
10.
2514
/6.2
013-
587

American Institute of Aeronautics and Astronautics
8
adsorption phase the pressure reading on the outlet pressure transducers dips below the surrounding environmental chamber pressure, with pressures as low as 1.6 Torr at the beginning of each adsorb phase. This downstream pressure rises gradually during the adsorb phase, reaching 4 Torr at the end of 2 minutes of adsorption and 5 Torr at the end of 3 minutes. This sub-atmospheric pressure indicates that the muffin fan was unable to supply sufficient fresh CO2 to keep up with the initial adsorption rate, and therefore some CO2 previously desorbed downstream of the unit was readsorbed on each new cycle.
The flow rate is also shown in Fig. 7. The flow meter had a range from 0 to 0.250 g/min; CO2 flow rates obtained were at the lower limit of the flow meter’s range. The discrete steps seen in the curve result from data values with accuracy to only one significant figure, recorded at a rate of one value every 2 seconds. Flow rates were much lower than anticipated based on tests with the single sorption cell performed by Battelle.5 In the Battelle tests, a vacuum chamber was not available, so tests were performed with CO2 added to nitrogen at a partial pressure equal to the total pressure on Mars (approximately 1/100th of an Earth atmosphere). The data obtained here in the Mars environment chamber can now be compared to the previous data and combined to develop improvements in the sorption pump mechanical design and adsorbent material to optimize performance at a variety of conditions.
Figure 8 shows results from the ‘second stage’ tests with the MACS chamber pressure set to 70 Torr. In these 6-minute cycle tests, outlet pressures ranged from 460 to nearly 500 Torr, for a compression ratio of greater than 7-to-1. At these conditions, peak discharge pressures were reached quickly, within the first 35 – 40 seconds of the desorb phase, and then declined gradually. A sudden drop in pressure and flow rate occurs when each adsorb phase is started, which included opening the butterfly valve to allow fresh CO2 to enter the sorption cell. During each adsorption phase the outlet pressure again drops below the MACS environment pressure, down to as low as 35 Torr, but does come back up and level off at the 70 Torr environment pressure before the end of the adsorption phase. The muffin fan is more effective at the higher ambient
pressure and better able to provide a sufficient supply of fresh CO2. Desorption flow rates reached as high as 0.39 g/min.
Isotherms for the 13X adsorbent are shown in Fig. 9. Solid lines are data supplied by the manufacturer and the dashed lines are interpolations for other temperatures. All three adsorption cycles shown in Fig. 8 occurred at approximately 70 Torr and 5 °C, which should result in 16 g of CO2 adsorbed per 100 g of adsorbent. For the first two desorption cycles in Fig. 8, desorption temperature was about 80 °C and peak desorption pressure was between 470 and 495 Torr. At these conditions (500 Torr and 80 °C), approximately 13.3 g CO2 per 100 g adsorbent should be remaining on the zeolite. However, before the end of the desorption cycle, the pressure had decreased to approximately 350 Torr, allowing more CO2 to desorb, leaving only about 11.6 g CO2 adsorbed per 100 g adsorbent.
Figure 9. CO2 isotherms for zeolite 13X adsorbent.
Table IV. Comparison of theoretical and experimental adsorb/desorb quantities. Flowmeter
CycleTemp °C
Press Torr
Amount absorbed g/100 g
Temp °C
Press Torr
Amount absorbed g/100 g
Amount desorbed g/100 g
Total desorbed
g
Total desorbed
g1, 2 5 67 16 80 500 13.3 2.7 0.32 0.51 - 0.541, 2 6 69 16 80 350 11.6 4.4 0.52 0.51 - 0.54
3 6 70 16 90 90 5.4 10.6 1.26 0.98
Adsorb Phase Desorb Phase Isotherm
Dow
nloa
ded
by D
iane
Lin
ne o
n Ja
nuar
y 7,
201
3 | h
ttp://
arc.
aiaa
.org
| D
OI:
10.
2514
/6.2
013-
587
American Institute of Aeronautics and Astronautics
9
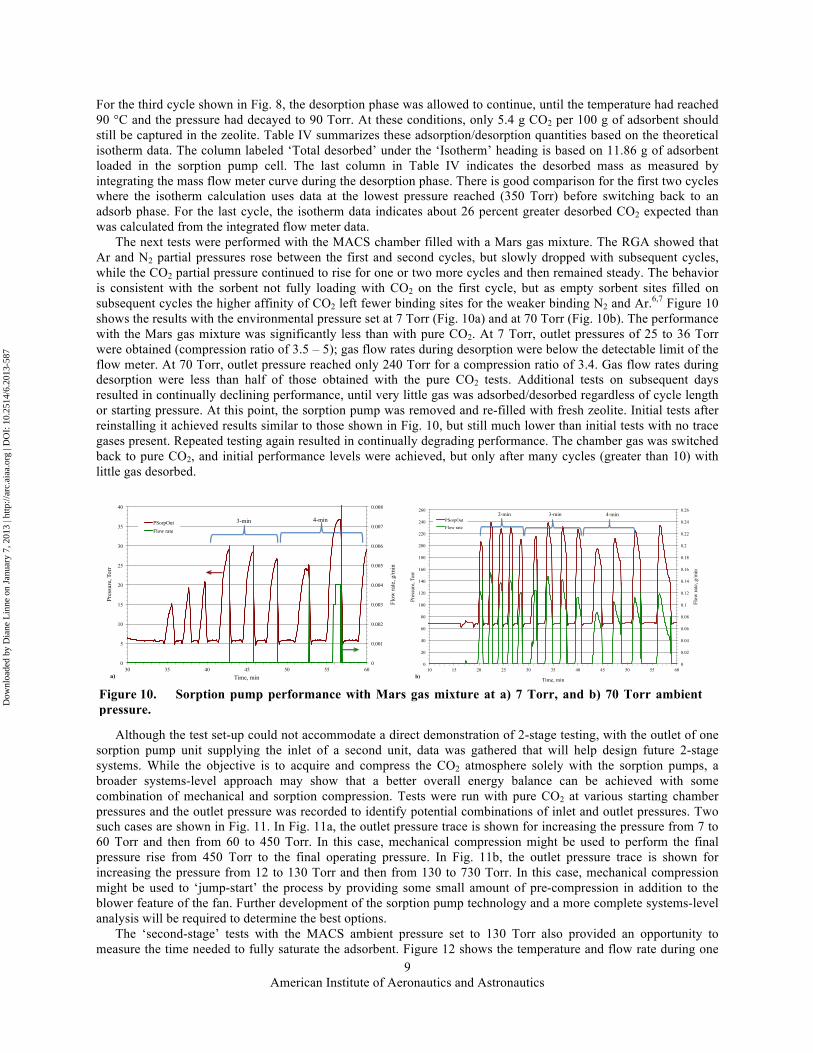
For the third cycle shown in Fig. 8, the desorption phase was allowed to continue, until the temperature had reached 90 °C and the pressure had decayed to 90 Torr. At these conditions, only 5.4 g CO2 per 100 g of adsorbent should still be captured in the zeolite. Table IV summarizes these adsorption/desorption quantities based on the theoretical isotherm data. The column labeled ‘Total desorbed’ under the ‘Isotherm’ heading is based on 11.86 g of adsorbent loaded in the sorption pump cell. The last column in Table IV indicates the desorbed mass as measured by integrating the mass flow meter curve during the desorption phase. There is good comparison for the first two cycles where the isotherm calculation uses data at the lowest pressure reached (350 Torr) before switching back to an adsorb phase. For the last cycle, the isotherm data indicates about 26 percent greater desorbed CO2 expected than was calculated from the integrated flow meter data.
The next tests were performed with the MACS chamber filled with a Mars gas mixture. The RGA showed that Ar and N2 partial pressures rose between the first and second cycles, but slowly dropped with subsequent cycles, while the CO2 partial pressure continued to rise for one or two more cycles and then remained steady. The behavior is consistent with the sorbent not fully loading with CO2 on the first cycle, but as empty sorbent sites filled on subsequent cycles the higher affinity of CO2 left fewer binding sites for the weaker binding N2 and Ar.6,7 Figure 10 shows the results with the environmental pressure set at 7 Torr (Fig. 10a) and at 70 Torr (Fig. 10b). The performance with the Mars gas mixture was significantly less than with pure CO2. At 7 Torr, outlet pressures of 25 to 36 Torr were obtained (compression ratio of 3.5 – 5); gas flow rates during desorption were below the detectable limit of the flow meter. At 70 Torr, outlet pressure reached only 240 Torr for a compression ratio of 3.4. Gas flow rates during desorption were less than half of those obtained with the pure CO2 tests. Additional tests on subsequent days resulted in continually declining performance, until very little gas was adsorbed/desorbed regardless of cycle length or starting pressure. At this point, the sorption pump was removed and re-filled with fresh zeolite. Initial tests after reinstalling it achieved results similar to those shown in Fig. 10, but still much lower than initial tests with no trace gases present. Repeated testing again resulted in continually degrading performance. The chamber gas was switched back to pure CO2, and initial performance levels were achieved, but only after many cycles (greater than 10) with little gas desorbed.
Although the test set-up could not accommodate a direct demonstration of 2-stage testing, with the outlet of one sorption pump unit supplying the inlet of a second unit, data was gathered that will help design future 2-stage systems. While the objective is to acquire and compress the CO2 atmosphere solely with the sorption pumps, a broader systems-level approach may show that a better overall energy balance can be achieved with some combination of mechanical and sorption compression. Tests were run with pure CO2 at various starting chamber pressures and the outlet pressure was recorded to identify potential combinations of inlet and outlet pressures. Two such cases are shown in Fig. 11. In Fig. 11a, the outlet pressure trace is shown for increasing the pressure from 7 to 60 Torr and then from 60 to 450 Torr. In this case, mechanical compression might be used to perform the final pressure rise from 450 Torr to the final operating pressure. In Fig. 11b, the outlet pressure trace is shown for increasing the pressure from 12 to 130 Torr and then from 130 to 730 Torr. In this case, mechanical compression might be used to ‘jump-start’ the process by providing some small amount of pre-compression in addition to the blower feature of the fan. Further development of the sorption pump technology and a more complete systems-level analysis will be required to determine the best options.
The ‘second-stage’ tests with the MACS ambient pressure set to 130 Torr also provided an opportunity to measure the time needed to fully saturate the adsorbent. Figure 12 shows the temperature and flow rate during one
0
0.001
0.002
0.003
0.004
0.005
0.006
0.007
0.008
0
5
10
15
20
25
30
35
40
30 35 40 45 50 55 60
Flow
rate
, g/m
in
Pres
sure
, Tor
r
Time, min
PSorpOut Flow rate
3-min 4-min
a)
0
0.02
0.04
0.06
0.08
0.1
0.12
0.14
0.16
0.18
0.2
0.22
0.24
0.26
0
20
40
60
80
100
120
140
160
180
200
220
240
260
10 15 20 25 30 35 40 45 50 55 60
Flow
rate
, g/m
in
Pres
sure
, Tor
r
Time, min
PSorpOut Flow rate
2-min 3-min 4-min
b) Figure 10. Sorption pump performance with Mars gas mixture at a) 7 Torr, and b) 70 Torr ambient pressure. D
ownl
oade
d by
Dia
ne L
inne
on
Janu
ary
7, 2
013
| http
://ar
c.ai
aa.o
rg |
DO
I: 1
0.25
14/6
.201
3-58
7

American Institute of Aeronautics and Astronautics
10
cycle. While a 3-minute adsorption time was used in this test, downstream flow readings began approximately 1 minute, 10 seconds into the adsorb time while the sorption pump temperature was still at 5 °C. This indicates that the CO2 being supplied to the sorption pump was merely passing through at this point and therefore the adsorb time could be reduced with no reduction in total performance. This breakthrough time was very consistent over several cycles.
C. Carbon Dioxide Sorption System for Mars Propellant Production The small Mars hopper must process 7 g/hr of atmospheric carbon dioxide to produce enough propellant in 30
days for a 2 km hop.3 As the isotherms in Fig. 9 clearly illustrate, the amount of CO2 adsorbed increases dramatically with increasing ambient pressure. To determine the equivalent hourly rate of CO2 acquisition for the various test conditions, the data from the mass flow meter was integrated over time for tests at different starting conditions (Fig. 13). Total cycle time is used in the calculation which includes the adsorption time during which no CO2 is being evolved. The scatter in the data is a result of daily variations in coolant flow rate affecting the rate of temperature change during each cycle and the inaccuracies involved in using the flow meter data to generate this metric. While a single cell unit of the size demonstrated here is sufficient for the second stage of compression, multi-cell units may be required for the first stage.
Figure 14a shows a conceptual model developed under the previous project at Battelle for an eight-cell, rapidly cycled TSA process with thermal recuperation. Figure 14b schematically depicts one step of an eight-step cyclic mode of operation in which each of the eight adsorbent-filled cells is alternately cooled to increase the sorption capacity for the gas species of interest (adsorption, position 5) and heated to desorb a concentrated product gas (desorption, position 1). Conceptually, the eight adsorption cells move counter-clockwise through the cycle, while a heat transfer fluid circulates through heat exchange channels in each cell. The highest temperature occurs in the cell at the top of the diagram where desorption is occurring. As a heat transfer fluid leaves this stage at its hottest temperature, it consecutively gives up heat to the cells on the right that are cycling toward the desorption step. In
0
50
100
150
200
250
300
350
400
450
500
0 5 10 15 20 25 30 35 40 45 50
Pres
sure
, Tor
r
Time, min
7 to 60 Torr
60 to 450 Torr
a)
0
100
200
300
400
500
600
700
800
0 5 10 15 20 25 30 35 40 45 50
Pres
sure
, Tor
r
Time, min
12 to 130 Torr
130 to 730 Torr
b) Figure 11. Examples of 2-stage compression options: a) post-compression needed, and b) pre-compression needed.
0.00
0.05
0.10
0.15
0.20
0.25
0.30
0.35
0.40
0.45
0
10
20
30
40
50
60
70
80
90
20 21 22 23 24 25 26 27 28 29 30
Flow
rate
, g/m
in
Tem
pera
ture
, °C
Time, min
TSorp Flow rate
Breakthrough
Figure 12. ‘Breakthrough’ time during adsorb cycle for CO2 at 130 Torr ambient pressure.
0
2
4
6
8
10
12
0 20 40 60 80 100 120 140
Out
let f
low
rate
, g/h
r
Starting pressure, Torr
Mars Hopper requirement
Figure 13. Hourly rate of sorption pump with CO2 gas.
Dow
nloa
ded
by D
iane
Lin
ne o
n Ja
nuar
y 7,
201
3 | h
ttp://
arc.
aiaa
.org
| D
OI:
10.
2514
/6.2
013-
587

American Institute of Aeronautics and Astronautics
11
transferring heat from structure to fluid and from fluid to structure cyclically in this manner, the thermal energy associated with heating and cooling the sorption pump is significantly recuperated. The amount of heat that must be added to the desorber and removed from the adsorber by a heat sink is indicative of the thermal recuperation efficiency of the system.
V. Carbon Dioxide Cryofreezer System An alternative technology option for the acquisition of the carbon dioxide atmosphere and compression to
pressure is to freeze the CO2 on a cold surface for later thawing to a high-pressure liquid. This method requires more up front energy to collect the CO2 in a frozen state but benefits from direct conversion to a high pressure liquid that can be readily stored and transferred. An additional efficiency comes from the fact that only the mass of CO2 is affected; there is no other capture media that must also be heated and cooled which usually represents significantly more mass than the CO2 alone.
A. Carbon Dioxide Cryofreezer System Design Figure 15 shows the detailed flow sheet
developed for the cryofreezer; this system would replace the components in the green box in Fig. 1. Figure 16 is a photo of the hardware installed in the MACS chamber. Our selected implementation uses a spherical shaped fin arrangement directly attached to the cryocooler cold tip (Fig. 17). The finned heat exchanger is enclosed in a pressure vessel rated for the final liquid pressure. Valves on the inlet and outlet allow the Mars atmosphere to flow past the heat exchanger where it collects on the cold fins. As with all collection methods the atmosphere must be circulated through the chamber to disperse the remaining nitrogen and argon so the concentration does not build to a point that slows or stops the freeze process. The system tested for this project used a previously developed accumulation vessel and cryocooler.8,9 The cryocooler is a free piston Stirling with a two-piston, voice-coil-driven compressor that transferred the sine wave pressure fluctuation to the cold head where a displacer removed heat from the cold tip. This cryocooler was originally designed to cool infrared optics and was capable of providing about 7 Watts of cooling lift at 70 K when new. Inlet and outlet lines are sealed with a motor-driven ball valve and a solenoid valve. The support structure includes a liquid cooled cold plate for removing excess heat from the cryocooler.
NASA-01
a)
Analyte Concentration
Hot FluidCold Fluid
Low Conc.Gas Feed Purified Gas
Collection
21
3
45
7
6
8
Analyte ConcentrationAnalyte Concentration
Hot FluidCold Fluid
Low Conc.Gas Feed Purified Gas
Collection
21
3
45
7
6
8
b) Figure 14. Eight-cell sorption pump: a) conceptual model, and b) thermal recuperation concept for high-efficiency operation.
Cold Bath - 20 °C
Blower
PT
FM#
8 8
Chamber Cold Plate
vacuum chamber
TC
PT
PT TC PT
TC
FV101
SV105
SV106
PFreezIn
PFreezOutLo
TFreezOut
PHXIn
THXIn
THXOut PHXOut
FB101
TC
TC
TColdPlate
TBlower
PFreezOutHi PT
M
FVM101
FM#SFM102
7 torr 70 torr
50 - 150 psia
7 - 70 torr
Freezer
Cryopump Coldhead Cryopump Double-
Piston Compressor
Cooling Plate
Relief vent back into chamber
FV105 (260 psia max)
chilled He at 450 psig
Freezing: vent trace gases and unfrozen CO2 back into chamber
throttle valve
FV104
FV103
TC
TColdHead
TC
TGasCham
TC TBottom
50 - 150 psia
SV108
0 - 4 gm/min
SFM101 FV102
External bldg vent
FV102H
To RGA
Figure 15. Detailed cryofreezer system flow sheet.
Dow
nloa
ded
by D
iane
Lin
ne o
n Ja
nuar
y 7,
201
3 | h
ttp://
arc.
aiaa
.org
| D
OI:
10.
2514
/6.2
013-
587

American Institute of Aeronautics and Astronautics
12
The collection process starts with chilling down the cold head until the heat exchanger reaches the freeze point of CO2 at typical Martian pressures (approximately 150 K at 7 Torr). With inlet and outlet valves open the CO2 begins to collect on the cold surfaces. The blower removes gases that do not freeze and supplies fresh
CO2. At the end of the freeze period, typically 6 hours or more, the valves are closed and the frozen CO2 is allowed to melt back to a high pressure liquid. The pressure vessel will hold the liquid CO2 at the vapor pressure at the temperature of the vessel. A small valve allows the CO2 vapor to be released into the production system as needed for processing. As the CO2 vaporizes, the remaining liquid will sub-cool and could reach the point where the outlet pressure drops to an unusable point. For day-long production runs of the propellant production system, enough heat from the environment should enter the chamber to keep pressures at a suitable value. A small heater could be added to keep the pressure high if needed.
B. Carbon Dioxide System Experimental Results The cryocooler itself was old technology when it was purchased twelve years ago, and the recent testing showed
a severe loss of cooling power. Figure 18 shows typical results from the original testing where CO2 freeze rate was between 12 and 15 g/hr for a 7-hr period, resulting in a total of 84.6 g of CO2 frozen and subsequently released upon thawing.8
C. Carbon Dioxide Cryofreezer System for Mars Propellant Production A flight design for the hopper processor using CO2 freezing would use a small pulse tube cryocooler feeding a
small collection heat exchanger about 2 cm in diameter inside a small pressure vessel. The pressure vessel would hold all of the collected CO2 for the next sol’s production. If the operational concept requires a CO2 supply while collecting additional CO2, an additional collection chamber could be added with minimum additional mass. A three-way valve would be added to select the active cryocooler cold head to provide compressed helium to the collection chamber that is currently active. The propellant production system would simply open a valve from the charged CO2 container to feed the plant.
In order to provide the 84 grams for the hopper processor over a 12-hour collection period approximately 1.1 Watts of cooling power is required for the cryocooler at 150 K. Modern pulse tube cryocoolers can provide this much cooling with less than 10 Watts of electrical input power. This would leave about 9 Watts of heat to reject to the
muffin fan
cold head
outlet valve
cryocooler
inlet ball valve
Figure 16. Cryofreezer system installed in MACS chamber.
Figure 17. Finned cold head in cryofreezer.
Figure 18. Cryofreezer experimental results from previous testing (Ref. 8 – used with permission).
Dow
nloa
ded
by D
iane
Lin
ne o
n Ja
nuar
y 7,
201
3 | h
ttp://
arc.
aiaa
.org
| D
OI:
10.
2514
/6.2
013-
587

American Institute of Aeronautics and Astronautics
13
Martian atmosphere, which could be accomplished with a small heat pipe and radiator exposed to the cold Martian environment.
The components of the system would be redesigned for a flight system with a lighter pressure vessel sized to more closely match the expected volume of frozen CO2. The vessel walls would also be thinner. The test system was designed to allow for full vapor pressure at Earth ambient conditions which can be over 900 psia. The cold Martian atmosphere would keep the vapor pressure down around 250 psia allowing a much thinner wall. Inlet and outlet valves would be high-pressure latching valves, which have been developed for other purposes. A small blower would be installed on the chamber exhaust that would pull any inert gases out of the chamber. The valves and blower would be close-coupled and integrated directly into the vessel body to minimize volume.
VI. Electrolyzer System Nearly all processes envisioned for producing oxygen and fuel from in-situ resources creates water at some point
in the process as an intermediary that then requires electrolysis to capture the oxygen and (usually) recycle the hydrogen back into the process stream. Proton exchange membrane (PEM) electrolyzers are fairly mature, with some space-rated units such as those currently operating on the Space Station. The electrolyzer system in a Mars propellant production plant must be able to maintain thermal control in the low-pressure atmosphere and be capable of repeated start/stop cycles assuming solar powered operation. Other components in the system, such as the water pump, must also be able to operate for long periods without overheating. To demonstrate the capability of a small PEM electrolyzer, a system was assembled and tested in the MACS chamber, including small tanks acting as the oxygen and hydrogen phase separators.
A. Electrolyzer System Design The red box in Fig. 1 above indicates the initial level of detail for the water electrolysis system. Table II lists the
initial mass estimates based on this simplified flow sheet. Figure 19 shows the detailed flow sheet developed for this test program and Fig. 20 shows the system installed in the MACS chamber. The primary component is a single cell, anode-fed PEM stack with an active area of 50 cm2/cell. Nominal operation is 60 amps to electrolyze 20 g/hr of water. For our purposes, we operated at about 25 percent of nominal: 15 amps for approximately 5 g/hr of water electrolyzed. Three small bottles act as water accumulators and phase separators. The first bottle, labeled H2O accumulator, is a 50 cm3 bottle designed to gather water produced by the Sabatier reactor and allow the gaseous methane to separate out. In a complete production plant, this accumulator would be periodically emptied by sending the water to the electrolyzer system. The second bottle, labeled O2 Phase Separator, is a 3000 cm3 bottle designed to hold the majority of the water in the electrolyzer loop, and also allow the gaseous oxygen to separate out for storage. The third bottle, labeled H2 Phase Separator, is a 50 cm3 bottle designed to capture the hydrogen gas and residual water that passes through the electrolyzer due to protonic drag. Simple water/gas phase separators of this design will output gas (either oxygen or hydrogen) saturated at the dew point based on the temperature and pressure of the separator tank. Moisture in the oxygen
Electrolyzer 15 amps 2.1 volts
O2
Phas
e Se
para
tor
H2
Phas
e Se
para
tor
Water in from Sabatier loop Condensor/Phase Separator (not part of current system)
To Vent
H2O: 3000 gm/hr 5°C, < 100 psia
H2: 0.55 gm/hr H2O: ~21 gm/hr ~5°C, 250 psia
O2: 4.4 gm/hr H2O: ~2995 gm/hr ~5°C, < 100 psia (TBD)
O2: 4.4 gm/hr H2O: 0.00313 gm/hr 5°C, 100 psia
H2O: 4.95 gm/hr (~2 drops/min) 50°C (TBD), 40 psia
100 psia
H2O: 4.95 gm/hr 50°C (TBD) < 100 psia
H2O
A
ccum
ulat
or
FM#
Open
Close alarm
Open
Open
To Vent
FM#
O2 Vent Orifice H2 Vent Orifice
U
F U
F
EP101
EOFM101
EOF101
EHFM101
EHF101
EWV101
EWV105
EHV101 EOV101
PT
TC
PT
TC
PT
TC
PT
TC
PT
TC
Close
PO2SepG
TO2SepL
TELIn
PELIn
TELOut
PELOut
PH2SepG
TH2SepL
PH2OAccG
TH2OAccL
vacuum chamber
vacuum chamber
TC TO2SepG
TC
TH2SepG
TC TElecPump
U F
DP O2SepLev
H2OAccLev DP
DP H2SepLev
EWV102 EWV103
EWF101
EWV104
PT
PPumpIn
Figure 19. Detailed electrolyzer system flow sheet as tested.
Dow
nloa
ded
by D
iane
Lin
ne o
n Ja
nuar
y 7,
201
3 | h
ttp://
arc.
aiaa
.org
| D
OI:
10.
2514
/6.2
013-
587

American Institute of Aeronautics and Astronautics
14
product exhaust stream will need to be removed if the oxygen is to be liquefied for storage, and this will represent a loss of resource and overall system inefficiency. Therefore, the separator tanks were chilled with an external coolant loop to reduce the water temperature to minimize the lost moisture.
Although only 5 g/hr of water needed to be electrolyzed, PEM cells typically are operated with significantly larger amounts of water to maintain the cells in a moist condition and provide sufficient cooling. A small water pump in the line leading up to the electrolyzer provided sufficient pressure rise to keep 3000 g/hr water circulating through the system.
The oxygen/water separator sizing involved several considerations. To test without make-up water from the Sabatier reactor, it was desirable to have enough water to run for several hours without having to break into the vacuum chamber or the electrolyzer flow loop, and to have sufficient margin to avoid the risk of running dry. Discussions with other electrolyzer researchers also suggested that the separators should have sufficient capacity to take several minutes to circulate the tank liquid volume in the circuit in order to provide sufficient residence time in the tank for the oxygen to separate. The tank cross section should be considerably larger than the circulation line so that the velocity in the tank is much
lower than the line velocity. At the same time, the height of the tank should allow for sufficient resolution of the changing water level. The oxygen gas volume was selected by first considering the steady state operating pressure and flow rate, and sizing a flow control orifice. The flow leaving the volume during the start-up transient was then assumed to be proportional to the instantaneous pressure, with the oxygen input to the volume being the constant rate from the electrolyzer. The rate of pressure rise would then be directly dependent upon net rate of gas accumulation in the volume. The volume of the gas side of the separator needed to be small enough so that the steady state operating pressure could be attained in a reasonable amount of time, while not being so small as to result in excessive liquid carryover.
The hydrogen/water separator was sized to capture water carry-over in the hydrogen stream and allow for periodic drainage back to the water feed side of the electrolyzer. Considerations in this case included the expected rate of water carry-over into the hydrogen stream and the rate at which water could be discharged back into the electrolyzer supply. The gas discharge orifice was again sized based upon the steady-state operating pressure and hydrogen gas generation rate. The hydrogen pressure had to be maintained above the oxygen/water pump pressure at all times, including during initial ramp-up and whenever the water accumulation was discharged back to the electrolyzer inlet. This set a limit on the initial gas volume as well as a limit on how much the pressure could be allowed to drop during drainage discharge. The drainage valve needed to be large enough such that the average drainage over time would equal the water carry-over rate of the electrolyzer hydrogen outlet. At the same time it would have to be small enough so that it would not allow the hydrogen pressure to drop too low given practical limitations on how rapidly the valve could be cycled.
An initial level-based control scheme was developed which would open the drain valve at an upper liquid level limit, allow the liquid to drain, and close the valve at a pre-set lower limit. The limits were chosen to minimize the gas pressure fluctuations in the two separator tanks. The small size of the hydrogen separator tank required very short valve opening times (around 20 to 50 milliseconds) and there was initially some concern about the ability to resolve small level changes and obtain proper timing. So an alternative method was devised which triggered only off the high level and could be programmed to drain for a fixed time pulse rather than looking for a lower level. The control scheme was developed in a spread sheet which allowed for optimization of tank volumes, liquid and gas volume fractions, valve capacity and cycle timing.
Table V lists the mass of each component in the electrolyzer system, with a total mass of 5.9 kg. The as-built test system is almost three times greater than the original mass estimate from Table II based on a much simplified flow diagram. Again, all components were off-the-shelf, and mass reductions can be expected for flight components. The
O2 phase separator
H2 phase separator
water pump
electrolyzer
Figure 20. Electrolyzer system installed in MACS chamber.
Dow
nloa
ded
by D
iane
Lin
ne o
n Ja
nuar
y 7,
201
3 | h
ttp://
arc.
aiaa
.org
| D
OI:
10.
2514
/6.2
013-
587

American Institute of Aeronautics and Astronautics
15
electrolyzer also was designed for four times the performance than is required, and a unit designed specifically for our electrolysis rates could be significantly lighter.
B. Electrolyzer System Experimental Results There were several objectives for the tests of
the electrolysis system. Initial tests successfully demonstrated start-up operations where the oxygen and hydrogen phase separator tanks were initially at low pressure, in this case Earth ambient since these tanks were vented external to the Mars chamber. The water pump was started and the electrolyzer turned on; as water was electrolyzed the pressure in the two phase separator tanks slowly increased at a rate similar to that predicted from the control scheme calculations during the design phase. A second objective was to demonstrate automated control of the liquid level in the oxygen and hydrogen phase separator tanks, with the hydrogen tank draining into the electrolyzer feed line when the level reached a high set-point, and the oxygen tank being refilled from the water accumulator when the level reached a low set-point. Unfortunately, the pressure differential transducers that were installed to measure the liquid level in the tanks were very sensitive to head pressure and static/dynamic conditions, and did not provide consistent data to rely on for automatic control of the tank levels. However, manual control of the draining and filling features was successfully demonstrated repeatedly throughout the test series.
Figure 21 shows results of a 2-hour test where the electrolyzer was tested at 15, 20, and 25 amps. After repeated difficulties with the gaseous oxygen line clogging at the micro-orifice used to control flow rate and pressure rise, the orifice was replaced with a needle valve controlled manually. The peak in oxygen flow rate and pressure at the beginning of the test run shown in Fig. 21 is a result of this manual control on oxygen flow rate. At each current setting, the hydrogen drain valve was manually triggered to demonstrate the process of returning excess water to the electrolyzer loop. Each time the hydrogen separator is drained the pressure declines as the gas expands to fill the volume vacated by the water. A corresponding drop in hydrogen flow rate results from the lower forcing pressure through the downstream orifice. At the same time as the hydrogen pressure drops, the oxygen pressure and flow rate increase due to added water in the recirculating water loop. These tests provide valuable data for design of an autonomous control system for the electrolyzer system.
The manufacturer of the electrolyzer unit had cautioned that electrolyzer performance might be reduced with water inlet temperatures as low as our target of 5 °C. However, results showed that the amount of water electrolyzed at 15, 20, and 25 amps was as predicted, and the data followed a linear trend that projected well to the stated performance at the nominal operating condition of 60 amps (Fig. 22).
C. Electrolyzer System for Mars Propellant Production The electrolyzer system demonstrated here can electrolyze four times the water needed for the small Mars
hopper designed in Ref. 3. Electrolysis rate is directly dependent on the cell active area; therefore an electrolyzer built specifically for the lower rates required for the hopper would be 25 percent of the current area resulting in a direct reduction in manifold size and mass. Additional mass reductions can be realized by reducing the wall thickness of the three separator tanks, which were bought off-the-shelf and rated for 5 to 10 times greater pressure
Table V. Detailed mass of electrolyzer system. Item
Designation Description
EWV101hand valve, 2-way, Sabatier separator drain
EWV102
valve, solenoid, 2-way, NC, H2O Accumulator drain to electrolyzer loop
EWV103check valve, H2O Accumulator drain to electrolyzer loop
EWV104valve, solenoid, 2-way, NO, O2 separator drain
EWV105valve, solenoid, 2-way, NC, H2 separator drain
H2O accumulator tank
O2 separator tank
H2 separator tank
O2 vent orifice
H2 vent orifice
EOV101 O2 relief valve
EHV101 H2 relief valve
EWF101 Electrolyzer water inlet filter
EOF101 O2 vent filter
EHF101 H2 vent filter
EP101 Water pump
EP101M water pump motorElectrolyzer
Electrolyzer system total
Actual mass, kg
0.09
0.06
0.09
0.16
0.79
0.19
0.01
0.01
0.24
0.23
0.09
0.09
0.09
0.32
0.832.57
5.9
Dow
nloa
ded
by D
iane
Lin
ne o
n Ja
nuar
y 7,
201
3 | h
ttp://
arc.
aiaa
.org
| D
OI:
10.
2514
/6.2
013-
587

American Institute of Aeronautics and Astronautics
16
than required in this system. The results of these system tests and analysis indicate that this design could be used for the Mars hopper propellant production system with a total mass around 4 kg.
For scale up to a production plant for a sample return mission, production rate is approximately 200 times that for the small hopper.3 However, as the electrolyzer tested can operate at 4 times the hopper requirement, a single stack of 50 cells with the same active cell area would meet the sample return mission requirements. As the predominant mass of the electrolyzer unit is in the manifolding, multiple-cell units do not result in a linear increase in total mass. Based on the mass of several multi-cell units available from the same manufacturer, a 50-cell electrolyzer unit for a sample return mission should be achievable for approximately 8 kg.
VII. Concluding Remarks In-situ resource utilization on Mars has great potential
to open up the planet for science discoveries, sample return, and eventual human exploration. An initial demonstration of a small propellant production plant producing 2 kg of oxygen and methane every 30 days could power a Mars hopper vehicle and provide proof-of-concept of carbon dioxide capture and other critical systems while providing the first stepping stone towards eventual large-scale production. Two methods for carbon dioxide acquisition and compression were evaluated for performance in a simulated Mars atmosphere. A sorption pump device built with microchannel technology successfully captured and compressed low pressure carbon dioxide using rapid thermal-swing cycles. A single, 400-g unit provided sufficient through-put for a second-stage compressor, while several of these units would be needed for the first stage. The data generated will also be valuable in developing improvements in both construction and sorbent material. A mini-cryofreezer system was also evaluated for applicability to the Mars hopper mission. Previous test results demonstrated carbon dioxide acquisition and compression at a rate approximately twice that needed for the Mars hopper, and advances in cryocooler technology should allow operation with as little as 10 W of power. Finally, an electrolyzer system was assembled and tested in the Mars environment, including start-up operations, oxygen and hydrogen phase separators, and water resupply from a simulated methanation system. Multi-hour testing demonstrated thermal stability of all components with no need for active cooling.
Acknowledgments The authors greatly appreciate critical test support from Ms. Deborah Waters. Mr. Frank Lam and Mr. Robert
Paulin provided valuable design contributions during mechanical and electrical assembly of the three systems tested.
0
1
2
3
4
5
6
7
8
0
20
40
60
80
100
120
140
160
10:45:00 11:00:00 11:15:00 11:30:00 11:45:00 12:00:00 12:15:00 12:30:00 12:45:00
Flow
rate
, g/h
r
Pres
sure
, psi
a
Time, hr:min:sec
H2 Separator discharge
15 amps 20 amps 25 amps
H2 Flow rate
O2 Pressure
H2 Pressure
O2 Flow rate
Figure 21. Electrolyzer performance.
0
5
10
15
20
25
0 10 20 30 40 50 60 70
Wat
er e
lect
roly
sis
rate
, g/h
r
Current, amps
*
Test results
Nominal design condition
Figure 22. Electrolyzer performance at varying current.
Dow
nloa
ded
by D
iane
Lin
ne o
n Ja
nuar
y 7,
201
3 | h
ttp://
arc.
aiaa
.org
| D
OI:
10.
2514
/6.2
013-
587
American Institute of Aeronautics and Astronautics
17
The authors gratefully acknowledge the support of this work by the Glenn Research Center Innovation Fund, which is funded by the NASA Office of Chief Technology.
References 1National Research Council, Vision and Voyages for Planetary Science in the Decade 2013-2022, National Academy Press,
Washington, D.C., 2011. 2Linne, D.L., and Sacksteder, K.R., “A Synergistic Approach Towards Advancing Mars Robotic Exploration and Sustainable
Human Exploration,” GLEX-2012.08.P.5x12375, May 2012. 3Linne, D.L., Barsi, S.J., Sjauw En Wa, w., and Landis, G.A., “Mars Surface Mobility Leading to Sustainable Exploration,”
AIAA 2012-0806, AIAA Aerospace Sciences Meeting, January, 2012. 4Hess, S.L., et al., “The Annual Cycle of Pressure on Mars Measured by Viking Landers 1 and 2”, Geophys. Res. Lett. 7(3),
(1980) pp 197-200. 5Brooks, K.P., Caldwell, D.D., Holladya, J.D., Howard, C.L., Hu, J., Kee, R.J., Lilley, B.P., Rassat, S.D., Romig, K.A.,
Schlahta, S.N., Simon, T.M., and Zhu, H., “Microchannel In Situ Propellant Production System Project Final Report,” Battelle – Pacific Northwest Division Rept. PNWD-3670, Richmond, WA, March 2006.
6Siriwardane, R., et al., “Adsorption and Desorption of CO2 on Solid Sorbents”, J. Energy & Env Res 1(1), (2001), pp. 19-31. 7Lobo, R.F., “Intermolecular Forces in Zeolite Adsorption and Catalysis”, Ordered Porous Solids: Recent Advances and
Prospects, V. Valtchev, S. Mintova, and M. Tsapatsis, Ed., Elsevier (2008) pp. 239 – 260. 8Clark, D.L. and Payne, K.S., “Evaluation of Mars CO2 Acquisition Using CO2 Solidification,” Lockheed-Martin Final
Report for work performed under contract task 71DO36ETAC9HECEP1A5 and 71DO36ETAC0HECEP1A5 for NASA Johnson Space Center, May 2000.
9Clark, D.L. and Payne, K.S., “Carbon Dioxide Collection and Purification System for Mars,” AIAA-2001-4660, August 2001.
Dow
nloa
ded
by D
iane
Lin
ne o
n Ja
nuar
y 7,
201
3 | h
ttp://
arc.
aiaa
.org
| D
OI:
10.
2514
/6.2
013-
587