Demography
35
including population DEMOGRAPHY Mel Chen P. Campomanes
-
Upload
mel-chen-campomanes -
Category
Data & Analytics
-
view
136 -
download
0
Transcript of Demography
including
population
DEMOGRAPHY
Mel Chen P. Campomanes

“demo-” from Ancient Greek dēmos, means “the
people” and “-graphy” from graphō, means
“measurement”
scientific study of human population
DEMOGRAPHY

i. Changes in population size
ii. Composition of population
iii. Population distribution in space
3 PHENOMENA
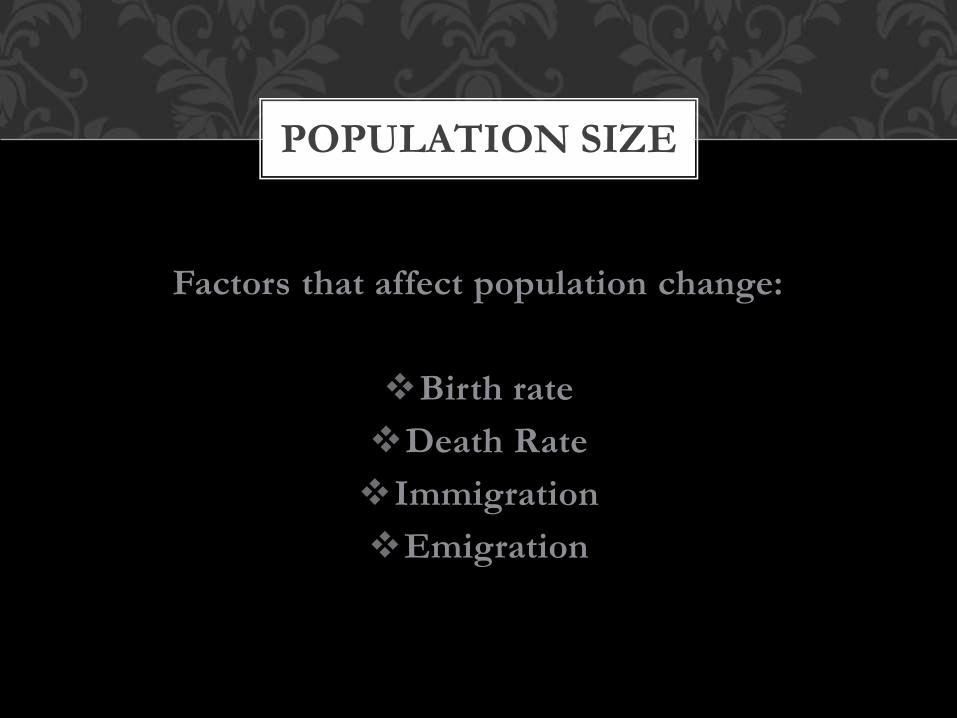
Factors that affect population change:
Birth rate
Death Rate
Immigration
Emigration
POPULATION SIZE
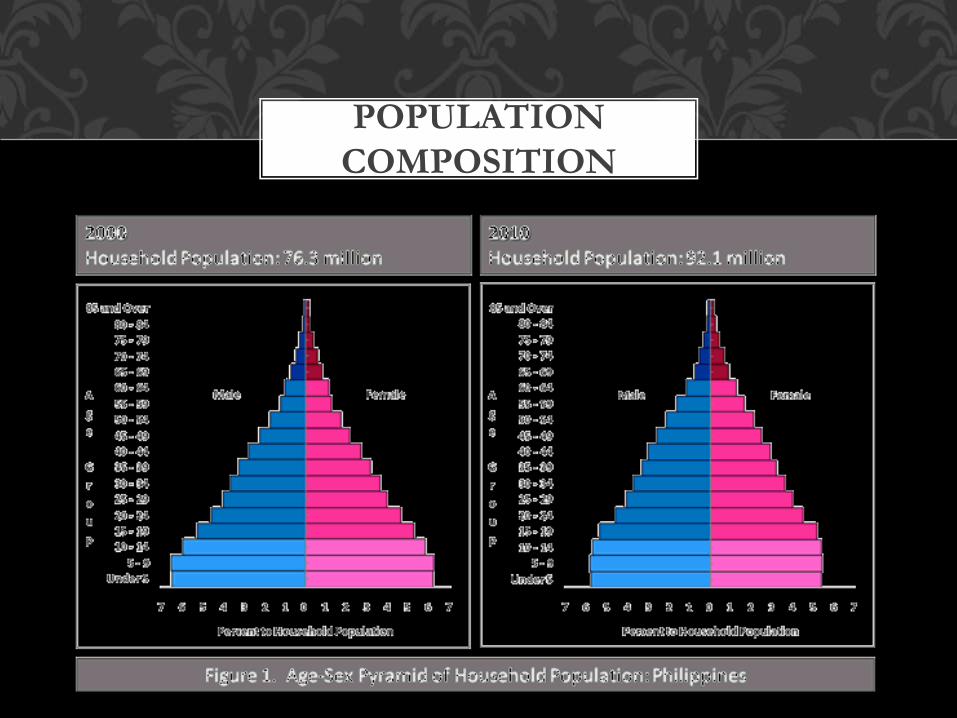
POPULATION
COMPOSITION

POPULATION
COMPOSITION
the pattern of where people live
POPULATION
DISTRIBUTION
Number and kind of individuals of a species.
A given space or an area.
Time.
POPULATION
CHARACTERISTICS AS
1. census
2. administrative records
3. surveys
4. registers
SOURCES OF DEMOGRAPHIC
STATISTICS:

Census - main source of demographic data worldwide
SOURCES OF DEMOGRAPHIC
STATISTICS:

Administrative records - used in almost every country and a common example of such are health statistics from hospitals
SOURCES OF DEMOGRAPHIC
STATISTICS:

Surveys - key source of data on social phenomenon .They are among the most flexible method of data collection.
SOURCES OF DEMOGRAPHIC
STATISTICS:

Registers - rare source of demographic data
SOURCES OF DEMOGRAPHIC
STATISTICS:

concerned not only with population variables but
also with relationships between population
changes & other variables
describe changes in population size and composition
due to increase or decrease in no of births and
deaths
DEMOGRAPHIC STAGES

i. High stationary stage
ii. Early expansion stage
iii. Late expansion
iv. Low stationary
v. Declining Stage
DEMOGRAPHIC CYCLE
Old balance
New balance
Imbalance

the study and measurement of population using
measurement tools
DEMOGRAPHIC
MEASUREMENT

Two aspect of demographic measurement
Population static
Population Dynamic
DEMOGRAPHIC
MEASUREMENT

DEMOGRAPHIC
MEASUREMENT TOOLS
Age structure 0-14 years: 34% (male 18,339,398/female 17,607,472)
15-24 years: 19.1% (male 10,259,385/female 9,896,090)
25-54 years: 36.8% (male 19,550,257/female 19,369,177)
55-64 years: 5.7% (male 2,772,003/female 3,239,659)
65 years and over: 4.4% (male 2,023,118/female 2,664,085)
(2013 est.)
Dependency ratios total dependency ratio: 61.4 %
youth dependency ratio: 55.1 %
elderly dependency ratio: 6.3 %
potential support ratio: 15.9 (2013)
Median age total: 23.3 years
male: 22.8 years
female: 23.8 years (2013 est.)
Population growth rate 1.84% (2013 est.)

Birth rate 24.62 births/1,000 population (2013 est.)
Death rate 4.95 deaths/1,000 population (2013 est.)
Net migration rate -1.25 migrant(s)/1,000 population (2013 est.)
Urbanization urban population: 48.8% of total population (2011)
rate of urbanization: 2.16% annual rate of change (2010-15 est.)
DEMOGRAPHIC
MEASUREMENT TOOLS

Major cities - population MANILA (capital) 11.449 million; Davao 1.48 million; Cebu
City 845,000; Zamboanga 827,000 (2009)
Sex ratio at birth: 1.05 male(s)/female
0-14 years: 1.04 male(s)/female
15-24 years: 1.04 male(s)/female
25-54 years: 1.01 male(s)/female
55-64 years: 0.86 male(s)/female
65 years and over: 0.76 male(s)/female
total population: 1 male(s)/female (2013 est.)
Mother's mean age at first birth 23.1 (2008 est.)
Infant mortality rate total: 18.19 deaths/1,000 live births
male: 20.59 deaths/1,000 live births
female: 15.66 deaths/1,000 live births (2013 est.)
DEMOGRAPHIC
MEASUREMENT TOOLS

Life expectancy at birth total population: 72.21 years
male: 69.26 years
female: 75.31 years (2013 est.)
Total fertility rate 3.1 children born/woman (2013 est.)
Contraceptive prevalence rate 48.9% (2011)
HIV/AIDS - adult prevalence rate less than 0.1% (2009 est.)
DEMOGRAPHIC
MEASUREMENT TOOLS
DEMOGRAPHIC
MEASUREMENT TOOLS
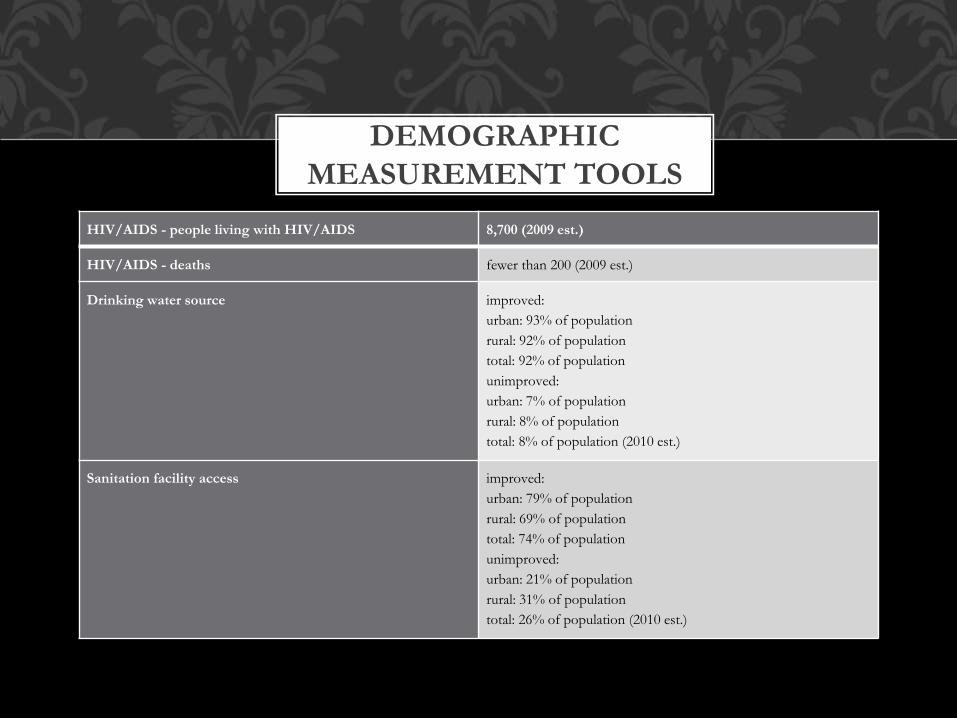
HIV/AIDS - people living with HIV/AIDS 8,700 (2009 est.)
HIV/AIDS - deaths fewer than 200 (2009 est.)
Drinking water source improved:
urban: 93% of population
rural: 92% of population
total: 92% of population
unimproved:
urban: 7% of population
rural: 8% of population
total: 8% of population (2010 est.)
Sanitation facility access improved:
urban: 79% of population
rural: 69% of population
total: 74% of population
unimproved:
urban: 21% of population
rural: 31% of population
total: 26% of population (2010 est.)
DEMOGRAPHIC
MEASUREMENT TOOLS
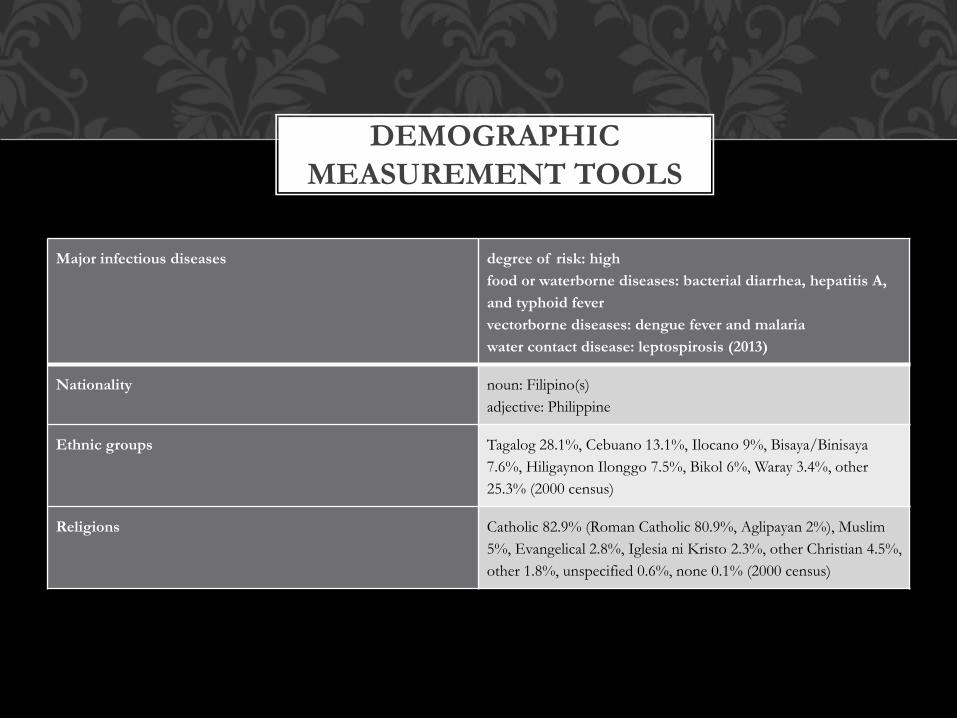
Major infectious diseases degree of risk: high
food or waterborne diseases: bacterial diarrhea, hepatitis A,
and typhoid fever
vectorborne diseases: dengue fever and malaria
water contact disease: leptospirosis (2013)
Nationality noun: Filipino(s)
adjective: Philippine
Ethnic groups Tagalog 28.1%, Cebuano 13.1%, Ilocano 9%, Bisaya/Binisaya
7.6%, Hiligaynon Ilonggo 7.5%, Bikol 6%, Waray 3.4%, other
25.3% (2000 census)
Religions Catholic 82.9% (Roman Catholic 80.9%, Aglipayan 2%), Muslim
5%, Evangelical 2.8%, Iglesia ni Kristo 2.3%, other Christian 4.5%,
other 1.8%, unspecified 0.6%, none 0.1% (2000 census)

DEMOGRAPHIC
MEASUREMENT TOOLS
Languages Filipino (official; based on Tagalog) and English (official);
eight major dialects - Tagalog, Cebuano, Ilocano, Hiligaynon
or Ilonggo, Bicol, Waray, Pampango, and Pangasinan
Literacy definition: age 15 and over can read and write
total population: 95.4%
male: 95%
female: 95.8% (2008 est.)
School life expectancy (primary to tertiary education) total: 11 years
male: 11 years
female: 12 years (2009)
Education expenditures 2.7% of GDP (2009)

DEMOGRAPHIC
MEASUREMENT TOOLS
Maternal mortality rate 99 deaths/100,000 live births (2010)
Children under the age of 5 years underweight 20.7% (2008)
Health expenditures 4.1% of GDP (2011)
Physicians density 1.153 physicians/1,000 population (2004)
Hospital bed density 1 beds/1,000 population (2011)
Obesity - adult prevalence rate 6.3% (2008)

The rampant population growth is viewed as the
greatest obstacle to the economic & social
development of the majority of peoples in the
underdeveloped world

i. Economic implicationsii. Demographic Implications
iii. Environmental / Ecological Implicationsiv. Social / Political Implications

Agriculture, Economy and urbanization.
Food and nutrition
Literacy and education
Labour force and employment
Clothing and housing
Health care services
Water supply and environment
IMPACT OF POPULATION
GROWTH

Social policies and social changes
Involuntary approaches to population control
Family planning approach to fertility control
APPROACHES TO
POPULATION CONTROL

100,617,630
PHILIPPINES TODAY

Year Population Change
1950 18,580,000 N/A%
1960 26,272,000 41.40%
1970 35,805,000 36.29%
1980 47,398,000 32.38%
1990 61,949,000 30.70%
2000 77,652,000 25.35%
2010 93,444,000 20.34%
PHILIPPINES
POPULATION

PHILIPPINES
POPULATION
Year Population Change
2020 112,635,000 20.54%
2030 135,469,000 20.27%
2040 160,735,000 18.65%
2050 189,979,000 18.19%
2060 224,443,000 18.14%
2070 264,907,000 18.03%
2080 313,159,000 18.21%
2090 371,097,000 18.50%
2100 440,489,000 18.70%
A snapshot of the population in 2030
Philippines’s place in global population trends
Analysis of changing population structures
Statistics on ageing
Vital statistics and population by sex
Marriage and divorce rates
A look at the diversity of the population
A breakdown of the biggest cities by population size
Historic and forecast data covering the period 2005-2030
PHILIPPINES IN 2030