DEMOGRAPHICTRENDS ANDSOCIO-ECONOMICINDICATORS INEUANDGREECEvideo.minpress.gr/ · DEMOGRAPHICTRENDS...
14
about GREECE 65 DEMOGRAPHIC TRENDS AND SOCIO-ECONOMIC INDICATORS IN EU AND GREECE by John Nic. Yfantopoulos Professor, University of Athens Over the last decade Greece has achieved impressive converging trends with the rest of the European Member States. Real GDP growth outstripped the EU-25 average growing at a rate of more than 4.5%, unemployment has been declining since 2000, social expenditure has been increasing and life expectancy is one of the highest among the EU-25 Member States. The main aim of this section is to provide general information con- cerning demographic trends, and socio-economic indicators in the E.U. Member States and Greece. It is generally accepted that there are many dimensions in which demography, health and quality of life could be measured. From the wide range of macro and micro indicators we have selected some indicative indexes which would portray the current state of development in life expectancy, health status and quality of life in Greece. This chapter is divided into three parts. The first part presents a com- parative view of population trends, life expectancy, mortality, dis- ability and quality of life in EU-15. The second part focuses on Greece and discusses population growth and health status trends i.e. infant mortality trends over the period 1955-2004 and incidence of Aids and road traffic accidents. Finally in the third section we make use of some demographic and socio-economic indicators in order to analyze social cohesion and income inequalities in the accession countries.
Transcript of DEMOGRAPHICTRENDS ANDSOCIO-ECONOMICINDICATORS INEUANDGREECEvideo.minpress.gr/ · DEMOGRAPHICTRENDS...

about GREECE 65
DEMOGRAPHICTRENDSANDSOCIO-ECONOMIC INDICATORS
IN EU ANDGREECEby John Nic. Yfantopoulos
Professor, University of Athens
Over the last decade Greece has achieved impressive convergingtrendswith the rest of the EuropeanMemberStates. RealGDPgrowthoutstripped the EU-25 average growing at a rate ofmore than 4.5%,unemployment has been declining since 2000, social expenditurehas been increasing and life expectancy is one of the highest amongthe EU-25 Member States.Themain aim of this section is to provide general information con-cerning demographic trends, and socio-economic indicators in theE.U. Member States and Greece. It is generally accepted thatthere aremanydimensions inwhich demography, health and qualityof life could bemeasured. From the wide range ofmacro andmicroindicators we have selected some indicative indexes which wouldportray the current state of development in life expectancy, healthstatus and quality of life in Greece.This chapter is divided into three parts. The first part presents a com-parative view of population trends, life expectancy, mortality, dis-ability and quality of life in EU-15. The second part focuses onGreeceand discusses population growth and health status trends i.e. infantmortality trendsover the period 1955-2004 and incidence of Aids androad traffic accidents. Finally in the third sectionwemakeuse of somedemographic and socio-economic indicators in order to analyze socialcohesion and income inequalities in the accession countries.

Diagram 1 Demographic trend in the European Union
Source: Eurostat-1995 based (baseline) household projections
about GREECE66
THE COUNTRY
EUROPEAN COMPARISONSThis section considers some inter-national comparisons of demo-graphic trends in the EU-15. Thereare some problems concerningthe comparability of the interna-tional statistics, and the value ofthe calculated indexes. In order toavoid any conceptual miss-inter-pretations we focus only on vali-dated indicators which have beendeveloped by the Eurostat, theWorld Health Organization andthe European Commission.
Population trends in EuropeIn 2005, the population of the Eu-ropean Union (EU-25) was 459million. On the base of this esti-mate, Europe is the third largestgeographic unity in the world,after China (1,253 million), and In-dia (1,009 million). It is also aheadin comparison to the population ofUnited States (274 million) andJapan (126 million). The populationof the accession members, i.e.the twelve countries that are in theface of membership negotiations,is around 106 millions.
In the forthcoming decades of thesecond millennium, one of the
striking aspects of the EuropeanCommunity’s Social and Demo-graphic problems is the increasingrate of the ageing. The extent andform of ageing varies significantlyfrom one Member State to another.
In 1960 there were only 34 millionelderly (above 65 years of age) inthe EU-15. In 2000 this figure wasalmost double reaching the levelof 60 million. The future prospectsare gloomier since the proportionof elderly is expected to rise from16% in 2000 to 27% in 2010.
In an effort to qualify the expecteddemographic trends over the pe-riod of the next 20 years (i.e.2000-2020) we can clearly distin-guish (see Diagram 1) betweenthree broad age groups, whichwill undergo impressive changes.
1) The group of young people (0-29) is expected to fall by 15.4%.This reduction is expected tohave an immediate impact onthe educational infrastructureas well as on the social andhealth services relevant to theyounger population. Despitethis reduction, it has been pro-

about GREECE 67
DEMOGRAPHIC TRENDSAND SOCIO-ECONOMIC INDICATORS IN EU AND GREECE
posed by the European Com-mission and the OECD that at-tention must be paid to ensur-ing a high equality of educa-tional services. (Diagram 1)
2) The age group of working pop-ulation (29-64) will present ini-tially a decline by 11.8% in theage group 30-49, followed by asubstantial increase by 17.9% inthe age group 50-64 years. Thenet effect of the group (29-64)is expected to be an overall in-crease by 6.1%. This change willbring a profound impact in thelabour force and the correspon-ding productivity.
3) The group of elderly (+ 65) willwitness an impressive increaseby 27.7%, generating new de-mands for elder services andimposing an extra burden inthe pensions and health careservices.
There are three predominant fac-tors that have an important impacton the ageing of the EuropeanPopulation.
• The first is the continuous fallin fertility rates
• The second is the extendedlongevity and
• The third is the impressive de-cline in mortality.
We discuss below the significanceof each of the above factors.
FertilityThe rate of fertility is defined as theaverage number of children thatwould be borne alive to a womanduring her lifespan under the as-sumption that current fertility rateswould continue. The average fertil-ity rate dropped in the EU-25 from2.35 in 1970 to 1.48 in 2000.
Declining fertility trends have beenobserved in all European Memberstates over the last three decades.Diagram 2 provides a comparablepicture of the fertility rates in 1970and 2000 across the EU-25.
The Southern European Countrieswith the highest fertility trends inthe 1970s and 1980s present cur-rently (in 2000) the lowest rates.In Greece the fertility rate droppedfrom 2.39 in 1970 to 1.29 in 2000.Similar trends have been observedin Spain and Italy.
Life Expectancy at birthA measure of the expectation of lifeat birth has the advantage of de-scribing the overall mortality of apopulation in a more summaryfashion than the mortality rates.Life expectancy indicators are cal-culated from life tables whichpresent the record of survival andmortality within a hypothetical co-hort (tables of life's generation),subject to the sequence of agespecific mortality rates, estimatedduring a given calendar periodamong actual age cohorts.
Life expectancy has been con-stantly increasing across all the EUMember States. The total gain inyears during the second half of thecentury is around ten years. Despitethis success there have been sig-nificant differences among the EU-25 countries. In 2004 the malelife expectancy at birth varied from65 years in Latvia to 78 years inSweden. A wider gap of 18 yearscould be identified among thecountries with reference to the fe-male life expectancy ranging from76 years in Latvia to 84 years inSpain. Except the inter-regionalvariation, striking inequalities in

about GREECE68
THE COUNTRY
gender life expectancy have beenidentified within the countriesranging from more than 11 years inLatvia and Lithuania to 4.4 years inU.K., Sweden, and the Netherlands.In Greece a difference of five yearsbetween male and female life ex-pectancy is observed over time. Di-agram 3 presents the life expectan-cy trends for males and femalesover the period of 1985-2004.
On the base of diagram 3 we maydistinguish two periods: The firstperiod (1985-1997) is characterisedby expansionary trends and thesecond one (1998-2004) by slightlystabilising trends life expectancy. Overall the decrease in fertilityand the increase in life expectancyare the prime factors responsiblefor the ageing of the population inthe EU countries.
Diagram 2 Fertility Rates in EU-25 (1970-2000)

about GREECE 69
DEMOGRAPHIC TRENDSAND SOCIO-ECONOMIC INDICATORS IN EU AND GREECE
Mortality TrendsOne of many purposes for measur-ing mortality is to enable us todraw inferences about the likelihoodof death occurring within a specificperiod of time (age). A reason for do-ing this is that the risk of dying varieswith a number of factors such as:age, sex, geographical locality of res-idence, occupation, income, life-style, as well as the availability ofhealth services.
Examining the total causes ofdeaths which have been stan-
dardised (direct method) for ageand sex, and are expressed inrates per 100,000 individuals, wefound that Greece appears to be acountry with the lowest deathrates among the EU states. Dia-gram 4 provides a comparativeview of the crude death rates inGreece in comparison with EU-15and EU-25 over the period 1960-2004. Lower death rates were as-sessed in Greece during 1960s to1980s followed by convergingtrends in the 1990s and early2000s .
Diagram 3 Life Expectancy at Birth in Greece: (1985 - 2004)
Diagram 4 Crude death rates in EU-15, EU-25 and Greee (1960-2004)

about GREECE70
THE COUNTRY
Table 1 provides an overview of themain causes of death for malesand females in EU-15 and Greece.
As far as the rest of causes of deathare concerned, we can see in table1 that neoplasms, ischemic heartdiseases,and suicides, in Greeceare lower in comparison to the EU-15average The life style, diet, andenvironment are among the factorscontributing to this changes.
Disability Adjusted Life Years The World Health Organization(WHO) has developed a widelyaccepted methodology in measur-ing the health status of differentnations across the globe. The mainidea was to device an indicator,which is not restricted to the de-scription of death, but to reflect theimpact of a wide range of risk fac-tors upon health. Christopher Mur-ray, Executive Director of WHO’sGlobal Programme on Evidencefor Health Policy, undertook the re-sponsibility to develop a compa-rable approach based on the com-bination of mortality and morbid-
ity. The new indicator was calledDALY (Disability, Adjusted LifeYears) and it is a composite indi-cator taking into account the im-pact of several risk factors uponmortality and morbidity. The lossof one healthy year of life is equalto one DALY.
In diagram 5 we present the rela-tionship between per capitahealth expenditure and the esti-mated DALYS for different Euro-pean and Accession Countries.We witness a positive relationshipbetween DALYS and health ex-penditure supporting the hypoth-esis that more economic resourceswould improve markedly thehealth of the accession countries.However the effect on the wealth-ier nations of the European Unionis only marginal.
Factors contributing to livingstandards and Quality of lifeDuring the last decade it has beena growing interest among politi-cians, administrators and socialpolicy analysts to investigate the
SEX CAUSES 1994 1995
GR
MALE
Neoplasms 217.40 217.20
Ischemic 123.30 128.10
Suicide 5.10 5.50
Accidents 31.10 33.80
FEMALE
Neoplasms 115.40 114.40
Ischemic 54.30 56.90
Suicide 1.20 1.10
Accidents 9.20 9.80
EU15
MALE
Neoplasms 266.60 262.80
Ischemic 168.60 167.00
Suicide 18.50 18.10
Accidents 19.1 18.50
FEMALE
Neoplasms 147.70 145.20
Ischemic 81.10 80.10
Suicide 5.80 5.80
Accidents 6.10 5.80
Source: Balourdos D. 2006. National Centre for Social Research.

Diagram 5 DALYS and Health Expenditure
about GREECE 71
DEMOGRAPHIC TRENDSAND SOCIO-ECONOMIC INDICATORS IN EU AND GREECE
quality of life issues and to devisemethodologies aiming at its meas-urement. Several International Or-ganizations like the WHO and theOECD have launched several stud-ies on living conditions promotingquality of life issues as a key con-cept for assessing subjective valu-
ation of several dimensions of wellbeing in different cultural settings.
In early 1995 the Executive Boardof WHO approved a programme onquality of life of the elderly aimingat the investigation of different per-spectives related to:
1996 1997 1998 1999 2000 2001 2002 2003
218.20 217.20 211.80 218.30 221.40 223.80 215.10 217.90
130.10 128.50 119.80 122.20 122.00 124.40 121.30 126.40
5.20 : : : : : 4.20 5.10
34.00 : : : : : 24.30 24.30
116.60 115.00 112.40 114.20 114.80 116.50 116.20 113.20
56.90 56.20 51.80 52.80 53.70 55.60 55.50 58.80
1.00 : : : : : 1.00 1.10
10.60 : : : : : 6.80 5.60
259.00 253.70 252.60 233.20 242.10 242.10 : :
160.90 153.60 151.20 133.00 135.90 131.70 : :
17.40 17.30 16.90 15.70 16.00 15.80 : :
17.70 17.70 17.60 17.00 15.70 15.60 : :
144.00 141.90 140.60 142.30 137.20 136.80 : :
77.50 74.60 73.70 64.60 66.00 64.20 : :
5.70 5.60 5.10 4.50 5.00 4.90 : :
5.60 5.40 5.50 4.60 4.80 4.70 : :

about GREECE72
THE COUNTRY
• Life Course of the elderly whoare not compartmentalized,
• Health promotion for the elderly • Cultural settings • Gender differences • Inter generational cohesion and • Ethical considerations.
The programme aimed at the col-laborative work between variousacademic and non-governmentalorganizations in order to createdata bases for policy strengthen-ing, advocacy, and implementingcommunity based programmes.
Further to WHO, the OECD initiatedseveral studies on social indicatorspromoting the measurement ofquality of life as a key instrumentfor assessing subjective well being.
Taking this experience into accountthe European Commission launchedin 1999 the Eurobarometer study EB52.1 aiming at the measurement ofquality of life and the factors influ-encing it, using a multidimensionalset of indicators. The validity and re-liability of the obtained results werecompared with other studies and itwas found that the developedmethodology was feasible for com-paring quality of life across countries.
The term quality of life is definedhere as the European Citizen’s sub-jective perception of happiness orsatisfaction with his/her living stan-dards and the consumption of pub-lic goods and services. There aremany factors influencing qualityof life. Health, consumption pat-terns, income, family relations,housing and social environmentand personal security are only a fewindicative factors which are dis-cussed at some length below. Theterm quality of life, despite its mul-
tidimensional aspects (i.e. physical,psychological, social participation,cognitive etc.) is used here in ageneric form, capturing the widestpossible factors that describe per-sonal satisfaction with all condi-tions of living. As such, the term en-compasses all individual’s percep-tions and attitudes towards thegeneral concepts of quality andliving standards which are the coreconcepts for our analysis here.
Examining the factors influencingthe quality of life standards acrossthe European member states it wasfound that: good health (25%), suf-ficient income (15%), a caring fam-ily, nice home and friendly neig-bourhood are among the core fac-tors according to Europeans’ sub-jective evaluation that contributeto their quality of life.
Obviously there are several differ-ences among the European coun-tries in the hierarchical order of list-ing the factors. However, goodhealth and sufficient income arethe most prominent issues whichcame on the top of the list acrossall member states. Analysing fur-ther the responses on the relation-ship between quality of life andhealth we found that among all theEuropean Citizens the Greeks as-sign the greatest value on theirhealth (Diagram 6). Being in goodhealth is the top priority among theGreek citizens.
GEOGRAPHY AND POPULATIONGROWTH IN GREECEGeographyGreece is geographically charac-terised by mountains and a scatter-ing of small islands. The total landarea amounts to 131,944 km2, of

about GREECE 73
DEMOGRAPHIC TRENDSAND SOCIO-ECONOMIC INDICATORS IN EU AND GREECE
which 29 per cent is arable, 39 percent is permanent meadow andpasture and only 12 percent is urban.
Officially Greece is divided intofifty-one counties (nomos) andthirteen regions. There exist onehundred and sixty nine inhabitedislands which constitute about 19per cent of the total land areaand they are populated by 17 percent of the total population. Com-munications between the islandsand the mainland have improvedconsiderably in recent years mainlyas a result of tourism, but still cer-tain difficulties remain in com-parison with the rest of the Euro-pean Countries.
Population GrowthThe rate of natural increase in apopulation over time is defined asthe difference between the crudebirth rate and crude death rate,plus the rate of net migration. Instudying the nature of populationgrowth in Greece it suffices to say
that natural, ethnical and historicalreasons have combined to pro-duce an uneven distribution ofthe population, so that more thanone third of the population nowlives in the Athens area, which rep-resents less than 5 per cent ofGreece's territory.
Some 56 per cent of the industrialestablishments in the country and48 per cent of the wage earners inmanufacturing industries are locat-ed in this area.
According to the 2001 populationcensus, there were 10,939,605 in-habitants in Greece of which 49.58per cent were men and the rest50.42 per cent women. In the pe-riod 1971 - 1991 the proportion ofmales has remained fairly con-stant, ranged from 48.9 to 49.0 ofthe total population.
The population of Greece grew by4.7% between 1981 and 1991, fol-lowing an increase of 11.1% during
Diagram 6 Quality of Life in EU

about GREECE74
THE COUNTRY
the previous periods. In thedecade 1991-2001 the rate ofgrowth was 6.7%. (See table 2)
During the 1960s and 1970s asubstantial migration took placefrom the rural to the urban areas.The decline in most rural areas (es-pecially the Ionian and Aegean Is-lands) occurred mainly due to anexodus of the younger generation(from 25 to 45 years of age) fromtheir villages to Athens or Salonica,or alternatively to other developedcountries. This movement is re-sponsible for a profound demo-graphic change which has resultedin a skewed distribution towardsthe aged combined with a negativegrowth in most of the rural areas.
By studying the reproduction ratesof rural and urban populations inGreece, we get the impressionthat since 1950 live births in-creased in the urban populationand decreased in the rural popu-lation. But the number of deathsincreased in both segments. Theexcess of births over deaths in-creased in the urban areas and de-creased precipitously in the ruralareas. Evidently the problem oflow-natality appeared strongly inthe rural population. Depletion ofthe rural population through migra-tion to large cities and the progres-sive ageing of the remaining pop-
ulation are the main causes for thelow-natality observed in the ruralpopulation.
Infant mortality trendsInfant death rates refer to deathswhich occur within the first year oflife. Neonatal death rates refer todeaths which occur after the firstday of birth until the 27th day, andthe post-neonatal death rate refersto the period between the 28th dayafter birth until the 365th day.These death rates are often espe-cially responsive to changing con-ditions of infectious diseases, nu-trition and medical care, and theyare widely considered to be moresensitive indicators of the environ-mental factors affecting the levelof health than are death rates atlater ages.
By analysing infant, neonatal, andpost-neonatal mortality rates ac-cording to their cause of death,and by distinguishing betweenrural and urban populations, themost common causes of death, es-pecially in rural areas, are seen tobe due to infectious diseases, in-juries incurred at birth, post-natalasphyxia, diseases peculiar toearly infancy and immaturity.
Analysing the Greek data we candescribe briefly the following facts:• The rate of infant mortality is
Table 2 Population of Greece by sex and major age groups
YEAR TOTAL MALES FEMALES0-14
YEARS
15-64
YEARS
65 & OVER
YEARS
1971 8,768,372 4,286,748 4,481,624 2,223,904 5,587,352 957,116
1981 9,739,589 4,779,571 4,960,018 2,307,297 6,192,751 1,239,541
1991 10,252,580 5,051,553 5,201,027 1,880,800 6,866,400 1,452,800
2001 10,939,605 5,424,089 5,515,516
Source: National Statistic Service of Greece
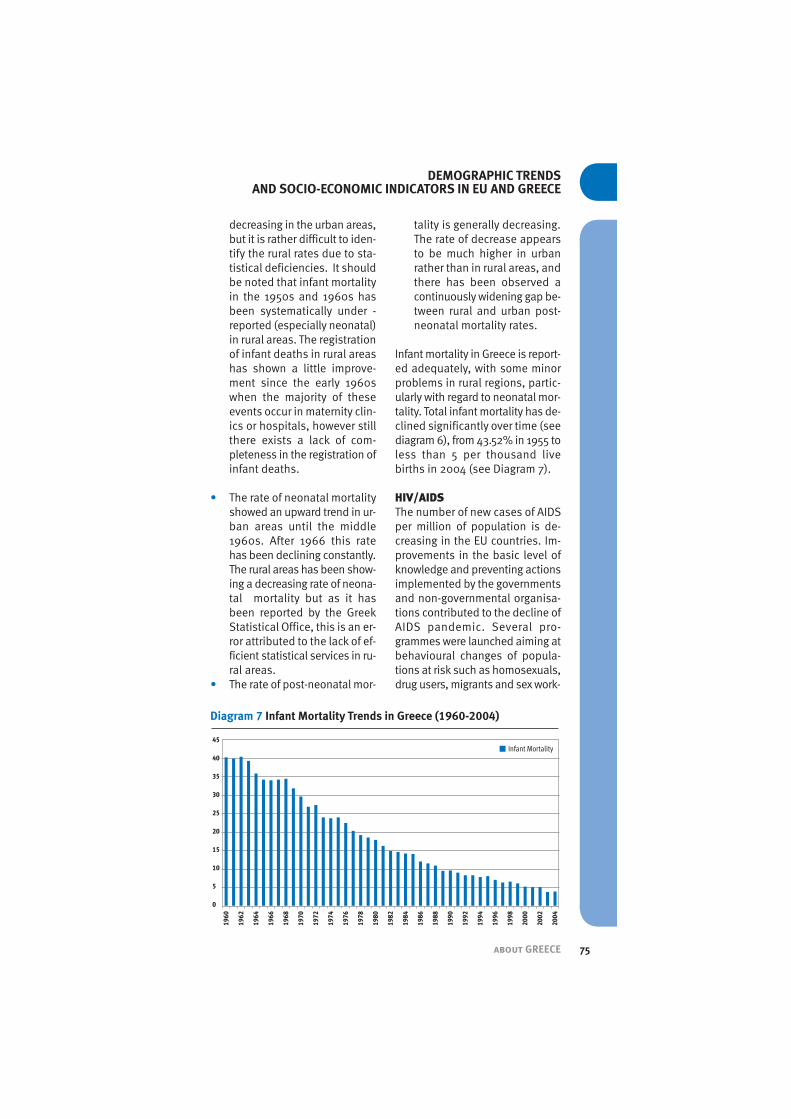
Diagram 7 Infant Mortality Trends in Greece (1960-2004)
about GREECE 75
DEMOGRAPHIC TRENDSAND SOCIO-ECONOMIC INDICATORS IN EU AND GREECE
decreasing in the urban areas,but it is rather difficult to iden-tify the rural rates due to sta-tistical deficiencies. It shouldbe noted that infant mortalityin the 1950s and 1960s hasbeen systematically under -reported (especially neonatal)in rural areas. The registrationof infant deaths in rural areashas shown a little improve-ment since the early 1960swhen the majority of theseevents occur in maternity clin-ics or hospitals, however stillthere exists a lack of com-pleteness in the registration ofinfant deaths.
• The rate of neonatal mortalityshowed an upward trend in ur-ban areas until the middle1960s. After 1966 this ratehas been declining constantly.The rural areas has been show-ing a decreasing rate of neona-tal mortality but as it hasbeen reported by the GreekStatistical Office, this is an er-ror attributed to the lack of ef-ficient statistical services in ru-ral areas.
• The rate of post-neonatal mor-
tality is generally decreasing.The rate of decrease appearsto be much higher in urbanrather than in rural areas, andthere has been observed acontinuously widening gap be-tween rural and urban post-neonatal mortality rates.
Infant mortality in Greece is report-ed adequately, with some minorproblems in rural regions, partic-ularly with regard to neonatal mor-tality. Total infant mortality has de-clined significantly over time (seediagram 6), from 43.52% in 1955 toless than 5 per thousand livebirths in 2004 (see Diagram 7).
HIV/AIDSThe number of new cases of AIDSper million of population is de-creasing in the EU countries. Im-provements in the basic level ofknowledge and preventing actionsimplemented by the governmentsand non-governmental organisa-tions contributed to the decline ofAIDS pandemic. Several pro-grammes were launched aiming atbehavioural changes of popula-tions at risk such as homosexuals,drug users, migrants and sex work-

about GREECE76
THE COUNTRY
ers. The Ministry of Health and So-cial Solidarity in Greece in collab-oration with NGOs and other or-ganization stimulate and supportpreventing actions to control AIDSand to provide practical adviceand assistant for promoting HIVtesting and counselling to fightagainst the epidemic. Diagram 8highlights the AIDS incidencetrends in Greece over the period1981-2004.
On the base of Diagram 8 we maydistinguish two periods: the first,1981-1996 is characterised by in-creasing trends and then the sec-ond 1997 -2004 by decliningtrends. The monitoring of the epi-demic in conjunction with pre-vention actions contributed to thedecline of the epidemic.
ACCESSION COUNTRIES In 2005 all the applicant countrieshad a lower GDP per capita ex-pressed in PPS (Purchasing PowerStandards) than the EU-25 average.However the range among the Ac-cession Countries is considerable,going from very low values in Latvia
(46.4), Poland (50), and Lithuania(50.9) to higher values in Slovenia(81.2) and Cyprus (84.5). In otherterms, GDP per capita in the appli-cant countries ranges from 46.4%to 84.5% of the EU-25 average.
Diagram 9 provides an overview ofthe income variation among the EUand the Accession Countries. Ex-cluding Luxembourg, all the rest ofEU countries present a variation oftheir GDP close to the average.The Enlargement countries, aftermarked declines in their GDPgrowth rates, during the transitionperiod to a market economy, theypresent convergent trends with therest of EU States. However, still theyconfront considerable lags in thecatch up process. In 2005 Slovenia(81.2) and Czech Republic (72.7)had an income per capita higherthan Portugal (71.7) and much clos-er to Greece (83.1) reaching the bot-tom limit of the EU Countries.
GDP per capita in Purchasing Pow-er Standards (PPS), (EU-25=100)One of the EU’s principal objec-
tives is to strength the economicand social cohesion by ensuring an
Diagram 8 Aids Incidence per Million Population in Greece (1981-2004)

about GREECE 77
DEMOGRAPHIC TRENDSAND SOCIO-ECONOMIC INDICATORS IN EU AND GREECE
overall harmonious development.As it is stated in the EC Treaty(Art.2) “the Community shall haveat its task…” the continuous “risingof the standard of living and qual-ity of life”. Social cohesion oftenimplies “greater equality in eco-nomic and social opportunities”.
Examining social cohesion in theAccession Countries we shall adoptthe common methodology whichargues that one of the dimensionsof social cohesion is the fightagainst poverty and social exclu-sion. We should underline here thedifficulties in drawing comparisonsbetween Eastern and Western Eu-ropean Countries, as well as withinthe Eastern countries since thepublication of income data underthe Communist regimes was ex-tremely restricted. There had beenseveral supporters of the hypoth-esis that socialism had reduced in-come differentials and developedeffective policies to reduce or eveneliminate poverty. Despite the lackof historical income statistics, an
effort is made here to provide ev-idence presented by the Eurostatand the European Commision.
Poverty and Social Exclusion Poverty and social exclusion is amultidimensional phenomenon.They are close related to income,employment and educational sta-tus and to access of high qualityhealth and welfare services. Thissection provides a brief overview,a snapshot, of the poverty and so-cial inclusion situation in the Eu-ropean Union (EU-25). Althoughthere are several definitions ofpoverty we will restrict ourselves toa more general approach proposedby the European Commission. Theobjective is to specify comparableindicators across all the EuropeanMember states, which would pro-vide adequate information forshaping policies to combat povertyand social exclusion. According tothe Eurostat definition individualsare considered to be at risk ofpoverty if their household incomeis below 60% of the national equiv-
Diagram 9 GDP per capita in PPS in 2005

about GREECE78
THE COUNTRY
alised median income. In 2003 theaverage poverty rate in the EU was16% (Diagram 10).
Diagram 10 portrays considerable dif-ferences among the EU-25 Statesranging from 8% in the Czech Repub-lic to around 21% in Ireland Portugaland Slovakia. Greece is classifiedamong the countries with the highestrates of poverty. Around 20% of theGreek population is living below thepoverty line. The main causes ofpoverty are: low educational status,living in rural areas and lack of workopportunities.
Conclusions
Concluding this chapter, we may ar-gue that there has been a broad ac-ceptance among the European Gov-ernments and policy makers to im-prove longevity, health status andthe overall quality of life among theEU Citizens. Despite the noble inten-tions we found out that there are sig-nificant differences not only be-tween the countries but also withinthe countries among the regionsand the rural / urban populations.
Greece, a country of 10.9 million, hasachieved the longest longevity andthe lowest rates in mortality amongthe European Member States. In ad-dition Greeks believe that the mostimportant factor contributing to theirquality of life is to be in good health.This view is also shared with all therest of EU countries.
The Accession countries presentsignificant differences in GDP percapita and in living standards incomparison to Europe. Income in-equalities are much higher in the ac-cession countries and this is attrib-uted to the economic crisis con-fronted during the liberalization ofthe prices and the transition from aplanned to a market economy. How-ever during the last few years somecountries have shown impressiveconvergence trends.
USEFUL LINKS
General Secretariat of National StatisticalService of Greecehttp://www.statistics.gr
Diagram 10 Poverty Rates in EU-25 in 2003