DEMOGRAPHICS & DATA - Milwaukeecity.milwaukee.gov/ImageLibrary/Groups/cityDCD/planning/plans/... ·...
16
DEMOGRAPHICS & DATA
Transcript of DEMOGRAPHICS & DATA - Milwaukeecity.milwaukee.gov/ImageLibrary/Groups/cityDCD/planning/plans/... ·...

DEMOGRAPHICS & DATA

“The goal is to transform data into information, and information into insight.” – Carly Fiorina

11 MILWAUKEE CITYWIDE POLICY PLAN
DATA AND DEMOGRAPHICS 12
This chapter presents data and trends in the city’s population over time, future forecasts, and the spatial distribution of these characteristics across the city. This information is highly useful in establishing policies and programs intended to improve the city’s livability, economic strength, and other assets. More detailed information on specifi c areas of the city can be found in the Area Plans.
POPULATION TRENDS AND PROJECTIONS 1960-2025Like many major American cities, the City of Milwaukee experienced population decline for several decades following its historic peak of 741,324 in 1960. The migration of city dwellers to the suburbs that began with the automobile was accelerated by massive freeway development in the
1950s and the development of newer, larger housing options in outlying areas. Smaller family size, loss of manufacturing jobs, and other factors exacerbated the loss of population in the city.
In 2000, the city’s population had fallen to 596,974, a 19% decline from 1960 levels. The city’s proportion of Milwaukee County’s population also fell during this period. In 1960, the city made up 71.6% of the county’s population and in 2000 that percentage had decreased to 63.5%. (U.S. Census Bureau)
Since 2000, however, the city’s population has stabilized and begun to grow once more. The 2008 American Community Survey (ACS) estimates Milwaukee’s population at 604,477,
making it the 23rd largest city in the U.S., similar in size to Boston, Seattle, and Washington, DC.
According to Wisconsin Department of Administration (WisDOA) projections, Milwaukee’s population will continue to grow slightly in coming years. Between 2000 and 2025, WisDOA forecasts that Milwaukee’s population will increase by 4.3% to approximately 623,000 (Figure 1). Natural increase (births minus deaths) and in-migration by the Hispanic population account for much of the expected increase.
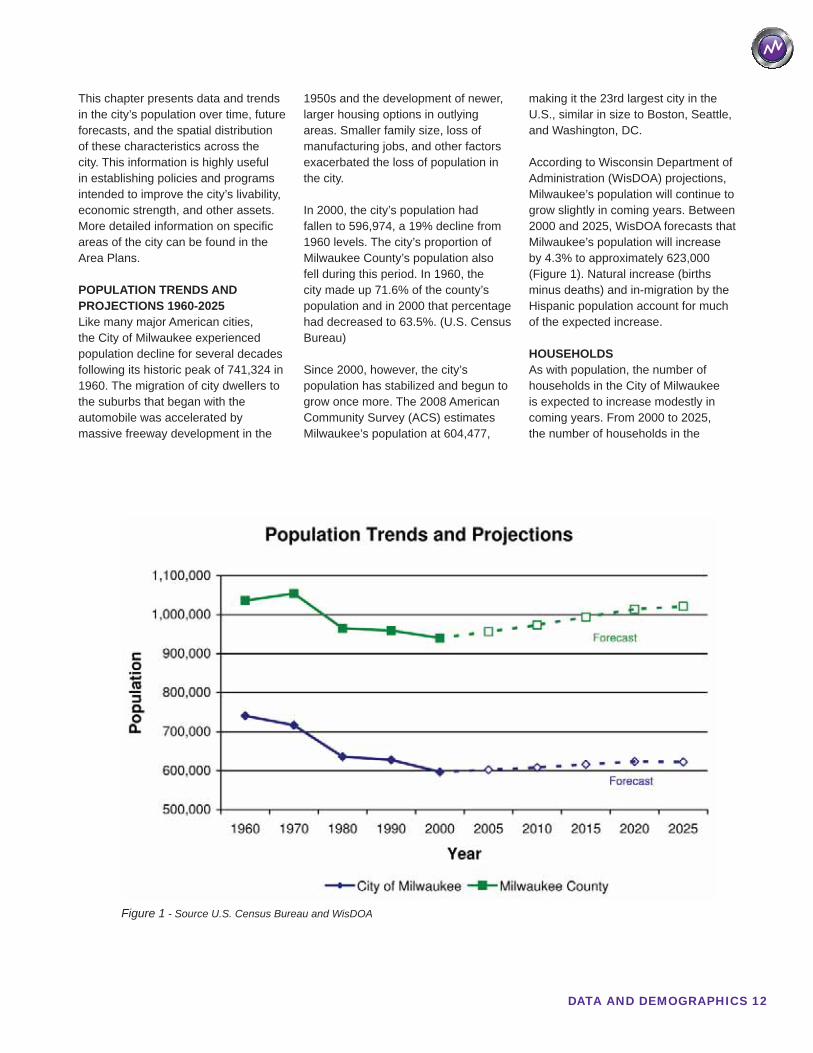
HOUSEHOLDSAs with population, the number of households in the City of Milwaukee is expected to increase modestly in coming years. From 2000 to 2025, the number of households in the
Figure 1 - Source U.S. Census Bureau and WisDOA
13 MILWAUKEE CITYWIDE POLICY PLAN
city is expected to rise by 24,000 or 10.1% (Figure 2). Based on this projected increase, as well as potential for changing characteristics of households (empty nesters, single parent, alternative lifestyles, etc), the city will need to develop suffi cient and diverse housing choices to provide for these additional households. (WisDOA)
The higher rate of household growth compared to population growth is largely due to the city’s decreasing average household size. The average number of persons per household in Milwaukee has declined from 2.61 in 1990 to 2.57 in 2000 and 2.43 in 2005, a trend that is expected to continue. (U.S. Census Bureau) Reasons for this decrease include lower birth rates, higher divorce rates,
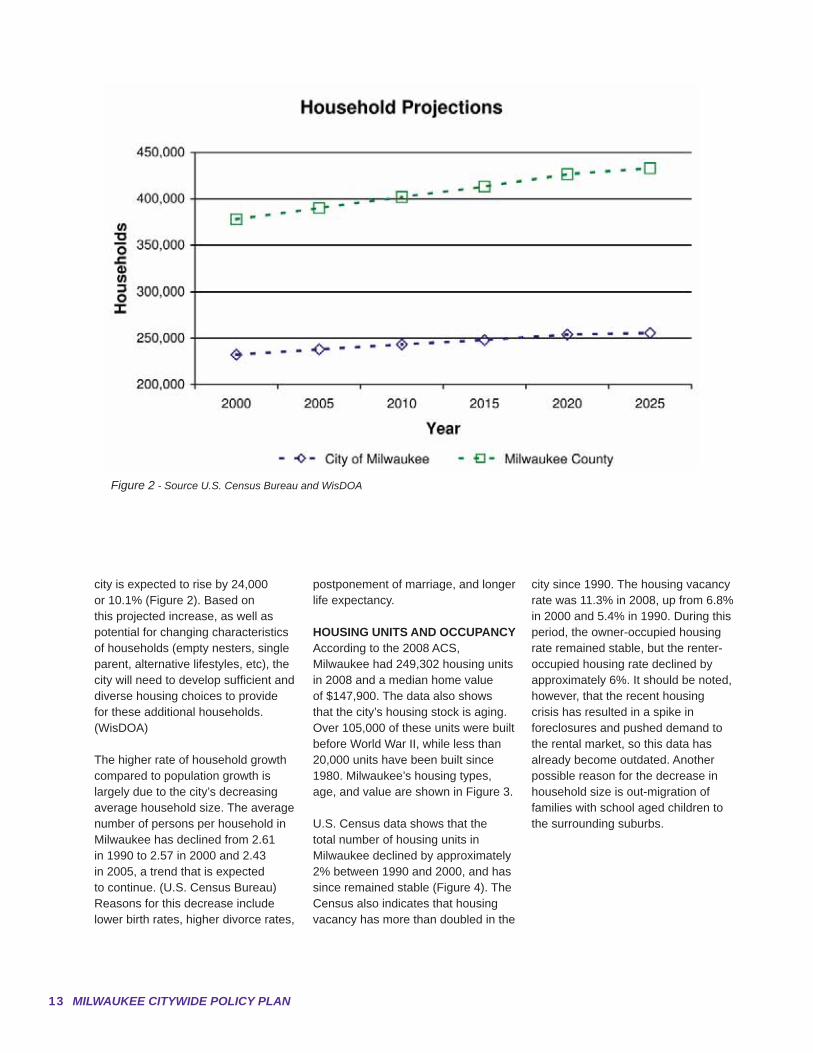
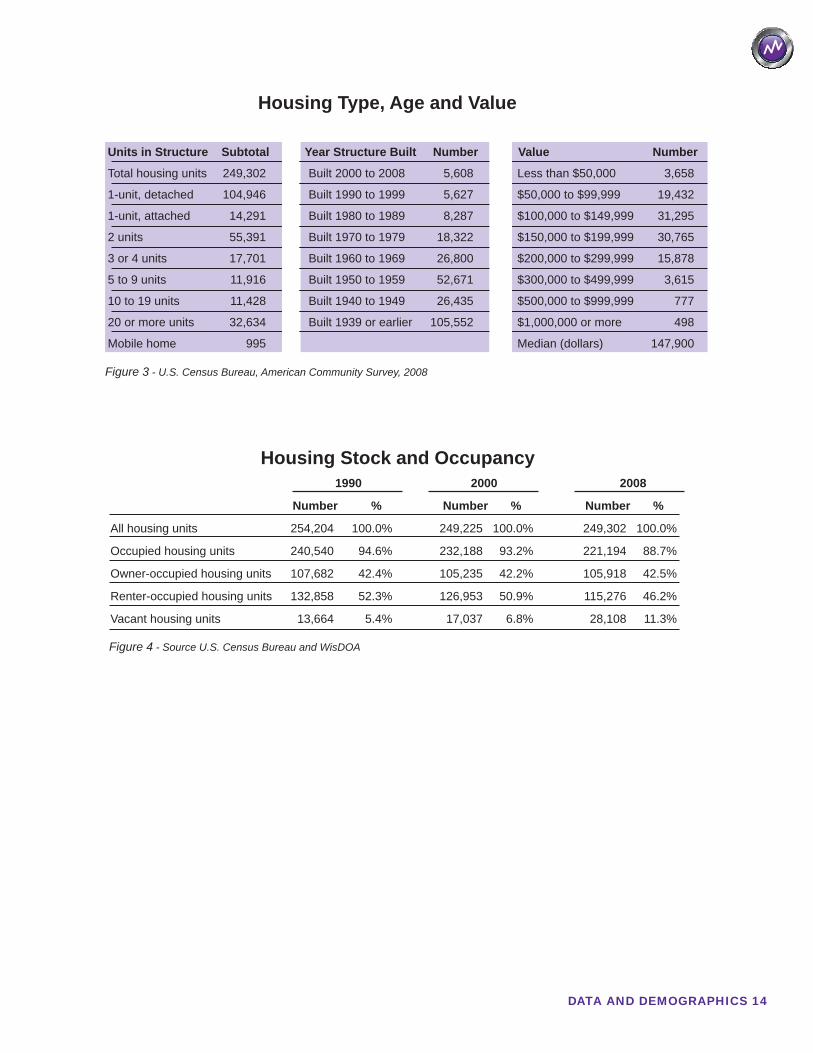
postponement of marriage, and longer life expectancy. HOUSING UNITS AND OCCUPANCYAccording to the 2008 ACS, Milwaukee had 249,302 housing units in 2008 and a median home value of $147,900. The data also shows that the city’s housing stock is aging. Over 105,000 of these units were built before World War II, while less than 20,000 units have been built since 1980. Milwaukee’s housing types, age, and value are shown in Figure 3.
U.S. Census data shows that the total number of housing units in Milwaukee declined by approximately 2% between 1990 and 2000, and has since remained stable (Figure 4). The Census also indicates that housing vacancy has more than doubled in the
city since 1990. The housing vacancy rate was 11.3% in 2008, up from 6.8% in 2000 and 5.4% in 1990. During this period, the owner-occupied housing rate remained stable, but the renter-occupied housing rate declined by approximately 6%. It should be noted, however, that the recent housing crisis has resulted in a spike in foreclosures and pushed demand to the rental market, so this data has already become outdated. Another possible reason for the decrease in household size is out-migration of families with school aged children to the surrounding suburbs.
Figure 2 - Source U.S. Census Bureau and WisDOA
DATA AND DEMOGRAPHICS 14
Units in Structure Subtotal Year Structure Built Number Value Number
Total housing units 249,302 Built 2000 to 2008 5,608 Less than $50,000 3,658
1-unit, detached 104,946 Built 1990 to 1999 5,627 $50,000 to $99,999 19,432
1-unit, attached 14,291 Built 1980 to 1989 8,287 $100,000 to $149,999 31,295
2 units 55,391 Built 1970 to 1979 18,322 $150,000 to $199,999 30,765
3 or 4 units 17,701 Built 1960 to 1969 26,800 $200,000 to $299,999 15,878
5 to 9 units 11,916 Built 1950 to 1959 52,671 $300,000 to $499,999 3,615
10 to 19 units 11,428 Built 1940 to 1949 26,435 $500,000 to $999,999 777
20 or more units 32,634 Built 1939 or earlier 105,552 $1,000,000 or more 498
Mobile home 995 Median (dollars) 147,900
Figure 3 - U.S. Census Bureau, American Community Survey, 2008
1990 2000 2008
Number % Number % Number %
All housing units 254,204 100.0% 249,225 100.0% 249,302 100.0%
Occupied housing units 240,540 94.6% 232,188 93.2% 221,194 88.7%
Owner-occupied housing units 107,682 42.4% 105,235 42.2% 105,918 42.5%
Renter-occupied housing units 132,858 52.3% 126,953 50.9% 115,276 46.2%
Vacant housing units 13,664 5.4% 17,037 6.8% 28,108 11.3%
Figure 4 - Source U.S. Census Bureau and WisDOA
Housing Stock and Occupancy
Housing Type, Age and Value
15 MILWAUKEE CITYWIDE POLICY PLAN
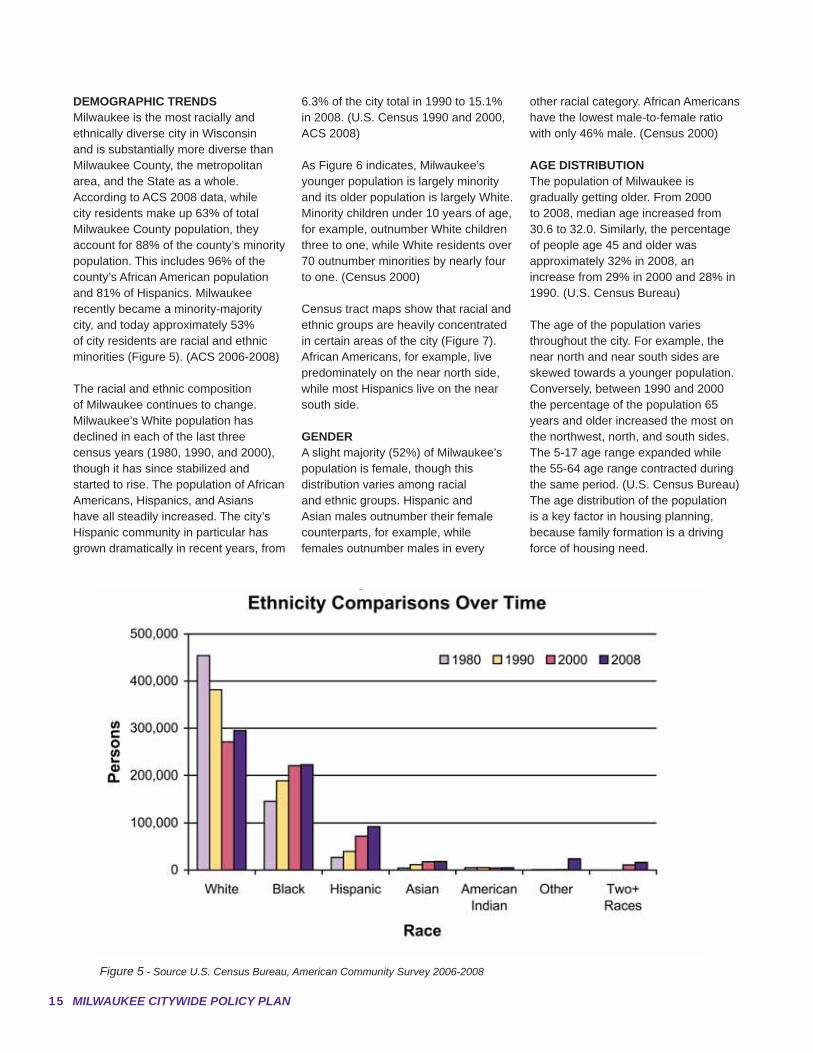
DEMOGRAPHIC TRENDSMilwaukee is the most racially and ethnically diverse city in Wisconsin and is substantially more diverse than Milwaukee County, the metropolitan area, and the State as a whole. According to ACS 2008 data, while city residents make up 63% of total Milwaukee County population, they account for 88% of the county’s minority population. This includes 96% of the county’s African American population and 81% of Hispanics. Milwaukee recently became a minority-majority city, and today approximately 53% of city residents are racial and ethnic minorities (Figure 5). (ACS 2006-2008)
The racial and ethnic composition of Milwaukee continues to change. Milwaukee’s White population has declined in each of the last three census years (1980, 1990, and 2000), though it has since stabilized and started to rise. The population of African Americans, Hispanics, and Asians have all steadily increased. The city’s Hispanic community in particular has grown dramatically in recent years, from
6.3% of the city total in 1990 to 15.1% in 2008. (U.S. Census 1990 and 2000, ACS 2008)
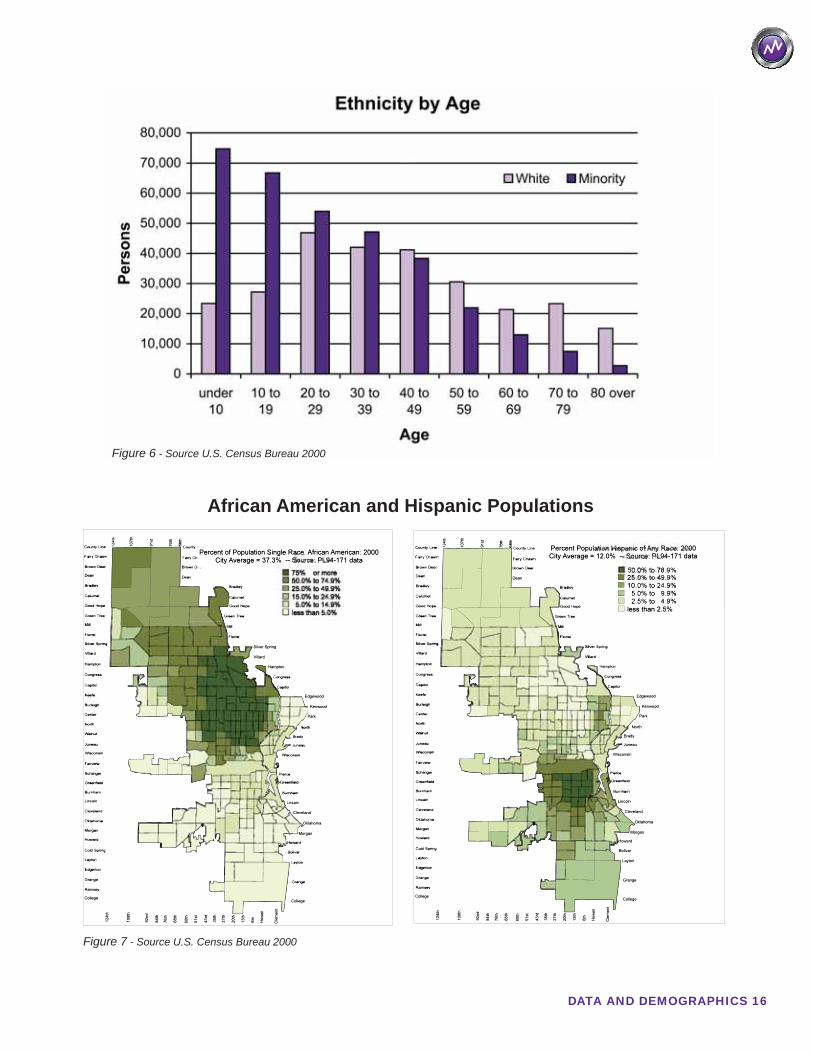
As Figure 6 indicates, Milwaukee’s younger population is largely minority and its older population is largely White. Minority children under 10 years of age, for example, outnumber White children three to one, while White residents over 70 outnumber minorities by nearly four to one. (Census 2000)
Census tract maps show that racial and ethnic groups are heavily concentrated in certain areas of the city (Figure 7). African Americans, for example, live predominately on the near north side, while most Hispanics live on the near south side.
GENDERA slight majority (52%) of Milwaukee’s population is female, though this distribution varies among racial and ethnic groups. Hispanic and Asian males outnumber their female counterparts, for example, while females outnumber males in every
other racial category. African Americans have the lowest male-to-female ratio with only 46% male. (Census 2000)
AGE DISTRIBUTIONThe population of Milwaukee is gradually getting older. From 2000 to 2008, median age increased from 30.6 to 32.0. Similarly, the percentage of people age 45 and older was approximately 32% in 2008, an increase from 29% in 2000 and 28% in 1990. (U.S. Census Bureau)
The age of the population varies throughout the city. For example, the near north and near south sides are skewed towards a younger population. Conversely, between 1990 and 2000 the percentage of the population 65 years and older increased the most on the northwest, north, and south sides. The 5-17 age range expanded while the 55-64 age range contracted during the same period. (U.S. Census Bureau) The age distribution of the population is a key factor in housing planning, because family formation is a driving force of housing need.
Figure 5 - Source U.S. Census Bureau, American Community Survey 2006-2008
DATA AND DEMOGRAPHICS 16
Figure 6 - Source U.S. Census Bureau 2000
Figure 7 - Source U.S. Census Bureau 2000
African American and Hispanic Populations
17 MILWAUKEE CITYWIDE POLICY PLAN
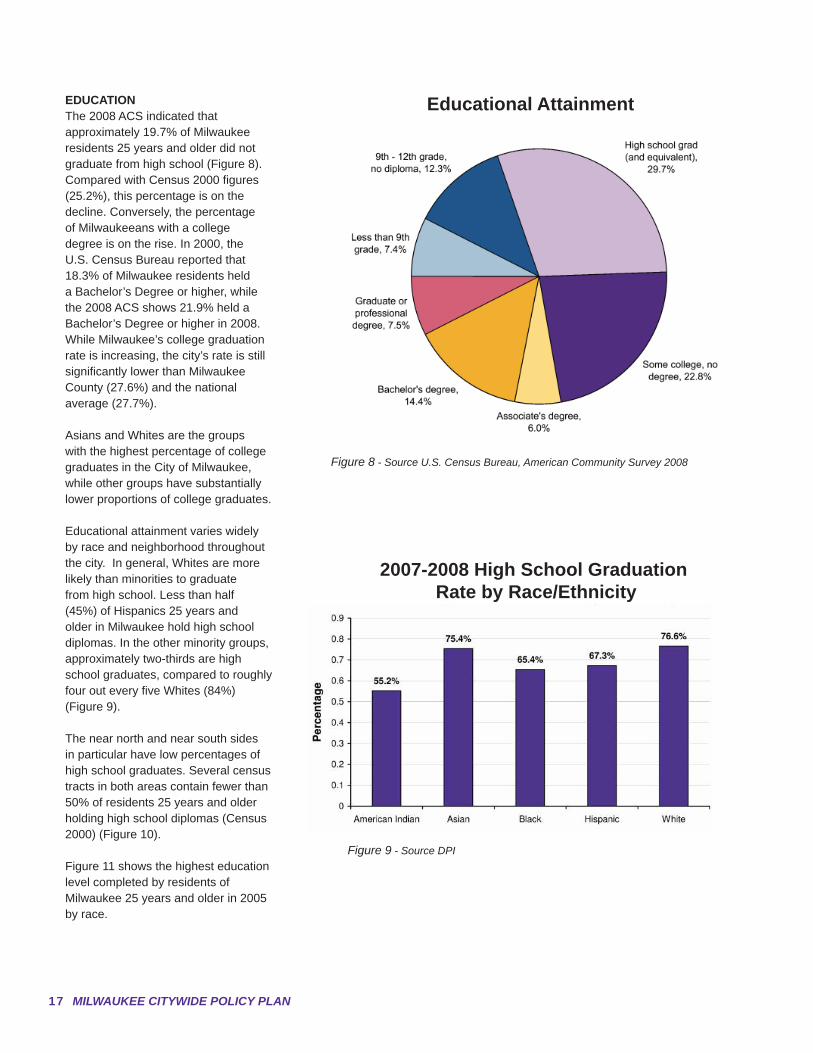
EDUCATIONThe 2008 ACS indicated that approximately 19.7% of Milwaukee residents 25 years and older did not graduate from high school (Figure 8). Compared with Census 2000 fi gures (25.2%), this percentage is on the decline. Conversely, the percentage of Milwaukeeans with a college degree is on the rise. In 2000, the U.S. Census Bureau reported that 18.3% of Milwaukee residents held a Bachelor’s Degree or higher, while the 2008 ACS shows 21.9% held a Bachelor’s Degree or higher in 2008. While Milwaukee’s college graduation rate is increasing, the city’s rate is still signifi cantly lower than Milwaukee County (27.6%) and the national average (27.7%).
Asians and Whites are the groups with the highest percentage of college graduates in the City of Milwaukee, while other groups have substantially lower proportions of college graduates.
Educational attainment varies widely by race and neighborhood throughout the city. In general, Whites are more likely than minorities to graduate from high school. Less than half (45%) of Hispanics 25 years and older in Milwaukee hold high school diplomas. In the other minority groups, approximately two-thirds are high school graduates, compared to roughly four out every fi ve Whites (84%) (Figure 9).
The near north and near south sides in particular have low percentages of high school graduates. Several census tracts in both areas contain fewer than 50% of residents 25 years and older holding high school diplomas (Census 2000) (Figure 10).
Figure 11 shows the highest education level completed by residents of Milwaukee 25 years and older in 2005 by race.
Figure 8 - Source U.S. Census Bureau, American Community Survey 2008
Figure 9 - Source DPI
Educational Attainment
2007-2008 High School Graduation Rate by Race/Ethnicity
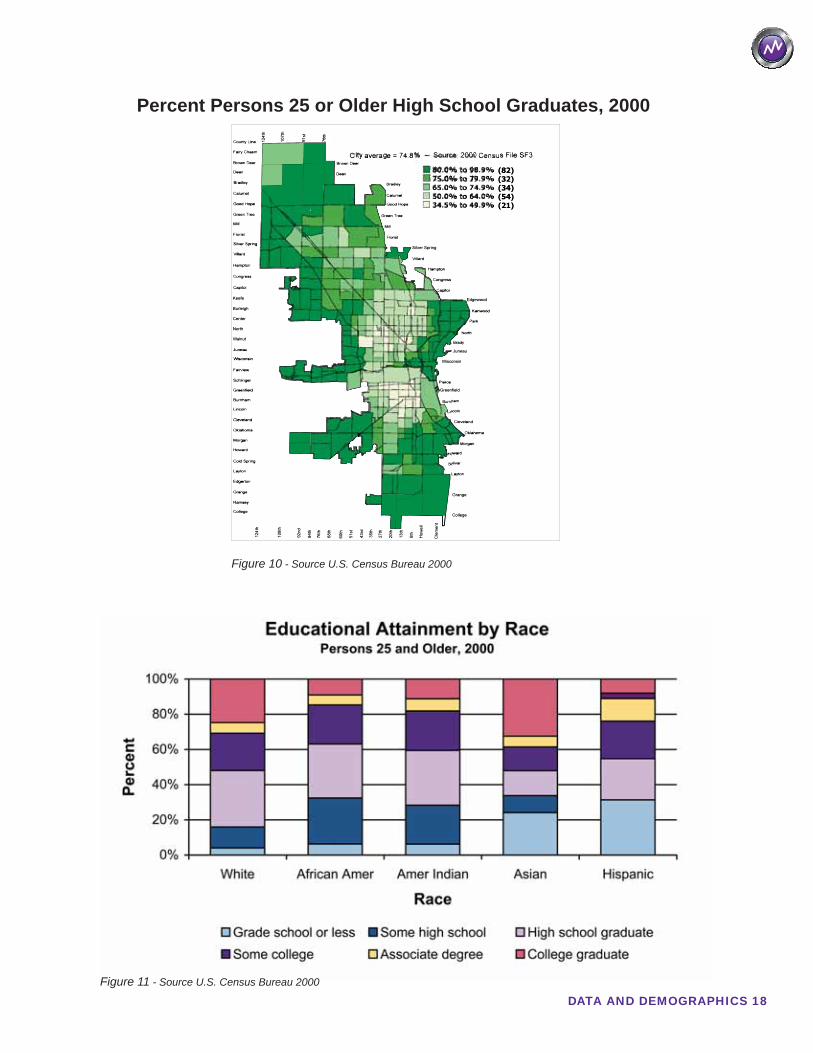
DATA AND DEMOGRAPHICS 18Figure 11 - Source U.S. Census Bureau 2000
Percent Persons 25 or Older High School Graduates, 2000
Figure 10 - Source U.S. Census Bureau 2000
19 MILWAUKEE CITYWIDE POLICY PLAN
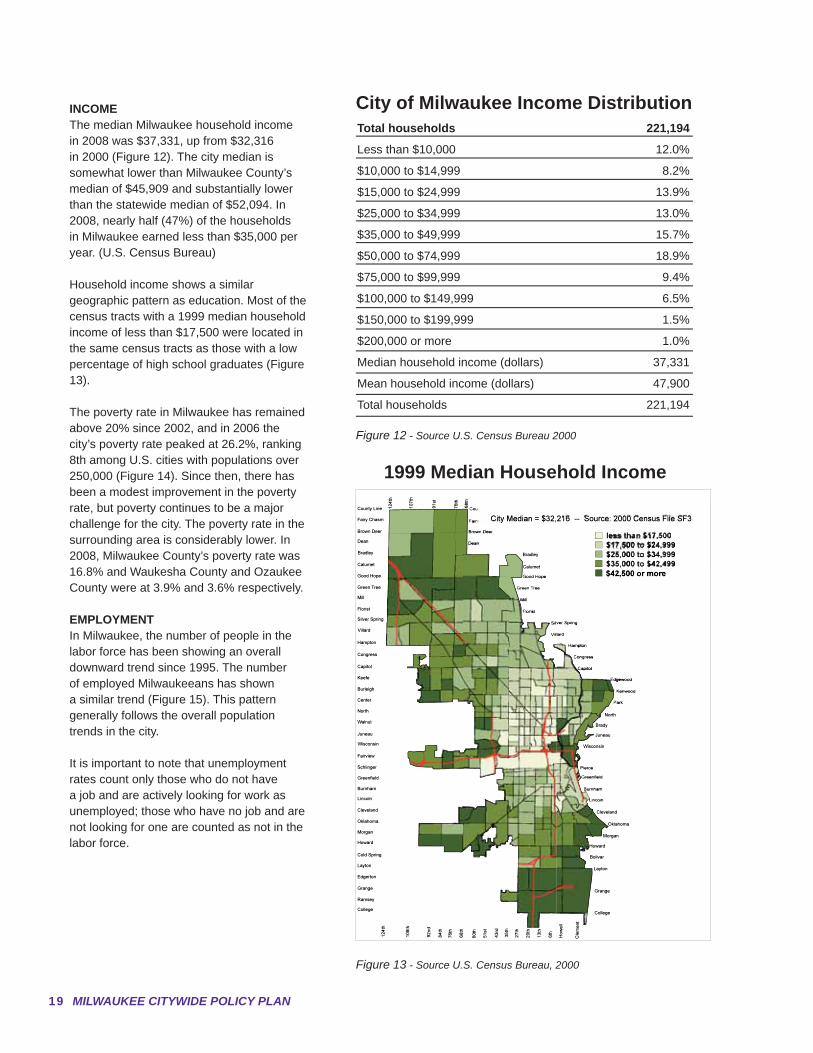
INCOMEThe median Milwaukee household income in 2008 was $37,331, up from $32,316 in 2000 (Figure 12). The city median is somewhat lower than Milwaukee County’s median of $45,909 and substantially lower than the statewide median of $52,094. In 2008, nearly half (47%) of the households in Milwaukee earned less than $35,000 per year. (U.S. Census Bureau)
Household income shows a similar geographic pattern as education. Most of the census tracts with a 1999 median household income of less than $17,500 were located in the same census tracts as those with a low percentage of high school graduates (Figure 13).
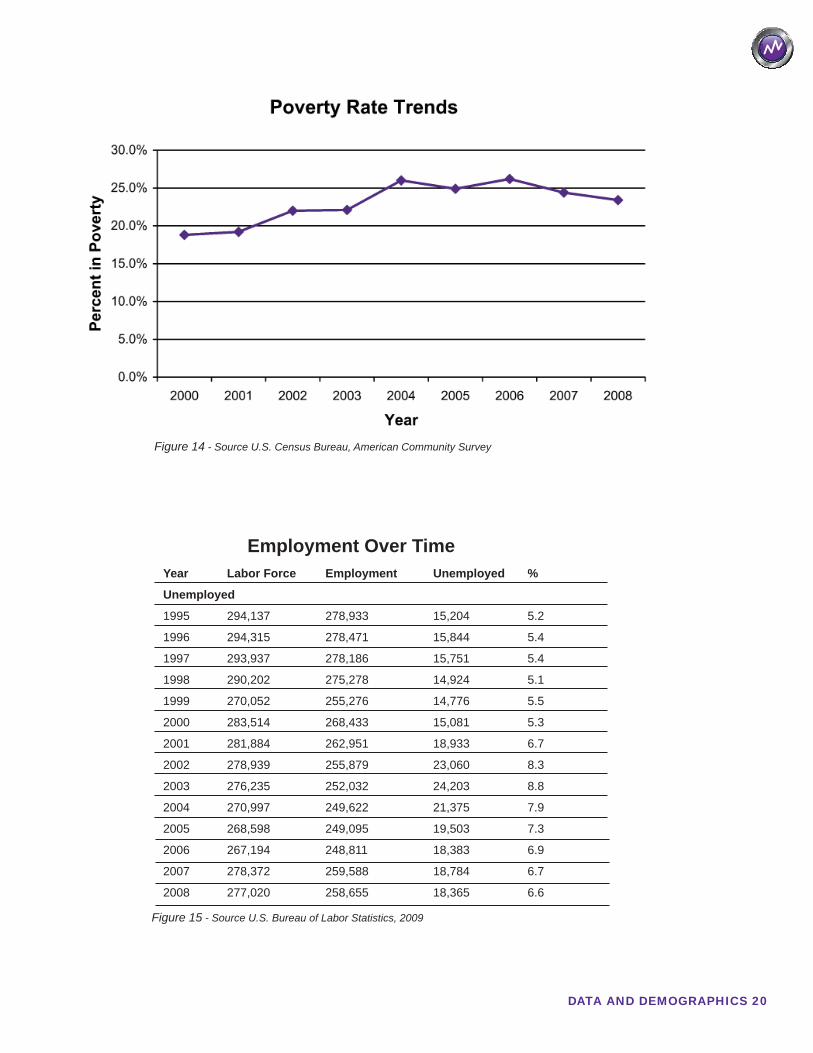
The poverty rate in Milwaukee has remained above 20% since 2002, and in 2006 the city’s poverty rate peaked at 26.2%, ranking 8th among U.S. cities with populations over 250,000 (Figure 14). Since then, there has been a modest improvement in the poverty rate, but poverty continues to be a major challenge for the city. The poverty rate in the surrounding area is considerably lower. In 2008, Milwaukee County’s poverty rate was 16.8% and Waukesha County and Ozaukee County were at 3.9% and 3.6% respectively.
EMPLOYMENTIn Milwaukee, the number of people in the labor force has been showing an overall downward trend since 1995. The number of employed Milwaukeeans has shown a similar trend (Figure 15). This pattern generally follows the overall population trends in the city.
It is important to note that unemployment rates count only those who do not have a job and are actively looking for work as unemployed; those who have no job and are not looking for one are counted as not in the labor force.
Figure 13 - Source U.S. Census Bureau, 2000
Total households 221,194
Less than $10,000 12.0%
$10,000 to $14,999 8.2%
$15,000 to $24,999 13.9%
$25,000 to $34,999 13.0%
$35,000 to $49,999 15.7%
$50,000 to $74,999 18.9%
$75,000 to $99,999 9.4%
$100,000 to $149,999 6.5%
$150,000 to $199,999 1.5%
$200,000 or more 1.0%
Median household income (dollars) 37,331
Mean household income (dollars) 47,900
Total households 221,194
Figure 12 - Source U.S. Census Bureau 2000
City of Milwaukee Income Distribution
1999 Median Household Income
DATA AND DEMOGRAPHICS 20
Figure 14 - Source U.S. Census Bureau, American Community Survey
Figure 15 - Source U.S. Bureau of Labor Statistics, 2009
Employment Over TimeYear Labor Force Employment Unemployed %
Unemployed
1995 294,137 278,933 15,204 5.2
1996 294,315 278,471 15,844 5.4
1997 293,937 278,186 15,751 5.4
1998 290,202 275,278 14,924 5.1
1999 270,052 255,276 14,776 5.5
2000 283,514 268,433 15,081 5.3
2001 281,884 262,951 18,933 6.7
2002 278,939 255,879 23,060 8.3
2003 276,235 252,032 24,203 8.8
2004 270,997 249,622 21,375 7.9
2005 268,598 249,095 19,503 7.3
2006 267,194 248,811 18,383 6.9
2007 278,372 259,588 18,784 6.7
2008 277,020 258,655 18,365 6.6
21 MILWAUKEE CITYWIDE POLICY PLAN
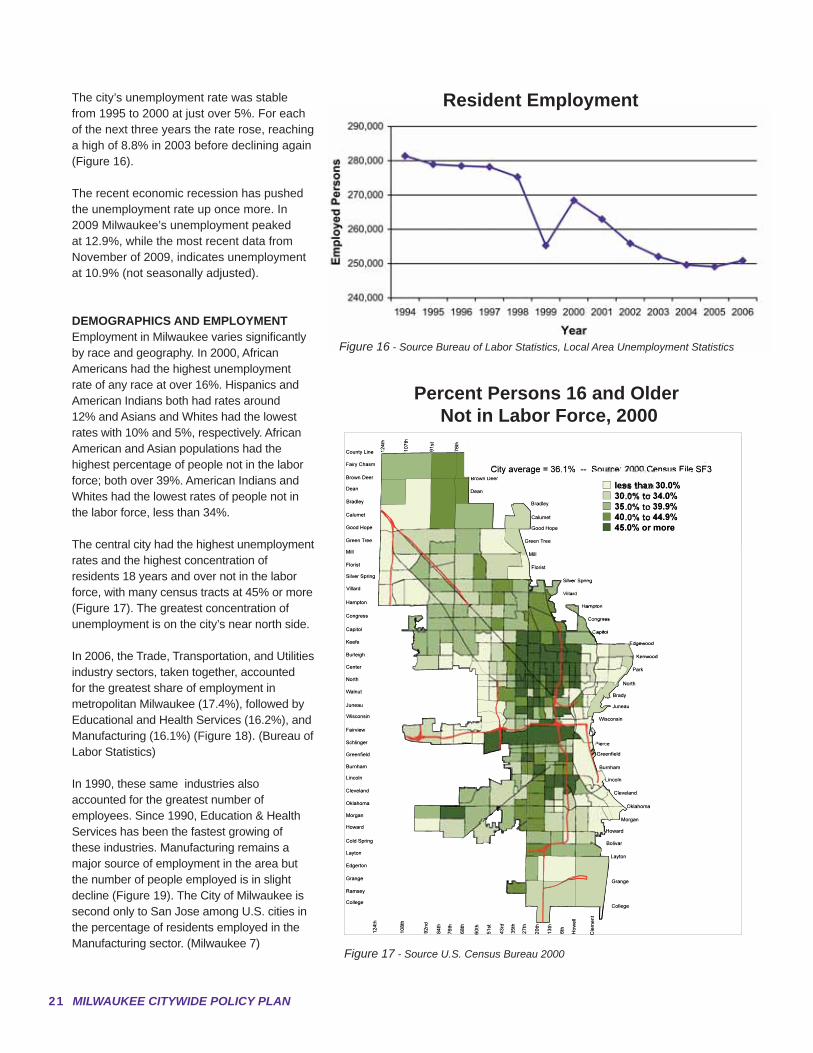
The city’s unemployment rate was stable from 1995 to 2000 at just over 5%. For each of the next three years the rate rose, reaching a high of 8.8% in 2003 before declining again (Figure 16). The recent economic recession has pushed the unemployment rate up once more. In 2009 Milwaukee’s unemployment peaked at 12.9%, while the most recent data from November of 2009, indicates unemployment at 10.9% (not seasonally adjusted).
DEMOGRAPHICS AND EMPLOYMENTEmployment in Milwaukee varies signifi cantly by race and geography. In 2000, African Americans had the highest unemployment rate of any race at over 16%. Hispanics and American Indians both had rates around 12% and Asians and Whites had the lowest rates with 10% and 5%, respectively. African American and Asian populations had the highest percentage of people not in the labor force; both over 39%. American Indians and Whites had the lowest rates of people not in the labor force, less than 34%.
The central city had the highest unemployment rates and the highest concentration of residents 18 years and over not in the labor force, with many census tracts at 45% or more (Figure 17). The greatest concentration of unemployment is on the city’s near north side.
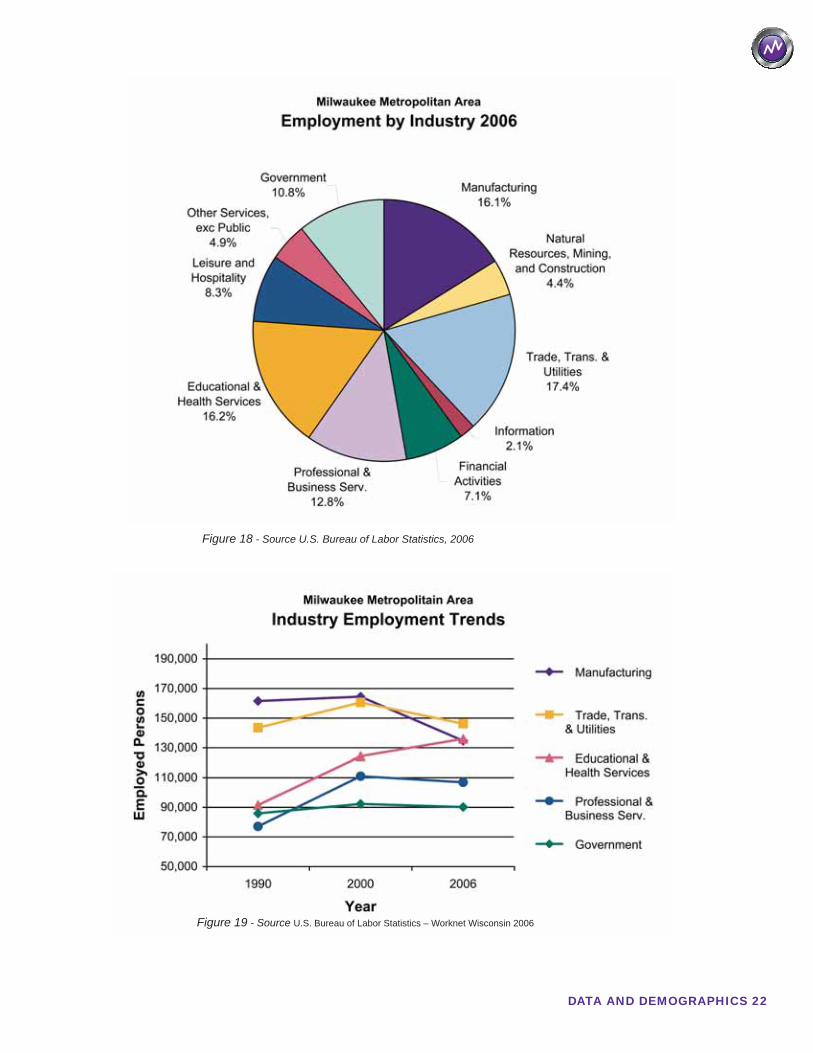
In 2006, the Trade, Transportation, and Utilities industry sectors, taken together, accounted for the greatest share of employment in metropolitan Milwaukee (17.4%), followed by Educational and Health Services (16.2%), and Manufacturing (16.1%) (Figure 18). (Bureau of Labor Statistics)
In 1990, these same industries also accounted for the greatest number of employees. Since 1990, Education & Health Services has been the fastest growing of these industries. Manufacturing remains a major source of employment in the area but the number of people employed is in slight decline (Figure 19). The City of Milwaukee is second only to San Jose among U.S. cities in the percentage of residents employed in the Manufacturing sector. (Milwaukee 7)
Figure 17 - Source U.S. Census Bureau 2000
Percent Persons 16 and Older Not in Labor Force, 2000
Figure 16 - Source Bureau of Labor Statistics, Local Area Unemployment Statistics
Resident Employment
DATA AND DEMOGRAPHICS 22
Figure 18 - Source U.S. Bureau of Labor Statistics, 2006
Figure 19 - Source U.S. Bureau of Labor Statistics – Worknet Wisconsin 2006
23 MILWAUKEE CITYWIDE POLICY PLAN
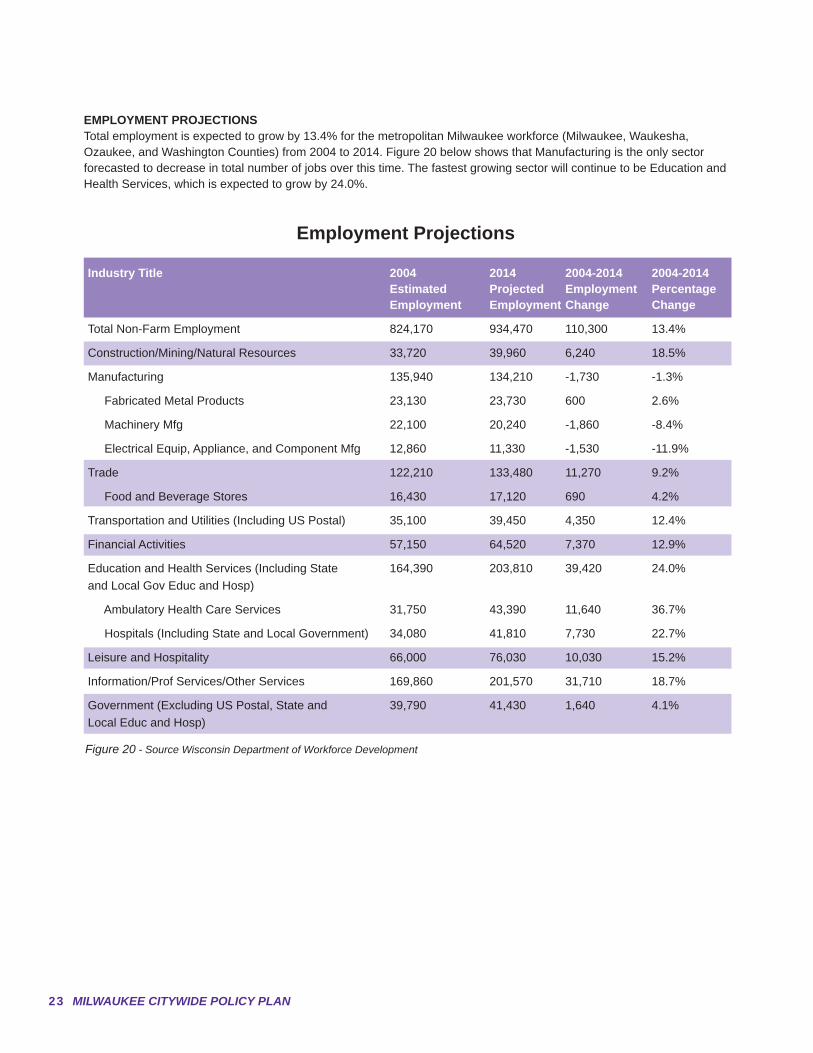
EMPLOYMENT PROJECTIONSTotal employment is expected to grow by 13.4% for the metropolitan Milwaukee workforce (Milwaukee, Waukesha, Ozaukee, and Washington Counties) from 2004 to 2014. Figure 20 below shows that Manufacturing is the only sector forecasted to decrease in total number of jobs over this time. The fastest growing sector will continue to be Education and Health Services, which is expected to grow by 24.0%.
Figure 20 - Source Wisconsin Department of Workforce Development
Industry Title 2004 2014 2004-2014 2004-2014 Estimated Projected Employment Percentage Employment Employment Change Change
Total Non-Farm Employment 824,170 934,470 110,300 13.4%
Construction/Mining/Natural Resources 33,720 39,960 6,240 18.5%
Manufacturing 135,940 134,210 -1,730 -1.3%
Fabricated Metal Products 23,130 23,730 600 2.6%
Machinery Mfg 22,100 20,240 -1,860 -8.4%
Electrical Equip, Appliance, and Component Mfg 12,860 11,330 -1,530 -11.9%
Trade 122,210 133,480 11,270 9.2%
Food and Beverage Stores 16,430 17,120 690 4.2%
Transportation and Utilities (Including US Postal) 35,100 39,450 4,350 12.4%
Financial Activities 57,150 64,520 7,370 12.9%
Education and Health Services (Including State 164,390 203,810 39,420 24.0%and Local Gov Educ and Hosp)
Ambulatory Health Care Services 31,750 43,390 11,640 36.7%
Hospitals (Including State and Local Government) 34,080 41,810 7,730 22.7%
Leisure and Hospitality 66,000 76,030 10,030 15.2%
Information/Prof Services/Other Services 169,860 201,570 31,710 18.7%
Government (Excluding US Postal, State and 39,790 41,430 1,640 4.1%Local Educ and Hosp)
Employment Projections

DATA AND DEMOGRAPHICS 24