Demographic Factors in the Evaluation of Service Quality...
17
ISSN: 2306-9007 Min & Khoon (2013) 994 Demographic Factors in the Evaluation of Service Quality in Higher Education: International Students’ Perspective SEIN MIN Lecturer, MDIS Business School, Singapore Email: [email protected] Tel: +65 6278 7934 CHEY CHOR KHOON Nanyang Technological University, Singapore Email: [email protected] Tel: +65 96371513 Abstract The increasing number of international students studying in advanced countries has focused attention on service quality in higher education. Service quality is a subjective matter and hence its measurement is usually made from the perspective of students. This study adopts the conceptual framework proposed by Min, Khoon and Tan (2012) in which motives of the study, expectation, perception and satisfaction are highlighted as being the key elements of service quality. This study attempts to investigate the role of demographic factors in the evaluation of service quality. The study used the data from a survey conducted in a private higher education institution in Singapore. The results revealed that, among the demographic variables, gender, nationality and the present level of study are influential in the evaluation of service quality, but the age factor does not make any significant difference in the key elements of the service quality evaluation. Nationality is found to be the most influential factor in the motivation and evaluation of service quality. A demographic, the present level of study can also cause different levels of motives of study, expectation of service quality and satisfaction. Gender impacts more on the level of satisfaction of the service than on service quality. Thus, educational marketers are well-advised to deliver educational services based on demographic segments, particularly nationality groups and levels of study. Key Words: Service Quality, Motives, Expectation, Perception, Satisfaction, Demographic Factor, Higher Education. Introduction Increasing globalization has significantly impacted on the nature and delivery of higher education. Nowadays, students the world over have opportunities to study abroad. Meanwhile, higher education institutions, both public and private, are expanding their market boundaries to cater to international students in addition to their traditional, local students. This trend reflects clearly the mobility of international students around the world and it is evident that many students enroll in other countries to attain higher education; in 2009, the number of tertiary students enrolled in institutions outside their countries of origin reached 3.7 million, of which 83% were studying in G20 countries (OECD, 2011). As the international students emerged as an important segment in the education market, especially of higher education, universities and colleges began to adopt the marketing concept and customer orientation in their efforts to recruit international students. To attract foreign students to a higher education institution, the quality of education services provided to the students can be considered as an appropriate measure. Education is by nature a service industry and I www.irmbrjournal.com December 2013 International Review of Management and Business Research Vol. 2 Issue.4 R M B R
Transcript of Demographic Factors in the Evaluation of Service Quality...

ISSN: 2306-9007 Min & Khoon (2013)
994
Demographic Factors in the Evaluation of Service Quality in
Higher Education: International Students’ Perspective
SEIN MIN Lecturer, MDIS Business School, Singapore
Email: [email protected]
Tel: +65 6278 7934
CHEY CHOR KHOON Nanyang Technological University, Singapore
Email: [email protected]
Tel: +65 96371513
Abstract
The increasing number of international students studying in advanced countries has focused attention on
service quality in higher education. Service quality is a subjective matter and hence its measurement is
usually made from the perspective of students. This study adopts the conceptual framework proposed by
Min, Khoon and Tan (2012) in which motives of the study, expectation, perception and satisfaction are
highlighted as being the key elements of service quality. This study attempts to investigate the role of
demographic factors in the evaluation of service quality. The study used the data from a survey conducted
in a private higher education institution in Singapore. The results revealed that, among the demographic
variables, gender, nationality and the present level of study are influential in the evaluation of service
quality, but the age factor does not make any significant difference in the key elements of the service quality
evaluation. Nationality is found to be the most influential factor in the motivation and evaluation of service
quality. A demographic, the present level of study can also cause different levels of motives of study,
expectation of service quality and satisfaction. Gender impacts more on the level of satisfaction of the
service than on service quality. Thus, educational marketers are well-advised to deliver educational
services based on demographic segments, particularly nationality groups and levels of study.
Key Words: Service Quality, Motives, Expectation, Perception, Satisfaction, Demographic Factor, Higher
Education.
Introduction
Increasing globalization has significantly impacted on the nature and delivery of higher education.
Nowadays, students the world over have opportunities to study abroad. Meanwhile, higher education
institutions, both public and private, are expanding their market boundaries to cater to international students
in addition to their traditional, local students. This trend reflects clearly the mobility of international
students around the world and it is evident that many students enroll in other countries to attain higher
education; in 2009, the number of tertiary students enrolled in institutions outside their countries of origin
reached 3.7 million, of which 83% were studying in G20 countries (OECD, 2011). As the international
students emerged as an important segment in the education market, especially of higher education,
universities and colleges began to adopt the marketing concept and customer orientation in their efforts to
recruit international students.
To attract foreign students to a higher education institution, the quality of education services provided to
the students can be considered as an appropriate measure. Education is by nature a service industry and
I
www.irmbrjournal.com December 2013
International Review of Management and Business Research Vol. 2 Issue.4
R M B R

ISSN: 2306-9007 Min & Khoon (2013)
995
service quality is the key to the satisfaction of students and consequently to the success of education
institutions. Due to the importance of service quality in the education industry, there were many studies
investigating the important attributes and dimensions of service quality. Scholars attempted to develop
models to measure and evaluate service quality, e.g. SERVQUAL and SERVPERF. A large number of
studies were undertaken in the field of service quality of higher education using SERVQUAL model
(Buttle, 1996).
Studies of service quality took place in many areas of services, including education services in which the
quality of educational services is perceived and evaluated by students. In most studies, demographic aspect
of service quality was considered and findings were drawn in relation to the demographic factors. In
general, students‟ demographic factors can moderate the levels of expectation and perception of service
quality. Different demographic groups of students such as age, gender and nationality can evaluate the
service quality of educational services in different ways.
The earlier studies of demographic factors in service quality were conducted in the context of general
students without paying particular attention towards international students. New research should direct
towards international students, as they are increasingly important for education institutions. International
students are from different countries and with diverse social, cultural, political and economic backgrounds.
The differences in these backgrounds can affect their evaluation of service quality. An understanding of
evaluation of service quality in the context of demographic factors can serve as a major input for policy
makers and marketing personnel. This study will investigate the crucial role of demographic variables on
service quality evaluation by international students pursuing higher education in Singapore.
Literature Review
Service Quality
In the business and marketing literature, much attention has been paid to services and services marketing.
Service is recognized as a form of product that consists of activities, benefits or satisfaction offered for sale
(Kotler & Armstrong, 2010). Service quality is essential to a service company as it can directly have impact
on customer satisfaction (Ibid, 2010; Parasuraman, Zeithaml & Berry, 1985; Buttle, 1995). However, the
distinct nature of service being different from goods makes it difficult to judge service quality. It is safe to
say that it is almost impossible for service quality to be measured objectively.
Notwithstanding the lack of absolute measurements of quality, in reality, service quality is still “measured”
in the eyes of customers. Perception is defined as „the process in which an individual selects, organizes, and
interprets stimuli into a meaningful and coherent picture of the world‟ (Schiffman & Kanuk, 2007, p. 148).
Customer satisfaction is a result of the perception on service quality; when the actual level of perceived
service quality is higher than the expected level, a customer is satisfied with the service received. „The most
widely accepted framework for researching service quality stems from the premise that a consumer‟s
evaluation of service quality is a function of the magnitude and direction of the gap between customer‟s
expectations of service and the customer‟s assessment (perception) of the service actually delivered‟
(Schiffman and Kanuk, p. 177).
Universities and colleges are educational service organisations that offer services to students; hence service
quality is a focus of today‟s competitive education market which comprises both public and private
education institutions. Since students are viewed as customers, education service quality should logically be
measured from the perspective of students. The importance of service quality for providers of higher
education was highlighted by Pesch, et al., (2007), and Tsinidou, Gerogiannis and Fitsilis (2010) who
asserted that “their long-term survival depends on how good their services are and quality sets one
university apart from the rest” (p. 227).
I
www.irmbrjournal.com December 2013
International Review of Management and Business Research Vol. 2 Issue.4
R M B R

ISSN: 2306-9007 Min & Khoon (2013)
996
Measurement of Service Quality
Service quality may be measured using multiple dimensions and attributes. Studies were conducted to
explore and identify major attributes which determine success in offering a service (Parasuraman, et al.,
1985). Parasuraman et al. (1988) identified five major dimensions: tangibility, reliability, responsiveness,
assurance and empathy.
These are the basic dimensions of the well-known SERVQUAL model used to measure service quality and
customer satisfaction. SERVQUAL measures service quality by comparing the expectation and perception
of service quality as measured in the service dimensions. Another approach in measuring quality is
SERVPERF which is an improvement over SERVQUAL; SERVPERF uses absolute measurement of
service quality, instead of measuring the quality based on the gap between expectation and perception in
the SERVQUAL model (Jusoh, Omain, Majid, Som & Shamsuddin, 2004).
There are many applications of SERVQUAL model in the context of education services, including higher
education (Adee, 1997; Ham & Hayduck, 2003; Arambewela & Hall, 2006; Barnes, 2007; Ilias, Harson,
Rahman & Yasoa, 2008; Tsinidou, Gerogiannis & Fitsilis, 2010; Yusof, Hassan, Rahman & Ghour, 2012;
Min, Khoon & Tan, 2012).
To apply the SERVQUAL model in higher education, the five basic dimensions of SERVQUAL were
measured with appropriate characteristics of the education services, for instance, university or higher
education institution. Examples of the application of SERVQUAL in education services are Arambewela
and Hall (2006), Barnes (2007), Michael and Pamela (2008), Atrek (2010), Yusof, et al. (2012) and Min, et
al. (2012).
The applications of SERVQUAL in the context of higher education were found in two types: the first one is
the use of the same five dimensions of service quality and the other one is to develop new attributes and
dimensions appropriate to the higher education services (Adee, 1997; Yusof, et al., 2012). Examples of
dimensions specific to higher education are class size, level and difficulty of subject, student workload and
so forth (Adee,1997) and knowledge / expertise, systems / secondary services, social responsibility, and
self-development (Yusof, et al. 2012).
Demographics Factor in the perception of service quality
There are a number of studies which investigate the impacts of socio-economic and demographic factors on
the perception of service quality in a variety of fields as shown in Tab. 1.
As summarized in the above Tab. 1, service quality is perceived differently by consumers according to their
demographic background, although there were also findings that did not confirm the crucial role of
demographic factors; for example, the studies by Schwantz (1996) and Ilias, Hasan, Rahman and Yasoa
(2008) in the higher education services did not find significant differences in the influence of some of the
demographic variables. Likewise, Ramez (2011) studying the service quality of Bahraini commercial banks
did not find any significant differences overall between the demographics variables in the perception of
service quality of the banks.
Palli and Mamilla (2012) studying a higher education institution found a mixed result; it indicated no
significant difference in the overall satisfaction of the respondents in terms of age, occupation of the parent
and total household income, but gender shows a significant difference in the students‟ opinion with regard
to the service quality of departments of the university whereby the female respondents were more satisfied
than the male respondents. Such a mixed result can be also seen in the transport/travel service section;
Genesan-Lim, Russell-Bennette and Dagger (2008) found that age was the significant factor in the
perception of service quality of passenger transport services, but that gender and income were not found to
be significant.
I
www.irmbrjournal.com December 2013
International Review of Management and Business Research Vol. 2 Issue.4
R M B R

ISSN: 2306-9007 Min & Khoon (2013)
997
Tab. 1: Summary of Research Findings of Demographics‟ Impact on Perception of Service Quality in
Selected Service Areas Service
Area Author(s) Major
Demographic
Variables
Service Quality
Model
Findings
1 Retailing Gagliano &
Hathcost
e (1994)
Race, Marital Status, Income
SERVQUAL Consumer demographic characteristics of race, marital status, and income provided significant differences between
expectations and perceptions for Reliability and Convenience.
2 Health care
Al-Khalil &
Mahmou
d (2012)
Gender, Education, Age,
Income
20-item multidimensi
onal scale
Female lower educated patient could hold less perceived service quality for the health care services than other categories of
patients do.
3 (Higher)
Education
Schwantz
(1996)
Traditional (age
24 and below)
and non-traditional (age
25 and above)
SERVQUAL There was no significant difference in expectations of service
quality between traditional and non-traditional undergraduate
students.
Jusoh, et al. (2004)
Seniority, Gender
SERPERF There are significant differences based on the students‟ perception of this faculty service quality by year of study and
race.
Ilias, et
al. (2008)
Gender, Race
and Semester of Study
SERVQUAL Demographic factors (gender, semester of studies, ethnicity) do
not have any significant difference with service quality.
Palli &
Mamilla (2012)
Gender, Age
group, Course of study, Marital
Status,
Academic Year, Occupation of
the parent,
Income of household
SERVQUAL
and Authors‟ own
conceptual
framework
The results indicated no significant difference in the overall
satisfaction of the respondents in terms of age, occupation of the parent and total household income. Significant difference in the
overall satisfaction of the respondents was found only in terms
of gender.
4 Banking Ramez
(2011)
Gender, Age,
Education,
Nationality, Occupation
SERVQUAL There are no significant differences in the perception of gender,
age, education level and nationality groups towards the overall
service quality and its five dimensions.
Gupta &
Bansal (2011)
Gender, Age,
Occupation, Education and
Income
22-items of
Internet banking
service
quality developed by
authors
Gender, age, occupation, education level, and income rated
differently the dimensions of service quality of banks.
5 Transport / Travel
services
(Ganesan-Lim, et
al. (2008)
Age, Gender and Income
Interaction quality,
outcome
quality and physical
environment
quality
(Brady &
Cronin,
2001)
Consumer age was found to affect service quality perception. However, no differences in the service quality perceptions on
the basis of quality, perceptions on the basis of gender or
income were found.
6 Telecommunicatio
n
Chih, et al. (n.d.)
Gender, Age, Education,
Occupation,
Disposable Income
Modified SERVQUAL
Significant differences exist in service quality perception across lifestyle and demographic variables.
Literatures on the relationships between demographics and service quality reveal a picture of diversity in
the results. It varies from non-relationship, partial relationship to complete relationships in all variables
under study. So, it is impossible to generalize the relationship between the demographic variables and
I
www.irmbrjournal.com December 2013
International Review of Management and Business Research Vol. 2 Issue.4
R M B R

ISSN: 2306-9007 Min & Khoon (2013)
998
perception/satisfaction of service quality across all service sectors. The nature of service sector, institution
(e.g. private or public), and research methodology (conceptual framework, dimensions, measurement scale,
data collection method, etc) can have impact on the results. In general, for higher education services, the
demographic characteristics such as age and gender are relevant in evaluating service quality.
The studies reviewed so far for the higher education services did not specifically investigate the
international students. Demographic characteristics pertaining to international students like nationality and
religion should also be considered in evaluating quality of education services.
Theoretical Framework
The research was carried out in the context of a private higher education school where international
students are present. The service quality of the education service provided by the selected private higher
education institution was measured using the conceptual framework developed and applied by Min, et al.
(2012) which is basically the SERVQUAL model, but it has added a new component, namely the motives
of study in the existing SERVQUAL framework. The service dimensions were adapted to the nature of
higher education institutions by developing appropriate sub-dimensions in the form of statements. In line
with the original model of service quality model by Parasuraman, et al. (1985), the level of service quality
is measured by the gap between the expectations and perceptions of service dimensions. In addition to the
basic SERVQUAL model, the model incorporates both students‟ motives of study and satisfaction on
service received. The basic features of the model are depicted in Fig. 1.
Fig. 1: Simplified model of service process in the higher education (Min, et al., 2012, p. 126)
Based on the literature on international students, Min, et al. (2012) identified three basic motives held by
international students: academic, career and experiential.
- Academic (seeking purely high quality, high standard education with recognition from
employers, quality teaching, hard-working in the study)
- Career (seeking opportunities to- get a job, now or later, attracted by job market conditions
in the host country, aiming to settle down in the host country, i.e. migration)
- Experiential (putting the value on the experience of staying abroad, particularly the host
country of study, looking for opportunities to actively participate in social and cultural events,
expecting to meet with people from different countries, learning the international culture and
host country‟s culture).
Min, et al. (2012) discovered from their empirical study an additional motive of students, namely „work‟.
- Work (aiming to earn money and / or to gain work experience during the stay of study)
I
www.irmbrjournal.com December 2013
International Review of Management and Business Research Vol. 2 Issue.4
R M B R

ISSN: 2306-9007 Min & Khoon (2013)
999
The measurement of expectations and perceptions (actual experience) applies the same sub-dimensions
(statements) to be rated by 5-point Likert scale. Similarly overall satisfaction is measured by a number of
statements to be rated also by 5-point Likert scale.
For this study, the conceptual framework by Min, et al. (2012) is expanded by adding the new dimension,
namely demographic variables of respondents, as they are important to understanding consumer‟s
behaviour and service marketing. The study is concerned with investigating the demographic factors‟
influence on the student‟s perception of service quality in private higher education. Thus, we have
incorporated the demographic variables in the basic conceptual framework of service process by Min, et al.
(2012) as in Fig. 2. The demographic variables selected in the study are age, gender, nationality, and
present level of study.
Fig. 2: Conceptual Framework of the Service Quality in Higher Education with Demographic Variables
Hypotheses
The research investigates the role of demographics variables, namely gender, age, nationality and present
level of study (diploma, bachelor degree and master degree), in the service quality process shown in Fig. 2
above. Specific hypotheses are formulated as follows:
I
www.irmbrjournal.com December 2013
International Review of Management and Business Research Vol. 2 Issue.4
R M B R
Demographic Variables Gender
Age
Nationality
Level of Study
Motives Academic &
Education
Work
Career &
Migration
Pleasure &
Experience
Expectations Responsiveness
Assurance
Tangibility
Empathy
Reliability
Perceptions Responsiveness
Assurance
Tangibility
Empathy
Reliability
Satisfaction
Service Gap

ISSN: 2306-9007 Min & Khoon (2013)
1000
H01: The ‘gender’ of an international student does not influence the evaluation of service quality.
H02: The ‘age’ of an international student does not influence the evaluation of service quality.
H03: The ‘nationality’ of an international student does not influence the evaluation of service quality.
H04: The ‘present level of study’ of an international student does not influence the evaluation of service
quality.
Analysis
To investigate international students‟ evaluation of service quality of higher education, the survey was
conducted in a private higher education institute in Singapore with a sample of 263 respondents. The
profile of respondents and the test of reliability and validity are shown in the appendices. The questionnaire
used the Likert 5-point scale to measure the motives and service quality dimensions.
The survey results show that the respondents hold the „academic & education‟ motive (3.92)1 higher than
the „career & migration‟ motive (3.80). It is found that gender does not show significant differences in the
overall level of motives. Among the various demographic groups, Indian nationality and master students
are the top groups in holding highest level of the motives of study.
In examining the components of the service quality evaluation (i.e. expectation, perception and gap), firstly,
expectation level shows overall 3.85, while the expectation of reliability of service is highest (3.99) and the
expectation of empathy in service is lowest (3.66). Among the demographic variables, the gender and age
do not show obvious differences in the level of expectation, but Indian nationality and master level students
express high levels of expectation (4.18 and 4.04 respectively).
In the perception (actual experience) of service quality, the overall score is just 3.27, much lower than the
expectation; consequently, it results in a negative service gap between the actual perception and
expectation. This result indicates also that the level of service quality is low from the students‟ perspective.
The reliability of service is perceived lowest among the elements or dimensions of service quality. As the
reliability of service is expected to be high, the service gap is widest in the „reliability‟ component (-0.867)
and narrowest in the tangibles (-0.31). In analysing the service gap by demographic factors, the highest
gaps exist in other nationalities group (-0.83), Indian nationality (-0.72) and master students (-0.68).
The survey results show the overall satisfaction level at the average score of 3.3. This means that the
respondents are slightly satisfied with the service provided. In terms of demographic groups, the least
satisfied groups are the age 30 years and above (2.30), other nationalities group (3.11), bachelor (3.14) and
female (3.20).
In relating the results of the service quality mentioned earlier and the satisfaction recently considered, it is
found that the service quality and satisfaction do not show a strong association based on the demographic
factors. For example, Indian students and master students who rated a lower service quality do not show a
clear indication of dissatisfaction with the service provided. Similarly, females are not having problems
with service quality, but they are low in the level of satisfaction. But, the other nationalities group
expressed both wide service gap (low service quality) and low satisfaction level.
In the following, the hypotheses are tested with One-Way ANOVA method whereby the homogeneity of
groups is tested with Levene‟s statistics available in the SPSS package. Firstly, the influence of gender is
examined in the following table.
Tab. 1: Means and One Way ANOVA Results for Gender Groups
No. Variables Mean Significance Level
Male Female ANOVA Homogeneity
of Variance
1 Motives 3.91 3.95 .924 .069*
(a) Academic &Education 3.97 3.90 .422 .419
(b) Career & Migration 3.82 3,83 .858 .124
1 Since the Likert scale is applied, the score ranges from 1 to 5.
I
www.irmbrjournal.com December 2013
International Review of Management and Business Research Vol. 2 Issue.4
R M B R

ISSN: 2306-9007 Min & Khoon (2013)
1001
2 Expectation 3.85 3.86 .903 .529
(a) Responsiveness 3.82 3.73 .402 .316
(b) Assurance 3.89 3.88 .957 .498
(c) Tangibles 3.61 3.74 .569 .454
(d) Empathy 3.77 3.71 .204 .066
(e) Reliability 3.96 4.00 .776 .201
3 Perception 3.30 3.20 .582 .035**
(a) Responsiveness 3.30 3.20 .290 .196
(b) Assurance 3.34 3.31 .695 .335
(c) Tangibles 3.29 3.23 .093* .135
(d) Empathy 3.52 3.36 .552 .002***
(e) Reliability 3.22 3.05 .215 .260
4 Service Quality Gap -0.55 -0.58 .793 .402
5 Satisfaction 3.46 3.20 .013** .746
***Significant at 99% Confidence Level
**Significant at 95% Confidence Level
*Significant at 90% Confidence Level
In the motives and service quality components, we cannot find significant difference between males and
females. However, gender plays an important role in the satisfaction level, as the ANOVA test shows
significance at 95% confidence level. Therefore, the null hypothesis that gender does not influence in the
framework service quality evaluation cannot be rejected in all elements except satisfaction.
Secondly, the role of age in the service quality evaluation is tested with Pearson correlation method and the
test results are shown in Tab. 2 below.
Tab. 2: Correlations with age
N0. Variables Pearson
Correlation
Coefficient
Significance Level
1 Motives .051 .430
(a) Academic &Education .007 .916
(b) Career & Migration .101 .112
2 Expectation -.035 .672
(a) Responsiveness .098 .125
(b) Assurance .092 .155
(c) Tangibles .092 .150
(d) Empathy -.009 .886
(e) Reliability -.079 .336
3 Perception .027 .758
(a) Responsiveness .079 .228
(b) Assurance -.031 .642
(c) Tangibles .056 .393
(d) Empathy -.009 .895
(e) Reliability -.004 .961
4 Service Quality Gap .036 .694
5 Satisfaction -.124 .0528*
*Significant at 90% Confidence Level
The relationships between the service quality variables and age are measured with correlation method and
the results are shown in Tab. 8. No strong and significant relationships are found there and hence it is
reasonable to conclude that age does not affect the motivation and evaluation of service quality at all.
I
www.irmbrjournal.com December 2013
International Review of Management and Business Research Vol. 2 Issue.4
R M B R

ISSN: 2306-9007 Min & Khoon (2013)
1002
However, a negative weak correlation (-.124) between age and satisfaction is found at 90% confidence
level. Therefore, the null hypothesis that the gender does not influence the service quality evaluations
cannot be rejected at 95% confidence level.
The third hypothesis, the role of nationality is tested with One-Way ANOVA method and the results are
shown in Tab. 3 below.
Tab. 3: Means and One Way ANOVA Results for Nationality Groups
No. Variables Mean Significance Level
Ch
ines
e
Ind
ian
Ind
on
esi
an
Vie
tna
mes
e
Ma
lay
sia
n
Oth
ers
ANOV
A
Homogeneity
of Variance
1 Motives 3.84 4.16 4.01 3.86 3.93 3.62 .001*** .100
(a) Academic
&Education
3.80 4.14 4.03 3.81 3.95 3.65 .004*** .377
(b) Career & Migration 3.79 4.06 3.85 3.68 3.83 3.53 .087* .212
2 Expectation 3.67 4.18 3.96 3.68 3.41 3.95 .002*** .025**
(a) Responsiveness 3.56 3.97 4.01 3.51 3.47 3.96 .004*** .644
(b) Assurance 3.75 4.05 4.13 3.73 3.46 3.91 .014** .782
(c) Tangibles 3.72 3.75 3.70 3.50 3.43 3.78 .022**. .000***
(d) Empathy 3.79 4.07 3.59 3.59 3.49 3.56 .628 .515
(e) Reliability 3.71 4.43 4.06 3.95 3.49 4.11 .003*** .013**
3 Perception 3.28 3.59 3.12 3.06 3.02 2.88 .538 .729
(a) Responsiveness 3.28 3.59 3.12 3.06 3.02 2.88 .001*** .507
(b) Assurance 3.50 3.38 3.39 3.14 3.05 3.11 .137 .215
(c) Tangibles 3.33 3.39 3.09 3.19 3.10 3.23 .001*** .693
(d) Empathy 3.41 3.78 3.34 3.21 3.29 3.13 .483 .357
(e) Reliability 3.11 3.32 3.15 3.07 3.20 2.74 .296 .683
4 Service Quality Gap -0.35 -
0.72
-
0.65
-
0.60
-0.18 -
0.83
.075* .074*
5 Satisfaction 3.34 3.56 3.28 3.09 3.25 3.11 .115 .233
***Significant at 99% Confidence Level
**Significant at 95% Confidence Level
*Significant at 90% Confidence Level
The results show that significant differences exist in the motives and expectation at the aggregate level.
However, the homogeneity test of expectation shows the differences in variances among nationality groups,
thus causing inappropriateness of ANOVA. However, the significant and valid results are seen in
„academic & education‟ motive, expectation in responsiveness and assurance, perception in responsiveness
and tangibles.
However, there are no significant differences in the service quality gap and satisfaction at the 95%
confidence level. A crucial finding here is that nationality groups are significantly different in the
dimension of responsiveness in the service quality in terms of both expectation and perception. Overall, the
null hypothesis that nationality does not influence on the service quality evaluation can be rejected for
some elements at 95% confidence level.
Lastly, the hypothesis with regard to the present level of study is tested with One-Way ANOVA method
and the results are shown in Tab. 4.
I
www.irmbrjournal.com December 2013
International Review of Management and Business Research Vol. 2 Issue.4
R M B R

ISSN: 2306-9007 Min & Khoon (2013)
1003
Tab. 4: Means and ANOVA Results for Groups of Present Level of Study
No. Variables Mean Significance Level
Diploma Bachelor Master ANOVA Homogeneity
of Variance
1 Motives 3.93 3.81 4.03 .047** .416
(a) Academic &Education 3.97 3.79 4.01 .063* .310
(b) Career & Migration 3.77 3.73 3.94 .160 .552
2 Expectation 3.85 3.72 4.04 .017** .763
(a) Responsiveness 3.69 3.68 3.94 .058* .674
(b) Assurance 3.87 3.80 3.97 .313 .996
(c) Tangibles 3.70 3.56 3.77 .314 .108
(d) Empathy 3.74 3.64 3.84 .234 .187
(e) Reliability 3.91 3.85 4.19 .055* .520
3 Perception 3.18 3.18 3.35 .257 .102
(a) Responsiveness 3.18 3.18 3.35 .232 .495
(b) Assurance 3.37 3.29 3.33 .841 .040**
(c) Tangibles 3.24 3.20 3.35 .353 .436
(d) Empathy 3.41 3.36 3.52 .443 .268
(e) Reliability 3.11 3.05 3.23 .554 .135
4 Service Quality Gap -0.50 -0.52 -0.68 .412 .010**
5 Satisfaction 3.39 3.14 3.43 .059* .664
**Significant at 95% Confidence Level
*Significant at 90% Confidence Level
The test results show that the present level of study is a good differentiator in the motives of study and
overall expectation. Significant differences are found in the „academic & education‟ motive. The
differences in expectations of responsiveness and reliability, and satisfaction level are found significant
only at 90% confidence level. Therefore, the null hypothesis that the present level of study does not
influence service quality evaluation can be rejected in a few elements.
Discussion
From the descriptive analysis and hypothesis testing, we have found in general that there are influences of
demographic variables in the evaluation of service quality. In the descriptive analysis, the variations were
found mainly in the nationality and the present level of study, while the other variables (gender and age)
showed slight and insignificant variations. Although gender did not influence much on the components of
motives, expectation and perception, it has a strong influence in rating the satisfaction level. Survey results
show that female international students are less satisfied with the education services they received than
their male counterparts.
In the hypothesis tests, three hypotheses were generally rejected and hence the significant differences in the
groups of gender, nationality and the present level of study are confirmed. The age factor was insignificant
in all the measurements. The gender groups have significant differences in the satisfaction of the service.
Nationality groups differ in motives as well as the elements of the service quality evaluation. The present
level of study has also influences on motivation in the study, expectation of service quality and, to some
extent, satisfaction level of the service provided.
From the above findings, two demographic factors, namely nationality and present level of study can be
considered as the key factors for the evaluation of service quality and satisfaction. The fact that nationality
has a considerable impact on the service quality evaluation reflects the diversity of international students in
I
www.irmbrjournal.com December 2013
International Review of Management and Business Research Vol. 2 Issue.4
R M B R

ISSN: 2306-9007 Min & Khoon (2013)
1004
responding to the services offered to them. The education institutions should not assume that international
students studying in a host country share uniform views and value systems. Some countries may have more
emphasis, for example, on the reliability of services than the others, while the other countries have higher
expectations and appreciation of tangibles (like facilities, physical characteristics). In this study, the
empirical results have shown that the responsiveness is significantly different among the nationality groups.
Thus, some international students are more concerned with promptness of service and providing help to
them than the others. Improvements in services in terms of speed, personalization and helpfulness are
essential in the service programmes for international students. Nationality and cultural background can help
also the service programme to provide better quality education services.
The fact that levels of satisfaction differ between gender groups and, to some extent, among the present
levels of study calls for attention towards the other factors apart from service quality that determine the
satisfaction with educational services. Thus, the other factors such as environment of study and marketing
mix variables (curriculum, course fees, recruitment procedure and communication/promotion) should also
be investigated.
The findings from this research are relevant to the marketing efforts of education providers to draw
appropriate implications. The presence of the moderating role of nationality factor in the process of service
quality evaluation reminds us to be sensitive to the cultural differences among international students.
Despite the fact that globalization is taking place and the education industry is expanding across borders,
international students cannot be considered as a homogeneous group and handled in a uniform way.
National characteristics and behavioural patterns of each nationality are to be specifically taken into
account. The higher education institutions which are recruiting and offering courses to international
students should review their education programmes and services in the light of the nationality factor. The
services provided to them may be adjusted and redesigned in such a way that services offered to them are
matching with their motives and expectations. The service design and delivery to international students
should be made with reference to these service dimensions for international students. For example, a
nationality group may expect services to be offered promptly and personally rather than through the
impersonal service channel. In a nutshell, services should be in line with the national characteristics and
styles. To accomplish this, the service should be offered on the nationality basis; for example, the student
services may be organised into nationality units and service personnel.
Likewise, education services should focus on individual levels of study, instead of being provided across
the board. Students pursuing higher level of study like master‟s level are usually more ambitious, serious
and motivated. Thus, they should be handled separately and with special attention. For instance, the library
and classroom facilities should be provided differently to them.
Since gender has been shown to be a significant factor of overall satisfaction, some gender related issues
and problems are required to be identified and handled. The study has indicated that females are less
satisfied despite of there being no significant differences in service quality evaluation. In order to increase
the level of satisfaction by female international students, the education services should consider gender
specific issues in creating customer satisfaction. For example, the female students must be given equal
opportunities to study courses and to get access to facilities like sports.
Conclusion
Services delivered to customers and clients are necessary to be evaluated from their perspectives, rather
than firm‟s own perspective. Service quality is an important element in every service marketing
programme. Particularly, education services are required to evaluate their educational services‟ quality
from the students‟ perspective. This study has investigated the service quality of a private higher education
institution evaluated by international students. The findings show that the demographic factor is generally
important in the evaluation of service quality. Nationality and present level of study are influential factors
I
www.irmbrjournal.com December 2013
International Review of Management and Business Research Vol. 2 Issue.4
R M B R

ISSN: 2306-9007 Min & Khoon (2013)
1005
in the evaluation of service quality per se, while gender has more impact on the level of satisfaction of the
overall service. The understanding of the role of demographic variables can guide marketers of higher
education to consider more demographic-based segmentation approach and differentiating the services in
line with the nature of individual demographic groups. From the standpoint of international students, higher
education institutions which cater education programmes and service should design and deliver their
services in accordance with the nationality background. Through this arrangement, private higher education
institutions may be able improve their service quality and attract more international students.
References
Adee, A. (1997). Linking student satisfaction and service quality perceptions: the case of university
education, European Journal of Marketing, 37(7), 528–535. Retrieved from
http://web.uct.ac.za/staff/jbeneke/justin/p528.pdf.
Al-Khali, A. and Mahmoud, A. B. (2012). The Role of Demographics in Patients‟ Perceptions towards the
Quality of Health Care Services Provided at Public Hospitals in Damascus. European Journal of
Economics, Finance and Administrative Services, 48, 113-121. Retrieved from
http://www.google.com.sg/url?sa=t&rct=j&q=&esrc=s&frm=1&source=web&cd=6&ved=0CFkQFj
AF&url=http%3A%2F%2Fwww.researchgate.net%2Fpublication%2F226123628_The_Role_of_De
mographics_in_Patients'_Perceptions_towards_the_Quality_of_Health_Care_Services_Provided_at_
Public_Hospitals_in_Damascus%2Ffile%2F9fcfd4fddf16f01a57.pdf&ei=oNHHUZyNI9GxrAfW5IH
ICA&usg=AFQjCNFFSus33juEeyr2J-3cefb3-Lz60Q&sig2=yyN2margAwH8U9luvICwdw.
Arambewela, R., & Hall, J. (2006). A Comparative Analysis of International Education Satisfaction using
SERVQUAL. Journal of Services Research, 6, Special Issue (July), 142-163. Retrieved from
http://dro.deakin.edu.au/eserv/DU:30003511/arambewela-comparativeanalysisof-2006.pdf.
Barnes, B. R. (2007). Analyzing Service Quality: The Case of Post-graduate Chinese Students. Total
Quality Management, 18(3), 313-331. DOI: http://dx.doi.org/10.1080%2F14783360601152558.
Brady, M.K. & Cronin, J.J. Jr. (2001). Some new thoughts on conceptualizing perceived service quality: A
hierarchical approach, Journal of Marketing, 65 (3), 34-49. Retrieved from
http://www.iei.liu.se/program/ekprog/civilek_internt/ar_3/722g60/gruppernas_artiklar_och_presentati
oner/1.149935/Artikeltillseminarie2gruppB2.pdf.
Buttle, F. (1996). SERVQUAL: review, critique, research agenda. European Journal of Marketing, 30 (1),
pp. 8-32. Retrieved from http://dx.doi.org/10.1108/03090569610105762.
Chih, W-H., Tang, T-W. & Chen, I-J. (n.d.). The Service Quality Perceptual Analysis of Mobile Phone
Uses in Mainland China. Retrieved from
http://www1.rdoffice.ndhu.edu.tw/exchange/abroad/abroad93/TZW-paper.pdf
Ganesan-Lim, C. Russell-Bennett, R. & Dagger, T. (2008). The impact of service contact type and
demographic characteristics on service quality perceptions. Journal of Services Marketing, 22 (7),
550 – 561. Retrieved from http://eprints.qut.edu.au/15274/1/15274.pdf.
Gupta, K. K. & Bansal, J. (2011). Effect of Demographic Variables on Customer Perceived Internet
Banking Service Quality. Paradigm, XV(1&2), 83-92.
Handbook of Biological Statistics. (2013). Retrieved October 10, 2013 from
http://udel.edu/~mcdonald/stathomog.html).
I
www.irmbrjournal.com December 2013
International Review of Management and Business Research Vol. 2 Issue.4
R M B R

ISSN: 2306-9007 Min & Khoon (2013)
1006
Ham, L. & Hayduk, S. (2003). Gaining competitive advantages in higher education: analyzing the gap
between expectations and perceptions of service quality. International Journal of Value-Based
Management, 16 (3), 223-242.
Ilias, A. Hasan, H. F. A. Rahman, R. A. & Yasoa, M. R. b. (2008). Student Satisfaction and Service Quality
- Any Differences in Demographic Factors? International Business Research, 1(4), 131-143.
Retrieved from http://ccsenet.org/journal/index.php/ibr/article/view/819/809.
Joseph, M. & Joseph, B. (1998). Identifying needs of potential students in tertiary education for strategy
development. Quality Assurance in Education, 6(2), 90-96.
Jusoh, A., Omain, S., Majid, N. A., Som, H. M. & Shamsuddin, A. S. (2004). Service Quality in Higher
Education: Management Students’ Perspective, Research Management Centre, University of
Technology, Malaysia.
Kotler, P. & Armstrong, G. (2010). Principles of Marketing. 13th
ed. (Global Edition). Pearson Prentice
Hall. ISBN-13:978-0-13-700669-4.
Michael, S., & Pamela, R. (2008). Using SERVQUAL to Measure the Quality of the Classroom
Experience. Decision Sciences Journal of Innovative Education, 6(1), 115-133. Retrieved from
http://werken.ubiobio.cl/html/documentos/articulos_bibliografia_calidad_educacion_superior/calidad
_servicio_educacion_superior/csedsup_17.pdf.
Min, S., Khoon, C. C. & Tan, B. L. (2012). Motives, Expectations, Perceptions and Satisfaction of
International Students pursuing Higher Education in Singapore. International Journal of Marketing
Studies, 4(6), 122-138. Retrieved from
http://www.ccsenet.org/journal/index.php/ijms/article/view/19515/14276.
OECD (2011). Education at Glance 2011: OECD Indicators. Retrieved from
http://www.oecd.org/education/skills-beyond-school/48631079.pdf.
Palli, J. G. & Mamilla, R. (2012). Students‟ Opinions of Service Quality in the Field of Higher Education.
Creative Education, 3(4), 430-438. Retrieved from
http://www.google.com.sg/url?sa=t&rct=j&q=&esrc=s&frm=1&source=web&cd=1&ved=0CCkQFj
AA&url=http%3A%2F%2Fwww.scirp.org%2Fjournal%2FPaperDownload.aspx%3FpaperID%3D21
627&ei=0enHUfSEAoHJrQf0xYDYBA&usg=AFQjCNH150VmW030TUHACx4siwTP8Ts5PQ&si
g2=jsq5iv_lE2Ww5F4PCAz_ng.
Parasuraman, A., Zeithaml, V. A., & Berry, L. L. (1985). A Conceptual Model of Service Quality and its
Implications for future research. Journal of Marketing, 49, 41-50. DOI:
http://dx.doi.org/10.2307%2F1251430.
Parasuraman, A. Zeithaml, V. A. & Berry, L. L. (1988). SERVQUAL: A Multiple Item Scale for
measuring Service Quality. Journal of Retailing, 64(1), 12-40. Retrieved from
http://areas.kenanflagler.unc.edu/Marketing/FacultyStaff/zeithaml/Selected%20Publications/SERVQ
UAL%20A%20MultipleItem%20Scale%20for%20Measuring%20Consumer%20Perceptions%20of%
20Service%20Quality.pdf.
Parasuraman, A., Berry, L. L. & Zeithaml, V. (1991). Understanding of Customer Expectations of Service.
Sloan Management Review, 39-48.
I
www.irmbrjournal.com December 2013
International Review of Management and Business Research Vol. 2 Issue.4
R M B R
ISSN: 2306-9007 Min & Khoon (2013)
1007
Pesch, M., Calhooun, R., Schneider, K. & Bristow, D. (2007). The Student Orientation of a College of
Business: An Empirical Look from the Student‟s Perspective, Marketing Management Journal,
Spring, 100-108.
Ramez, W. S. (2011). Customers‟ Socio-economic Characteristics and The Perception of Service Quality of
Bahrain‟s Commercial Banks. International Journal of Business and Management, 6(8), 113-126.
Schiffman, L. G. & Kanauk, L. L. (2007). Consumer Behavior. 9th
Ed. Prentice-Hall: NJ.
Schwantz, G. D. (1996). Service Quality in Higher Education Expectations and Perceptions of Traditional
and Non-traditional Students. Ph. D. Dissertation, Texas Technical University. Retrieved from
https://repositories.tdl.org/ttu-ir/bitstream/handle/2346/12914/31295010497773.pdf?sequence=1.
Soutar, G. & McNeil, M. (1996). Measuring service quality in a tertiary institution. Journal of Educational
Administration, 34(1), 72-82.
Tsinidou, M., Gerogiannis, V. & Fitsilis, P. (2010). Evaluation of the factors that determine quality in
higher education: An empirical study. Quality Assurance in Education, 18 (1), 227-244.
Yusof, A R. M., Hassan, Z., Rahman, S. A., & Ghour, A. M. (2012). Educational Service Quality at Public
Education Institutions: A Proposed Framework and Importance of the Sub-dimensions. International
Journal of Economics, Business and Management Studies, 1(2),. 36-49.
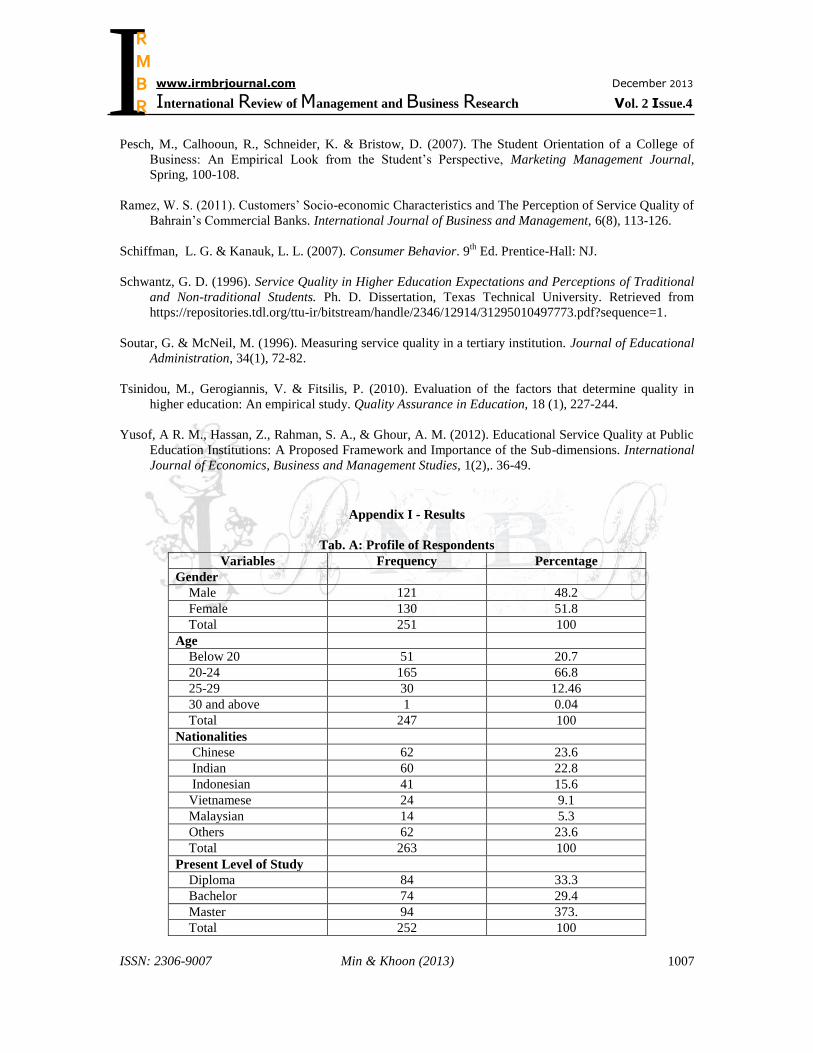
Appendix I - Results
Tab. A: Profile of Respondents
Variables Frequency Percentage
Gender
Male 121 48.2
Female 130 51.8
Total 251 100
Age
Below 20 51 20.7
20-24 165 66.8
25-29 30 12.46
30 and above 1 0.04
Total 247 100
Nationalities
Chinese 62 23.6
Indian 60 22.8
Indonesian 41 15.6
Vietnamese 24 9.1
Malaysian 14 5.3
Others 62 23.6
Total 263 100
Present Level of Study
Diploma 84 33.3
Bachelor 74 29.4
Master 94 373.
Total 252 100
I
www.irmbrjournal.com December 2013
International Review of Management and Business Research Vol. 2 Issue.4
R M B R

ISSN: 2306-9007 Min & Khoon (2013)
1008
Tab. B: Reliability and Validity of Measurement Scale (Motives)
No. Motive / Statements Cronbach’s
Alpha
Factor Loading
Overall 0.7133 (KMO Value =
0.745)
1 Academic & Education Quality 0.7422
a. I decided to come to Singapore to obtain a good education. .816
b. I chose to come to Singapore because it is well-known for
its education quality.
.814
c. I came to Singapore to study so that I may go as far as I
can in my educational career.
.680
2 Work 0.6209*
a. Before I came to Singapore, I heard that Singapore was a
land of opportunity for students like me to work while
studying.
0.454
b. During my study here, I have already tried to find a job. 0.775
c. I need usually to get a job to help finance my study in
Singapore.
0.735
d. I wanted a course of study that allows me to gain work
experience while studying.
0.543
3 Career & Migration 0.7100
a. Before I came to Singapore, I believed that it would be
possible for me to work in Singapore after graduation.
0.837
b. I intend to find a job in Singapore after the graduation. 0.680
4 Pleasure & Experience 0.4560*
a. I chose Singapore as the country of my study abroad,
because it is a fun place.
0.432
b. I came to Singapore because I believed that it is possible
to meet people from all over the world.
.0.461
c. I have visited many places in Singapore while here. 0.749
d. I have travelled to other countries as a Singapore
international student pass holder.
0.610
*below 0.7, thus dropped in the analysis)
Tab. C Reliability Test (Cronbach’s Alpha) of Measurement Scale (Expectations & Actual
Experience)
No. Dimensions Expectations Actual Experience
1 Responsiveness 0.8618 0.8324
2 Assurance 0.8129 0.8162
3 Empathy 0.7951 0.7405
4 Tangibles 0.8300 0.779
5 Reliability 0.9092 0.8894
Overall 0.9243 0.9243
(Note: The statements measuring each dimension are listed in the Appendix. II.)
Tab.D: Validity Test (Kaiser-Maier-Olkin – KMO Value) of Measurement Scale (Expectations &
Actual Experience)
No. Measurement KMO Value
1 Expectations 0.897
2 Actual Experience (Perception) 0.905
I
www.irmbrjournal.com December 2013
International Review of Management and Business Research Vol. 2 Issue.4
R M B R
ISSN: 2306-9007 Min & Khoon (2013)
1009
Tab.E: Reliability and Validity Test of Measurement Scale (Satisfaction)
No. Test Value
1 Reliability (Cronbach‟s Alpha) 0.8649
2 Validity (KMO) 0.771
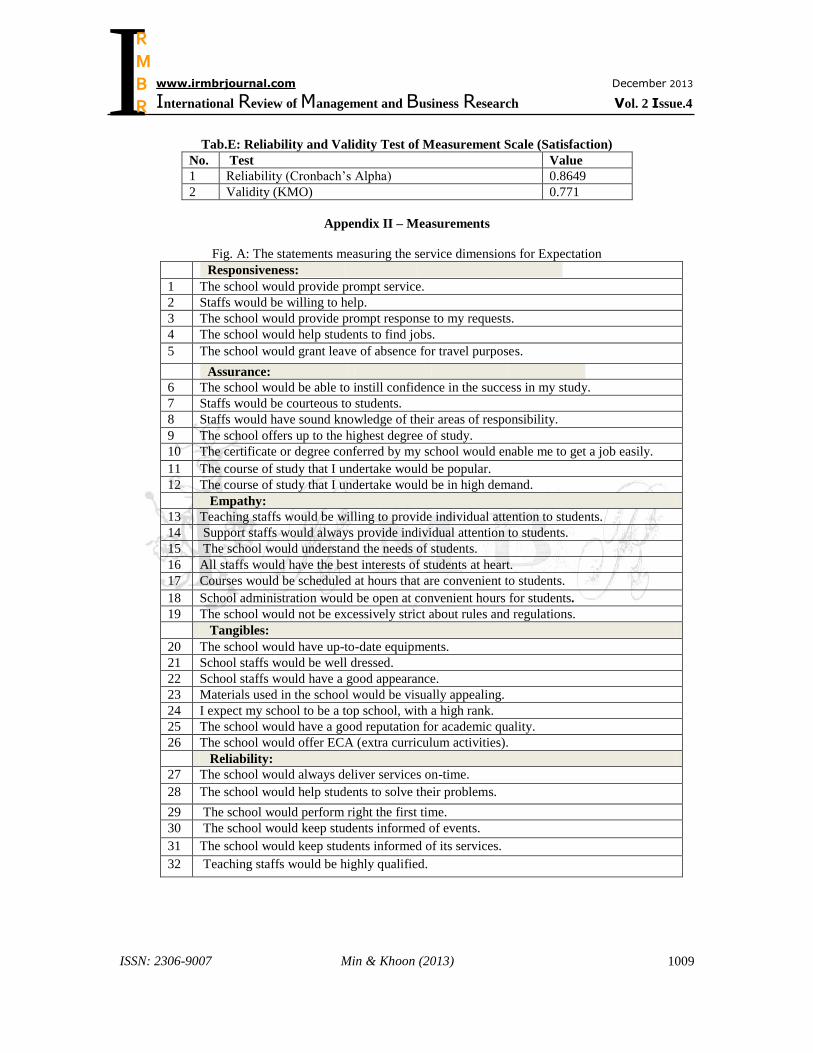
Appendix II – Measurements
Fig. A: The statements measuring the service dimensions for Expectation
Responsiveness:
1 The school would provide prompt service.
2 Staffs would be willing to help.
3 The school would provide prompt response to my requests.
4 The school would help students to find jobs.
5 The school would grant leave of absence for travel purposes.
Assurance:
6 The school would be able to instill confidence in the success in my study.
7 Staffs would be courteous to students.
8 Staffs would have sound knowledge of their areas of responsibility.
9 The school offers up to the highest degree of study.
10 The certificate or degree conferred by my school would enable me to get a job easily.
11 The course of study that I undertake would be popular.
12 The course of study that I undertake would be in high demand.
Empathy:
13 Teaching staffs would be willing to provide individual attention to students.
14 Support staffs would always provide individual attention to students.
15 The school would understand the needs of students.
16 All staffs would have the best interests of students at heart.
17 Courses would be scheduled at hours that are convenient to students.
18 School administration would be open at convenient hours for students.
19 The school would not be excessively strict about rules and regulations.
Tangibles:
20 The school would have up-to-date equipments.
21 School staffs would be well dressed.
22 School staffs would have a good appearance.
23 Materials used in the school would be visually appealing.
24 I expect my school to be a top school, with a high rank.
25 The school would have a good reputation for academic quality.
26 The school would offer ECA (extra curriculum activities).
Reliability:
27 The school would always deliver services on-time.
28 The school would help students to solve their problems.
29 The school would perform right the first time.
30 The school would keep students informed of events.
31 The school would keep students informed of its services.
32 Teaching staffs would be highly qualified.
I
www.irmbrjournal.com December 2013
International Review of Management and Business Research Vol. 2 Issue.4
R M B R

ISSN: 2306-9007 Min & Khoon (2013)
1010
Fig. B: The statements measuring the service dimensions for Actual Experience (Perception)
Responsiveness:
1 The school provided prompt service.
2 Staffs were willing to help.
3 The school provided prompt response to my requests.
4 The school helped students to find jobs.
5 The school allowed students to take leave of absence for travel purposes.
Assurance:
6 The school was able to instill confidence in the success in my study.
7 Staffs were courteous to students.
8 Staffs had sound knowledge of their areas of responsibility.
9 The school offered up to the highest degree of study.
10 The certificate or degree conferred by my school enabled me to get a job easily.
11 The course of study that I undertook was popular.
12 The course of study that I undertook was in high demand.
Empathy:
13 Teaching staffs were willing to provide individual attention to students.
14 Support staffs always provided individual attention to students.
15 The school understood the needs of students.
16 All staffs had the best interests of students at heart.
17 Courses were scheduled at hours that were convenient to students.
18 School administration was open at convenient hours for students.
19 The school was excessively strict about rules and regulations.
Tangibles:
20 The school had up-to-date equipments.
21 School staffs were well dressed.
22 School staffs had a good appearance.
23 Materials used in the school were visually appealing.
24 I found my school to be a top school, with a high rank.
25 The school had a good reputation for academic quality.
26 The school offered ECA (extra curriculum activities).
Reliability:
27 The school always delivered services on-time.
28 The school helped students to solve their problems.
29 The school always performed right the first time.
30 The school kept students informed of events.
31 The school kept students informed of its services.
32 Teaching staffs were highly qualified.
I
www.irmbrjournal.com December 2013
International Review of Management and Business Research Vol. 2 Issue.4
R M B R