
Demographic change and women’s labor force participation ... · PDF fileFertility and...
30
Fertility and women’s labor force participation in a low-income rural economy Mattias Lundberg, 1 Nistha Sinha, Joanne Kannan Yoong 2 First draft: 03/25/09 This Draft: 02/25/10 DRAFT ONLY DO NOT CITE Abstract This study examines changes in fertility and childbearing on the labor force participation of women in rural Bangladesh. Since fertility is endogenous to other decisions taken by the family, we separately identify the impact of changes in fertility on changes in work by taking advantage of a family-planning program selectively introduced in the district of Matlab. The family-planning program did have a significant impact on certain aspects of fertility; but contrary to much previous research, fertility has little or no impact on female labor force participation. 1 Corresponding author: [email protected] 2 World Bank, World Bank, and Rand, respectively. We gratefully acknowledge the financial support of the Hewlett Foundation, and the comments of David Canning, David Lam, Michael Lipton, members of the PopPov Research Network and participants at the Fourth Annual Research Conference on Population, Reproductive Health Conference in Cape Town.
Transcript of Demographic change and women’s labor force participation ... · PDF fileFertility and...
Fertility and women’s labor force participation
in a low-income rural economy
Mattias Lundberg,1 Nistha Sinha, Joanne Kannan Yoong
2
First draft: 03/25/09
This Draft: 02/25/10
DRAFT ONLY DO NOT CITE
Abstract
This study examines changes in fertility and childbearing on the labor force
participation of women in rural Bangladesh. Since fertility is endogenous to other
decisions taken by the family, we separately identify the impact of changes in fertility on
changes in work by taking advantage of a family-planning program selectively
introduced in the district of Matlab. The family-planning program did have a significant
impact on certain aspects of fertility; but contrary to much previous research, fertility has
little or no impact on female labor force participation.
1 Corresponding author: [email protected]
2 World Bank, World Bank, and Rand, respectively. We gratefully acknowledge the
financial support of the Hewlett Foundation, and the comments of David Canning, David
Lam, Michael Lipton, members of the PopPov Research Network and participants at the
Fourth Annual Research Conference on Population, Reproductive Health Conference in
Cape Town.
1
1. Introduction
This study examines changes in fertility and childbearing practices on the labor
force participation of women in rural Bangladesh. Since fertility is not exogenous to
other decisions taken by the family, we separately identify the impact of changes in
fertility on changes in work by taking advantage of a family-planning program selectively
introduced in the district of Matlab, Bangladesh that resulted in significant declines in
fertility, relative to the control areas. Our results show that, contrary to much previous
research, the number of children is only weakly associated with female labor force
participation. On the other hand, fertility may be correlated with the sector in which a
woman participates in the labor market.
2. Background
Birth rates are falling in many countries: families are smaller and dependency
ratios are lower than among previous generations. The World Development Report for
2007 argues that with the right combination of policies, these countries can reap a
―demographic dividend,‖ in which the generation of young people in whom families have
invested greater resources, and who are well-educated and healthy, provide the engine for
faster growth.1 Bloom and Canning (2005) argue that smaller families with fewer
dependents lead to greater savings and investment and faster, more widely shared growth.
As reproductive technology and better health care become more widespread, both
mortality and fertility fall, and the share of working-age population rises, relative to the
number of children. More children require more resources to care for them and a greater
share of mothers‘ time, leading to slower economic growth. Economies with fewer
children have more resources – both human and physical – for allocation to alternative
activities. Conversely, economies with higher dependency ratios consume relatively
more and save relatively less, thus lowering growth. Feyrer (2005) finds that changes in
1 It has been argued that a significant portion of the growth of the East Asian
tigers was due to the region‘s demographic transition and the large pool of well-trained
and healthy young people that came of age during the 1980s. But the demographic
dividend is not automatic: many countries in Latin America experienced the same
transition to lower fertility and lower dependency ratios, but were unable to achieve the
same rapid growth (World Bank 2006).
2
the age composition of the workforce are significantly correlated with changes in
aggregate productivity.
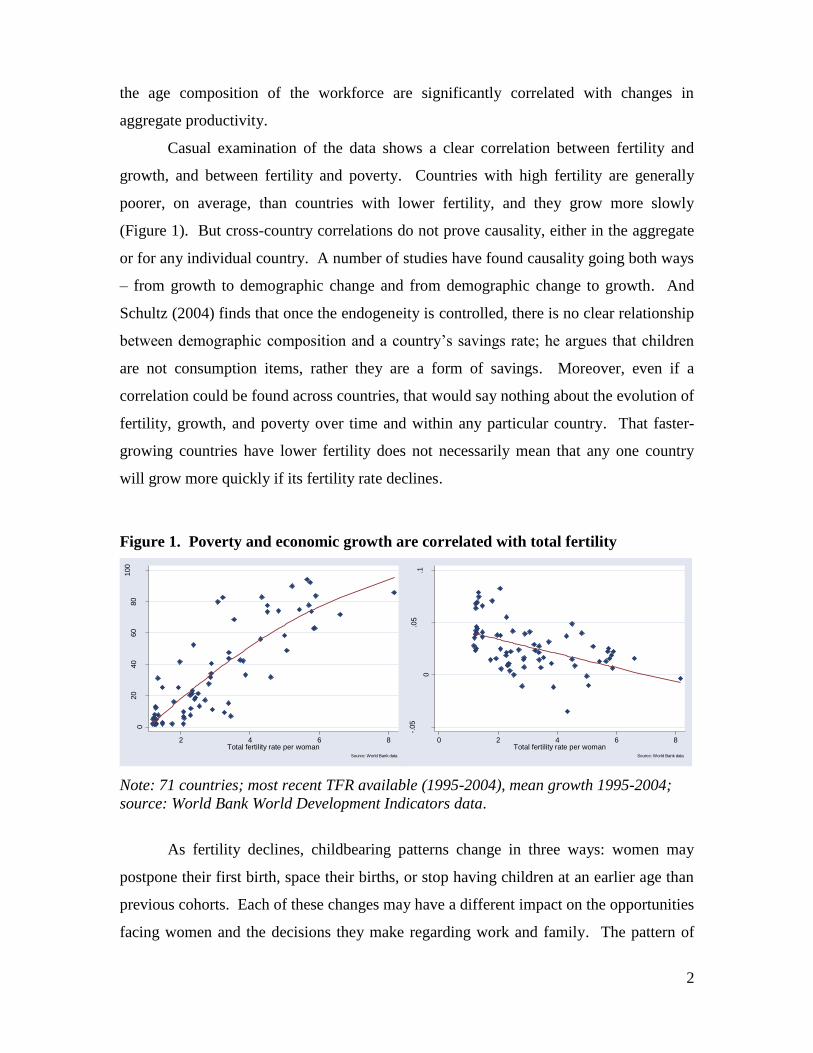
Casual examination of the data shows a clear correlation between fertility and
growth, and between fertility and poverty. Countries with high fertility are generally
poorer, on average, than countries with lower fertility, and they grow more slowly
(Figure 1). But cross-country correlations do not prove causality, either in the aggregate
or for any individual country. A number of studies have found causality going both ways
– from growth to demographic change and from demographic change to growth. And
Schultz (2004) finds that once the endogeneity is controlled, there is no clear relationship
between demographic composition and a country‘s savings rate; he argues that children
are not consumption items, rather they are a form of savings. Moreover, even if a
correlation could be found across countries, that would say nothing about the evolution of
fertility, growth, and poverty over time and within any particular country. That faster-
growing countries have lower fertility does not necessarily mean that any one country
will grow more quickly if its fertility rate declines.
Figure 1. Poverty and economic growth are correlated with total fertility
020
40
60
80
100
Perc
ent of popula
tion u
nder
$2/d
ay
2 4 6 8Total fertility rate per woman
Source: World Bank data
-.05
0
.05
.1
Annual gro
wth
of G
DP
per
capita
0 2 4 6 8Total fertility rate per woman
Source: World Bank data
Note: 71 countries; most recent TFR available (1995-2004), mean growth 1995-2004;
source: World Bank World Development Indicators data.
As fertility declines, childbearing patterns change in three ways: women may
postpone their first birth, space their births, or stop having children at an earlier age than
previous cohorts. Each of these changes may have a different impact on the opportunities
facing women and the decisions they make regarding work and family. The pattern of

3
fertility change differs considerably around the world. In some countries, such as India,
women are stopping childbearing at an earlier age than previous cohorts. In some
African countries, such as Chad, however, young women can expect to have six children
or more during their lifetime. In Ghana, and in the Philippines, women are increasing the
interval between births.
What motivates families to have fewer children? In poor societies, with high
mortality, having many children provides both income and insurance. Children provide
labor for current consumption and a means of support in old age. As mortality declines
and markets for both human and financial capital develop, fewer children are required to
obtain these benefits for the household. Also, as families – and especially women –
develop their human capital, and as demand for skilled labor increases with development,
wages rise and so does the opportunity cost of time, including the time required to raise
children. Fertility falls as women‘s education and independence increase. This suggests
that the primary determinant of fertility change is change in desired family size – that is,
the demand side.
Goldin (1994) and Szulga (2005) argue that changes in the structure of the
economy affect fertility: predominantly rural economies are characterised by economies
of scope between child care and work (such as farm labor). As countries become more
urban, the complementarity between work and childcare diminishes, increasing the costs
of childbearing.
Much of the evidence to date suggests that family planning programs have only a
small effect on fertility (Pritchett 1994; Joshi and Schultz 2007; Gertler and Molyneaux
1994; Pitt, Rosenzweig, and Gibbons 1994). But the effect is not zero: childbearing does
respond to changes in the availability of contraceptive technology and information. In
the Matlab (Bangladesh) experiment, the exogenous distribution of family planning
services led to significant declines in fertility. But it is unclear whether the provision of
information led to a drop in desired family size, or whether the provision of services
allowed families to achieve their desired size.
Just as changes in the opportunity cost of women‘s time and the opportunities
available to women affect desired fertility, so does fertility affect the opportunities
available to women. Clearly, a woman‘s capacity to perform physical labor is diminished

4
during the period surrounding childbirth. The need to care for a child restricts the time
that a mother can devote to wage labor. A study on urban households in India concluded
that the presence of children increases mothers‘ time in home production, with the effect
of younger children (aged 0-6 years) being six times the effect of older children (Malathy
1994). As a lower bound, the cost of this time is the wage that would be paid to a
substitute caregiver. The need to provide care diminishes as the child grows, permitting
the mother to return to work (alternately, the utility of working exceeds the utility of
remaining at home).
Childbearing may also have dynamic, path-dependent effects on working. Wages
partly reflect work experience: withdrawal from the labor force reduces the experience
that a worker can accrue, thus reducing wages, potentially below the reservation wage
and below the fixed costs of entering the labor market and searching for a job. Eckstein
and Wolpin (1988) estimate a dynamic model of labor force participation and fertility
that includes the impact of experience on wages. While the presence of children reduces
participation, the positive effect of experience on wages provides an incentive for
continued work. Conversely, absences from the labor market reinforce continued
absence, given lower wages and job search costs.
This raises the possibility that different methods for limiting fertility may have
different consequences for labor force participation and earnings. Women who choose to
delay fertility can obtain more education or work experience early; those who stop
bearing children earlier can then benefit from the higher wages accruing to uninterrupted
labor force participation later on.
The participation of women in wage labor and the sector in which they participate
is partly a function of the structure of the local labor market policies and institutions
(Fussell and Zenteno 1997, Del Boca et al. 2004). Participation is more sensitive to
fertility in some sectors than in others. In Morocco, for instance, the public sector is
more accommodating than the private sector to the needs of mothers with young children
(Assaad and Zouari 2002).

5
Most previous studies of the relationship between fertility and labor force
participation have relied on cross-sectional data. With cross-sectional data it is difficult
to correct for both the endogeneity of fertility and the impact of unobserved heterogeneity
among women. Previous papers have relied on natural experiments or on instrumental
variables estimation with questionable exclusion restrictions (see Rosenzweig and
Wolpin 2000). Engelhardt, Kögel and Prskawetz (2004) finds significant causality in
both directions using European data; and Kögel (2003) finds that the negative correlation
between fertility and employment has become significantly smaller (though not positive)
in Europe since the mid-1980s. On the other hand, McNown and Rajbhandary (2001),
using cointegration methods, find that female labor force participation responds
significantly to fertility shocks, but the effects from work to fertility are insignificant.
Rosenzweig and Wolpin (1980, 2000), use cross-sectional data and the occurrence
of twins in the first pregnancy to look at the impact of fertility on participation, and show
significant negative effects of additional children on mother‘s labor force participation.
Using a two-stage estimation strategy, Angrist and Evans (1998) first estimate the
probability of childbearing as a function of the sex of the first two children. Using cross-
sectional data from Korea, Chun and Oh (2002) instrument fertility decisions using the
sex of the first child. They find that having an additional child reduces labor force
participation by almost 40%, on average; but there is considerable heterogeneity across
families. Carrasco (2001) also uses family sex composition as an instrument for
subsequent births. Hotz et al. (2005) exploit the occurrence of spontaneous abortion
(miscarriage) as the instrument for childbearing. These instrumental variables papers
generally support the endogeneity of fertility and work decisions. The results obtained
under the assumption of exogeneity significantly underestimate the true impact of
childbearing on labor force participation.
But recent research has shown that IV methods do not necessarily provide
unbiased estimates. Heckman and Urzúa (2009) argues that where treatment – in this
case fertility – is estimated using IV, what is measured is the impact of changes in the
instrument on the outcome, and not changes in the treatment. The IV estimator estimates
the local average treatment effect, which is the average effect of the treatment for the
subsample of the population that is induced by a specific change in the value of the IV to

6
select themselves into treatment. In our data, as described below, we have the advantage
of random assignment of family planning interventions, which is an exogenous
instrument directly and intentionally related to fertility, but not to work.
2.1 Family Planning, Fertility and Labor Markets in Matlab, Bangladesh
The International Center for Diarrhoeal Disease Research, Bangladesh
(ICDDR,B) has maintained a demographic surveillance system in Matlab upazila (60
kilometers southeast of Dhaka) since 1966. The area is a low-lying plain located between
two tidal rivers. In the 1970s, this area was relatively isolated with no major towns or
cities, and high, persistent rates of poverty and mortality. The social structure of Matlab
has been relatively stable into the 1990s: the population has a large, relatively traditional
and conservative Muslim majority (over 85%). Matlab has seen a remarkable
demographic transformation over the last thirty years: infant mortality has fallen from
110 per thousand live births in 1983 to 65 in 1995, while total fertility has dropped from
more than 6 in 1976 to just over 3 in 1995 (Joshi and Schultz 2007).
In 1977, the ICDDR,B introduced Contraceptive Distribution and the Family
Planning and Health Services in 70 of the 149 villages covered by the demographic
surveillance system, although by 1987, seven villages in the control area had disappeared
due to river erosion, leaving 142 (ICDDR, B 2001). The Matlab family planning
program experiment was designed to test whether the provision of low-cost
contraceptives services could induce demographic change in a society in the absence of
economic development (Phillips et al. 1982). The intervention consisted primarily of
home visits by trained female outreach workers in the 70 villages (blocks A, B,C and D),
while the households in control villages (blocks E and F) continue to receive pre-existing
standard government family planning services (which generally required visits to a local
health clinic). Four of the six blocks of villages were assigned to the program, and all
currently married women residing in the treatment villages received the program
treatment (Phillips 1994). In the initial stages of the program, the outreach workers
provided home consultation and encouragement on contraceptive needs ever two weeks,
providing pills, condoms, foam tablets, injectables and intra-uterine devices as well as

7
clinic referrals for tubectomies or menstrual regulation. Supplies and consultation are
free in both the program itself and the government healthcare facilities. Additional
maternal and child health services including immunization and antenatal care were
phased in from 1982 to 1986.
In a comprehensive review of the impacts of the Matlab program, Joshi and
Schultz (2007) find that fertility declined around 15 percent in program villages
compared to control villages, and that the program appears to have also improved
women‘s health, incomes, and assets. They argue that the social returns to this program
go far beyond mere fertility reduction.
Many researchers have implicitly assumed that the program was randomly
assigned, although program assignment was actually made at the block-level rather than
by randomizing individual villages into treatment. However, Sinha (2005) shows that
there were no systematic differences between treatment and control villages prior to
program initiation. Joshi and Schultz (2007) show that treatment and control villages had
similar pre-program surviving fertility levels, although the total fertility rate is slightly
higher in control villages in 1974. There has been some diffusion of program
information into control villages because of migration among the villages due to
marriages (Phillips et al. 1988). However, Joshi and Schultz (2007) conclude that the
program has well-defined treatment and control areas, with roughly similar geographical,
demographic and socioeconomic conditions.
3. Motivating Theory and Empirical Approach
3.1. Motivating Theory
In this section, we frame the empirical analysis to follow by proposing a simple model
of a woman‘s fertility and her decision to work. Consider a household with one female
parent decision maker, endowed with a single unit of time. Utility for the parent is
defined over their consumption c, leisure time in the home d, and the number of children,
n. For any number of children, household utility is
U(c,d,n) = log(c ) + log (d) + log(n) + (1)

8
where > 0 and > 0 captures the household‘s preference for leisure and children
respectively, and is a stochastic error term. As children require time and money, this is
reflected in the time and budget constraints. We assume that working outside the home is
a binary decision l that entails a fixed number of hours outside the home h for
compensation w, and having n children imposes a time cost of childcare of b per child.
Firstly, the single unit of time is allocated to leisure d, childcare b and labor hours h:
d – hl – bn = 1 (2)
Secondly, the parent‘s earnings and other income A (asset income, or income transfers
from a male parent) are allocated between the adult and children, who consume g each,
such that
c + gn = wl + A (3)
If the parent decides to work, then their utility is described by U(1) = log(w +A) + log
(1- h - bn) + log(n) + 1; otherwise their utility is U(0) = log(A) + log (1- bn) +
log(n) + 0. The parent therefore decides to work if and only if there is a net gain in
utility from working, i.e.
l = I(U(1)-U(0) >0 ) (4)
where I is the indicator function, and the likelihood of working, Pr(l = 1) = Pr(D >1 - 0 )
where D = U(1)-U(0) = log(w +A – gn) - log(A – gn) + (log (1- h - bn) - log (1- bn)).
To understand how exogenous changes in fertility impact the likelihood of the
female parent working, we take the partial derivative of D with respect to n,
D
n
wg
(A gn)(A gn w)
bh
(1bn)(1 h bn) (5)
We note that the sign of this expression may be positive or negative, depending on the
values of the parameters. Specifically, the gain from working increases in the number of
children if and only if
wg
(A gn)(A gn w)
bh
(1bn)(1 h bn) (6)

9
Intuitively, as the number of children increases, the probability of working decreases if
parents place relatively more value on scarce leisure than the need for extra consumption.
On the other hand, if the need for extra consumption outweighs preferences for additional
leisure, parents will be more likely to work as family size increases.
For example, if we interpret d as time spent on housekeeping, we may consider
that certain types of employment such as home production are not mutually exclusive
with housekeeping or childcare, due to economies of scope. If home production is the
dominant form of labor, in the extreme case that h = 0, the parent is clearly more likely to
work as the number of children increases.
On the other hand, consider the possibility that the number of children affects the
resources of the household only through the time constraint, as in Bloom et al (2007). If
the analogous assumption, g = 0, is adopted, the partial derivative is unambiguously
negative. A drop in fertility thus yields the predicted increase in female labor supply that
contributes to what Bloom et al (2007) call the ―demographic dividend.‖
3.2. Empirical Approach
3.2.1. Basic Specification
We adopt a reduced-form empirical approach to the motivating theory sketched
above, by estimating probit regressions of the form
liv ni Xi ' Yv ' iv (7)
where l is a binary indicator for the work status of individual i living in village v, n is
the total number of children, X is a vector of individual control variables, Y is a vector of
village level controls, and is a stochastic error term. We are interested in , the which
describes the relationship between fertility and labor market participation.
However, it is important to note that in spite of controlling for individual or
household characteristics, estimating equation (7) above is unlikely to yield effects that
can be interpreted causally. While early studies treated fertility as an exogenous
determinants of female labor supply behavior (for example, Mincer 1962; Cain 1966;
Heckman 1974), a large body of more recent work has shown that fertility is most

10
plausibly regarded as endogenous if the household jointly chooses both the decision to
work and the number of children. Omitted variables, such as unobservable preferences,
may affect both labor supply behavior and fertility decisions, and n and in Equation (7),
are therefore likely to be correlated.
3.2.2. Identification
To deal with the endogenity of fertility and labor force decisions, we propose an
instrumental variables (IV) strategy based on the ―natural experiment‖ of the introduction
of family planning services in the Matlab area. In order for program exposure to be a
valid instrument, the program should be correlated with fertility outcomes but otherwise
should have no impact on female labor supply decisions. As noted above, previous work
has demonstrated that the intensive family planning program in treatment villages
significantly reduced fertility in program households through the take up of modern
contraceptive methods. However, whether or not program exposure satisfies the
exclusion restriction merits further discussion.
Firstly, the program should not result in changes in the monetary cost of obtaining
contraception large enough to plausibly impact women‘s need to generate labor income.
Contraception in both treatment and control villages remained free, with the program
primarily reducing the inconvenience and stigma cost of using modern methods.
The Matlab intervention has had a significant impact on fertility, over and above
the remarkable secular decline in fertility in the country as a whole during that period.
Phillips et al. (1982), Foster and Roy (1997) and Sinha (2005) show that women in
program villages have made use of modern contraceptive methods to reduce fertility, by
increasing birth spacing and postponing births over time. We re-examine the impact of
changes in childbearing over all, as well as the impact of different methods for limiting
fertility, and their consequences for labor market participation.
We might be concerned about program effects on other underlying factors apart
from fertility that affected women‘s decision to work. For example, repeated contact
with female health workers may have affected social norms related to working outside
the home. Alternatively, the maternal and child health services component of the
11
program may have increased the health (and hence, labor productivity) of mothers or
reduced the time needed to care for sick children. In their detailed review of the program,
however, Schultz and Joshi (2007) argue that the maternal and child health services
component of the program did not appear to explain a significant share of the variation in
child or maternal health in 1996.
Observed correlations between changes in fertility and employment, growth, or
other factors may also be merely coincidental, reflecting independent secular changes
over time or some cointegrated processes driven by other, unobserved, phenomena. In
the case of Bangladesh, Amin and Lloyd (1998), using data from the 1996/7 Bangladesh
Demographic and Health Survey, rule out any causal relationship from improvements in
the economic opportunities of reproductive-aged women or in women‘s autonomy to the
decline in fertility.2
Finally, the program should not exert demand side effects for labor. In this case,
one concern might be that expanded reproductive health services in program areas might
have led to greater demand for local female workers.
4. Descriptive Analysis and Sample Selection
Comprehensive socioeconomic surveys of Matlab were conducted in 1982 and
1996. For purposes of this study, data is available on 6068 women interviewed during
the 1996 Matlab Health and Socioeconomic Survey (MHSS), which surveyed 4,364
households residing in 141 villages in the overall surveillance area, covering both
treatment and control villages (Rahman et al. 1999). The primary sampling unit was the
bari, or the residential compound (containing a cluster of households). One or two
selected households from each selected bari were chosen for interview. One household
per bari was chosen at random, while the second household in multiple-household baris
was selected if it contained elderly relatives, so as to oversample elderly respondents.
2 The chain of causality is likely to be a bit more complex: Anderson and Eswaran (2005)
demonstrate that in rural Bangladesh, the income a woman earns away from her
husband‘s farm contributes significantly to her autonomy, and Eswaran (2002) shows that
a woman‘s autonomy influences both fertility and child mortality.

12
The set of ever-married women for which data on family background and fertility
are complete comprises a sample of 1810 individuals. We restrict our sample to women
in program and nonprogram villages who were eligible to receive the program. The final
study sample is restricted to married women aged 20-55; we exclude women who did not
participate for biological reasons (i.e. report never using contraception due to infertility,
or report having been sterilized prior to 1972), giving a final sample of 1278 observations
(for most specifications), for which summary statistics are reported in Table 1.
Table 1. Sample descriptive statistics
Variable
Control
villages
Program
villages Total
T-test of
equality N
Age (years) 36.73 37.27 37.00 (1.04) 1278
Hindu 0.05 0.16 0.11 (6.60)** 1278
Husband's education 2.93 3.61 3.27 (3.17)** 1278
Education 1.92 2.19 2.05 (1.69)+ 1278
Ln(farmland) 0.41 0.42 0.42 (0.50) 1278
Currently working (percent) 74.26 69.54 71.91 (1.88)+ 1278
In informal sector 71.29 63.74 67.53 (2.89)** 1278
In formal sector 2.96 5.81 4.38 (2.49)* 1278
In home-based business 74.41 74.25 74.33 (0.07) 1278
Outside home 7.64 8.01 7.82 (0.24) 1278
Number of live births 4.98 4.40 4.69 (4.00)** 1278
Birth spacing (months) 46.26 50.23 48.18 (2.73)** 1039
Age at first pregnancy 18.85 18.83 18.84 (0.13) 1234
Number of births within past five years 0.90 0.70 0.80 (3.82)** 1255
**, *, +: significant at 1, 5, 10 percent, respectively.
Table 1 shows that married women in program areas and non-program areas have
the same average age, but otherwise differ on a number of relevant background
characteristics. In particular, program villages in 1996 have a smaller Muslim majority,
and have higher levels of education overall. They also appear to have higher levels of
education, but no difference in land ownership. Joshi and Schultz (2007) also report
differences in religious composition, asset ownership and education in the pre-existing
data. Women in program villages have a significantly lower level of realized fertility, as
measured by the number of live births; this appears to be due to increased birth spacing
rather than to a delay in the initiation of childbearing.3 Women in program villages are
3 Note that there are fewer observations on these alternative, more specific measures of
fertility.

13
less likely to be working. On the other hand, to the extent that they are working, they are
more likely to be employed in the formal sector than women in control villages.
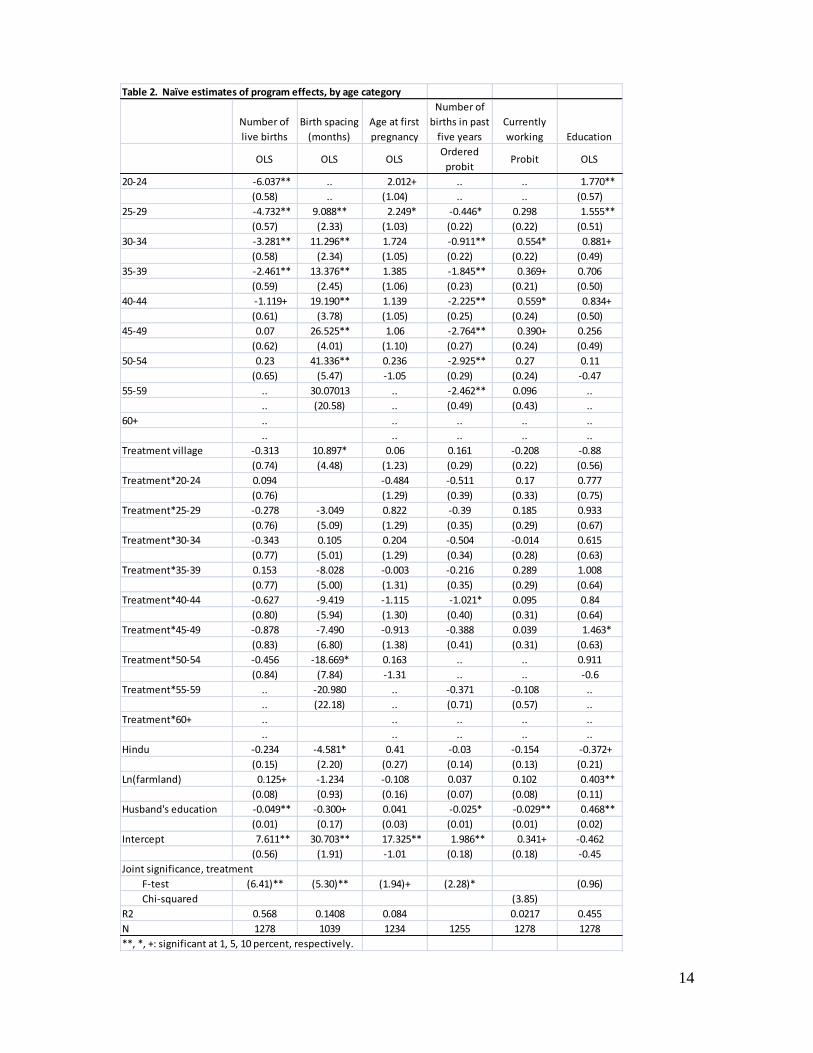
Table 2 presents naïve estimates of program impact on a number of outcomes,
fertility-related, employment, and education. These regressions include program
exposure interacted with age dummies as well as the limited set of control variables for
the background characteristics described above. This table shows that the program did
have some effect on fertility, but no direct impact on education or labor force
participation.
The pattern of results in total live births is consistent with program effects: the
largest differences in fertility among women exposed to the program are among cohorts
aged 40-49. Those aged 55 and older, having been at least 40 at the time of program
inception, may be regarded as having completed childbearing, and thus their fertility
would not have been affected. An F-test on all cohort-program interactions jointly is
strongly significant. The significantly lower fertility among younger cohorts in general
reflects secular changes in fertility as well as the fact that these women are not likely to
have completed childbearing. The program also had significant impacts on other
measures of fertility: age at first birth, age at first pregnancy, birth spacing (the number of
months between births), and the number of births within the past five years.
14
Table 2. Naïve estimates of program effects, by age category
Number of
live births
Birth spacing
(months)
Age at first
pregnancy
Number of
births in past
five years
Currently
working Education
OLS OLS OLSOrdered
probitProbit OLS
20-24 -6.037** .. 2.012+ .. .. 1.770**
(0.58) .. (1.04) .. .. (0.57)
25-29 -4.732** 9.088** 2.249* -0.446* 0.298 1.555**
(0.57) (2.33) (1.03) (0.22) (0.22) (0.51)
30-34 -3.281** 11.296** 1.724 -0.911** 0.554* 0.881+
(0.58) (2.34) (1.05) (0.22) (0.22) (0.49)
35-39 -2.461** 13.376** 1.385 -1.845** 0.369+ 0.706
(0.59) (2.45) (1.06) (0.23) (0.21) (0.50)
40-44 -1.119+ 19.190** 1.139 -2.225** 0.559* 0.834+
(0.61) (3.78) (1.05) (0.25) (0.24) (0.50)
45-49 0.07 26.525** 1.06 -2.764** 0.390+ 0.256
(0.62) (4.01) (1.10) (0.27) (0.24) (0.49)
50-54 0.23 41.336** 0.236 -2.925** 0.27 0.11
(0.65) (5.47) -1.05 (0.29) (0.24) -0.47
55-59 .. 30.07013 .. -2.462** 0.096 ..
.. (20.58) .. (0.49) (0.43) ..
60+ .. .. .. .. ..
.. .. .. .. ..
Treatment village -0.313 10.897* 0.06 0.161 -0.208 -0.88
(0.74) (4.48) (1.23) (0.29) (0.22) (0.56)
Treatment*20-24 0.094 -0.484 -0.511 0.17 0.777
(0.76) (1.29) (0.39) (0.33) (0.75)
Treatment*25-29 -0.278 -3.049 0.822 -0.39 0.185 0.933
(0.76) (5.09) (1.29) (0.35) (0.29) (0.67)
Treatment*30-34 -0.343 0.105 0.204 -0.504 -0.014 0.615
(0.77) (5.01) (1.29) (0.34) (0.28) (0.63)
Treatment*35-39 0.153 -8.028 -0.003 -0.216 0.289 1.008
(0.77) (5.00) (1.31) (0.35) (0.29) (0.64)
Treatment*40-44 -0.627 -9.419 -1.115 -1.021* 0.095 0.84
(0.80) (5.94) (1.30) (0.40) (0.31) (0.64)
Treatment*45-49 -0.878 -7.490 -0.913 -0.388 0.039 1.463*
(0.83) (6.80) (1.38) (0.41) (0.31) (0.63)
Treatment*50-54 -0.456 -18.669* 0.163 .. .. 0.911
(0.84) (7.84) -1.31 .. .. -0.6
Treatment*55-59 .. -20.980 .. -0.371 -0.108 ..
.. (22.18) .. (0.71) (0.57) ..
Treatment*60+ .. .. .. .. ..
.. .. .. .. ..
Hindu -0.234 -4.581* 0.41 -0.03 -0.154 -0.372+
(0.15) (2.20) (0.27) (0.14) (0.13) (0.21)
Ln(farmland) 0.125+ -1.234 -0.108 0.037 0.102 0.403**
(0.08) (0.93) (0.16) (0.07) (0.08) (0.11)
Husband's education -0.049** -0.300+ 0.041 -0.025* -0.029** 0.468**
(0.01) (0.17) (0.03) (0.01) (0.01) (0.02)
Intercept 7.611** 30.703** 17.325** 1.986** 0.341+ -0.462
(0.56) (1.91) -1.01 (0.18) (0.18) -0.45
Joint significance, treatment
F-test (6.41)** (5.30)** (1.94)+ (2.28)* (0.96)
Chi-squared (3.85)
R2 0.568 0.1408 0.084 0.0217 0.455
N 1278 1039 1234 1255 1278 1278
**, *, +: significant at 1, 5, 10 percent, respectively.

15
Figures 1-4 present this information more intuitively. Each shows the predicted
values of selected outcomes, by age cohort, among women in program and non-program
villages. In each figure, the darker band represents control villages and the lighter band
represents program villages; the width of the bands is the 95 percent confidence interval
around the means. Figure 1 shows that the impact of the program on total fertility is
significant among women aged 25-34 and 40-49. In these cohorts, women in program
villages had significantly fewer children than their coevals in control villages.
Figure 1. Impact of treatment on total fertility, by cohort.
0
2
4
6
8
Tota
l n
um
ber
of liv
e b
irth
s
20-24 25-29 30-34 35-39 40-44 45-49 50-54 55-59 60+
Age category
Control villages Treatment villages
Figure 2 shows that the program also had a significant effect on birth spacing, but
only among women aged 25-34 (and possibly 20-34). Among older cohorts, the
estimates quickly become imprecise and insignificant. Figures 3 and 4 confirm that there
is no direct relationship between exposure to the family program and either working or
the level of education. There are clear trends over time (for education) and over age
cohort (for labor force participation), but there are no differences across treatment groups.

16
Figure 2. Impact of treatment on birth spacing, by cohort.
20
40
60
80
100
Bir
th s
pacin
g (
mo
nth
s)
20-24 25-29 30-34 35-39 40-44 45-49 50-54 55-59 60+
Age category
Control villages Treatment villages
Figure 3. Impact of treatment on labor force participation, by cohort.
-.5
0
.5
1
1.5
Curr
ently w
ork
ing
20-24 25-29 30-34 35-39 40-44 45-49 50-54 55-59 60+
Age category
Control villages Treatment villages

17
Figure 4. Impact of treatment on education, by cohort.
0
1
2
3
4
Ye
ars
of sch
oo
ling
20-24 25-29 30-34 35-39 40-44 45-49 50-54 55-59 60+
Age category
Control villages Treatment villages
Figure 5 below shows the relationship between current employment and fertility
in this sample. The bars represent the 95 percent confidence intervals around the means,
and the line is a density function reporting the share of women reporting births in each
category.4 The modal number of births is five. This figure shows clearly that as the
number of live births increases, the probability of currently working also increases. This
suggests a positive relationship, but given the endogeneity concerns discussed previously,
this can‘t by itself be given a causal interpretation. In the next section, we proceed to
causal inference.
4 This figure is top-coded at 10: the category ―10‖ includes the 47 women who report at
least ten births, including one reporting 13 and one reporting 17 births. The regressions
below include all reported measurements.

18
Figure 5. Correlation between fertility and employment.
0
.05
.1
.15
Sh
are
of w
om
en
re
po
rtin
g b
irth
s
.4
.6
.8
1
Pro
ba
bili
ty o
f cu
rren
tly w
ork
ing
0 2 4 6 8 10
Number of live births
5. Main Results
This section reports the main results of the examination of fertility on labor force
participation, controlling for age, religion, education of the woman and her husband, and
land ownership (in logs), and whether there is a health clinic in the village. The first
column in Table 3 looks at the simple impact of childbearing on labor force participation,
assuming exogeneity. This column confirms the positive correlation found earlier; the
other significant correlates of the decision to work are husband‘s education and the
presence of a health clinic. Columns 2-4 then examine the relationship between fertility
and labor force participation, instrumenting the fertility decision by exposure to the
Matlab family planning program (standard errors in all regressions are clustered by the
primary sampling unit, the bari).7
7 The results are also robust to the inclusion of additional control variables, such as
community characteristics (distance to market, etc.). Results available.
19
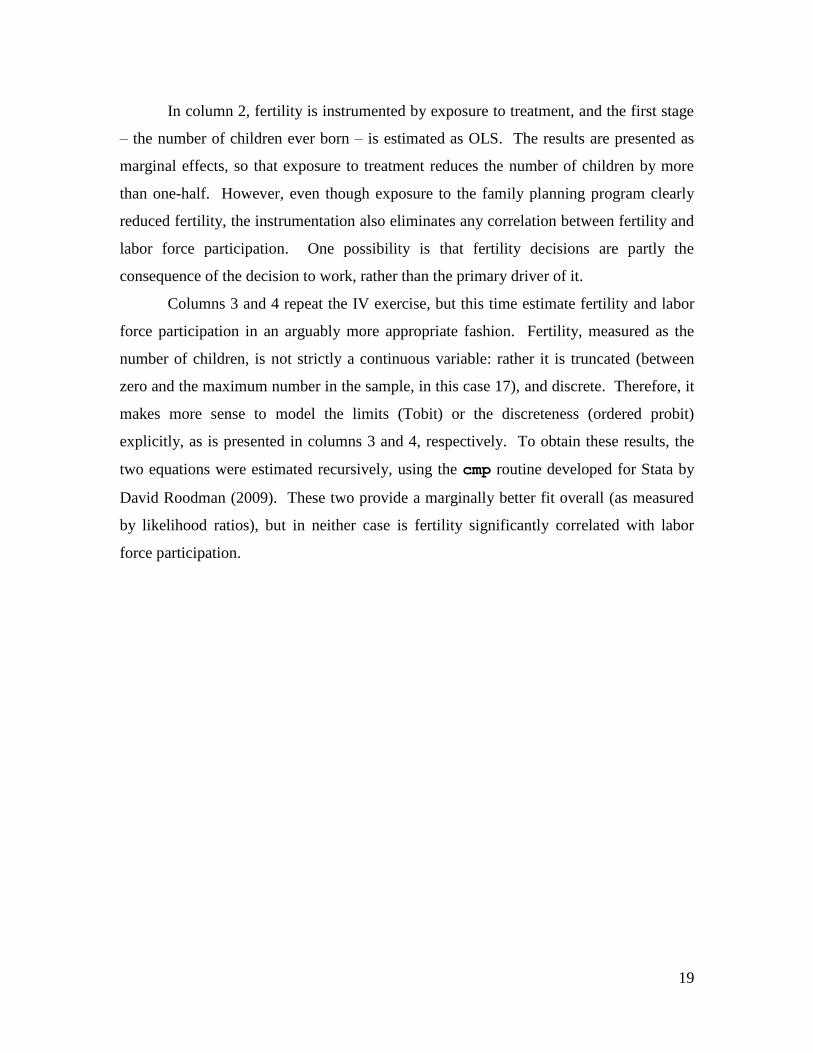
In column 2, fertility is instrumented by exposure to treatment, and the first stage
– the number of children ever born – is estimated as OLS. The results are presented as
marginal effects, so that exposure to treatment reduces the number of children by more
than one-half. However, even though exposure to the family planning program clearly
reduced fertility, the instrumentation also eliminates any correlation between fertility and
labor force participation. One possibility is that fertility decisions are partly the
consequence of the decision to work, rather than the primary driver of it.
Columns 3 and 4 repeat the IV exercise, but this time estimate fertility and labor
force participation in an arguably more appropriate fashion. Fertility, measured as the
number of children, is not strictly a continuous variable: rather it is truncated (between
zero and the maximum number in the sample, in this case 17), and discrete. Therefore, it
makes more sense to model the limits (Tobit) or the discreteness (ordered probit)
explicitly, as is presented in columns 3 and 4, respectively. To obtain these results, the
two equations were estimated recursively, using the cmp routine developed for Stata by
David Roodman (2009). These two provide a marginally better fit overall (as measured
by likelihood ratios), but in neither case is fertility significantly correlated with labor
force participation.

20
Table 3. Main results: impact of childbearing on working
1 2 3 4
Probit IV Probit IV Probit IV Probit
Currently working
Number of live births 0.021** 0.122 0.066 0.032
(0.01) (0.12) (0.06) (0.09)
Age -0.042+ -0.269 -0.135 -0.053
(0.02) (0.30) (0.16) (0.23)
Hindu1 -0.069 -0.168 -0.195 -0.211
(0.05) (0.14) (0.13) (0.13)
Highest education 0.008 0.03 0.025 0.022
(0.01) (0.02) (0.02) (0.02)
Husband education -0.011* -0.031* -0.032** -0.032*
0.00 (0.01) (0.01) (0.01)
ln(farm land) 0.025 0.064 0.073 0.078
(0.02) (0.07) (0.07) (0.07)
Clinic in village1 -0.090** -0.251** -0.258** -0.261**
(0.03) (0.09) (0.09) (0.09)
Number of live birthsOLS Tobit
Ordered
probit
Age 2.419** 2.532** 1.474**
(0.07) (0.07) (0.07)
Hindu1 -0.273+ -0.288+ -0177+
(0.15) (0.17) (0.09)
Highest education -0.091** -0.111** -0.059**
(0.02) (0.03) (0.01)
Husband education -0.001 0.004 0.004
(0.02) (0.02) (0.01)
ln(farm land) 0.147+ 0.144+ 0.073
(0.08) (0.08) (0.05)
Clinic in village1 0.015 0.022 0.002
(0.12) (0.13) (0.07)
Treatment village1 -0.628** -0.731** -0.355**
(0.09) (0.11) (0.06)
Intercept -9.434** -10.107**
(0.38) (0.44)
Wald Chi-squared 29.88** 23.29** 22.72** 20.62**
Log-pseudolikelihood (744.65) (3237.23) (3076.69) (3175.96)
N 1278 1278 1278 12781 Categorical variable
**, *, +: significant at 1, 5, 10 percent, respectively.
(marginal effects)
21
The Matlab surveys asked respondents to identify whether work is their primary
activity for the last year. For those who report ever working, the survey also elicited
occupation codes. Assuming that these occupation types correspond to the currently-
reported work, we were able to classify work into home-based production and outside
labor (primarily agricultural labor, operating a business or professional work), as well as
into formal-sector and informal-sector work. The vast majority of working women report
participating in home-based production: fewer than five percent can be classified as
working in the formal sector, and fewer than eight percent report participation in any type
of outside labor. The overwhelming majority report working at home, in activities such
as processing rice, raising poultry and livestock. The low rate of female participation in
wage labor and the predominance of home-based production suggests that the rural labor
market remains heavily influenced by pre-existing social norms, particularly the cultural
practice of female seclusion.
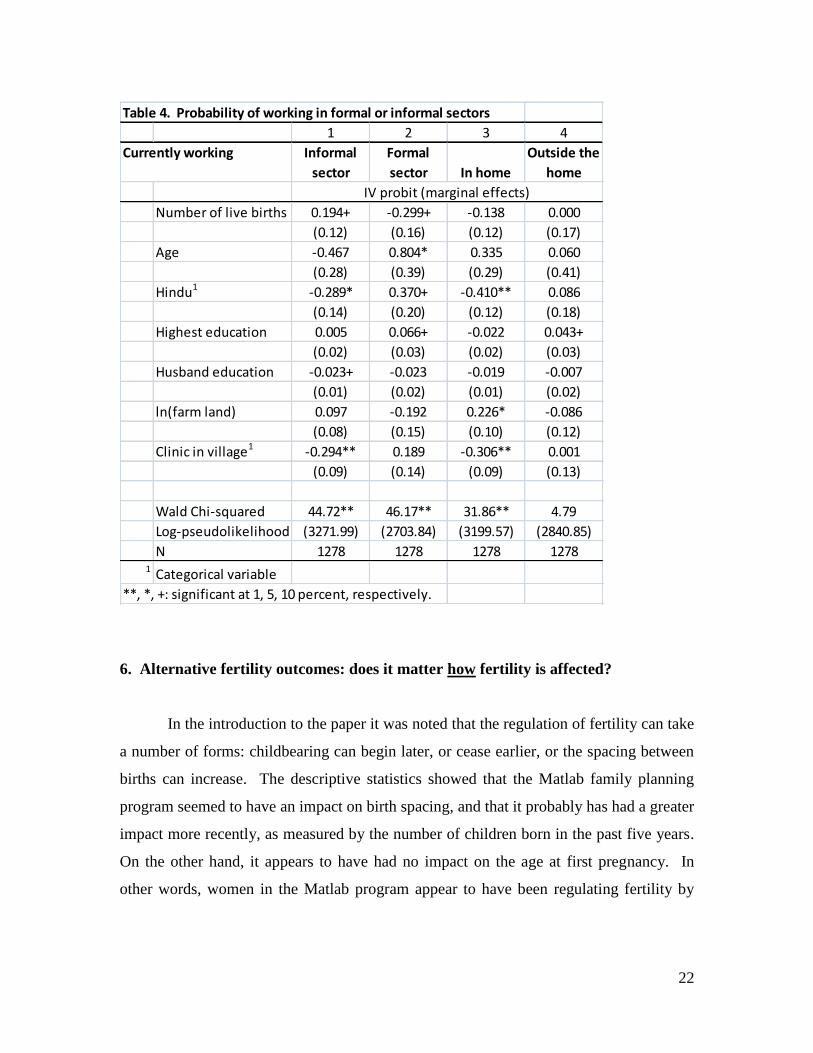
We re-estimate Equation (7) again using instrumental variables, with home-based
production, outside labor, formal- and informal-sector labor as separate dependent
variables.8 Columns 1 and 2 in Table 4 show the results for formal and informal-sector
work. These columns show that higher fertility, instrumented by exposure to the Matlab
program, increases the likelihood of informal-sector work and decreases the likelihood
that the woman will participate in the formal sector. This makes intuitive sense –
heightened family obligations may increase the value of the flexibility and ease of entry
provided by the informal sector. On the other hand, there appears to be no robust
correlation between fertility and decisions to work inside or outside the home.
8 Joint estimation, with sector choice as e.g. multinomial logit, failed to converge.
22
Table 4. Probability of working in formal or informal sectors
1 2 3 4
Currently working Informal
sector
Formal
sector In home
Outside the
home
Number of live births 0.194+ -0.299+ -0.138 0.000
(0.12) (0.16) (0.12) (0.17)
Age -0.467 0.804* 0.335 0.060
(0.28) (0.39) (0.29) (0.41)
Hindu1 -0.289* 0.370+ -0.410** 0.086
(0.14) (0.20) (0.12) (0.18)
Highest education 0.005 0.066+ -0.022 0.043+
(0.02) (0.03) (0.02) (0.03)
Husband education -0.023+ -0.023 -0.019 -0.007
(0.01) (0.02) (0.01) (0.02)
ln(farm land) 0.097 -0.192 0.226* -0.086
(0.08) (0.15) (0.10) (0.12)
Clinic in village1 -0.294** 0.189 -0.306** 0.001
(0.09) (0.14) (0.09) (0.13)
Wald Chi-squared 44.72** 46.17** 31.86** 4.79
Log-pseudolikelihood (3271.99) (2703.84) (3199.57) (2840.85)
N 1278 1278 1278 12781 Categorical variable
**, *, +: significant at 1, 5, 10 percent, respectively.
IV probit (marginal effects)
6. Alternative fertility outcomes: does it matter how fertility is affected?
In the introduction to the paper it was noted that the regulation of fertility can take
a number of forms: childbearing can begin later, or cease earlier, or the spacing between
births can increase. The descriptive statistics showed that the Matlab family planning
program seemed to have an impact on birth spacing, and that it probably has had a greater
impact more recently, as measured by the number of children born in the past five years.
On the other hand, it appears to have had no impact on the age at first pregnancy. In
other words, women in the Matlab program appear to have been regulating fertility by

23
increasing birth spacing, but not by postponing the initiation of fertility.9 One might
plausibly expect that birth spacing and the timing of initiation will have different
consequences for labor force participation. Later initiation will allow a young woman to
accumulate work experience and possibly more education. The health benefits of greater
birth spacing for both mother and child are well known, and greater intervals between
births may increase the returns to working for mothers who are healthier as well as
reduce the need to stay home to care for an infant.
Table 5 examines this question by repeating the analysis of Tables 3 and 4 for
three alternative fertility outcomes – birth spacing and the number of births in the past
five years. This table includes only the specific parameters of interest; control variables
and other parameters are available. Column 1 of this table shows that the Matlab
program had a significant impact on birth spacing. Women in program villages had a
four-month longer gap between births than women in control villages. However, this
increase in spacing did not appear to have any impact at all on the likelihood that a
woman entered the labor force. On the other hand, it did have an effect on the sector of
participation – women with longer intervals between births were more likely to work in
the formal sector, and less likely to work in the informal sector.
Column 2 of this table examines the impact of Matlab program exposure on the
number of births within the past five years. As with birth spacing, this has no discernible
impact on the probability of working, but does significantly affect the sector in which the
woman is more likely to work. Women with more recent births are more likely to work
in the informal sector, and much less likely to work in the formal sector.
9 We do not examine the cessation of fertility.

24
1 2
Birth spacing
(months)
Number of
births in past
five years
Working -0.021 0.522
(0.02) (0.43)
Informal sector -.027* 0.718**
(0.01) (0.33)
Formal sector .032* -0.881**
(0.01) (0.31)
Working in-home 0.006 -0.533
(0.02) (0.45)
Working outside the home 0.018 -0.064
(0.02) (0.72)
Impact of treatment on 4.310** -0.147**
fertility outcome1 (1.44) (0.05)
N 1039 12341
**, *, +: significant at 1, 5, 10 percent, respectively.
Table 5. Impact of childbearing on working (alternative
fertility outcomes)
These are the estimates from one of the five first-stage
regressions in each case. The parameters and standard
errors vary by less than one-tenth of one percent.
7. Alternative Instruments: Twin Births
Finally, we explored two additional variables as exogenous determinants of total
fertility. First, we used the experience of multiple births, as in Rosenzweig and Wolpin
(1980, 2000). We identified all members of the sample reporting a twin birth. Naturally,
the number of such occurrences is low – in our restricted sample, only 38 individuals in
our total sample (approximately 3%) reported a twin birth. To construct the indicator for
twin live births, we match the live birth history of the mother to the date of each live
birth, and classify as twins births that share the same date. We drop observations with
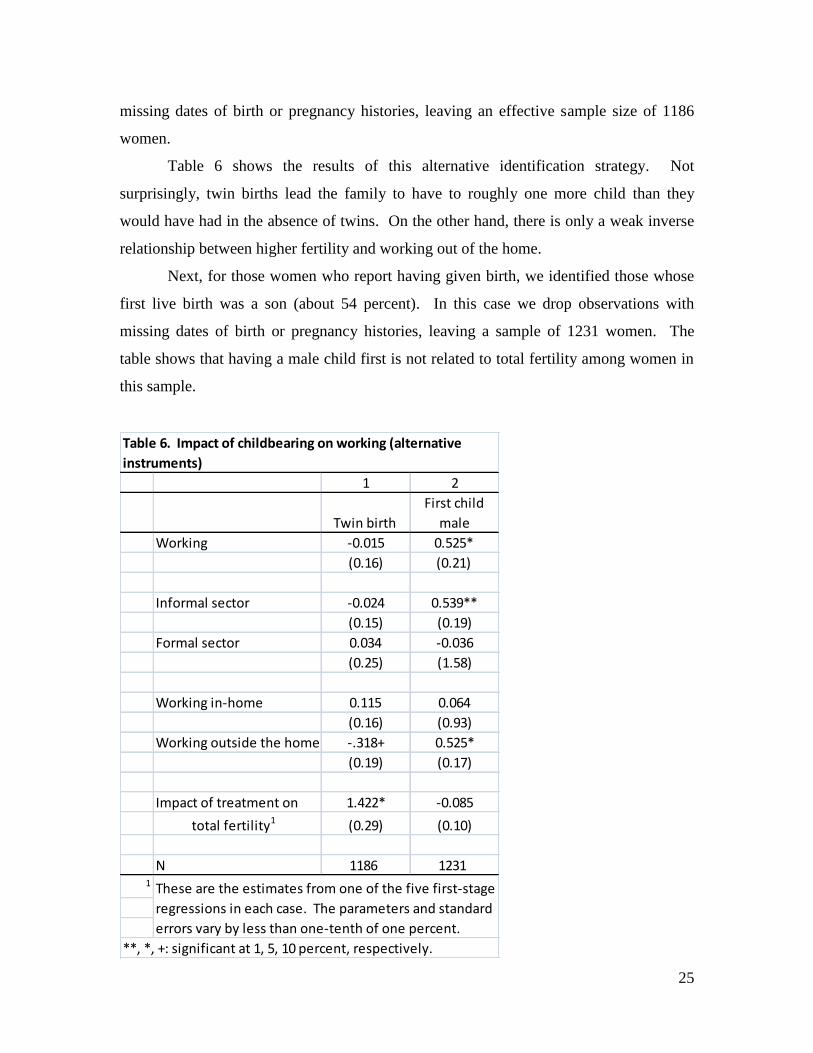
25
missing dates of birth or pregnancy histories, leaving an effective sample size of 1186
women.
Table 6 shows the results of this alternative identification strategy. Not
surprisingly, twin births lead the family to have to roughly one more child than they
would have had in the absence of twins. On the other hand, there is only a weak inverse
relationship between higher fertility and working out of the home.
Next, for those women who report having given birth, we identified those whose
first live birth was a son (about 54 percent). In this case we drop observations with
missing dates of birth or pregnancy histories, leaving a sample of 1231 women. The
table shows that having a male child first is not related to total fertility among women in
this sample.
1 2
Twin birth
First child
male
Working -0.015 0.525*
(0.16) (0.21)
Informal sector -0.024 0.539**
(0.15) (0.19)
Formal sector 0.034 -0.036
(0.25) (1.58)
Working in-home 0.115 0.064
(0.16) (0.93)
Working outside the home -.318+ 0.525*
(0.19) (0.17)
Impact of treatment on 1.422* -0.085
total fertility1 (0.29) (0.10)
N 1186 12311
**, *, +: significant at 1, 5, 10 percent, respectively.
Table 6. Impact of childbearing on working (alternative
instruments)
These are the estimates from one of the five first-stage
regressions in each case. The parameters and standard
errors vary by less than one-tenth of one percent.

26
7. Conclusions
This study examines changes in fertility and childbearing practices on the labor
force participation of women in rural Bangladesh. Since fertility is not exogenous to
other decisions taken by the family, we separately identify the impact of changes in
fertility on changes in work by taking advantage of a family-planning program selectively
introduced in the district of Matlab, Bangladesh that resulted in significant declines in
fertility, relative to the control areas. Our results show that, contrary to much previous
research, the number of children is only weakly associated with female labor force
participation.
Although it appears that fertility is not robustly or consistently related to labor
force participation overall, control over childbearing may affect the decisions made by
women concerning the sector of participation. Women with more children, those with
more young children, and those who bear children more quickly, at shorter intervals, may
be more likely to find employment in the informal sector. This is probably due to the
greater flexibility of employment in the informal sector.
27
References
Adair, L.S., D.K. Guilkey, E.Z. Bisgrove, and S. Gultiano, 2002. ―Effect of Childbearing
on Filipino Women's Work Hours and Earnings.‖ Journal of Population
Economics 15:4:625-45.
Amin, S. and C.B. Lloyd, 1998. Women‘s Lives and Rapid Fertility Decline: Some
Lessons from Bangladesh and Egypt. Working Paper No. 117, Policy Research
Division, Population Council.
Anderson, S. and M. Eswaran, 2005. What Determines Female Autonomy? Evidence
from Bangladesh. BREAD Working Paper No. 101.
Angrist, J. and W. Evans, 1998. ―Children and their Parents‘ Labor Supply: Evidence
from Exogenous Variation in Family Size,‖ American Economic Review 88(3),
450-477.
Assaad, R. and S. Zouari, 2002. The Timing of Marriage, Fertility, and Female Labor
Force Participation in Morocco. Presented at the Ninth Annual Conference of the
Economic Research Forum, UAE.
Bloom, D.E. and D. Canning, 2005. Health and Economic Growth: Reconciling the
Micro and Macro Evidence. Mimeo, Harvard School of Public Health.
Carrasco, R., 2001. ―Binary Choice with Binary Endogenous Regressors in Panel Data:
Estimating the Effect of Fertility on Female Labor Participation,‖ Journal of
Business & Economic Statistics 19:4:385-94.
Chun, H. and J. Oh, 2002. ―An instrumental variable estimate of the effect of fertility on
the labour force participation of married women,‖ Applied Economics Letters,
9:631-34.
da Vanzo, J., A. Razzaque, M. Rahman, and L. Hale, with K. Ahmed, M.A. Khan, G.
Mustafa, and K. Gausia, 2004. Spacing on Infant and Child Mortality, Pregnancy
Outcomes, and Maternal Morbidity and Mortality in Matlab, Bangladesh. RAND
Working Paper WR-198.
del Boca, D. et al., 2004. Labour Market Participation of Women and Fertility: the Effect
of Social Policies. Mimeo, University of Turin.
diPrete, T. and M. Gangl, 2004. ―Assessing Bias in the Estimation of Causal Effects:
Rosenbaum Bounds on Matching Estimators and Instrumental Variables
Estimation with Imperfect Instruments.‖ Sociological Methodology 34:271-310.
Eckstein, Z. and K. Wolpin, 1988. ―Dynamic labor force participation of married women
and endogenous work experience.‖ Review of Economic Studies 56:3:375-390.
Engelhardt, Kögel and Prskawetz, 2004. Fertility and women‘s employment
reconsidered: a macro-level time series analysis for developed countries, 1960-
2000. Mimeo, Max Planck Institute.
Eswaran, M., 2002. ―The Empowerment of Women, Fertility, and Child Mortality:
Towards a Theoretical Analysis.‖ Journal of Population Economics 15:433-454.

28
Feyrer, J., 2005. Demographics and Productivity. Mimeo, Dartmouth College.
Fussell, E. and R. Zenteno, 1997. Spatial Differences in Wage and Non-Wage Female
Labor Force Participation in Mexico. CDE Working Paper no 97-10, University
of Wisconsin.
Gertler, P. and J. Molyneaux, 1994. ―How economic development and family planning
programs combined to reduce Indonesian fertility.‖ Demography 31:33-64.
Goldin, C., 1994. ―The U-Shaped Female Labor Force Function in Economic
Development and Economic History.‖ In T.P. Schultz, ed., Investment in
Women's Human Capital and Economic Development. Chicago, IL: University
of Chicago Press, pp. 61-90.
Heckman, J. and S. Urzúa, 2009. Comparing IV with Structural Models: What Simple IV
Can and Cannot Identify. IZA Discussion Paper No. 3980.
Hotz, V.J, S.W. McElroy, and S.G. Sanders, 2005. ―Teenage Childbearing and Its Life
Cycle Consequences: Exploiting a Natural Experiment.‖ Journal of Human
Resources 40:3:683-715.
Hyslop, D.R., 1999. ―State dependence, serial correlation and heterogeneity in
intertemporal labor force participation of married women.‖ Econometrica
67:6:1255-1294.
ICDDR,B (International Centre for Diarrhoeal Disease Research, Bangladesh), Centre for
Health and Population Research, 2001. Health and Demographic Surveillance
System—Matlab, Registration of Health and Demographic Events, 1999. Vol.
32. Dhaka: International Centre for Diarrhoeal Disease Research, Bangladesh.
Joshi, S. and T.P. Schultz, 2007. Family Planning as an Investment in Development:
Evaluation of a Program‘s Consequences in Matlab, Bangladesh. Yale University
Economic Growth Center Discussion Paper No.951.
Kögel, T., 2003. Did the Association Between Fertility and Female Employment Within
OECD Countries Really Change its Sign? Mimeo, Max Planck Institute.
Malathy, R., 1994. ―Education and women‘s time allocation to nonmarket work in an
urban setting in India.‖ Economic Development and Cultural Change 42:4:743-
760.
McNown, R. and S. Rajbhandary, 2001 ―Time series analysis of fertility and female labor
market behavior.‖ Journal of Population Economics 16:501-523.
Miles-Doan, R. and K. Brewster, 1997. ―The impact of type of employment on women‘s
use of prenatal-care services and family planning in urban Cebu, the Philippines,‖
Studies in Family Planning 29:1:69-78.
Phillips, J.F., 1994. ―Matlab and the Bangladesh Family Planning and Health Program.‖
In Matlab: Women, Children, and Health, ed. Vincent Fauveau. ICDDR,B
Special Publication no. 35. Dhaka: International Centre for Diarrhoeal Disease
Research, Bangladesh.

29
Phillips, J.F., R. Simmons, M.A. Koenig, and J. Chakraborty, 1988. ―Determinants of
Reproductive Change in a Traditional Society: Evidence from Matlab,
Bangladesh.‖ Studies in Family Planning 19:6:313–34.
Phillips, J.F., W. Stinson, S. Bhatia, M. Rahman, and J. Chakraborty, 1982. ―The
Demographic Impact of Family Planning: Health Services Project in Matlab,
Bangladesh.‖ Studies in Family Planning 13:5:131–40.
Pitt, M.M., M.R. Rosenzweig, and D. Gibbons, 1993. ―The Determinants and
Consequences of the Placement of Government Programs in Indonesia.‖ World
Bank Economic Review 7:319–48.
Polhamus, B., 1996. A Profile of High-fertility Women in the Philippines. Carolina
Population Center, University of North Carolina, Chapel Hill, NC.
Pritchett, L., 1994. Desired fertility and the impact of population policies, Volume 1.
World Bank Policy Research Working Paper number 1273.
Rahman, O., J. Menken, A. Foster, C. Peterson, M. Khan, R. Kuhn, P. Gertler, ICDDRB,
and Mitra & Associates, 1999. The 1996 Matlab Health and Socioeconomic
Survey: Overview and User‘s Guide. Santa Monica, CA: RAND, DRU-2018/1-
NIA.
Roodman, D., 2009. Estimating Fully Observed Recursive Mixed-Process Models with
cmp. Center for Global Development Working Paper Number 168.
Rosenzweig, M. and K. Wolpin, 1980. ―Life-cycle labor supply and fertility: causal
inferences from household models.‖ Journal of Political Economy 88:2:328-348.
Rosenzweig, M. and K. Wolpin, 2000. ―Natural ‗natural‘ experiments in economics.‖
Journal of Economic Literature 38:4:827-874.
Schultz, T.P., 2004. Demographic Determinants of Savings: Estimating and Interpreting
the Aggregate Association in Asia. Yale University Economic Growth Center
Discussion Paper 901.
Sinha, N., 2005.―Fertility, Child Work, and Schooling Consequences of Family Planning
Programs: Evidence from an Experiment in Rural Bangladesh.‖ Economic
Development and Cultural Change 54:1:97-128.
Szulga, R., 2005. ―A dynamic model of female labor force participation rate and human
capital investment.‖ Mimeo, University of California Davis.
Tiefenthaler, J., 1997. ―Fertility and family time allocation in the Philippines.‖
Population and Development Review 23:2:377-397.
Troske, K.R. and A. Voicu, 2004. Joint estimation of sequential labor force participation
and fertility decisions using Markov chain Monte Carlo techniques. Working
Paper 0412, IZA, Bonn.
World Bank, 2006. World Development Report 2007: Development and the Next
Generation.