
Demographic Challenges and the Lisbon Strategy COSAC CHAIRPERSONS MEETING VIENNA 20 FEBRUARY 2006...
17
Demographic Challenges and the Lisbon Strategy COSAC CHAIRPERSONS MEETING VIENNA 20 FEBRUARY 2006 Wolfgang Lutz and Alexia Prskawetz Vienna Institute of Demography Austrian Academy of Sciences
-
Upload
julie-turner -
Category
Documents
-
view
219 -
download
1
Transcript of Demographic Challenges and the Lisbon Strategy COSAC CHAIRPERSONS MEETING VIENNA 20 FEBRUARY 2006...

Demographic Challenges and the Lisbon Strategy
COSAC CHAIRPERSONS MEETING VIENNA 20 FEBRUARY 2006
Wolfgang Lutz and Alexia Prskawetz
Vienna Institute of Demography
Austrian Academy of Sciences
Outline:
• Population ageing as a European mega-trend• Does ageing endanger the Lisbon targets?
- Balance of benefits and contributions in pensions systems
- Innovation and productivity
- Investments and competitiveness
• Can the demographic trends be influenced ?- Fertility
- Migration
• Conclusions
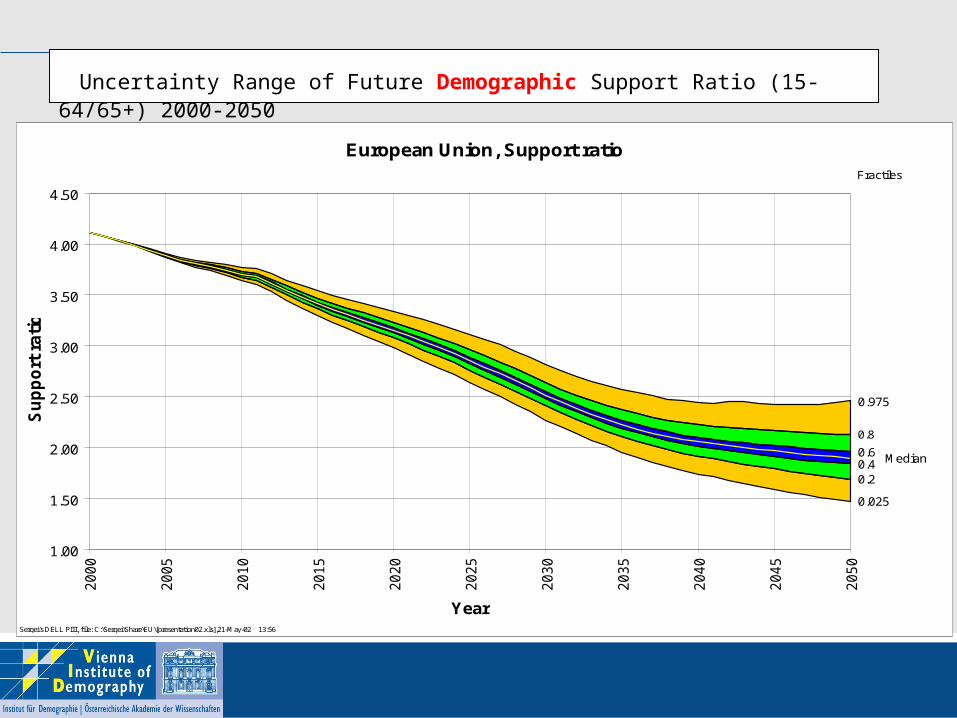
Uncertainty Range of Future Demographic Support Ratio (15-64/65+) 2000-2050
European Union, Support ratio
1.00
1.50
2.00
2.50
3.00
3.50
4.00
4.50
200
0
200
5
201
0
201
5
202
0
202
5
203
0
203
5
204
0
204
5
205
0
Year
Su
pp
ort
rati
o
0.8
0.40.2
0.025
0.975
Median0.6
Fractiles
Sergei's DELL PIII, file: C:\Sergei\Share\EU\[presentation02.xls],21-May-02 13:56

When considering pension expenditure, the key variable is not the demographic support ratio, but rather the balance between economically active and inactive persons.
The negative impact of demographic trends on this balance can be partially offset, if more persons of working age participate in the labour market.
Lisbon objective/target:
Making Europe the most competitive and dynamic knowledge-based economy in the world by 2010.
Aim to raise employment rates 70% - overall employment rate, 60%- female employment rate, 50%- older people
by 2010 and to improve labour market performance

Employment rates of workers aged 55-64, 2004, and the employment targets according to the Lisbon and Stockholm
summits
0,00
10,00
20,00
30,00
40,00
50,00
60,00
70,00
80,00B
E
DK
DE
GR
ES
FR IE IT LU
NL
AT
PT FI
SE
UK
EU
15
total
males
females
Eurostat, labour force survey

0,00
10,00
20,00
30,00
40,00
50,00
60,00
70,00
80,00
CY CZ EE HU LT LV MT PL SK SI EU25
total
males
females
Employment rates of workers aged 55-64, 2004, and the employment targets according to the Lisbon and Stockholm
summits
Eurostat, labour force survey

Important open question: Will a higher proportion of elderly workers lead to lower productivity growth and less innovation?
Major factors of productivity growth in Europe:
innovation (public and private)
information and communication technology (ICT)
international knowledge spill over
human capital development
entrepreneurship
Evidence that older people are less educated, less healthy and demand more transfers.Open question whether older workers are less willing to adopt new technologies.Unclear whether innovation and new firm entry hampered, if there are fewer young workers?

Many skills decline with age – Experience increases with age
-0,5
-0,4
-0,3
-0,2
-0,1
0,0
0,1
-19 20-24
25-34
35-44
45-54
55-65
Age
Pro
port
ion
of S
tand
ard
Dev
iatio
n to
25-
34 Y
ear
Old
s. ReferenceValues
DecliningImportanceofExperience
What is the balance at the level of firms? Evidence that the age profile is also hump shaped.
There is also the fear that in a globalizing world more investments will be made in dynamic markets rather than in those expected to stagnate.
-0,3
-0,2
-0,1
0,0
0,1
0,2
-19 20-24
25-34
35-44
45-54
55-65
Age
Sha
re o
f S
td.D
ev. (
25-3
4 Y
ear
Old
) 'Manager'
'Engineer'

For the future all three factors of population change are uncertain:Fertility - Mortality - Migration
This uncertainty affects different age groups very differently
0.0 1.0 2.0 3.0 4.0
2050204520402035203020252020201520102005200019951990198519801975197019651960195519501945
females
0.01.02.03.04.0
05
101520253035404550556065707580859095
100105
European Union, 2050
Population (millions)
males
Age Period of Birth
Sergei's DELL PIII, file: C:\Sergei\Current\Run\2002\EU\[make_pyramid_to_file2_EU2.xls],21-May-02 14:36

Western Europe, Total Fertility Rate, 1960-2001
Germany
Netherlands
FranceBelgium
Austria
Luxembourg
1.0
1.5
2.0
2.5
3.0
3.5
19
60
19
62
19
64
19
66
19
68
19
70
19
72
19
74
19
76
19
78
19
80
19
82
19
84
19
86
19
88
19
90
19
92
19
94
19
96
19
98
20
00
Year
To
tal F
ert
ility
Ra
te

Southern Europe, Total Fertility Rate, 1960-2001
Greece Slovenia
Portugal
Italy
Spain
1.0
1.5
2.0
2.5
3.0
3.5
19
60
19
62
19
64
19
66
19
68
19
70
19
72
19
74
19
76
19
78
19
80
19
82
19
84
19
86
19
88
19
90
19
92
19
94
19
96
19
98
20
00
Year
To
tal
Fe
rtil
ity
Ra
te

Northern Europe, Total Fertility Rate, 1960-2001
Denmark
Sweden
United Kingdom Ireland
Finland
1.0
1.5
2.0
2.5
3.0
3.5
4.0
4.5
19
60
19
62
19
64
19
66
19
68
19
70
19
72
19
74
19
76
19
78
19
80
19
82
19
84
19
86
19
88
19
90
19
92
19
94
19
96
19
98
20
00
Year
To
tal F
ert
ility
Ra
te

Czech Republic
Estonia
HungaryLatvia
LithuniaSlovak Republic
Poland
1.0
1.5
2.0
2.5
3.0
3.5
19
60
19
62
19
64
19
66
19
68
19
70
19
72
19
74
19
76
19
78
19
80
19
82
19
84
19
86
19
88
19
90
19
92
19
94
19
96
19
98
20
00
Year
To
tal
Fe
rtil
ity
Ra
te
Central / Eastern Europe, Total Fertility Rate since 1960

Central / Eastern Europe, mean age of childbearing, 1960-2001Tempo effect: While the mean age of childbearing increases, the Total Fertility Rate is artificially depressed: here since 1990
Czech Republic
Estonia
Hungary
Latvia
Lithunia
Slovak Republic Poland
24
25
26
27
28
29
30
19
60
19
62
19
64
19
66
19
68
19
70
19
72
19
74
19
76
19
78
19
80
19
82
19
84
19
86
19
88
19
90
19
92
19
94
19
96
19
98
20
00
Year
Me
an
Ag
e o
f C
hil
db
ea
rin
g

“Geburtenbarometer” for AustriaMonthly Changes in the Total Fertility Rates (TFR) and a rate adjusted for tempo distortions (PAP: Period Average Parity)Black line: In January 2002 a new child care benefit was introduced.
PAP im
September 2001: 1,54
Oktober 2005: 1,66
An
zah
l d
er
Kin
de
r p
ro F
rau
(Ø
)
1.20
1.30
1.40
1.50
1.60
1.70
1.80
Jan-2
000
July
-2000
Jan-2
001
July
-2001
Jan-2
002
July
-2002
Jan-2
003
July
-2003
Jan-2
004
July
-2004
Jan-2
005
July
-2005
Totale Fertilitätsrate (TFR)
Um Tempo-Effekt bereinigte Rate (PAP)
Einführung des Kinderbetreungsgelds

Can Migration Compensate for the Missing Births?Alternative Projections of the Old Age Dependency Ratio for the EU-15 in 2050
based on different Fertility and Migration Assumptions (Black line gives the level in 2000)
0.0
0.1
0.2
0.3
0.4
0.5
0.6
0.7
1 1.2 1.4 1.6 1.8 2 2.2
Total fertility rate
Old
-age
dep
ende
ncy
ratio
MIG=0 MIG=400,000 MIG=800,000 MIG=1,200,000 Year 2000
z

Conclusions:
• Population Ageing is a powerful force that will shape Europe’s society and economy in the future.
• Much is predetermined in the current age structure shaped by past trends, but there is certain room for policies to influence future fertility and migration levels that will moderate the speed and extent of ageing.
• Since this is a new experience in human history and Europe is at the forefront of this process, the social and economic implications are hard to predict.
• Ageing is a challenge rather than a crisis: It is like a current affecting a boat that has means to counteract it (by rowing or engine). The Lisbon strategy could be such an engine.