Demographic & Socio-Economic Development Indicators of ...
14
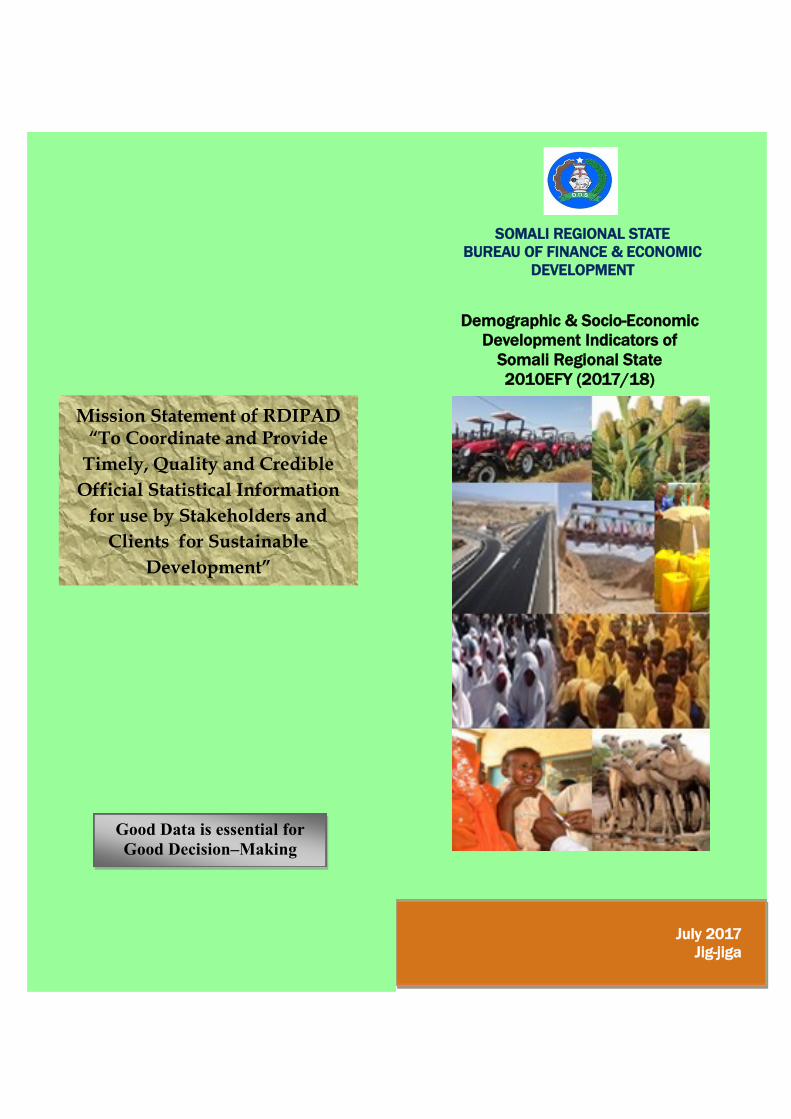
Good Data is essential for Good Decision–Making Mission Statement of RDIPAD “To Coordinate and Provide Timely, Quality and Credible Official Statistical Information for use by Stakeholders and Clients for Sustainable Development” July 2017 Jig-jiga SOMALI REGIONAL STATE BUREAU OF FINANCE & ECONOMIC DEVELOPMENT Demographic & Socio-Economic Development Indicators of Somali Regional State 2010EFY (2017/18)
Transcript of Demographic & Socio-Economic Development Indicators of ...
Good Data is essential for
Good Decision–Making
Mission Statement of RDIPAD “To Coordinate and Provide
Timely, Quality and Credible
Official Statistical Information
for use by Stakeholders and
Clients for Sustainable
Development”
July 2017
Jig-jiga
SOMALI REGIONAL STATE
BUREAU OF FINANCE & ECONOMIC
DEVELOPMENT
Demographic & Socio-Economic
Development Indicators of
Somali Regional State
2010EFY (2017/18)
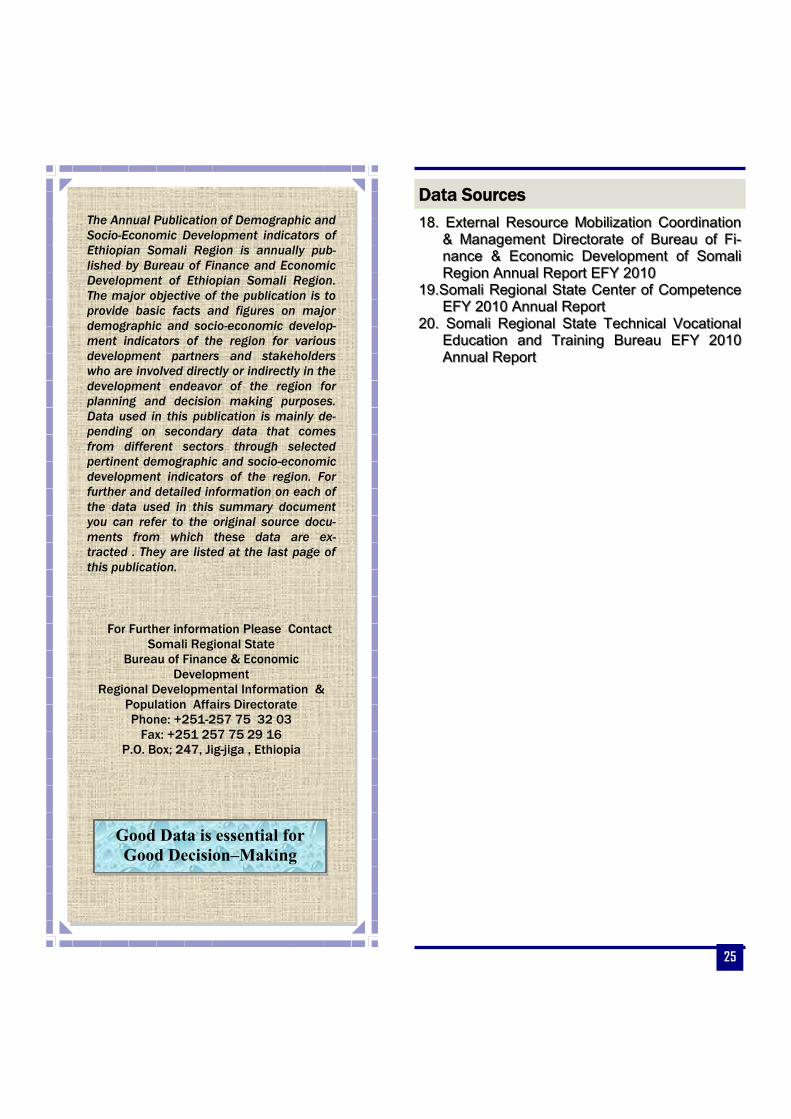
The Annual Publication of Demographic and
Socio-Economic Development indicators of
Ethiopian Somali Region is annually pub-
lished by Bureau of Finance and Economic
Development of Ethiopian Somali Region.
The major objective of the publication is to
provide basic facts and figures on major
demographic and socio-economic develop-
ment indicators of the region for various
development partners and stakeholders
who are involved directly or indirectly in the
development endeavor of the region for
planning and decision making purposes.
Data used in this publication is mainly de-
pending on secondary data that comes
from different sectors through selected
pertinent demographic and socio-economic
development indicators of the region. For
further and detailed information on each of
the data used in this summary document
you can refer to the original source docu-
ments from which these data are ex-
tracted . They are listed at the last page of
this publication.
For Further information Please Contact
Somali Regional State
Bureau of Finance & Economic
Development
Regional Developmental Information &
Population Affairs Directorate
Phone: +251-257 75 32 03
Fax: +251 257 75 29 16
P.O. Box; 247, Jig-jiga , Ethiopia
Good Data is essential for
Good Decision–Making
25
Data Sources
18. External Resource Mobilization Coordination 18. External Resource Mobilization Coordination
& Management Directorate of Bureau of Fi-& Management Directorate of Bureau of Fi-
nance & Economic Development of Somali nance & Economic Development of Somali
Region Annual Report EFY 2010Region Annual Report EFY 2010
19.Somali Regional State Center of Competence 19.Somali Regional State Center of Competence
EFY 2010 Annual ReportEFY 2010 Annual Report
20. Somali Regional State Technical Vocational 20. Somali Regional State Technical Vocational
Education and Training Bureau EFY 2010 Education and Training Bureau EFY 2010
Annual ReportAnnual Report
24
Data Sources
1.1. FDRE CSA (2013) Population Projections FDRE CSA (2013) Population Projections
for Ethiopian Somali Region from 2007for Ethiopian Somali Region from 2007--20372037
2.2. FDRE CSA (2007) Population and Housing FDRE CSA (2007) Population and Housing
Census Report. Census Report.
3.3. FDRE CSA (2012) InterFDRE CSA (2012) Inter--Censual Population Censual Population
Survey ReportSurvey Report
4. FDRE CSA (2011). Ethiopian Demographic 4. FDRE CSA (2011). Ethiopian Demographic
and Health Survey and Health Survey
5.5. Ministry of Health (MOH) (2011/12). Health Ministry of Health (MOH) (2011/12). Health
and Health Related Indicatorsand Health Related Indicators
6.6. Somali Region Bureau of Education EFY Somali Region Bureau of Education EFY
2010 Annual Performance Report 2010 Annual Performance Report
7. Somali Region Bureau of Health EFY 2010 An-7. Somali Region Bureau of Health EFY 2010 An-
nual Performance Report nual Performance Report
8.8. Somali Region Bureau of Livestock & Pas-Somali Region Bureau of Livestock & Pas-
toral Development EFY 2010 Annual Perform-toral Development EFY 2010 Annual Perform-
ance Report ance Report
9.9. Somali Region Bureau of Agriculture & Natu-Somali Region Bureau of Agriculture & Natu-
ral Resource Development EFY 2010 Annual ral Resource Development EFY 2010 Annual
Performance Report Performance Report
10. Somali Region Bureau of Water Supply De-10. Somali Region Bureau of Water Supply De-
velopment EFY 2010 Annual Performance velopment EFY 2010 Annual Performance
Report Report
11. Somali Region Bureau of Rural Road Author-11. Somali Region Bureau of Rural Road Author-
ity EFY 2010 Annual Performance Report ity EFY 2010 Annual Performance Report
12. Somali Region Micro & Small Enterprise De-12. Somali Region Micro & Small Enterprise De-
velopment Agency EFY 2010 Annual Per-velopment Agency EFY 2010 Annual Per-
formance Report formance Report
13. Ethiopian Light Electricity Power Authority 13. Ethiopian Light Electricity Power Authority
EFY 2010 Annual Performance Report EFY 2010 Annual Performance Report
14. Telecommunication Corporation EFY 2010 14. Telecommunication Corporation EFY 2010
Annual Performance Report Annual Performance Report
15 .Somali Region Bureau of Trade and Industry 15 .Somali Region Bureau of Trade and Industry
EFY 2010 Report EFY 2010 Report
16. Regional Developmental Information and 16. Regional Developmental Information and
Population Affairs Directorate of Bureau of Population Affairs Directorate of Bureau of
Finance & Economic Development of Somali Finance & Economic Development of Somali
Region EFY 2008 Regional GDP ReportRegion EFY 2008 Regional GDP Report
17. Budget Planning and M&E Directorate of Bu-17. Budget Planning and M&E Directorate of Bu-
reau of Finance & Economic Development of reau of Finance & Economic Development of
Somali Region EFY 2011 Budget ReportSomali Region EFY 2011 Budget Report
1
LOCATION: It is located in the east and south-east of the
country and lies between 4 and 11 degrees north latitude
and 40 and 48 degrees east longitude.
AREA: It is the first largest region in the country .It covers
a total area of 376,073.37km2 that pastoralists and agro-
pastoralists mostly inhabit it.
BOUNDARY: It shares borders with Somalia to the east
and southeast, Kenya to the south and Djibouti to the
north. To the northwest and west, it borders with Afar and
Oromiya Regions respectively.
ADMINISTRATIVE DIVISIONS: It has 11 Administrative
Zones, 6 City Administrations , 93 Districts & about
1,224 Kebeles.
TOPOGRAPHY: It has varied topography, ranging from low
undulating hills and plateaus in the eastern parts to high
hills in the central and southern parts.
ECOLOGY: it is divided into two ecological zones namely
the deyr receiving areas that consists of 7 zones namely,
Jerer, Korahey, Dolo, Shabele, Afder, Liban and Nogob
and the karan receiving areas that consists Fafen and
Siti zones excluding Harshin Woreda.
CLIMATE: is arid in most parts of the Region.
WEATHER: is hot in most parts of the year, with mean
temperatures ranging from 18 to 450C.
ANNUAL RAINFALL: It ranges from 150mm in the low ly-
ing areas of the region to 660mm received in high alti-
tude areas
ALTITUDE: it ranges from 200m in the southern-central
parts to 1,800m in Jijiga area.
PERMANENT RIVERS: Ganale, Shabelle ,Dawa and Web
SOIL FERTILITY: is high around permanent and seasonal
rivers which are cultivated by agro-pastoralists
LIVELIHOODS: Four generic livelihood types exist in the
region; pastoralist, agro-pastoralist, farming as sedentary
and riverine, and the urban sector.
PASTORALISM is the most prevalent comprising about
60% of the region’s rural population.
AGRO-PASTORALISM comprises about 25% of the total
rural population and is a mixture of extensive livestock
rearing and rain-fed crop production
SEDENTARY AND RIVERINE FARMERS comprises 15% of
the rural population who live along Shebelle and Dawa
Genale Rivers.
SOURCE OF INCOME: The main source of income for rural
population is livestock rearing, which constitute 40% of
the total income, while crop production constituted 26%,
trade 14%, and gift or obtained free 7%.
ETHIOPIAN SOMALI REGION
2
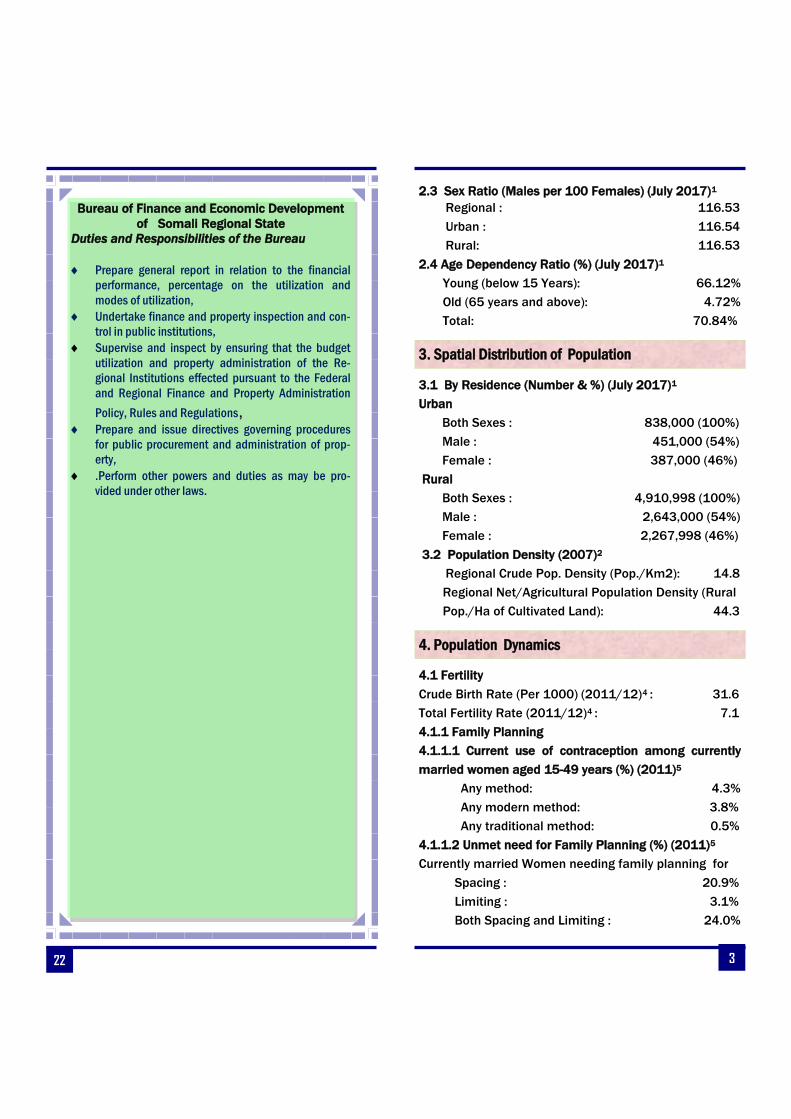
.1.1 Projected Population Size by Sex (Number & %)
(July 2019)1
Total: 6,050,925(100%)
Male: 3,237,312 ( 54%)
Female: 2,813,613 (46%)
1.2. Population Size by Sex (Number & %) (2007)2
Total: 4,445,219 (100%)
Male: 2,472,490 (55.6%)
Female: 1,972,729 (44.4%)
1.3 Average Household Size by Number
1.3.1 Average Household Size by Number (2007)2
Total: 6.5
Urban: 6.0
Rural: 6.5
1.3.2 Average Household Size by Number (2012)3
Total: 6.3
Urban: 6.1
Rural: 6.3
2.1 Population by Major Age Groups (in Million & %)
(2018)1
Children (aged below 15 years): 2.31 (39.1%)
Youth (aged 15-24 years): 1.14 (19.3%)
Adolescent (aged 10-19 years): 1.10 (18.7%)
Working age Population(15-64 years): 3.43 (58.1%)
Elderly Population (60 & above years): 0.26 (4.5%)
Old age Population (65 & above years): 0.16 (2.8%)
Reproductive age women (15-49years): 1.35 (22.9%)
2.2 Projected School Age Population (Number) (2018)1
Elementary School age Population (7-14 years.)
Total: 1,042,416
Male: 541,039
Female: 501,377
Secondary School age Population (15-18 years.)
Total: 431,986
Male: 240,166
Female: 191,820
DEMOGRAPHIC INDICATORS
1.Population Size
2. Population Structure
23
Regional Developmental Information and Popu-
lation Affairs Directorate of Bureau of Finance
and Economic Development of Somali Regional
State
Duties and Responsibilities of the Directorate
Collects all types of data, analyzes & produces many
types of developmental information
Provide developmental and population affairs infor-
mation through the data base system for the prepa-
ration of developmental plan and budget.
Facilitate information flow in an integrated manner
for proper decision making process.
Collect, compile, analyze and interpret demographic
and socio-economic data for GDP, GIS, detail statis-
tical abstracts, grant budget formula, socio-
economic and demographic indicators of the Region
and prepare reports as well as publish and dissemi-
nate the developmental information to customers
and stakeholders both in soft and hard copies.
Facilitate and undertake different research on demo-
graphic and socio-economic development of the
region.
Organize and carry out events on population issues
at regional levels
Identify and set key standard population and devel-
opment indicators of the region
Provide accurate, timely, effective and up-to-date
information to the customers/stakeholders in all
areas of development.
Disseminate developmental and population affairs
information of the region through different medias.
Establish a developmental information center which
customers can easily get development information.
Prepare Population projection of the region
Mobilizing financial and technical support for demo-
graphic and socio-economic activities to be under-
taken in the region
Establishing the regional database with the help of
stakeholders
Manage to produce yearly regional development
indicators and Statistical abstract, Socio-economic
profile and Regional GDP
22
Bureau of Finance and Economic Development
of Somali Regional State
Duties and Responsibilities of the Bureau
Prepare general report in relation to the financial
performance, percentage on the utilization and
modes of utilization,
Undertake finance and property inspection and con-
trol in public institutions,
Supervise and inspect by ensuring that the budget
utilization and property administration of the Re-
gional Institutions effected pursuant to the Federal
and Regional Finance and Property Administration
Policy, Rules and Regulations, Prepare and issue directives governing procedures
for public procurement and administration of prop-
erty,
.Perform other powers and duties as may be pro-
vided under other laws.
3
2.3 Sex Ratio (Males per 100 Females) (July 2017)1
Regional : 116.53
Urban : 116.54
Rural: 116.53
2.4 Age Dependency Ratio (%) (July 2017)1
Young (below 15 Years): 66.12%
Old (65 years and above): 4.72%
Total: 70.84%
3.1 By Residence (Number & %) (July 2017)1
Urban
Both Sexes : 838,000 (100%)
Male : 451,000 (54%)
Female : 387,000 (46%)
Rural
Both Sexes : 4,910,998 (100%)
Male : 2,643,000 (54%)
Female : 2,267,998 (46%)
3.2 Population Density (2007)2
Regional Crude Pop. Density (Pop./Km2): 14.8
Regional Net/Agricultural Population Density (Rural
Pop./Ha of Cultivated Land): 44.3
4.1 Fertility
Crude Birth Rate (Per 1000) (2011/12)4 : 31.6
Total Fertility Rate (2011/12)4 : 7.1
4.1.1 Family Planning
4.1.1.1 Current use of contraception among currently
married women aged 15-49 years (%) (2011)5
Any method: 4.3%
Any modern method: 3.8%
Any traditional method: 0.5%
4.1.1.2 Unmet need for Family Planning (%) (2011)5
Currently married Women needing family planning for
Spacing : 20.9%
Limiting : 3.1%
Both Spacing and Limiting : 24.0%
3. Spatial Distribution of Population
4. Population Dynamics
4
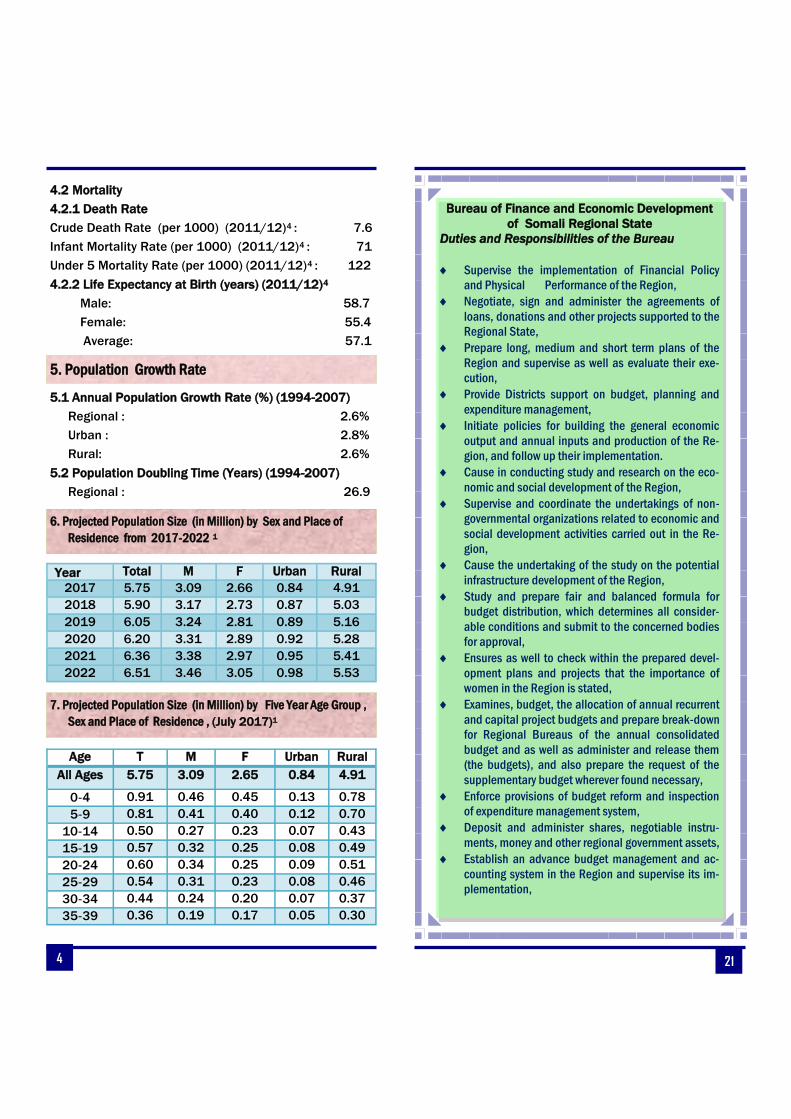
4.2 Mortality
4.2.1 Death Rate
Crude Death Rate (per 1000) (2011/12)4 : 7.6
Infant Mortality Rate (per 1000) (2011/12)4 : 71
Under 5 Mortality Rate (per 1000) (2011/12)4 : 122
4.2.2 Life Expectancy at Birth (years) (2011/12)4
Male: 58.7
Female: 55.4
Average: 57.1
5.1 Annual Population Growth Rate (%) (1994-2007)
Regional : 2.6%
Urban : 2.8%
Rural: 2.6%
5.2 Population Doubling Time (Years) (1994-2007)
Regional : 26.9
5. Population Growth Rate
6. Projected Population Size (in Million) by Sex and Place of
Residence from 2017-2022 1
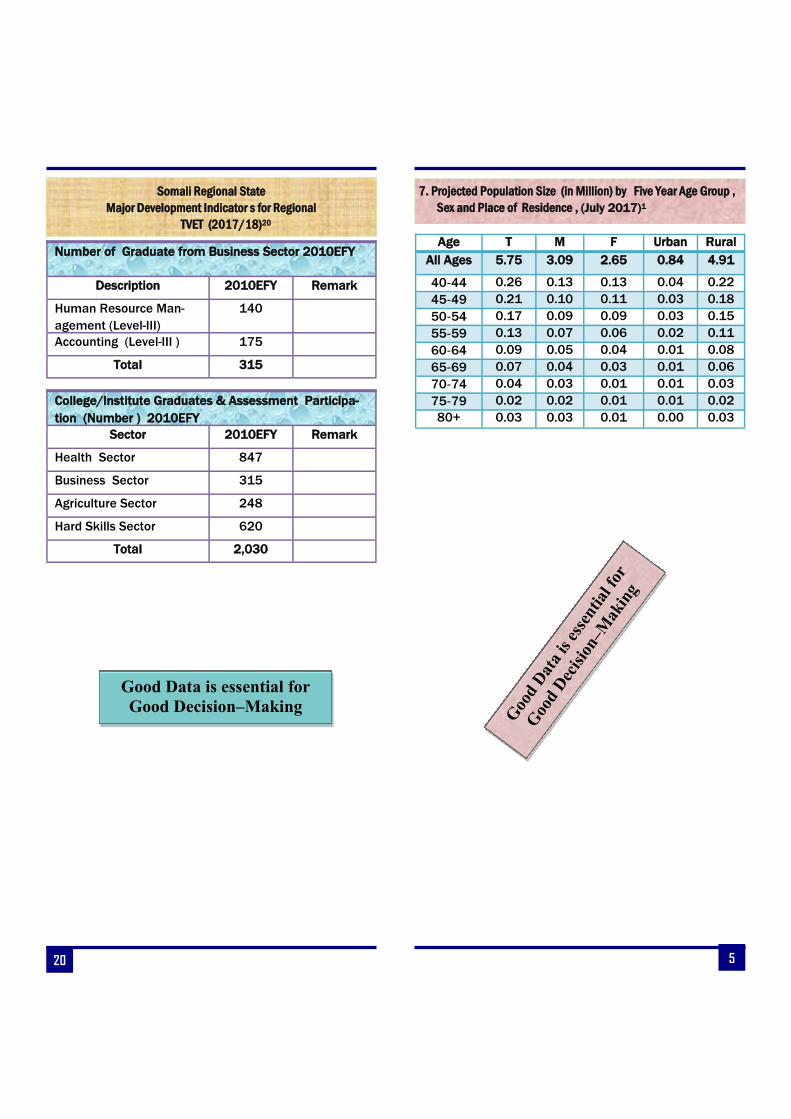
7. Projected Population Size (in Million) by Five Year Age Group ,
Sex and Place of Residence , (July 2017)1
Year Total M F Urban Rural
2017 5.75 3.09 2.66 0.84 4.91
2018 5.90 3.17 2.73 0.87 5.03
2019 6.05 3.24 2.81 0.89 5.16
2020 6.20 3.31 2.89 0.92 5.28
2021 6.36 3.38 2.97 0.95 5.41
2022 6.51 3.46 3.05 0.98 5.53
Age T M F Urban Rural
All Ages 5.75 3.09 2.65 0.84 4.91
0‐4 0.91 0.46 0.45 0.13 0.78
5‐9 0.81 0.41 0.40 0.12 0.70
10‐14 0.50 0.27 0.23 0.07 0.43
15‐19 0.57 0.32 0.25 0.08 0.49
20‐24 0.60 0.34 0.25 0.09 0.51
25‐29 0.54 0.31 0.23 0.08 0.46
30‐34 0.44 0.24 0.20 0.07 0.37
35‐39 0.36 0.19 0.17 0.05 0.30
21
Bureau of Finance and Economic Development
of Somali Regional State
Duties and Responsibilities of the Bureau
Supervise the implementation of Financial Policy
and Physical Performance of the Region,
Negotiate, sign and administer the agreements of
loans, donations and other projects supported to the
Regional State,
Prepare long, medium and short term plans of the
Region and supervise as well as evaluate their exe-
cution,
Provide Districts support on budget, planning and
expenditure management,
Initiate policies for building the general economic
output and annual inputs and production of the Re-
gion, and follow up their implementation.
Cause in conducting study and research on the eco-
nomic and social development of the Region,
Supervise and coordinate the undertakings of non-
governmental organizations related to economic and
social development activities carried out in the Re-
gion,
Cause the undertaking of the study on the potential
infrastructure development of the Region,
Study and prepare fair and balanced formula for
budget distribution, which determines all consider-
able conditions and submit to the concerned bodies
for approval,
Ensures as well to check within the prepared devel-
opment plans and projects that the importance of
women in the Region is stated,
Examines, budget, the allocation of annual recurrent
and capital project budgets and prepare break-down
for Regional Bureaus of the annual consolidated
budget and as well as administer and release them
(the budgets), and also prepare the request of the
supplementary budget wherever found necessary,
Enforce provisions of budget reform and inspection
of expenditure management system,
Deposit and administer shares, negotiable instru-
ments, money and other regional government assets,
Establish an advance budget management and ac-
counting system in the Region and supervise its im-
plementation,
20
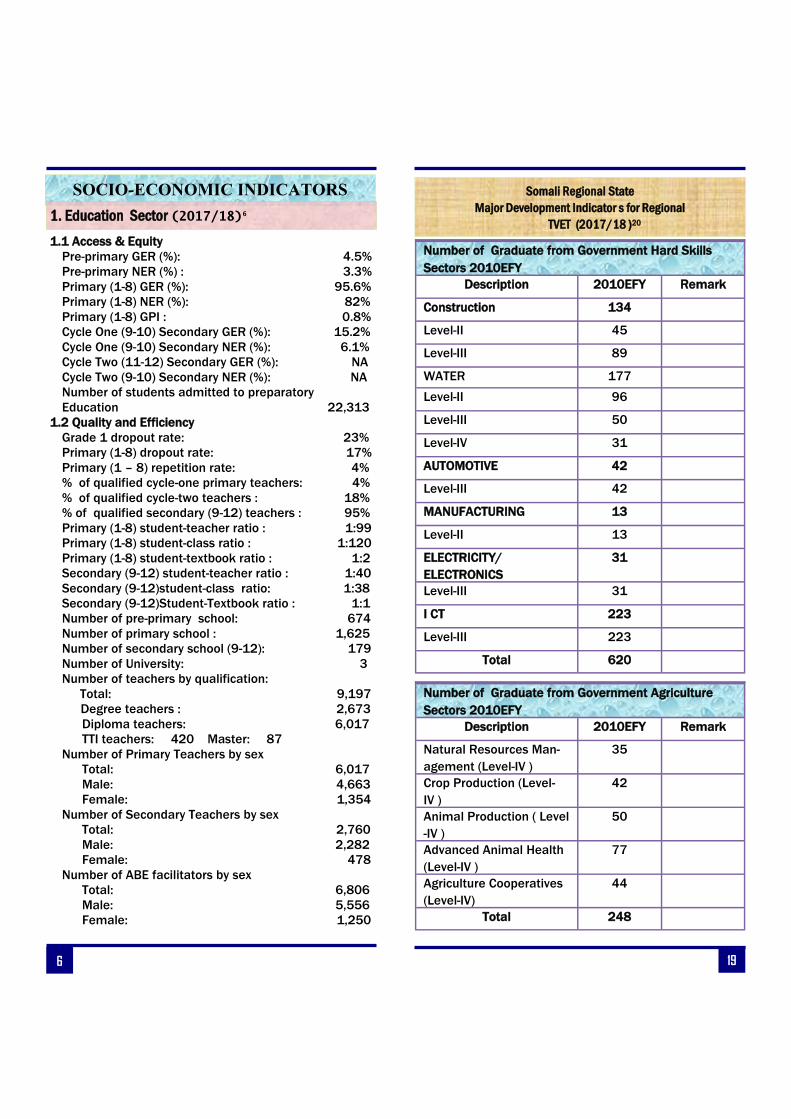
Somali Regional State
Major Development Indicator s for Regional
TVET (2017/18)20
Good Data is essential for
Good Decision–Making
Number of Graduate from Business Sector 2010EFY
Description 2010EFY Remark
Human Resource Man-
agement (Level-III)
140
Accounting (Level-III ) 175
Total 315
College/Institute Graduates & Assessment Participa-
tion (Number ) 2010EFY
Sector 2010EFY Remark
Health Sector 847
Business Sector 315
Agriculture Sector 248
Hard Skills Sector 620
Total 2,030
5
Age T M F Urban Rural
All Ages 5.75 3.09 2.65 0.84 4.91
40‐44 0.26 0.13 0.13 0.04 0.22
45‐49 0.21 0.10 0.11 0.03 0.18
50‐54 0.17 0.09 0.09 0.03 0.15
55‐59 0.13 0.07 0.06 0.02 0.11
60‐64 0.09 0.05 0.04 0.01 0.08
65‐69 0.07 0.04 0.03 0.01 0.06
70‐74 0.04 0.03 0.01 0.01 0.03
75‐79 0.02 0.02 0.01 0.01 0.02
80+ 0.03 0.03 0.01 0.00 0.03
7. Projected Population Size (in Million) by Five Year Age Group ,
Sex and Place of Residence , (July 2017)1
Goo
d D
ata
is e
ssen
tial
for
Goo
d D
ecis
ion–M
akin
g
6
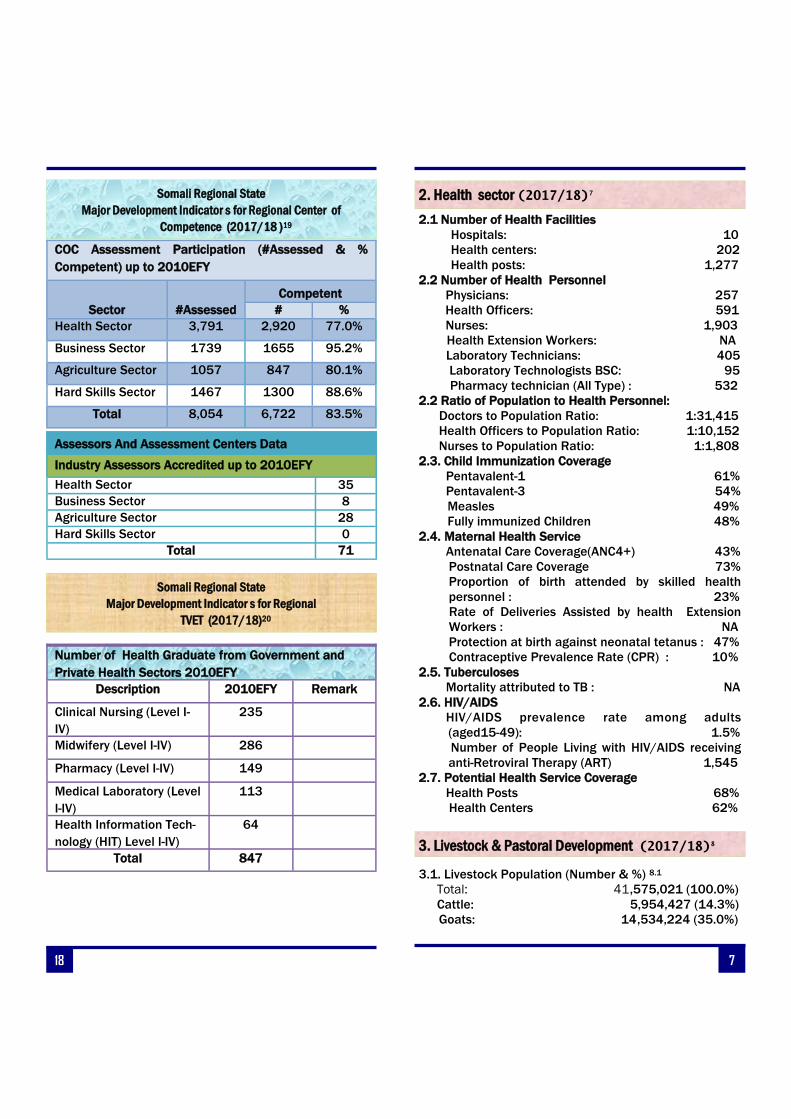
1.1 Access & Equity
Pre-primary GER (%): 4.5%
Pre-primary NER (%) : 3.3%
Primary (1-8) GER (%): 95.6%
Primary (1-8) NER (%): 82%
Primary (1-8) GPI : 0.8%
Cycle One (9-10) Secondary GER (%): 15.2%
Cycle One (9-10) Secondary NER (%): 6.1%
Cycle Two (11-12) Secondary GER (%): NA
Cycle Two (9-10) Secondary NER (%): NA
Number of students admitted to preparatory
Education 22,313
1.2 Quality and Efficiency
Grade 1 dropout rate: 23%
Primary (1-8) dropout rate: 17%
Primary (1 – 8) repetition rate: 4%
% of qualified cycle-one primary teachers: 4%
% of qualified cycle-two teachers : 18%
% of qualified secondary (9-12) teachers : 95%
Primary (1-8) student-teacher ratio : 1:99
Primary (1-8) student-class ratio : 1:120
Primary (1-8) student-textbook ratio : 1:2
Secondary (9-12) student-teacher ratio : 1:40
Secondary (9-12)student-class ratio: 1:38
Secondary (9-12)Student-Textbook ratio : 1:1
Number of pre-primary school: 674
Number of primary school : 1,625
Number of secondary school (9-12): 179
Number of University: 3
Number of teachers by qualification:
Total: 9,197
Degree teachers : 2,673
Diploma teachers: 6,017
TTI teachers: 420 Master: 87
Number of Primary Teachers by sex Total: 6,017 Male: 4,663 Female: 1,354 Number of Secondary Teachers by sex Total: 2,760
Male: 2,282 Female: 478 Number of ABE facilitators by sex
Total: 6,806 Male: 5,556
Female: 1,250
SOCIO-ECONOMIC INDICATORS
1. Education Sector (2017/18)6
19
Somali Regional State
Major Development Indicator s for Regional
TVET (2017/18 )20
Number of Graduate from Government Hard Skills
Sectors 2010EFY
Description 2010EFY Remark
Construction 134
Level-II 45
Level-III 89
WATER 177
Level-II 96
Level-III 50
Level-IV 31
AUTOMOTIVE 42
Level-III 42
MANUFACTURING 13
Level-II 13
ELECTRICITY/
ELECTRONICS
31
Level-III 31
I CT 223
Level-III 223
Total 620
Number of Graduate from Government Agriculture
Sectors 2010EFY
Description 2010EFY Remark
Natural Resources Man-
agement (Level-IV )
35
Crop Production (Level-
IV )
42
Animal Production ( Level
-IV )
50
Advanced Animal Health
(Level-IV )
77
Agriculture Cooperatives
(Level-IV)
44
Total 248
18
Somali Regional State
Major Development Indicator s for Regional Center of
Competence (2017/18 )19
Assessors And Assessment Centers Data
Industry Assessors Accredited up to 2010EFY
Health Sector 35
Business Sector 8
Agriculture Sector 28
Hard Skills Sector 0
Total 71
Somali Regional State
Major Development Indicator s for Regional
TVET (2017/18)20
COC Assessment Participation (#Assessed & %
Competent) up to 2010EFY
Sector
#Assessed
Competent
# %
Health Sector 3,791 2,920 77.0%
Business Sector 1739 1655 95.2%
Agriculture Sector 1057 847 80.1%
Hard Skills Sector 1467 1300 88.6%
Total 8,054 6,722 83.5%
Number of Health Graduate from Government and
Private Health Sectors 2010EFY
Description 2010EFY Remark
Clinical Nursing (Level I-
IV)
235
Midwifery (Level I-IV) 286
Pharmacy (Level I-IV) 149
Medical Laboratory (Level
I-IV)
113
Health Information Tech-
nology (HIT) Level I-IV)
64
Total 847
7
2.1 Number of Health Facilities
Hospitals: 10
Health centers: 202
Health posts: 1,277
2.2 Number of Health Personnel
Physicians: 257 Health Officers: 591
Nurses: 1,903
Health Extension Workers: NA
Laboratory Technicians: 405 Laboratory Technologists BSC: 95 Pharmacy technician (All Type) : 532
2.2 Ratio of Population to Health Personnel:
Doctors to Population Ratio: 1:31,415
Health Officers to Population Ratio: 1:10,152
Nurses to Population Ratio: 1:1,808
2.3. Child Immunization Coverage
Pentavalent-1 61%
Pentavalent-3 54%
Measles 49%
Fully immunized Children 48%
2.4. Maternal Health Service Antenatal Care Coverage(ANC4+) 43%
Postnatal Care Coverage 73% Proportion of birth attended by skilled health
personnel : 23% Rate of Deliveries Assisted by health Extension
Workers : NA Protection at birth against neonatal tetanus : 47% Contraceptive Prevalence Rate (CPR) : 10% 2.5. Tuberculoses
Mortality attributed to TB : NA 2.6. HIV/AIDS
HIV/AIDS prevalence rate among adults
(aged15-49): 1.5%
Number of People Living with HIV/AIDS receiving
anti-Retroviral Therapy (ART) 1,545
2.7. Potential Health Service Coverage Health Posts 68%
Health Centers 62%
3.1. Livestock Population (Number & %) 8.1
Total: 41,575,021 (100.0%) Cattle: 5,954,427 (14.3%) Goats: 14,534,224 (35.0%)
2. Health sector (2017/18)7
3. Livestock & Pastoral Development (2017/18)8
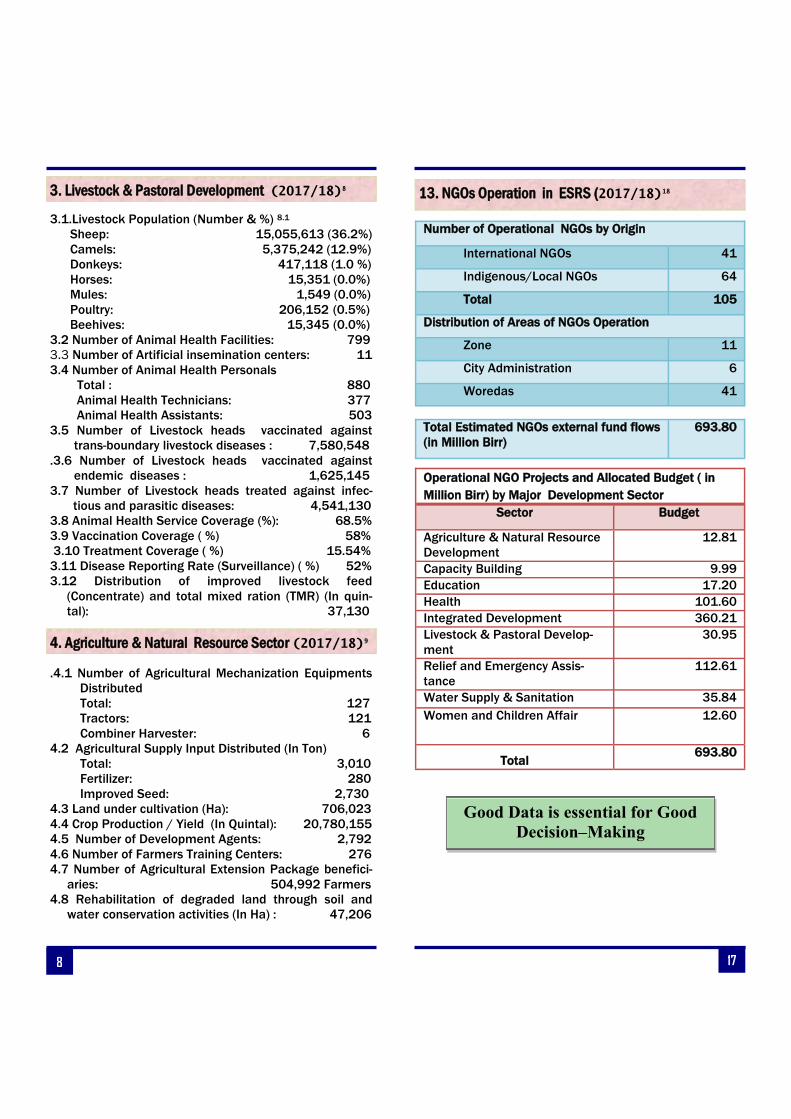
8
3.1.Livestock Population (Number & %) 8.1
Sheep: 15,055,613 (36.2%) Camels: 5,375,242 (12.9%) Donkeys: 417,118 (1.0 %)
Horses: 15,351 (0.0%)
Mules: 1,549 (0.0%)
Poultry: 206,152 (0.5%) Beehives: 15,345 (0.0%)
3.2 Number of Animal Health Facilities: 799
3.3 Number of Artificial insemination centers: 11
3.4 Number of Animal Health Personals Total : 880
Animal Health Technicians: 377 Animal Health Assistants: 503 3.5 Number of Livestock heads vaccinated against
trans-boundary livestock diseases : 7,580,548
.3.6 Number of Livestock heads vaccinated against
endemic diseases : 1,625,145
3.7 Number of Livestock heads treated against infec-
tious and parasitic diseases: 4,541,130
3.8 Animal Health Service Coverage (%): 68.5%
3.9 Vaccination Coverage ( %) 58% 3.10 Treatment Coverage ( %) 15.54% 3.11 Disease Reporting Rate (Surveillance) ( %) 52% 3.12 Distribution of improved livestock feed
(Concentrate) and total mixed ration (TMR) (In quin-
tal): 37,130
.4.1 Number of Agricultural Mechanization Equipments
Distributed
Total: 127
Tractors: 121
Combiner Harvester: 6
4.2 Agricultural Supply Input Distributed (In Ton)
Total: 3,010
Fertilizer: 280
Improved Seed: 2,730
4.3 Land under cultivation (Ha): 706,023
4.4 Crop Production / Yield (In Quintal): 20,780,155
4.5 Number of Development Agents: 2,792
4.6 Number of Farmers Training Centers: 276
4.7 Number of Agricultural Extension Package benefici-
aries: 504,992 Farmers
4.8 Rehabilitation of degraded land through soil and
water conservation activities (In Ha) : 47,206
3. Livestock & Pastoral Development (2017/18)8
4. Agriculture & Natural Resource Sector (2017/18)9
17
13. NGOs Operation in ESRS (2017/18)18
Total Estimated NGOs external fund flows
(in Million Birr)
693.80
Number of Operational NGOs by Origin
International NGOs 41
Indigenous/Local NGOs 64
Total 105
Distribution of Areas of NGOs Operation
Zone 11
City Administration 6
Woredas 41
Good Data is essential for Good
Decision–Making
Operational NGO Projects and Allocated Budget ( in
Million Birr) by Major Development Sector
Sector Budget
Agriculture & Natural Resource
Development
12.81
Capacity Building 9.99
Education 17.20
Health 101.60
Integrated Development 360.21
Livestock & Pastoral Develop-
ment
30.95
Relief and Emergency Assis-
tance
112.61
Water Supply & Sanitation 35.84
Women and Children Affair 12.60
Total 693.80
15
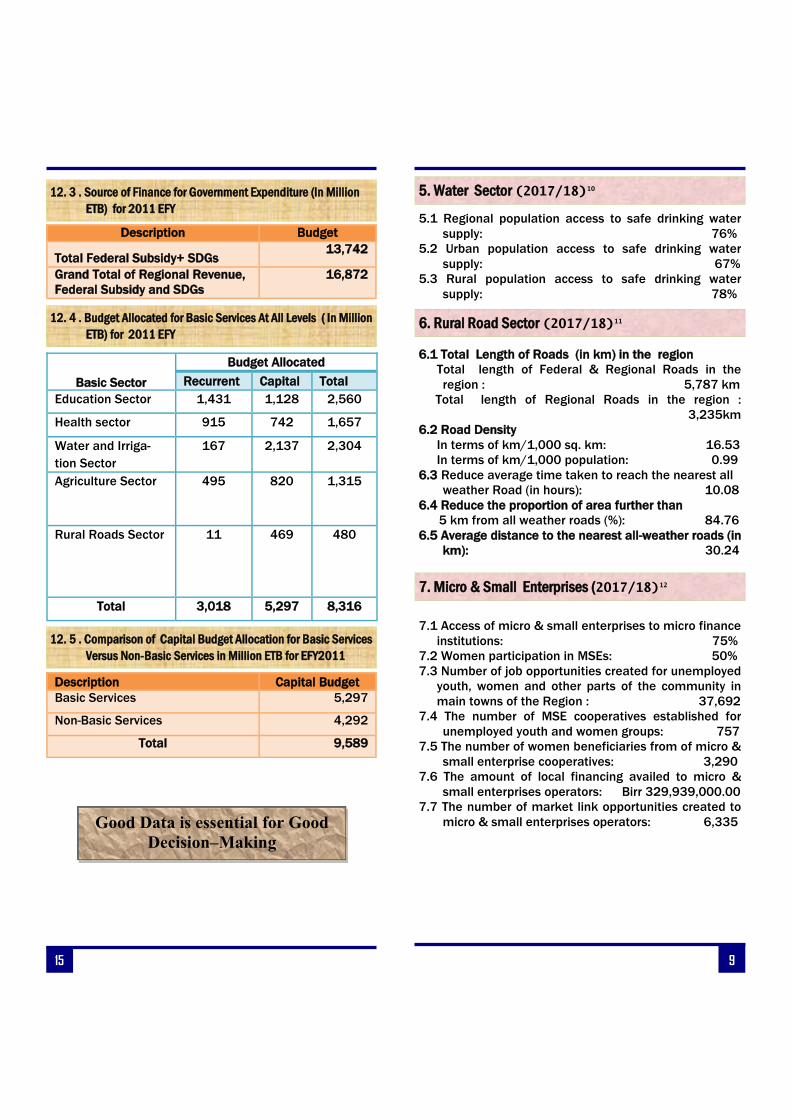
12. 3 . Source of Finance for Government Expenditure (In Million
ETB) for 2011 EFY
Description Budget
Total Federal Subsidy+ SDGs 13,742
Grand Total of Regional Revenue,
Federal Subsidy and SDGs
16,872
12. 4 . Budget Allocated for Basic Services At All Levels ( In Million
ETB) for 2011 EFY
Basic Sector
Budget Allocated
Recurrent Capital Total
Education Sector 1,431 1,128 2,560
Health sector 915 742 1,657
Water and Irriga-
tion Sector
167 2,137 2,304
Agriculture Sector 495 820 1,315
Rural Roads Sector 11 469 480
Total 3,018 5,297 8,316
12. 5 . Comparison of Capital Budget Allocation for Basic Services
Versus Non-Basic Services in Million ETB for EFY2011
Description Capital Budget
Basic Services 5,297
Non-Basic Services 4,292
Total 9,589
Good Data is essential for Good
Decision–Making
9
5.1 Regional population access to safe drinking water
supply: 76%
5.2 Urban population access to safe drinking water
supply: 67%
5.3 Rural population access to safe drinking water
supply: 78%
6.1 Total Length of Roads (in km) in the region
Total length of Federal & Regional Roads in the
region : 5,787 km
Total length of Regional Roads in the region :
3,235km
6.2 Road Density
In terms of km/1,000 sq. km: 16.53
In terms of km/1,000 population: 0.99
6.3 Reduce average time taken to reach the nearest all
weather Road (in hours): 10.08
6.4 Reduce the proportion of area further than
5 km from all weather roads (%): 84.76
6.5 Average distance to the nearest all-weather roads (in
km): 30.24
7.1 Access of micro & small enterprises to micro finance
institutions: 75%
7.2 Women participation in MSEs: 50%
7.3 Number of job opportunities created for unemployed
youth, women and other parts of the community in
main towns of the Region : 37,692
7.4 The number of MSE cooperatives established for
unemployed youth and women groups: 757
7.5 The number of women beneficiaries from of micro &
small enterprise cooperatives: 3,290
7.6 The amount of local financing availed to micro &
small enterprises operators: Birr 329,939,000.00
7.7 The number of market link opportunities created to
micro & small enterprises operators: 6,335
6. Rural Road Sector (2017/18)11
7. Micro & Small Enterprises (2017/18)12
5. Water Sector (2017/18)10

10
8.1. Number of electrified villages, towns and cities in
Somali Region by type s of electrification
Hydroelectric Power: 7
Diesel Power: 1
9.1. Number of villages, Towns and Cities in Ethiopian
Somali Region by type of telecommunication
distribution
Ethio-Telecom Digital switch: 30
Ethio-Telecom MASG’s (Including MASAN): 52
9.2. Ethio-Telecom VAST Services Data by type of ser-
vice :
School Net Broadcasting: 21
School Net Internet (VSAT): 40
Wereda Net (VSAT): -
Wereda Net ADSL: 1
9.3. Number of Kebeles connected for Rural Connec-
tivity WLL Telephone Data: 472
9.4. Number of Mobile BTS in Somali Region : 444
9.5. Number of fixed line telephone subscribers : 8,468
9.6. Number of Internet Service subscribers: 1,540
10.1. Number of Government and Private Financial
institutions in Somali Region:
Banks: 16
Government: 2
Private : 14
Insurances : 3
Government: 1
Private : 2
Micro-Finance Institutions: 1
Government: 1
Private : -
8. Electricity Supply (2017/18)13
9. Telecommunication Service (2017/18)14
10. Financial Institutions (2017/18)15
12. 3 . Source of Finance for Government Expenditure (In Million
ETB) for 2011 EFY
15
12. Regional Budget Allocation (2018/19)17
12. 1 . 20101EFY Budget ( in Million ETB) ) Allocation by Func-
tional Classification
12 2. 2011EFY Budget (In Million ETB) Allocation by Jurisdiction
Description
Budget Allocated Recurrent Capital Total
Regional Sector
Bureau Level
3,510 6,978 10,488
Woreda & City Ad-
ministration Levels
3,773 2,611 6,384
Total 7,283 9,589 16,872
Description
Budget Allocated Recurrent Capital Total
General Develop-
ment Services
3,162 1,482 4,643
Economic Services 738 5,559 6,297
Social Services 2,455 2,205 4,660
City Services 29 342 372
Others 900 0 900
Total 7,283 9,589 16,872
Description Budget
Regional Revenue:
Tax Revenue 2,401
Non Tax Revenue 237
Capital Revenue 66
Municipality Revenue 396
Total Regional Revenue 3,100
Federal Subsidy:
Federal Treasury 13,112
External Assistance 31
Total Federal Subsidy 13,143
Balance brought forward from EFY
2010
30
Sustainable Development Goals
(SDGs)
599
14
11
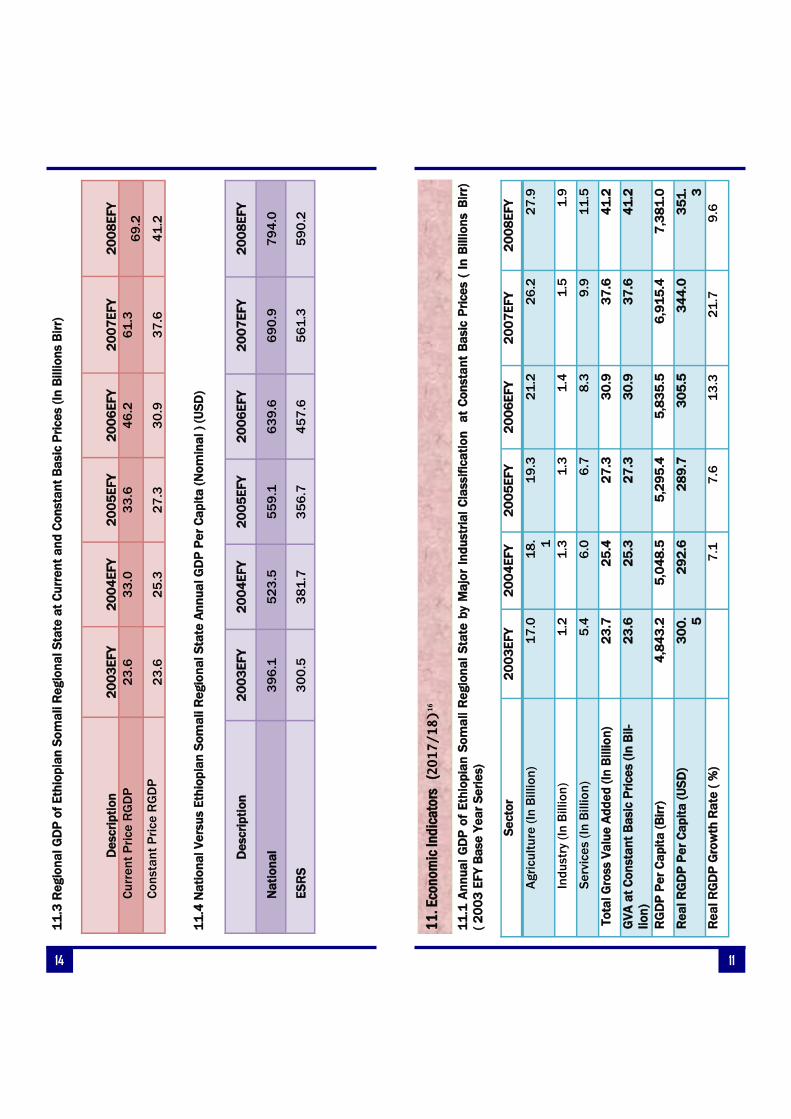
.3 R
eg
ion
al
GD
P o
f E
thio
pia
n S
om
ali R
eg
ion
al
Sta
te a
t C
urr
en
t a
nd
Co
nsta
nt
Ba
sic
Pri
ce
s (
In B
illio
ns B
irr)
11
.4 N
ati
on
al V
ers
us E
thio
pia
n S
om
ali R
eg
ion
al
Sta
te A
nn
ua
l G
DP
Pe
r C
ap
ita
(N
om
ina
l )
(US
D)
De
scri
pti
on
2
00
3E
FY
2
00
4E
FY
2
00
5E
FY
2
00
6E
FY
2
00
7E
FY
2
00
8E
FY
Cu
rre
nt
Pri
ce
RG
DP
2
3.6
3
3.0
3
3.6
4
6.2
6
1.3
6
9.2
Co
nsta
nt
Pri
ce
RG
DP
2
3.6
2
5.3
2
7.3
3
0.9
3
7.6
4
1.2
De
scri
pti
on
2
00
3E
FY
2
00
4E
FY
2
00
5E
FY
2
00
6E
FY
2
00
7E
FY
2
00
8E
FY
Na
tio
na
l 3
96
.1
52
3.5
5
59
.1
63
9.6
6
90
.9
79
4.0
ES
RS
3
00
.5
38
1.7
3
56
.7
45
7.6
5
61
.3
59
0.2
11
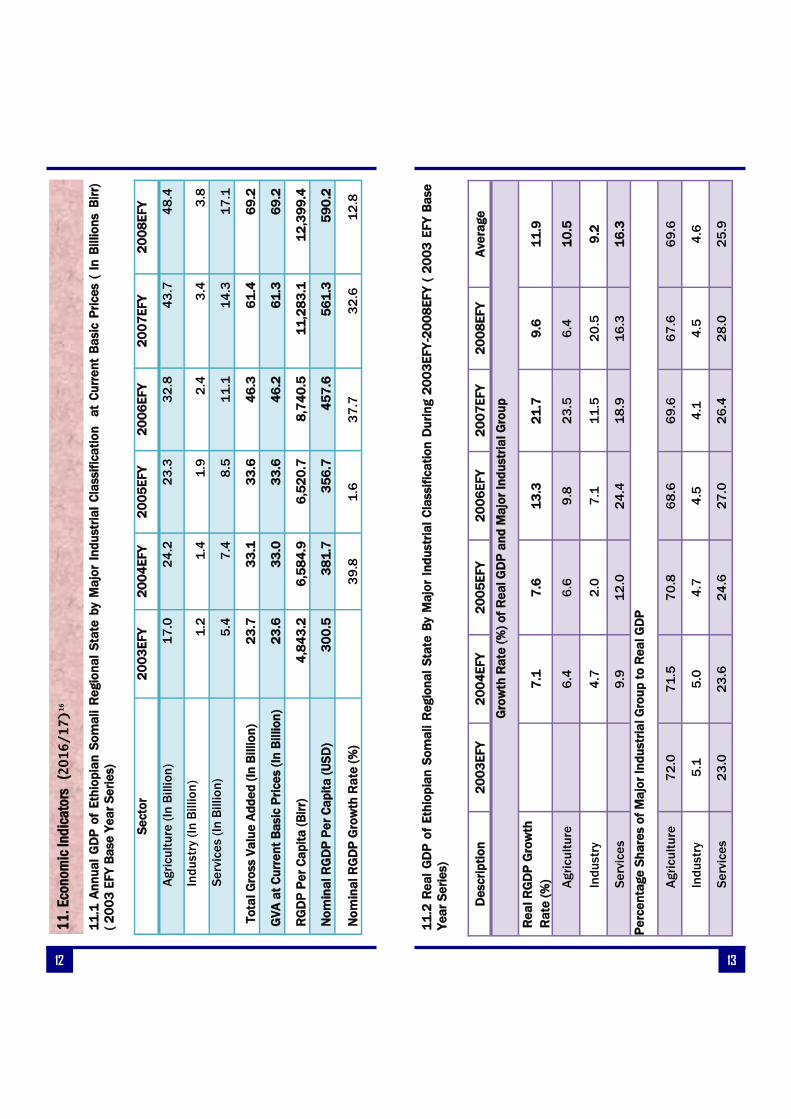
11
. Eco
no
mic
Ind
ica
tors
(2017/18)
16
11
.1 A
nn
ua
l G
DP
of
Eth
iop
ian
So
ma
li R
eg
ion
al
Sta
te b
y M
ajo
r In
du
str
ial
Cla
ssif
ica
tio
n
at
Co
nsta
nt
Ba
sic
Pri
ce
s (
In
Billio
ns
Bir
r)
( 2
00
3 E
FY
Ba
se
Ye
ar
Se
rie
s)
Se
cto
r 2
00
3E
FY
2
00
4E
FY
2
00
5E
FY
2
00
6E
FY
2
00
7E
FY
2
00
8E
FY
Ag
ricu
ltu
re (
In B
illio
n)
17
.0
18
. 1
19
.3
21
.2
26
.2
27
.9
Ind
ustr
y (I
n B
illio
n)
1.2
1
.3
1.3
1
.4
1.5
1
.9
Se
rvic
es (
In B
illio
n)
5.4
6
.0
6.7
8
.3
9.9
1
1.5
To
tal G
ross V
alu
e A
dd
ed
(In
Billio
n)
23
.7
25
.4
27
.3
30
.9
37
.6
41
.2
GV
A a
t C
on
sta
nt
Ba
sic
Pri
ce
s (
In B
il-
lio
n)
23
.6
25
.3
27
.3
30
.9
37
.6
41
.2
RG
DP
Pe
r C
ap
ita
(B
irr)
4
,84
3.2
5
,04
8.5
5
,29
5.4
5
,83
5.5
6
,91
5.4
7
,38
1.0
Re
al R
GD
P P
er
Ca
pit
a (
US
D)
30
0. 5
29
2.6
2
89
.7
30
5.5
3
44
.0
35
1. 3
Re
al R
GD
P G
row
th R
ate
( %
)
7.1
7
.6
13
.3
21
.7
9.6
12
11
. Eco
no
mic
Ind
ica
tors
(2016/17)
16
11
.1 A
nn
ua
l G
DP
of
Eth
iop
ian
So
ma
li R
eg
ion
al
Sta
te b
y M
ajo
r In
du
str
ial
Cla
ssif
ica
tio
n
at
Cu
rre
nt
Ba
sic
Pri
ce
s (
In
Billio
ns B
irr)
( 2
00
3 E
FY
Ba
se
Ye
ar
Se
rie
s)
Se
cto
r 2
00
3E
FY
2
00
4E
FY
2
00
5E
FY
2
00
6E
FY
2
00
7E
FY
2
00
8E
FY
Ag
ricu
ltu
re (
In B
illio
n)
17
.0
24
.2
23
.3
32
.8
43
.7
48
.4
Ind
ustr
y (I
n B
illio
n)
1.2
1
.4
1.9
2
.4
3.4
3
.8
Se
rvic
es (
In B
illio
n)
5.4
7
.4
8.5
1
1.1
1
4.3
1
7.1
To
tal G
ross V
alu
e A
dd
ed
(In
Billio
n)
23
.7
33
.1
33
.6
46
.3
61
.4
69
.2
GV
A a
t C
urr
en
t B
asic
Pri
ce
s (
In B
illio
n)
23
.6
33
.0
33
.6
46
.2
61
.3
69
.2
RG
DP
Pe
r C
ap
ita
(B
irr)
4
,84
3.2
6
,58
4.9
6
,52
0.7
8
,74
0.5
1
1,2
83
.1
12
,39
9.4
No
min
al R
GD
P P
er
Ca
pit
a (
US
D)
30
0.5
3
81
.7
35
6.7
4
57
.6
56
1.3
5
90
.2
No
min
al R
GD
P G
row
th R
ate
(%
)
39
.8
1.6
3
7.7
3
2.6
1
2.8
13
11
.2 R
ea
l G
DP
of
Eth
iop
ian
So
ma
li R
eg
ion
al
Sta
te B
y M
ajo
r In
du
str
ial
Cla
ssif
ica
tio
n D
uri
ng
20
03
EF
Y-2
00
8E
FY
( 2
00
3 E
FY
Ba
se
Ye
ar
Se
rie
s)
De
scri
pti
on
2
00
3E
FY
2
00
4E
FY
2
00
5E
FY
2
00
6E
FY
2
00
7E
FY
2
00
8E
FY
A
vera
ge
Gro
wth
Ra
te (
%)
of
Re
al G
DP
an
d M
ajo
r In
du
str
ial G
rou
p
Re
al R
GD
P G
row
th
Ra
te (
%)
7
.1
7.6
1
3.3
2
1.7
9
.6
11
.9
Ag
ricu
ltu
re
6
.4
6.6
9
.8
23
.5
6.4
1
0.5
Ind
ustr
y
4
.7
2.0
7
.1
11
.5
20
.5
9.2
Se
rvic
es
9
.9
12
.0
24
.4
18
.9
16
.3
16
.3
Pe
rce
nta
ge
Sh
are
s o
f M
ajo
r In
du
str
ial G
rou
p t
o R
ea
l G
DP
Ag
ricu
ltu
re
72
.0
71
.5
70
.8
68
.6
69
.6
67
.6
69
.6
Ind
ustr
y
5.1
5
.0
4.7
4
.5
4.1
4
.5
4.6
Se
rvic
es
23
.0
23
.6
24
.6
27
.0
26
.4
28
.0
25
.9