Democratizing Data Science: The Community Data … · Democratizing Data Science: ... In a...
26
THIS IS AN UNPUBLISHED DRAFT OF A CHAPTER FROM A FORTHCOMING BOOK.WHEN PUBLISHED, THE CITATION FOR THIS CHAPTER WILL BE: Hill, B. M., Dailey, D., Guy, R. T., Lewis, B., Matsuzaki, M., & Morgan, J. T. (2017). Democratizing Data Science: The Community Data Science Workshops and Classes. In N. Jullien, S. A. Matei, & S. P. Goggins (Eds.), Big Data Factories: Scientific Collaborative approaches for virtual community data collec- tion, repurposing, recombining, and dissemination. New York, New York: Springer Nature. BEFORE CITING OR DISTRIBUTING, PLEASE CHECK FOR AN UPDATED VERSION AT: Democratizing Data Science: The Community Data Science Workshops and Classes Benjamin Mako Hill, Dharma Dailey † , Richard T. Guy † , Ben Lewis † , Mika Matsuzaki † , Jonathan T. Morgan † Nearly every published discussion of data science education begins with a reflection on an acute shortage in labor markets of professional data scientists with the skills necessary to extract business value from burgeoning datasets created by online communities like Facebook, Twitter, and LinkedIn. This model of data science—professional data scientists mining online communi- ties for the benefit of their employers—is only one possible vision for the fu- ture of the field. What if everybody learned the basic tools of data science? What if the users of online communities—instead of being ignored completely or relegated to the passive roles of data producers to be shaped and nudged— collected and analyzed data about themselves? What if, instead, they used data to understand themselves and communicate with each other? What if data sci- ence was treated not as a highly specialized set of skills but as a basic literacy in an increasingly data-driven world? In this chapter, we describe three years of work and experimentation around a vision of community data science that attempts to explore one set of answers † Authors contributed equally to this work. 1
Transcript of Democratizing Data Science: The Community Data … · Democratizing Data Science: ... In a...

THIS IS AN UNPUBLISHED DRAFT OF A CHAPTER FROM A FORTHCOMING BOOK. WHENPUBLISHED, THE CITATION FOR THIS CHAPTER WILL BE: Hill, B. M., Dailey, D., Guy,R. T., Lewis, B., Matsuzaki, M., & Morgan, J. T. (2017). Democratizing Data Science: TheCommunity Data Science Workshops and Classes. In N. Jullien, S. A. Matei, & S. P. Goggins(Eds.), Big Data Factories: Scientific Collaborative approaches for virtual community data collec-tion, repurposing, recombining, and dissemination. New York, New York: Springer Nature.BEFORE CITING OR DISTRIBUTING, PLEASE CHECK FOR AN UPDATED VERSION AT:https://mako.cc/academic/hill_etal-cdsw_chapter-DRAFT.pdf
Democratizing Data Science: TheCommunity Data Science Workshops andClasses
Benjamin Mako Hill, Dharma Dailey†, Richard T. Guy†, BenLewis†, Mika Matsuzaki†, Jonathan T. Morgan†
Nearly every published discussion of data science education begins with areflection on an acute shortage in labor markets of professional data scientistswith the skills necessary to extract business value from burgeoning datasetscreated by online communities like Facebook, Twitter, and LinkedIn. Thismodel of data science—professional data scientists mining online communi-ties for the benefit of their employers—is only one possible vision for the fu-ture of the field. What if everybody learned the basic tools of data science?What if the users of online communities—instead of being ignored completelyor relegated to the passive roles of data producers to be shaped and nudged—collected and analyzed data about themselves? What if, instead, they used datato understand themselves and communicate with each other? What if data sci-ence was treated not as a highly specialized set of skills but as a basic literacyin an increasingly data-driven world?
In this chapter, we describe three years of work and experimentation arounda vision of community data science that attempts to explore one set of answers
†Authors contributed equally to this work.
1

2
to these “what if?” questions. This work has primarily involved designing cur-riculum for, and then running, five series of four-day workshops, plus threetraditional university courses taught to masters students. We have used theseworkshops and classes to explore the potential of, and challenges around, thisvision of democratized data science. We begin by framing our goals and ap-proach in terms of similar and analogous efforts. Next, we present our philos-ophy and design goals. With this background, we describe the structure of thecurriculum we have developed. Finally, we use data from several pre-session,within-session, and post-session surveys to discuss some of the promises andlimitations of our approach.
BACKGROUND
Data Science Education
There is little doubt that, driven by surging interest in the power and poten-tial of “big data” for business, data scientists have found themselves in highdemand (Manyika et al., 2011). Harvard Business Review has called “data sci-entist” the “sexiest job in the 21st century” (Davenport & Patil, 2012) andseveral reports have pointed to massive shortages of data scientists in labormarkets. For example, in their widely cited report published by the McKin-sey Global Institute, Manyika et al. (2011) suggested that the United Statesis already facing a massive shortfall of skilled data scientists that will only beaggravated in the coming years. In 2014, Dwoskin (2014) suggested that therewere 36,000 advertised, but unfilled, positions for data scientists in more than6,000 firms.
In response, a whole series of education programs have been created, orrebranded, in what West and Portenoy (2016) have described as a “data sci-ence gold rush in higher education.” Using a dataset of more than 100 degree-granting programs in related spaces collected by North Carolina State Univer-sity’s Institute for Advanced Analytics,1 West and Portenoy point to dozensof new programs created in a matter of years in the United States alone.
Although there is no consensus—either in popular accounts or among datascientists educators—on exactly what such programs should cover (Davenport& Patil, 2012; Miller, 2013; Gellman, 2014), there is some agreement that datascientists should be able to collect and integrate datasets and conduct analysesusing some combination of programming, statistical modeling, and data min-
1http://analytics.ncsu.edu/?page_id=4184 (https://perma.cc/6MKH-7KVY)
Buildstamp/Version: 20171010194100
3
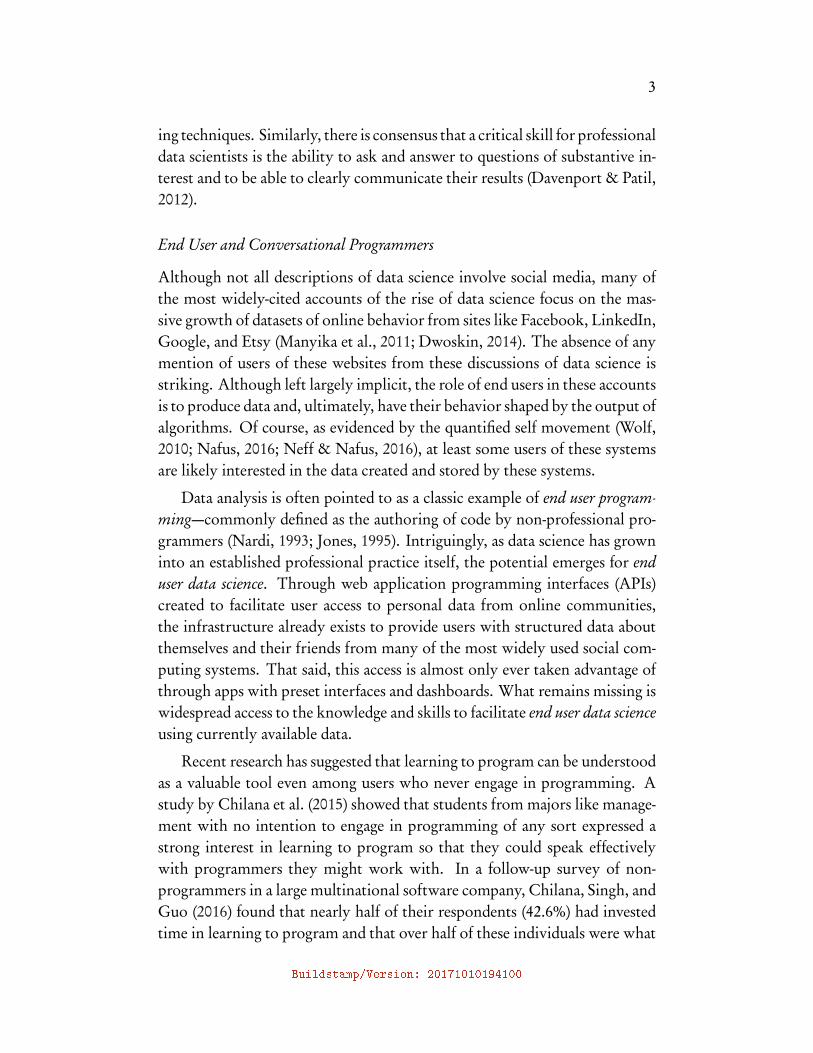
ing techniques. Similarly, there is consensus that a critical skill for professionaldata scientists is the ability to ask and answer to questions of substantive in-terest and to be able to clearly communicate their results (Davenport & Patil,2012).
End User and Conversational Programmers
Although not all descriptions of data science involve social media, many ofthe most widely-cited accounts of the rise of data science focus on the mas-sive growth of datasets of online behavior from sites like Facebook, LinkedIn,Google, and Etsy (Manyika et al., 2011; Dwoskin, 2014). The absence of anymention of users of these websites from these discussions of data science isstriking. Although left largely implicit, the role of end users in these accountsis to produce data and, ultimately, have their behavior shaped by the output ofalgorithms. Of course, as evidenced by the quantified self movement (Wolf,2010; Nafus, 2016; Neff & Nafus, 2016), at least some users of these systemsare likely interested in the data created and stored by these systems.
Data analysis is often pointed to as a classic example of end user program-ming—commonly defined as the authoring of code by non-professional pro-grammers (Nardi, 1993; Jones, 1995). Intriguingly, as data science has growninto an established professional practice itself, the potential emerges for enduser data science. Through web application programming interfaces (APIs)created to facilitate user access to personal data from online communities,the infrastructure already exists to provide users with structured data aboutthemselves and their friends from many of the most widely used social com-puting systems. That said, this access is almost only ever taken advantage ofthrough apps with preset interfaces and dashboards. What remains missing iswidespread access to the knowledge and skills to facilitate end user data scienceusing currently available data.
Recent research has suggested that learning to program can be understoodas a valuable tool even among users who never engage in programming. Astudy by Chilana et al. (2015) showed that students from majors like manage-ment with no intention to engage in programming of any sort expressed astrong interest in learning to program so that they could speak effectivelywith programmers they might work with. In a follow-up survey of non-programmers in a large multinational software company, Chilana, Singh, andGuo (2016) found that nearly half of their respondents (42.6%) had investedtime in learning to program and that over half of these individuals were what
Buildstamp/Version: 20171010194100
4
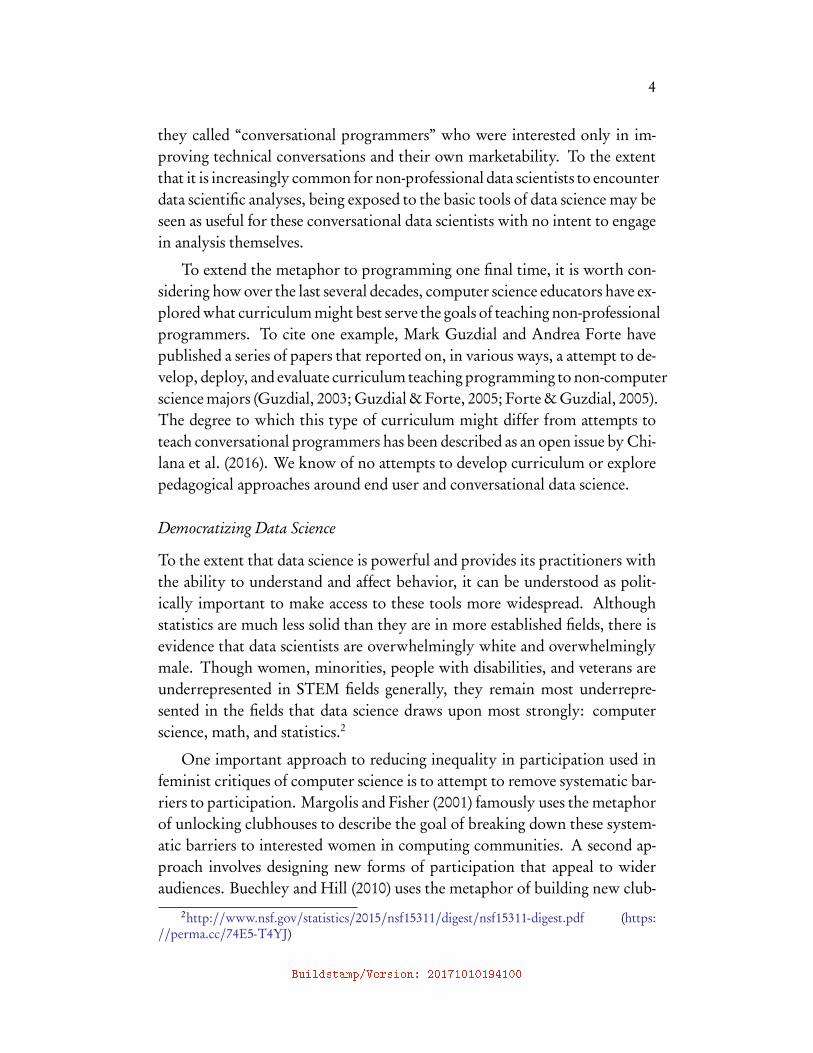
they called “conversational programmers” who were interested only in im-proving technical conversations and their own marketability. To the extentthat it is increasingly common for non-professional data scientists to encounterdata scientific analyses, being exposed to the basic tools of data science may beseen as useful for these conversational data scientists with no intent to engagein analysis themselves.
To extend the metaphor to programming one final time, it is worth con-sidering how over the last several decades, computer science educators have ex-plored what curriculum might best serve the goals of teaching non-professionalprogrammers. To cite one example, Mark Guzdial and Andrea Forte havepublished a series of papers that reported on, in various ways, a attempt to de-velop, deploy, and evaluate curriculum teaching programming to non-computerscience majors (Guzdial, 2003; Guzdial & Forte, 2005; Forte & Guzdial, 2005).The degree to which this type of curriculum might differ from attempts toteach conversational programmers has been described as an open issue by Chi-lana et al. (2016). We know of no attempts to develop curriculum or explorepedagogical approaches around end user and conversational data science.
Democratizing Data Science
To the extent that data science is powerful and provides its practitioners withthe ability to understand and affect behavior, it can be understood as polit-ically important to make access to these tools more widespread. Althoughstatistics are much less solid than they are in more established fields, there isevidence that data scientists are overwhelmingly white and overwhelminglymale. Though women, minorities, people with disabilities, and veterans areunderrepresented in STEM fields generally, they remain most underrepre-sented in the fields that data science draws upon most strongly: computerscience, math, and statistics.2
One important approach to reducing inequality in participation used infeminist critiques of computer science is to attempt to remove systematic bar-riers to participation. Margolis and Fisher (2001) famously uses the metaphorof unlocking clubhouses to describe the goal of breaking down these system-atic barriers to interested women in computing communities. A second ap-proach involves designing new forms of participation that appeal to wideraudiences. Buechley and Hill (2010) uses the metaphor of building new club-
2http://www.nsf.gov/statistics/2015/nsf15311/digest/nsf15311-digest.pdf (https://perma.cc/74E5-T4YJ)
Buildstamp/Version: 20171010194100
5
houses to evoke the idea that computing can be reimagined to appeal to womenuninterested by computing as it is typically framed. Buechley and Hill arguethat this approach can broaden participation in computing. Although thereare almost certainly many systematic barriers to participation in data sciencethat affect members of underrepresented groups, imagining data science aspracticed by the large majority of people uninterested in careers as profes-sional data scientists is the first step on the path of “democratizing” data sci-ence in the ways suggested by Buechley and Hill (2010).
There have been a series of efforts to involve users of online communitiesin data science. The most famous and common techniques are citizen scienceprojects. The citizen science model, made famous by Galaxy Zoo (Raddicket al., 2007), Zooniverse (Smith, Lynn, & Lintott, 2013; Simpson, Page, & DeRoure, 2014), and eBird (Sullivan et al., 2009; Wood, Sullivan, Iliff, Fink, &Kelling, 2011) is similar to “crowdsourcing” where participants role is activeand intentional but also limited to a handful of typically low-level and repet-itive tasks. In citizen science, participants act as sources of distributed laborand human computation (Howe, 2006). Like crowdsourcing, task executionis distributed but the tasks of posing questions and performing analyses re-mains the exclusive domain of the platform operators and the “real” scientists(Benkler, 2016).
A smaller body of work has explored the potential of involving onlinecommunities in participatory data analysis where both task selection and exe-cution is distributed. There are a number of attempts to support data analysisthrough participatory and social data visualization on the web (e.g., Heer,Viégas, & Wattenberg, 2007; Viegas, Wattenberg, van Ham, Kriss, & McK-eon, 2007; Wattenberg & Kriss, 2006; Luther, Counts, Stecher, Hoff, & Johns,2009). Although powerful, these systems are often restricted to particulardatasets provided by researchers or to a set of pre-defined types of visual-izations or analyses. For example, users of these systems are often unableto create new variables in ways that are a basic part of most data scientists’work. Another interesting approach occurred on the Reddit online commu-nity through an experimental research process used by Matias (2016). In hisstudy of a large social mobilization in Reddit, Matias discussed initial resultsand worked with participants to refine models and hypotheses. Althoughusers were deeply involved in the process of hypothesis construction, theystill relied on an academic researcher with access to programming and statisti-cal knowledge and skills to carry out tests. Both social visualization systems
Buildstamp/Version: 20171010194100
6
and Matias’s work are limited by their desire to involve users without alsoasking them to learn new technical skills.
Perhaps the most clear attempt to democratize data science in the way wehave articulated is a system by Sayamindu Dasgupta (Dasgupta, 2016; Das-gupta & Hill, 2016, 2017). Deployed in the Scratch programming commu-nity (Resnick et al., 2009), Dasgupta’s system provides programmatic accessto data about activity in the Scratch community to each member. Dasguptadocumented the way that Scratch’s young users used the system to enthusias-tically analyze their own data in ways that were powerful, unanticipated, andempowering. Dasgupta’s system is limited both in the analytic tools it makesavailable and in the depth and scope of data provided. That said, the levelof enthusiasm shown by users of the system, and the creativity these usersdisplayed, is deeply inspiring.
Like Dasgupta, our goal is to move one step beyond both citizen scienceand participatory hypothesis testing to give users of online communities theability to ask and answer their own questions (end user data science) and tobuild the skills the engage with other analysts and analyses (conversationaldata science).
Toward that end, we designed a series of workshops and courses. In de-signing, teaching, and evaluating this curriculum, we were motivated by threebroad questions. First, what are the essential skills for end user and conversa-tional data scientists? Second, what would a curriculum teaching these skillsinvolve? Finally, how would one evaluate attempts to democratize data sci-ence? We describe the work we have done in our workshops to explore po-tential answers to these questions over the rest of this essay.
PHILOSOPHY AND PEDAGOGY
The philosophy informing our pedagogical approach is primarily influencedby Margolis and Fisher’s (2001) seminal work on breaking down barriers tothe participation of women in computing, Lave and Wenger’s (1991) theory oflegitimate peripheral participation, and Papert’s (1980) concept of construc-tionism. From Margolis and Fisher, we draw a commitment to broadeningparticipation in data science. From Lave and Wenger, we draw a commitmentto the idea of authentic learning environments and the ability to learn throughapprenticeship-like relationships. From Papert, we draw the idea that knowl-edge can be constructed through the creation and manipulation of knowledge
Buildstamp/Version: 20171010194100

7
in a social environment.
Broadening participation
The first pillar of our community data science approach is the goal of broaden-ing participation. We seek to broaden participation along several dimensionsincluding not only the kinds of academic fields or professional backgrounds ofparticipants but also demographic characteristics including gender and race.Many other approaches to teaching data science require existing programmingor statistical experience. For example, the Software Carpentry and Data Car-pentry workshops seek to attract participants with undergraduate-level pro-gramming experience (Wilson, 2014). We target absolute beginners. Indeed,one central criteria for making acceptance decisions for our workshops andclasses is that applicants have no previous programming experience. This hasan additional benefit of ensuring that participants begin with a similar skill-level.
Meaningful participation in STEM requires successful negotiation of cul-tural, social, and symbolic elements of STEM fields (Joshi, Kvasny, Unnikr-ishnan, & Trauth, 2016). Therefore we strive to create an inclusive environ-ment that considers several factors known to influence inclusiveness in STEM.For example, signifiers of masculine tech culture such as Star Trek posters havebeen shown to inhibit participation by women. Conversely, more neutral“ambient” signifiers such as nature posters do not inhibit anyone’s participa-tion (Cheryan, Plaut, Davies, & Steele, 2009). Toward this end, we have in-tentionally hosted all of our workshops and classes outside of the engineeringbuildings at the University of Washington campus. We have made attemptsto recruit and encourage women and people of color to act as mentors, leadsessions, and give lectures. Inclusiveness is also influenced by the kinds ofexamples one uses and our curriculum emphasizes working with data aboutpeople.
Finally, we have sought to offer our workshops at times, and at a cost,that makes participation by diverse groups of people possible. For example,we have scheduled our workshops on evenings and on Saturdays to make itpossible for participants with full-time jobs to attend. So far, we have beenable to offer all of our workshops at no cost to participants. Similarly, wehave built our curriculum entirely around tools, APIs, and datasets that canbe installed and used for free.
Buildstamp/Version: 20171010194100

8
Project-based construction
A second pillar of our approach is a strong emphasis on project-based con-struction and authenticity. Although we do not entirely eschew more tradi-tional lecture-based pedagogy, the bulk of our workshops and classes involveparticipants programming on their own computers. Even during lectures,all participants are encouraged to program using their own computers by re-peating the programming constructs being demonstrated by instructors andmodifying them in ways that interest them.
The decision to have individuals program on their own computers re-flects a strong commitment to creating authentic experiences (Lave & Wenger,1991). We strongly believe that participants in our workshops and classesshould program using the tools that we use in our own work as end userand conversational data scientists. When we teach individuals to use APIs,we have them create API keys and engage directly with real APIs. Althoughthis leads to challenges and unpredictability around setup related to hetero-geneity of participants’ devices, it also turns data science into something thathappens directly on each participant’s computer. When the workshops end,participants leave with all the software necessary to continue engaging in datascience.
We ensure that less than half of any session is dedicated to more traditionallecture-based teaching. Instead, participants spend the majority of their timein the sessions writing software and analyzing data. We encourage partic-ipants to program and analyze data the way we do—by modifying existingcode and by searching sites like StackOverflow for error messages, recipes,and solutions to problems. This approach encourages people to wrestle withmany of the real issues brought up by data analysis in ways that make criticalengagement a central part of the process (Ratto, 2011). For example, when weteach about APIs, participants deal with questions about the degree to whichAPIs are owned or controlled by companies.
Learning Communities
A final pillar of our approach is the idea that learning happens through collab-orative construction of knowledge in convivial social environments. In waysthat are inspired by both Lave and Wenger’s (1991) apprenticeships and Pa-pert’s (1980) samba schools, we attempt to maximize one-on-one interactionsbetween beginners and more skilled data scientists. Concretely, this involves
Buildstamp/Version: 20171010194100
9
recruiting a large number of skilled data scientists to serve as “mentors.” Wetry to keep to a four-to-one student-to-mentor ratio. Over the course of run-ning the workshop series five times, we’ve observed that the mentors who aremost reliably effective at helping learners solve their problems often comefrom non-traditional engineering backgrounds. Most encouragingly, we havefound that many of the most effective mentors were originally introduced todata science through previous iterations of the workshops and classes.
Excellent mentors embody a warm environment by helping participantssolve the problems they are facing in ways they will be able to replicate andbuild upon when they are working on their own rather than trying to teach“their way” or the “right way” to do something. A low student to mentorratio enables opportunities for extensive one-on-one coaching. This is espe-cially helpful for beginners since their ability to troubleshoot a problem canbe brittle and because troubleshooting can be stressful and frustrating (Estrada& Atwood, 2012).
A sense of belonging is another factor that has been demonstrated to influ-ence the inclusiveness of STEM participation (e.g., Good, Rattan, & Dweck,2012). Providing lunch—the workshops biggest expense by far—is a time-honored way to foster informal interactions and an important component ofhow we help to foster social support for participants. During lunch, partici-pants often debrief with each other over the morning workshop while gettingto know each other and mentors. For these reasons, we also encourage andsupport meet-ups and learning sessions outside of the formal workshops andclasses.
COMMUNITY DATA SCIENCE WORKSHOPS
In early 2014, we designed a set of four-day workshops in Seattle, Washingtonthat aimed to answer the three questions we raised in our background sectionwhile attempting to adhere to the philosophy and pedagogy laid out above.For the initial set of workshops, we drew both inspiration and some initialcurriculum from the Boston Python Workshops (BPW)3 and Software Car-pentry4—two curricula with which we had experience. In particular, we lever-aged BPW’s detailed Python setup instructions and introductory Python pro-gramming curriculum. Additionally, the way we structure our daily schedule
3http://bostonpythonworkshop.com/ (https://perma.cc/5Y36-R9FM)4See Wilson (2014) and http://software-carpentry.org/ (https://perma.cc/23SE-BPHA)
Buildstamp/Version: 20171010194100

10
and our project-based afternoon sessions were drawn directly from BPW. Al-though several of us teach at the University of Washington, we sought to ar-range these workshops as volunteers outside of a formal classroom setting.
The initial workshops were an enormous success with 115 applicants ofwhom we were able to admit 52. In response to this demand, we ran theworkshops again in late 2014, twice again in 2015, and once in early 2016.Additional workshops are planned in Seattle, twice a year, going forward. Aswe have been able to recruit more mentors, each workshop has been largerthan the previous iteration. Our most recent workshop in early 2016 wasattended by 97 participants.
Each time we have run them, the workshops were organized over one Fri-day evening and three Saturdays. A Friday session before the initial Saturdaysession ensured all participants (and their computers) were prepared for thefollowing morning. The four sessions were numbered from 0 to 3 in referenceto about zero-indexing in the Python programming language. We collectedfeedback from participants after each day and debriefed instructors after eachsession and again after each series of workshops has concluded. Based on thisprocess, we iterated on the curriculum and design of the workshops each timewe ran them.
Each Saturday session begins with a two-hour interactive lecture in themorning that builds upon the topics presented in previous sessions. Lecturesintroduce new concepts and show real examples of carrying out tasks through“live coding.” A picture of a lecture is shown in the bottom right panel ofFigure 1. We encourage participants to participate in the lecture by activelyprogramming on their own computers. The concepts discussed in each lec-ture introduce participants to a handful of tools and concepts that are thenexplored in the afternoon challenges. Each afternoon session is organizedaround open-ended questions designed to foster structured exploration of themorning’s concepts to help participants synthesize and use their new skills.
Afternoon sessions involve independent project work. Participants aregiven an archive of several simple programs written using only concepts thatparticipants were introduced to in the lectures. After a short exposition andexplanation of the sample programs by a session leader, participants are en-couraged to modify, build-upon, or be inspired by, these programs to solveproblems of their choosing. Participants work on projects individually, or ingroups, with help from more experienced mentors present. This independentproject work continues over 3-4 hours. We have experimented with many dif-
Buildstamp/Version: 20171010194100

11
Figure 1: Four photographs from the Community Data Science Workshops held inApril and May 2016. The top two panels show mentors working one-on-one withparticipants. The bottom left panel shows a break-out afternoon workshop withparticipants working independently on projects. The bottom right panel shows par-ticipants during a morning lecture with mentors standing to the side and ready tohelp participants when they require assistance.
ferent projects. In general, we have offered participants two or three choicesduring each afternoon so that participants can choose projects that align withtheir interests. All but the bottom right panel in Figure 1 show these project-based sessions. The top two panels both show mentors working one-on-onewith participants. All of our curriculum—including sample projects, code,and recordings of lectures, are made available on our website.5
Day 0: Setup
In the first Friday session, participants walk through a checklist for installingPython and installing a programmer’s text editor. Next, they work througha brief tutorial on the basics of using the command line. After the partici-pants have completed these setup tasks, they are encouraged to work throughsome simple Python programming exercises. This makes the next morn-
5http://wiki.communitydata.cc/CDSW (https://perma.cc/G36T-KLG8)
Buildstamp/Version: 20171010194100
12
ing lecture easier by pre-introducing material covered in the Saturday lec-ture. The evening session is completely self-guided and allows participantsto warm up to the concepts presented at their own pace. Mentors are onhand to provide technical assistance, help participants through difficult pro-gramming concepts, and verify that each student has completed sessions goalsbefore they leave.
Day 1: Introduction to Programming
The first Saturday session starts with a reinforcement of how to work in thecommand line, and then introduces variables, Python’s built-in data types in-cluding integers, floating point numbers, strings, lists, and dictionaries. Asa result, after only one lecture, participants are familiar with all of Python’sfirst-order data structures and all of the data types used in the rest of the work-shops. Finally, we introduce conditional logic and loops. As in all of ourlectures, we do not use slides. Instead, we demonstrate and discuss conceptswhile programming example code in an interactive Python interpreter usingan iterative trial-and-error method. For example, we demonstrate strings byconstructing messages from strings and demonstrate dictionaries by mappingnames to ages (“{Mako: 33, Ben: 24}”). Throughout the lecture, mentorsare distributed throughout the room to be able to answer participants’ ques-tions about issues they’re having in their code.
The first afternoon project session aims to support participants in engag-ing in simple data analysis using Python. For example, one session we have de-signed begins by downloading an archive that includes both code and a datasetdrawn from the United States Social Security Administration on the popu-larity of different baby names among U.S. children. Projects like this allowparticipants to start analyzing real-world data to ask and answer questions oftheir own design almost immediately. For example, participants often beginby answering a question like, “How many times does your name show up inthe dataset?” and proceed to more complicated questions (e.g., “Which namesare strict subsets of other names?”). These data reveals common challenges indata analysis immediately. For example, the exclusion of names given to fewerthan five people of one gender leads directly to insights about missing data,while the binary nature of gender in the dataset leads to insights about howdata collection decisions can support or suppress specific conclusions.
Buildstamp/Version: 20171010194100

13
Day 2: Web APIs
For the second session, we step back from Python to spend time working withweb APIs—web services that allow a program to acquire data from onlinecommunities and social media sources. One API we rely upon in the lectureis the PlaceKitten API, which takes a request for an image of a specified size,then returns an image of a kitten of that size. Participants are first shownhow to make API requests through a web browser. We then show them howto make the same requests in Python.
Next, we demonstrate how to parse more complex API responses. Wehave often relied on data drawn from Wikipedia about articles related to HarryPotter as an example because there is a very large amount of data and it exhibitsinteresting patterns (e.g., bursts of edits around the release of each film andbook). Afternoon sessions on the second full day involve working throughand modifying simple programs that pull data from Twitter’s API to build atweet gathering tool for use in the third session; from the Yelp API to findout about local restaurants; and from the Wikipedia API to answer questionsabout editing activity and article metadata.
Day 3: Data cleanup and analysis
The final session acts as a capstone highlighting the process of sourcing, clean-ing, and using a dataset to ask and answer a question. In the morning lecture,we walk through a program that collects a dataset about every contribution toarticles in Wikipedia related to Harry Potter using the Wikipedia API. Usingthese data, we generate a series of time series plots to answer several questionsrelated to the way that Wikipedia editing on Harry Potter topics has changedover time.
The afternoon projects for this session focus on the process of data analy-sis and visualization. For example, we have used a pre-collected set of tweetsabout Earthquakes (collected using code that was crafted, in part, by partici-pants during an afternoon session on the second day) to generate time seriesin different resolutions and identify earthquakes around the world as they ap-pear in the dataset. Other sessions have focused on gathering geocoded socialmedia data and visualizing these data on a map. By showing participants dif-ferent ways of interacting with datasets that they have gathered, we are able tocontextualize the act of analyzing data and to provide examples of the processof analyzing social media data from start to finish.
Buildstamp/Version: 20171010194100
14
COMMUNITY DATA SCIENCE CLASSES
In response to requests from our university, three of us have developed andtaught quarter-length, for-credit, masters level courses based on the Commu-nity Data Science Workshops. The classes were taught at two different de-partments at the University of Washington: three times in the Departmentof Communication in our Communication Leadership program, and once inthe Department of Human Centered Design and Engineering. The courses di-rectly incorporate most of the workshop curriculum described above. Unlikemost other data science curricula, these classes’ central focus is an extended,self-directed project which forms most of each student’s grade. Curriculumfor these classes are made fully available on our website.6 Course were taughtto groups of 20 and 30 students with one instructor and one TA.
Teaching this material over 10 weeks, instead of four days, provided uswith more opportunities to iterate on our lesson plans. The practice of send-ing out anonymous feedback surveys after each class session, carried over fromthe workshops, helped us adjust the pace and teaching style between sessions.However, other than the addition of more examples of APIs (essentially, theability to teach more than one of the afternoon session from Day 2), we foundthat the additional time did not allow us to increase the scope of material pre-sented. We were challenged to address all core programming concepts thor-oughly within the first few weeks of the course so that students felt confidentdeploying those concepts in their own work while leaving them sufficienttime to select a dataset, to frame a research question, and to gather, analyze,and report their findings. The nature of the course work changed dramat-ically at roughly the halfway point: the first half of the quarter provided acrash-course in data science programming; the second half focused on sup-porting students as they applied those lessons to specific datasets and researchproblems. Students with no previous programming experience needed to ab-sorb a great deal of new knowledge within the first few weeks in order tosuccessfully complete their class project.
The introduction of grades substantially raised the stakes of mastering thematerial and it risked conflict with our “low stakes” approach in the work-shops. Homework assignments were graded on effort, not code quality. Eachcourse culminated in a final project where success depended more on gather-ing and synthesizing data to tell a story than on the quality of the code written
6e.g., https://wiki.communitydata.cc/Community_Data_Science_Course_(Spring_2015) (https://perma.cc/T3S9-ZZRN)
Buildstamp/Version: 20171010194100

15
along the way. As an example, a student would receive full credit for an in-efficient program or a program with a few missing edge cases but would losecredit for failing to identify a potential source of error like incomplete data.In one rendition of the class, data visualization was worth 25% of the projectgrade. Points were awarded if a plot represented the data correctly by usingsensible color schemes and axes, not based on the students’ choice or masteryof plotting technology (Excel was most commonly used).
Instructors teaching the courses did not always experience the same chal-lenges. One course instructor felt that the move to a traditional classroomsetting, which meant dramatically increasing the ratio of students to avail-able mentors, reduced opportunities for ad hoc, one-on-one support. He at-tempted to compensate for this by building opportunities for peer supportinto the class and by grouping students with little or no previous program-ming experience with others who had some familiarity with programmingin other contexts and languages. Another instructor found the shift to morehours in class meant he could spend more time on average with each student.
There was consensus that while it was not possible to cover substantiallymore material in ten weeks than in three weekends, it was possible to coverit more thoroughly. The higher student to mentor ratio made it more diffi-cult to support struggling students, but the addition of assignments, feedbacksurveys, a more drawn out schedule, and self-directed projects helped assurethat students had the opportunity to master the material. Students were alsoexposed to some new challenges, chiefly the challenge of finding data relevantto their subject of interest.
OUTCOMES
As we have developed the workshops and classes, we have devoted time toa discussion of our own goals. Although the organizers share a goal of “de-mocratizing data science,” this is an amorphous goal understood differentlyeven within the team that developed the curricula. Through discussion, weestablished that there were several dimensions on which we feel our effortsshould be evaluated. First, we believe that our approach should be evaluatedin terms of its ability to support skill development among participants. In thisfirst sense, we consider our approach effective only if participants are buildingskills associated with end user or conversational data science.
Second, given our goals of democratization, we believe that it is impor-
Buildstamp/Version: 20171010194100
16
tant that the curriculum be a successful form of outreach in that it shouldattract large numbers of individuals, especially from groups that are under-represented in more traditional data science communities. Third and finally,we believe a success criteria for our approach is its ability to support empower-ment. In this final sense, we believe that it is not enough that learners simplyhave skills, but that they feel able to build on these skills in ways that shiftpower.
Skill Development
The informal nature of our workshops makes it difficult to systematically as-certain the degree to which participants have learned skills. Some evidence ofskill development comes from the opt-in surveys we have run after our ses-sions. In one typical response to an open ended question about outcomes,a participant explained that the sessions helped build skills around program-ming and data analysis:
It helped me become more comfortable with reading and writingcode and taught me how to think more about how to use socialmedia data to answer questions that are not necessarily academic.It also made me more confident to take the lead as the personresponsible for writing code in a class project.
Although it is certainly the case that not every participant felt comfortablewriting code at the end of the four sessions, many explained that they feltmore comfortable in a role of end user or conversational data scientists. Forexample, one explained that:
Before the workshop I had no idea what Python can do, what APIis for, or what data visualization is. The workshop basically wasmy entry point to the world of data analysis.
Another participant’s feedback is an example of someone who became a moreeffective and confident conversational data scientist through their experiencein the workshops:
In my work as a librarian where I help clients navigate varioussources of information, I feel more comfortable talking abouthow they can use programming to find or analyze the data theyhave access to.
In the classes where students each worked on projects over several weeks,
Buildstamp/Version: 20171010194100

17
Early 2014 Late 2014 Early 2015 Late 2015 Early 2016
Applied Accepted Applied Accepted Applied Accepted Applied Accepted Applied Accepted
0
50
100
150
Num
ber
of p
artic
ipan
ts
Gender
Female
Male
Unknown
Figure 2: Numbers of admitted participants at each workshop by inferred gender.
more concrete evidence of skill development included the products they wereable to create at the end of the class. For example, one student publisheda detailed report that attempted to understand the relationship between therelease of television shows on Netflix and activity on associated Wikipediaarticles. The student collected and compared a dataset of Wikipedia edit-ing activity on articles associated with television shows released on Netflixwith a similar dataset about broadcast television shows. Using these data, sheprovided evidence of a strong correlation between episode release dates andediting activity on Wikipedia.7 There was also evidence of skill developmentamong the academics who attended the workshops. At least one participantemailed us to say that they used skills developed in the class to collect andanalyze data from the Twitter API that ultimately led to a published paper.
Outreach
The workshops have consistently attracted a large number of participants.Over the five series, 686 people applied to the workshops in Seattle and 403were accepted (see Figure 2). In each case, we were constrained by the size ofthe instructional spaces we had access to and the number of mentors we had
7The student, Nyssa Achtyes, published her analysis on a website titled Long TermUser Engagement of Netflix and Non-Netflix shows: https://nyssadatascience.wordpress.com/(https://perma.cc/Z9HK-ZVA3)
Buildstamp/Version: 20171010194100

18
been able to recruit. Our curriculum has been adapted and taught outsideout of Seattle as well. For example, a group at the University of Waterloo’sWomen in Computer Science group has taught a series of workshops thatrelies heavily on our curriculum at least twice.
One of the most striking aspects of our workshops, so far, has been thatour participants seem to come from more diverse backgrounds than in typ-ical data science communities. For example, in every workshop and class,participants have been mostly women. This surprised us since we did notmake targeted efforts to include (or exclude) a particular gender. To quantifythe gender of participants, we analyzed the first names of the participants us-ing the U.S. Census and Social Security data to assign a probable gender toeach name. Results are shown in Figure 2 that show that a majority of bothapplicants and participants were female for each of the five sessions. Therewas also a fairly high proportion of women among our mentors—especiallyin later sessions when most mentors were returning participants.
We saw diversity along other dimensions as well. Because we targeted pro-gramming neophytes, a large portion of our attendees came from tradition-ally less technical departments within our university and from outside theuniversity as well. For example, we attracted participants working for bothlocal government and a large number of local non-profits. The workshopswere also attended by social media users including bloggers and participantsin Wikipedia who were interested in building the skills to analyze data fromtheir own communities.
Empowerment
Perhaps the most important—but difficult to measure—determination of whetherour curricula have contributed to the democratization of data science is thedegree to which participants felt empowered afterwards. Although skill de-velopment might include the ability to understand or conduct data analysis,we feel that empowerment goes one step further and suggests that skills can af-fect and change the power-structure in which participants find themselves—atleast in relation to data and data analysis. Although empowerment is difficultto measure, opt-in surveys of participants suggested that at least some partic-ipants felt that exposure to data science was empowering. For example, oneformer student told us:
It [ultimately] gave me the confidence to accept a job teaching CS
Buildstamp/Version: 20171010194100

19
at a local CC, which led to me applying to the CS PhD programat [the University of Washington] (and getting in!). So, I guess itcontributed to completely changing my life.
Another student reported a similar sense in which the program had led to ashift from a career in administration to one in software engineering:
Well, I went to Hackbright Academy largely because its curricu-lum centers on Python. And now I’m a software engineer in SanFrancisco. So... pretty rad, huh?
One thing we encourage participants to do is to return to future workshopsas mentors. Many participants, including two of the current organizers, havereturned to become new mentors. This is both a good opportunity for theparticipants to continue engaging in data science and a sign of empowerment.In our most recent workshops, a majority of mentors were former partici-pants.
Participants often did not continue to engage in data science after theworkshop when they felt they did not have projects where they could use andimprove their knowledge and skills. Participants who continued to engagein data science often had specific projects or pursued resources like Cours-era, CodeAcademy, Data Science Dojo, and classes at the University of Wash-ington. In terms of empowerment, assisting participants at this transitionalstage—from the workshop to real world settings—should be considered an in-tegral part of any community data science curriculum and reflects an area wehope to focus on in future curriculum development.
LIMITATIONS
We believe that the community data science approach can benefit participantswho seek to gain a working knowledge of programming and data science liter-acy. The first and most fundamental limitation is that we are trying to coverboth data literacy and introductory programming simultaneously. Even indi-viduals who are relatively comfortable exploring, aggregating, and describingdata using software tools like spreadsheets often struggle to perform famil-iar, basic data manipulations using Python. Currently, our workshops andcourses emphasize programming but it is unclear that we have the right mix.We could certainly defer more programming concepts, or exclude them alto-gether, in favor of teaching participants how to use widely available software
Buildstamp/Version: 20171010194100
20
tools that accomplish the same task.
We could also choose to cover additional programming concepts, such asobject orientation, that are useful for working with many common data sci-ence libraries. Of course, these decisions—to skip over a basic programmingconcept or to teach participants a non-programming alternative—would im-pose new constraints on what we can cover within the workshop as well aswhat participants will be able to accomplish afterwards.
Furthermore, it is not yet clear to us what measures of success we shoulduse to evaluate our approach. Participants seek out our workshops for a va-riety of reasons, arrive with vastly different types of experience. Some havemore practical, immediate, opportunities to continue honing skills than oth-ers. Ultimately, success for any individual participant might be best evaluatedbased on that individual’s goals and preparation as well as what they did withwhat they learned afterwards, than on direct measures of their performanceor engagement during the sessions.
CONCLUSION
In their highly-cited critique around the discourse of big data, danah boyd andKate Crawford argue that limited access to big data analytic tools is creatingnew digital divides. The world, they suggest, is divided into the “Big Datarich” and the “Big Data poor” (boyd & Crawford, 2012). The issues boyd andCrawford raise about access to data are formidable and substantive. We seethe community data model as one of very few attempts to address these issuesdirectly. However, by framing big data equity as simply an access issue, boydand Crawford may understate the problem. In ways ways that Dasgupta andHill (2017) has shown, non-professional data scientists do not ask the samequestions that professional data scientists ask. A democratized data scienceis not only a broader distribution of knowledge, skills, and power, it has thepotential to support the development of new types of data science.
We believe that what we have developed in our workshops and classes isa proof of concept. That said, we feel confident in our demonstration thatthere is broad demand for data science skills outside of traditional engineer-ing circles and among groups, like women, that the fields most closely associ-ated with data science have historically struggled to engage. We hope that wehave also provided one vision of what a democratized data science curriculummight look like. A more democratized data science is possible—potentially
Buildstamp/Version: 20171010194100
21
even with broad societal effects. We encourage you to join us in the processof understanding what it might look like, and what it might be able to accom-plish.
ACKNOWLEDGMENTS
The Community Data Science workshops were made possible through thegenerous actions of hundreds of mentors who volunteered to spend their week-ends teaching strangers data science. Without them, nothing we’ve describedhere would have been possible. Our work was also supported by the Depart-ment of Communication at the University of Washington which providedphysical facilities and other resources. Finally, this work was supported by aData Science Environments project award from the Gordon and Betty MooreFoundation (Award #2013-10-29) and the Alfred P. Sloan Foundation (Award#3835) to the University of Washington eScience Institute. eScience supportsdata driven discovery at the University of Washington in many ways and pro-vided financial and other forms of support for the workshops and for thischapter.
REFERENCES
Benkler, Y. (2016). Peer production and cooperation. In J. M. Bauer & M.Latzer (Eds.), Handbook on the Economics of the Internet. Cheltenham,UK: Edward Elgar.
boyd, d. & Crawford, K. (2012). Critical questions for big data. Information,Communication & Society, 15(5), 662–679. doi:10.1080/1369118X.2012.678878
Buechley, L. & Hill, B. M. (2010). LilyPad in the wild: How hardware’s longtail is supporting new engineering and design communities. In Proceed-ings of the 8th ACM Conference on Designing Interactive Systems (DIS’10) (pp. 199–207). New York, New York: ACM Press. doi:10.1145/1858171.1858206
Cheryan, S., Plaut, V. C., Davies, P. G., & Steele, C. M. (2009). Ambient be-longing: How stereotypical cues impact gender participation in com-puter science. Journal of Personality and Social Psychology, 97(6), 1045–1060. doi:10.1037/a0016239
Chilana, P. K., Alcock, C., Dembla, S., Ho, A., Hurst, A., Armstrong, B., &Guo, P. J. (2015, October). Perceptions of non-CS majors in intro pro-gramming: The rise of the conversational programmer. In Proceedingsof the 2015 IEEE Symposium on Visual Languages and Human-Centric
Buildstamp/Version: 20171010194100

22
Computing (VL/HCC) (pp. 251–259). Piscataway, New Jersey: IEEEPress. doi:10.1109/VLHCC.2015.7357224
Chilana, P. K., Singh, R., & Guo, P. J. (2016). Understanding conversationalprogrammers: A perspective from the software industry. In Proceedingsof the 2016 CHI Conference on Human Factors in Computing Systems(CHI ’16) (pp. 1462–1472). New York, New York: ACM Press. doi:10.1145/2858036.2858323
Dasgupta, S. (2016). Children as data scientists: Explorations in creating, think-ing, and learning (Ph.D. Dissertation, Massachusetts Institute of Tech-nology, Cambridge, Massachusetts).
Dasgupta, S. & Hill, B. M. (2016). Learning with data: Designing for commu-nity introspection and exploration. In Workshop on Human-CenteredData Science. Position Paper. Computer supported cooperative workand social computing. San Francisco, California.
Dasgupta, S. & Hill, B. M. (2017). Scratch Community Blocks: SupportingChildren as Data Scientists. In Proceedings of the 2017 CHI Conferenceon Human Factors in Computing Systems (CHI ’17). New York, NewYork: ACM Press. doi:10.1145/3025453.3025847
Davenport, T. H. & Patil, D. J. (2012, October). Data scientist: The sexiest jobof the 21st century. Harvard Business Review. Retrieved July 11, 2016,from https://hbr.org/2012/10/data-scientist-the-sexiest- job-of-the-21st-century
Dwoskin, E. (2014, August 8). Big data’s high-priests of algorithms; ’Data sci-entists’ meld statistics and software for find lucrative high-tech jobs.Wall Street Journal (Online): Tech. Retrieved July 11, 2016, from http://search.proquest.com/newsstand/docview/1552020409/abstract/D70B27FC5DA74D5APQ/1
Estrada, T. & Atwood, S. A. (2012). Factors that affect student frustrationlevel in introductory laboratory experiences. 2012 ASEE Annual Con-ference & Exposition. American Society for Engineering Education, 25.629.1–25.629.7. Retrieved from https://peer.asee.org/21386
Forte, A. & Guzdial, M. (2005, May). Motivation and nonmajors in computerscience: Identifying discrete audiences for introductory courses. IEEETransactions on Education, 48(2), 248–253. doi:10.1109/TE.2004.842924
Gellman, L. (2014, November 6). Business education: Big data gets mastertreatment—some business schools offer one-year analytics programs,catering to shift in students’ ambitions. Wall Street Journal, B.7. Re-trieved July 11, 2016, from http://search.proquest.com/newsstand/docview/1620527411/abstract/B21739238EE74F26PQ/1
Good, C., Rattan, A., & Dweck, C. S. (2012). Why do women opt out? Senseof belonging and women’s representation in mathematics. Journal ofPersonality and Social Psychology, 102(4), 700–717. doi:10.1037/a0026659
Buildstamp/Version: 20171010194100

23
Guzdial, M. (2003). A media computation course for non-majors. In Proceed-ings of the 8th Annual Conference on Innovation and Technology in Com-puter Science Education (ITiCSE ’03) (pp. 104–108). New York, NewYork: ACM Press. doi:10.1145/961511.961542
Guzdial, M. & Forte, A. (2005). Design process for a non-majors computingcourse. In Proceedings of the 36th SIGCSE Technical Symposium on Com-puter Science Education (SIGCSE ’05) (pp. 361–365). New York, NewYork: ACM Press. doi:10.1145/1047344.1047468
Heer, J., Viégas, F. B., & Wattenberg, M. (2007). Voyagers and voyeurs: Sup-porting asynchronous collaborative information visualization. In Pro-ceedings of the SIGCHI Conference on Human Factors in Computing Sys-tems (CHI ’07) (pp. 1029–1038). New York, New York: ACM Press.doi:10.1145/1240624.1240781
Howe, J. (2006). The rise of crowdsourcing. Wired Magazine, 14(6), 1–4.Jones, C. (1995, September). End user programming. Computer, 28(9), 68–70.
doi:10.1109/2.410158Joshi, K. D., Kvasny, L., Unnikrishnan, P., & Trauth, E. (2016, January). How
do black men succeed in IT careers? The effects of capital. In Proceed-ings of the 2016 49th Hawaii International Conference on System Sciences(HICSS) (pp. 4729–4738). Piscataway, New Jersey: IEEE Computer So-ciety Press. doi:10.1109/HICSS.2016.586
Lave, J. & Wenger, E. (1991). Situated learning: Legitimate peripheral partici-pation. Cambridge, UK: Cambridge University Press.
Luther, K., Counts, S., Stecher, K. B., Hoff, A., & Johns, P. (2009). Pathfinder:An online collaboration environment for citizen scientists. In Proceed-ings of the SIGCHI Conference on Human Factors in Computing Systems(CHI ’09) (pp. 239–248). New York, New York: ACM Press. doi:10 .1145/1518701.1518741
Manyika, J., Chui, M., Brown, B., Bughin, J., Dobbs, R., Roxburgh, C., & By-ers, A. H. (2011, May). Big data: The next frontier for innovation, compe-tition, and productivity. McKinsey Global Institute. Retrieved July 11,2016, from http://www.mckinsey.com/business-functions/business-technology/our-insights/big-data-the-next-frontier-for-innovation
Margolis, J. & Fisher, A. (2001). Unlocking the clubhouse: Women in comput-ing. Cambridge, Massachusetts: The MIT Press.
Matias, J. N. (2016). Going dark: Social factors in collective action against plat-form operators in the Reddit blackout. In Proceedings of the 2016 CHIConference on Human Factors in Computing Systems (CHI ’16) (pp. 1138–1151). New York, New York: ACM Press. doi:10.1145/2858036.2858391
Miller, C. C. (2013, April 14). The numbers of our lives. New York Times:ED, ED.18. Retrieved July 11, 2016, from http://search.proquest.com/
Buildstamp/Version: 20171010194100

24
newsstand/docview/1326574891/abstract/88A4A39B52A94D3BPQ/2
Nafus, D. (Ed.). (2016). Quantified: Biosensing technologies in everyday life.Cambridge, Massachusetts: MIT Press.
Nardi, B. A. (1993). A small matter of programming: Perspectives on end usercomputing. MIT Press.
Neff, G. & Nafus, D. (2016). Self-tracking. Cambridge, Massachusetts: MITPress.
Papert, S. (1980). Mindstorms: Children, computers, and powerful ideas. NewYork, New York: Basic Books.
Papert, S. (1987). Computer criticism vs. technocentric thinking. EducationalResearcher, 16(1), 22–30. doi:10.2307/1174251. JSTOR: 1174251
Raddick, J., Lintott, C. J., Schawinski, K., Thomas, D., Nichol, R. C., An-dreescu, D., . . . Slosar, A., et al. (2007). Galaxy Zoo: An experiment inpublic science participation. In Bulletin of the American AstronomicalSociety (Vol. 38, p. 892).
Ratto, M. (2011, July 1). Critical making: Conceptual and material studiesin technology and social life. The Information Society, 27(4), 252–260.doi:10.1080/01972243.2011.583819
Resnick, M., Silverman, B., Kafai, Y., Maloney, J., Monroy-Hernández, A.,Rusk, N., . . . Silver, J. (2009, November). Scratch: Programming for all.Communications of the ACM, 52(11), 60. doi:10.1145/1592761.1592779
Simpson, R., Page, K. R., & De Roure, D. (2014). Zooniverse: Observingthe world’s largest citizen science platform. In Proceedings of the 23rdInternational Conference on World Wide Web (WWW ’14 Companion)(pp. 1049–1054). New York, New York: ACM Press. doi:10.1145/2567948.2579215
Smith, A. M., Lynn, S., & Lintott, C. J. (2013). An introduction to the Zooni-verse. In First AAAI Conference on Human Computation and Crowd-sourcing (HCOMP ’2013). Palo Alto, California: AAAI Press.
Sullivan, B. L., Wood, C. L., Iliff, M. J., Bonney, R. E., Fink, D., & Kelling, S.(2009, October). eBird: A citizen-based bird observation network in thebiological sciences. Biological Conservation, 142(10), 2282–2292. doi:10.1016/j.biocon.2009.05.006
Viegas, F. B., Wattenberg, M., van Ham, F., Kriss, J., & McKeon, M. (2007,November). ManyEyes: A site for visualization at Internet scale. IEEETransactions on Visualization and Computer Graphics, 13(6), 1121–1128.doi:10.1109/TVCG.2007.70577
Wattenberg, M. & Kriss, J. (2006, July). Designing for social data analysis.IEEE Transactions on Visualization and Computer Graphics, 12(4), 549–557. doi:10.1109/TVCG.2006.65
Buildstamp/Version: 20171010194100

25
West, J. & Portenoy, J. (2016, October). The data gold rush in higher educa-tion. In C. Sugimoto, H. R. Ekbia, & M. Mattioli (Eds.), Big Data is Nota Monolith. Information Policy. Cambridge, Massachusetts: MIT Press.
Wilson, G. (2014, February 19). Software Carpentry: Lessons learned. F1000Research.doi:10.12688/f1000research.3-62.v1
Wolf, G. (2010, April 28). The data-driven life. The New York Times. RetrievedAugust 12, 2016, from http://www.nytimes.com/2010/05/02/magazine/02self-measurement-t.html
Wood, C., Sullivan, B., Iliff, M., Fink, D., & Kelling, S. (2011, December20). eBird: Engaging birders in science and conservation. PLOS Biology,9(12), e1001220. doi:10.1371/journal.pbio.1001220
AUTHOR DETAILS
Benjamin Mako Hill
Affiliation University of Washington, Department of Communication
Email [email protected]
Address Box 353740, Seattle, WA, 98195
Biography Benjamin Mako Hill is a data scientist who studies study collec-tive action in online communities and seeks to understand why someattempts at collaborative production—like Wikipedia and Linux—buildlarge volunteer communities while the vast majority never attract evena second contributor. He is an Assistant Professor of Communicationat the University of Washington, a Faculty Associate at the BerkmanKlein Center for Internet and Society at Harvard University, and a par-ticipant in Wikipedia and a number of other peer production commu-nities.
Dharma Dailey
Affiliation University of Washington, Department of Human Centered De-sign and Engineering
Email [email protected]
Biography Dharma Dailey studies how people get information during crises.She attended the first Community Data Science Workshop as a studentand put what she learned into her research! She found the workshopso helpful, she stuck around to help organize more of them. She is is
Buildstamp/Version: 20171010194100
26
a PhD Candidate in Human-Centered Design and Engineering at theUniversity of Washington.
Mika Matsuzaki
Affiliation University of Washington, Department of Biostatistics
Email [email protected]
Biography Mika Matsuzaki is an epidemiologist. She works at the as a Re-search Scientist at the University of Washington studying risk factors invulnerable population with HIV/AIDS.
Jonathan T. Morgan
Affiliation Wikimedia Foundation
Email [email protected]
Biography Jonathan Morgan is a Senior Design Researcher at the WikimediaFoundation. He has a PhD from the University of Washington in theDepartment of Human Centered Design & Engineering.
Richard T. Guy
Affiliation Microsoft
Email [email protected]
Biography Tommy Guy is a Data Scientist at Microsoft where he works onlarge scale experimentation. He enjoys teaching programming and datascience wherever they will let him.
Ben Lewis
Affiliation Microsoft
Email [email protected]
Biography Ben Lewis is a software engineer who advocates for communityinvolvement in decision making, and seeks to expand access to tools forunderstanding and shaping the world. He is a graduate of McGill Uni-versity, an occasional contributor to open source projects, and a partic-ipant in Wikipedia.
Buildstamp/Version: 20171010194100