Demand, Supply, and Price Chapter 4, 5, 6. Imagine you have $5 in your pocket. How many candy bars...
65
Demand, Supply, and Price Chapter 4, 5, 6
-
Upload
kerry-kelly -
Category
Documents
-
view
213 -
download
0
description
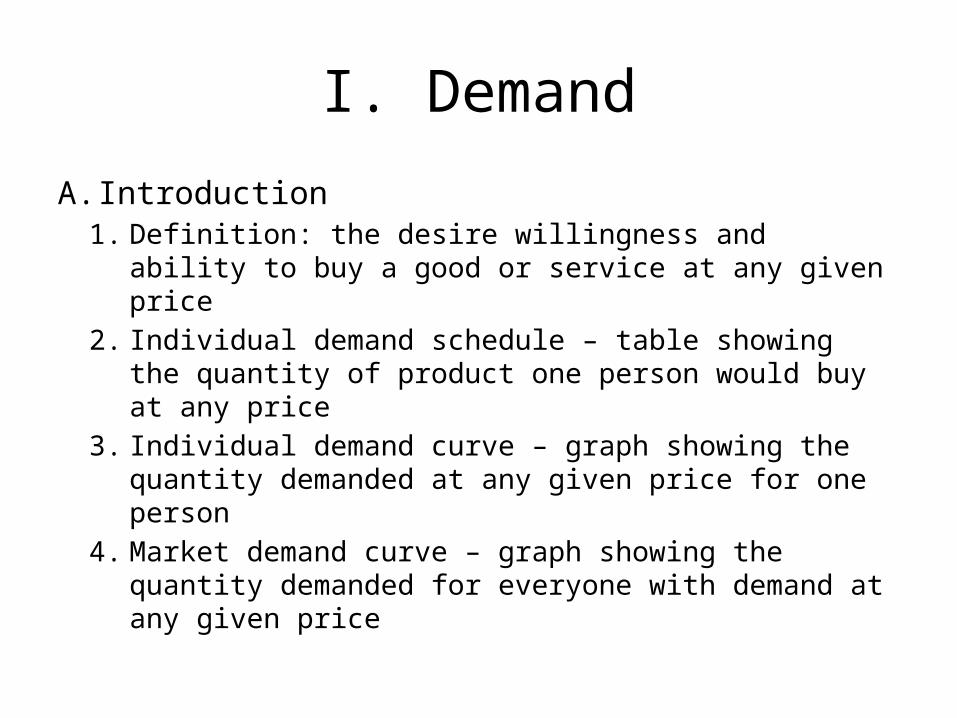
I. Demand A.Introduction 1.Definition: the desire willingness and ability to buy a good or service at any given price 2.Individual demand schedule – table showing the quantity of product one person would buy at any price 3.Individual demand curve – graph showing the quantity demanded at any given price for one person 4.Market demand curve – graph showing the quantity demanded for everyone with demand at any given price
Transcript of Demand, Supply, and Price Chapter 4, 5, 6. Imagine you have $5 in your pocket. How many candy bars...

Demand, Supply, and Price
Chapter 4, 5, 6

Imagine you have $5 in your pocket. How many candy bars would you buy at each of the following prices?
Price Quantity Amount Spent
$5$2$1.75.50.25.10
I. Demand
A. Introduction1. Definition: the desire willingness and ability to buy a
good or service at any given price2. Individual demand schedule – table showing the
quantity of product one person would buy at any price3. Individual demand curve – graph showing the quantity
demanded at any given price for one person4. Market demand curve – graph showing the quantity
demanded for everyone with demand at any given price

Demand Curve
Price
Quantity

I. Demand (continued)
A. Introduction (continued)5. Law of demand – as price increases, quantity
demanded decreases; as price decreases, quantity demanded increases (explains why curve slopes downward)
6. Diminishing marginal utility – each additional unit of a product brings less satisfaction and is worth a little less (explains why curve is not flat)
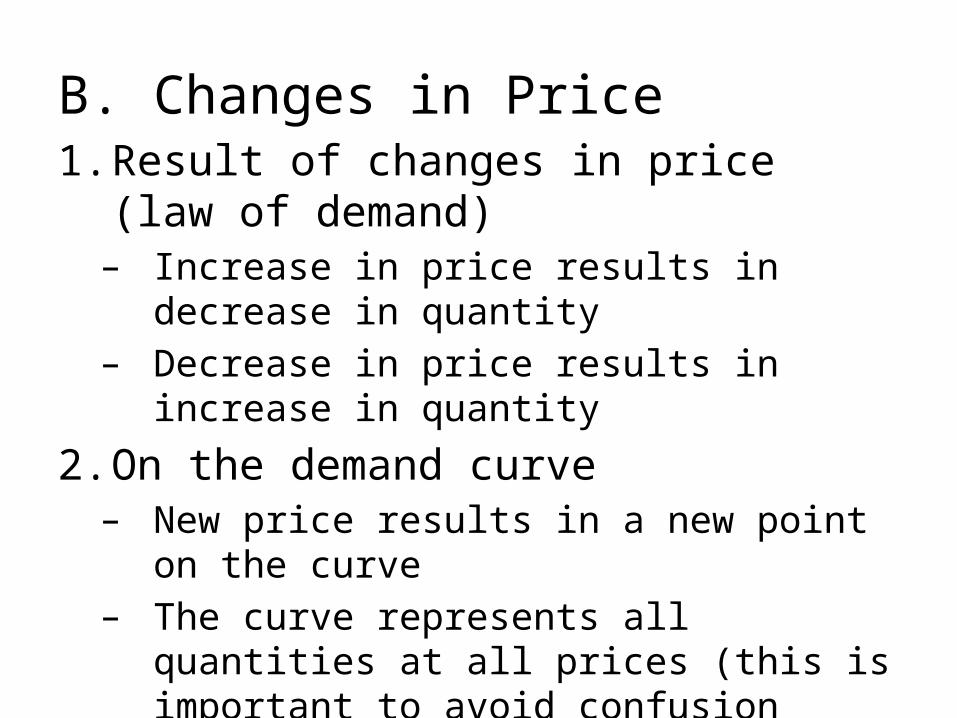
B. Changes in Price1. Result of changes in price (law of demand)– Increase in price results in decrease in quantity– Decrease in price results in increase in quantity
2. On the demand curve– New price results in a new point on the curve– The curve represents all quantities at all prices
(this is important to avoid confusion later)

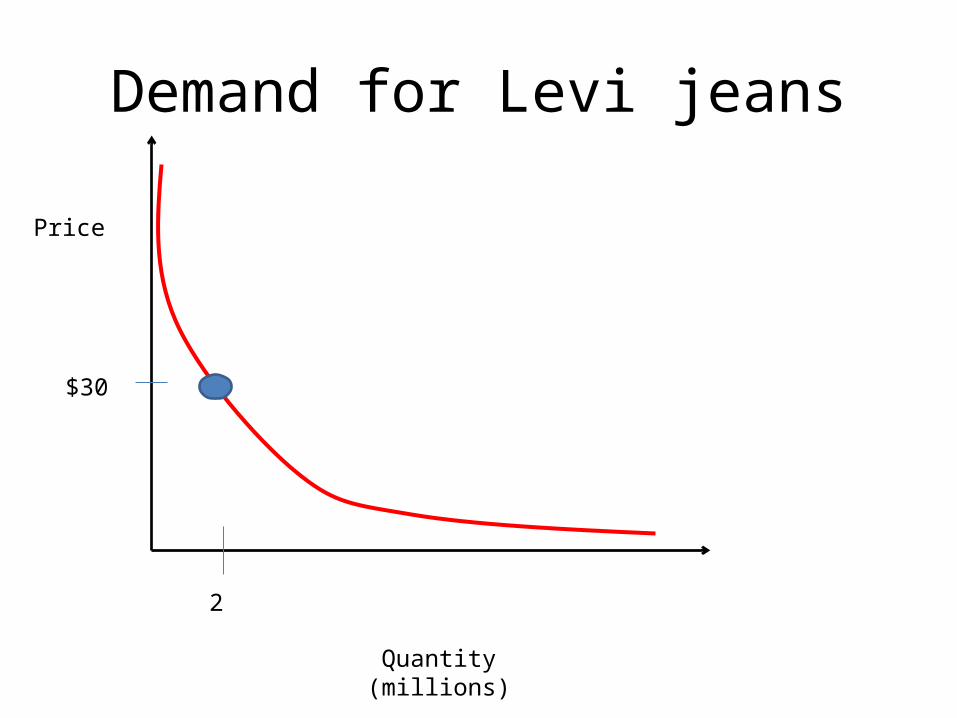
Demand for Levi jeans
Price
Quantity (millions)
$30
2

Demand for Levi jeans(decrease in price)
Price
Quantity (millions)
$30
2
$20
4
Demand for Levi jeans
Price
Quantity (millions)
$30
2

Demand for Levi jeans(decrease in price)
Price
Quantity (millions)
$30
2
$35
1

Lead-off 1/23/14
What is your favorite TV commercial? Why do you like it? Do you think it was effective as a commercial? Why do companies advertise on TV, radio, billboards, internet, etc?

C. Changes in Demand
• Demand changes when a different quantity will be demanded at the same price
1. Factors Affecting Demand– Consumer Income – increase in income results in greater
demand and vice versa– Consumer Taste – increase in popularity results in greater
demand and vice versa1. Advertising2. Trends3. Seasons4. Bad publicity

– Price of related goods1. Complements – products used together (peanut
butter and jelly) 2. Price of complement will have an inverse relationship
with demand3. Replacements – products used instead of one another
(Pepsi and Coke)4. Price of replacement will have a direct relationship
with demand– Future expectation – expected price change will
have a direct relationship on demand– Number of consumers – increase in number of
consumers will result in an increase in demand and vice versa

2. Effect on the demand curve– Increase in demand – shift right– Decrease in demand – shift left

Demand for Levi jeans
Price
Quantity (millions)
$30
2
A popular celebrity endorses Levi’s Jeans
4

Demand for Levi jeans
Price
Quantity (millions)
$30
2
A popular celebrity endorses Levi’s Jeans
4
Entire curve shifts right

Demand for Levi jeans
Price
Quantity (millions)
$30
2
Jeans go out of style
1
Entire curve shifts left

Demand for Levi jeans
Price
Quantity (millions)
$30
2
Jeans go out of style
1
Entire curve shifts left

Extra credit directions
• watch the state of the union address• pick up to 3 quotes for 10 points each• write a paragraph for each quote including the following
information1. the quote itself2. explain what the quote means3. write at least 2 sentences relating the quote to what we have
studied4. at least two sentences expressing your agreement or
disagreement with the quote
• Due Friday at the start of class

Practice• Determine the effect each would have on the demand for
Ben and Jerry’s ice cream and draw demand curves to represent that change
1. Ben and Jerry increase the price of their ice cream2. People have more money3. People move away4. Price of Hagen Das ice cream decreases5. Ben and Jerry are convicted of abusing cute animals6. Ben and Jerry’s has a good Super Bowl advertisement7. Its winter8. The price of ice cream is expected to rise

Lead off 1/27
• Lead off 1/27• How would each of the following affect demand for
Oreos in a particular community?1. People have more money because taxes were lowered2. Price of milk increases3. A study finds that “an Oreo a day keeps the doctor
away”4. After a major employer shuts down, people move
away from the community

D. Elasticity of Demand– Elasticity – describes how a change in price will affect quantity
demanded1. Types • Elastic – a % change in price will result in a relatively greater %
change in quantity demanded• Inelastic – a % change in price will result in a relatively smaller %
change in quantity demanded• Unit elastic – a % change in price will produce an equal % change in
quantity demanded (theoretical)
2. Total Expenditures Test• Total Expenditure = Price X Quantity (essentially its how much money
will be spent)• Results:
– If P and TE are opposite: elastic– If P and TE are the same: inelastic– If TE stays the same: unit elastic

Total Expenditures Test
Price of Candy Bars Quantity (millions) Total Expenditures ($ millions)
$5 1 $5
$3 2 $6
$2 8 $16
$1 20 $20
Price of a gallon of gasoline
Quantity (millions) Total Expenditures ($ millions)
$5 7 35
$3 8 24
$2 9 18
$1 10 10
Inelastic Demand
Elastic Demand

D. Elasticity of Demand3. Determinants of Elasticity–Ability to delay purchase
1. Yes – elastic2. No- inelastic–Availability of substitutes
1. Yes – elastic2. No- inelastic–Large percentage of income used
1. Yes – elastic2. No - inelastic
4. Maximizing Profits–Products with elastic demand: keep prices low (relative to your competition)–Products with inelastic demand: keep prices high (prices will reach a point of elasticity, though)

Practice• Decide whether the following are likely to have elastic or
inelastic demand1. Toothbrush2. Car3. Soap4. Movie tickets5. Gasoline6. Gasoline from BP7. Video game8. Ford Mustang
II. Supply
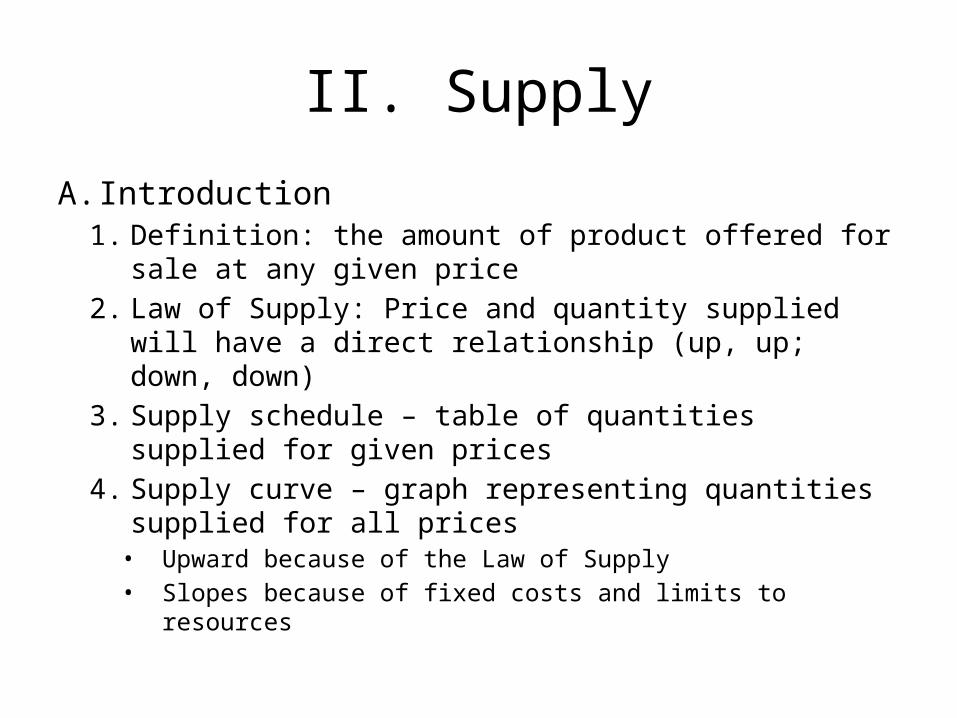
A. Introduction1. Definition: the amount of product offered for sale at any
given price2. Law of Supply: Price and quantity supplied will have a
direct relationship (up, up; down, down)3. Supply schedule – table of quantities supplied for given
prices4. Supply curve – graph representing quantities supplied
for all prices • Upward because of the Law of Supply• Slopes because of fixed costs and limits to resources

Supply CurvePrice
Quantity

B. Change in Price1. Result of changes in price (law of supply)• Increase in price results in increase in quantity• Decrease in price results in decrease in quantity
2. On the demand curve• New price results in a new point on the curve• The curve represents all quantities at all prices (this is
important to avoid confusion later)

Increase in PricePrice
Quantity
$ 5
100

Increase in PricePrice
Quantity
$ 5
100 150
$10

Decrease in PricePrice
Quantity
$ 5
100

Decrease in PricePrice
Quantity
$ 5
10060
$3

C. Change in Supply1. Factors resulting in a change in supply• Number of suppliers – increase will increase supply (VV)• Cost of production – increase will decrease supply (VV)• Productivity – increase will increase supply (VV)• Technology – improvements will increase supply (VV)• Taxes – decrease supply (VV)• Subsidies –increase supply (VV)• Government regulations – decrease supply• Future expectations – expected increase will cause
decrease in supply (VV)
2. Changes in supply on the supply curve• Increase – shifts curve to the right• Decrease – shifts curve to the left
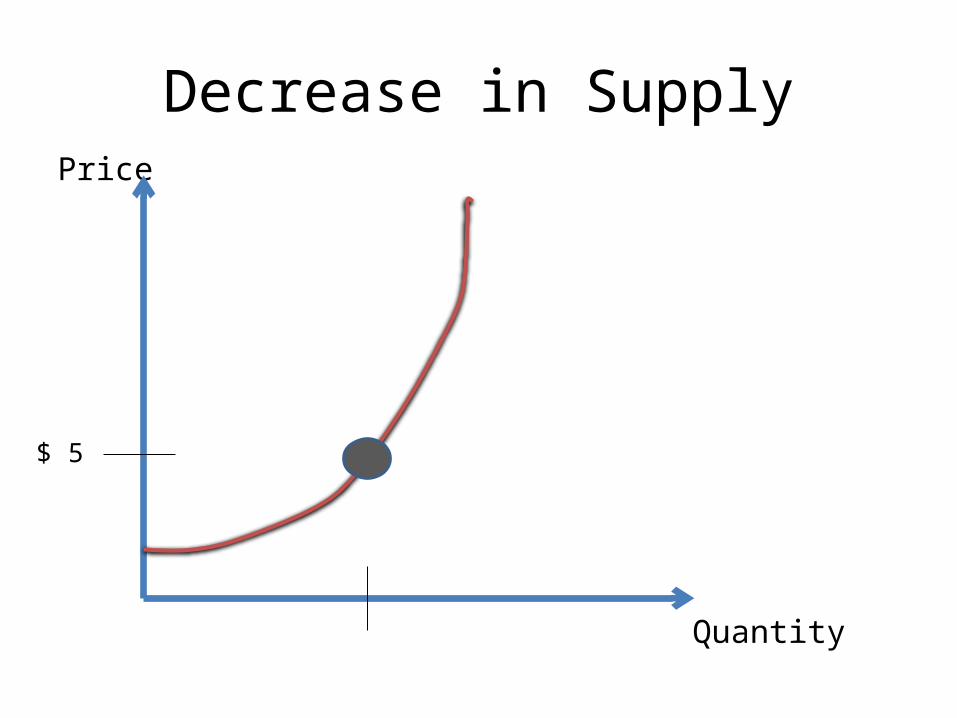
Decrease in SupplyPrice
Quantity
$ 5

Decrease in SupplyPrice
Quantity
$ 5
100
Government regulations enacted
50
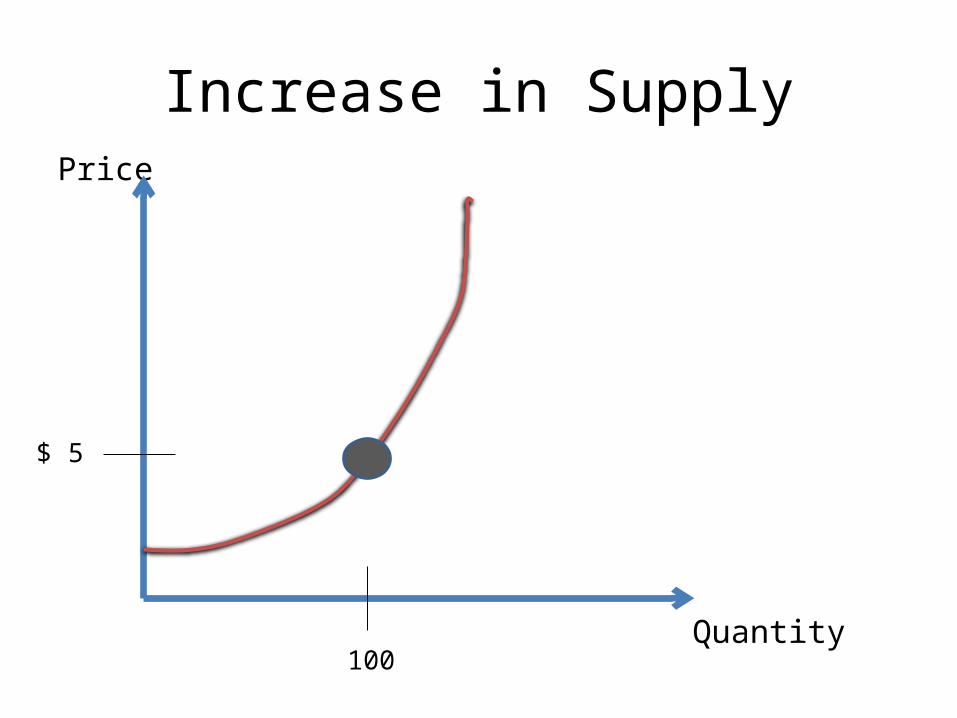
Increase in SupplyPrice
Quantity
$ 5
100

Increase in SupplyPrice
Quantity
$ 5
100
Taxes lowered
175

D. Elasticity of Supply1. Elasticity – the responsiveness of quantity
supplied to a change in price2. Types• Elastic – change in price = bigger change in quantity
supplied• Inelastic – change in price = smaller change in
quantity supplied
3. Determining Elasticity of Supply• Elastic – able to speed up production quickly• Inelastic – unable to speed up production quickly

Practice: determine whether each of the following would increase or decrease supply of cupcakes
1. Business taxes are lowered2. A bakery goes out of business3. A faster cupcake oven is invented4. A law limiting sugar in food is passed5. Bakery workers are motivated to work harder6. Cost of flour decreases7. Cost of sugar increases8. A tax on desserts is passed9. Bakery workers go on strike10. The price of cupcakes is expected to increase
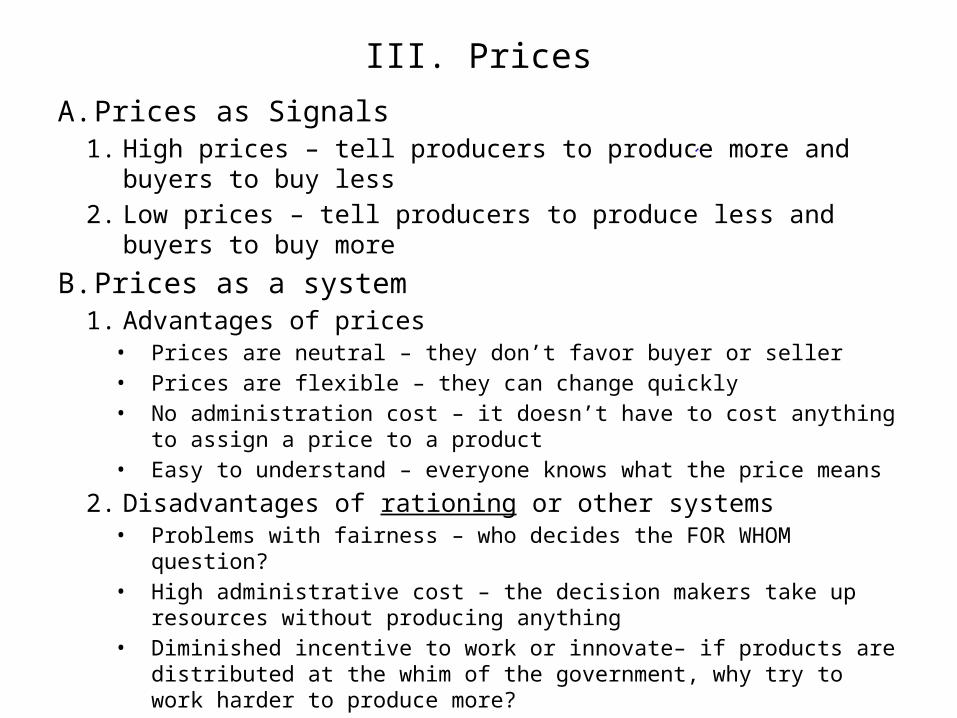
III. Prices
A. Prices as Signals1. High prices – tell producers to produce more and buyers to buy less2. Low prices – tell producers to produce less and buyers to buy more
B. Prices as a system1. Advantages of prices
• Prices are neutral – they don’t favor buyer or seller• Prices are flexible – they can change quickly• No administration cost – it doesn’t have to cost anything to assign a price
to a product• Easy to understand – everyone knows what the price means
2. Disadvantages of rationing or other systems• Problems with fairness – who decides the FOR WHOM question?• High administrative cost – the decision makers take up resources without
producing anything• Diminished incentive to work or innovate– if products are distributed at the
whim of the government, why try to work harder to produce more?

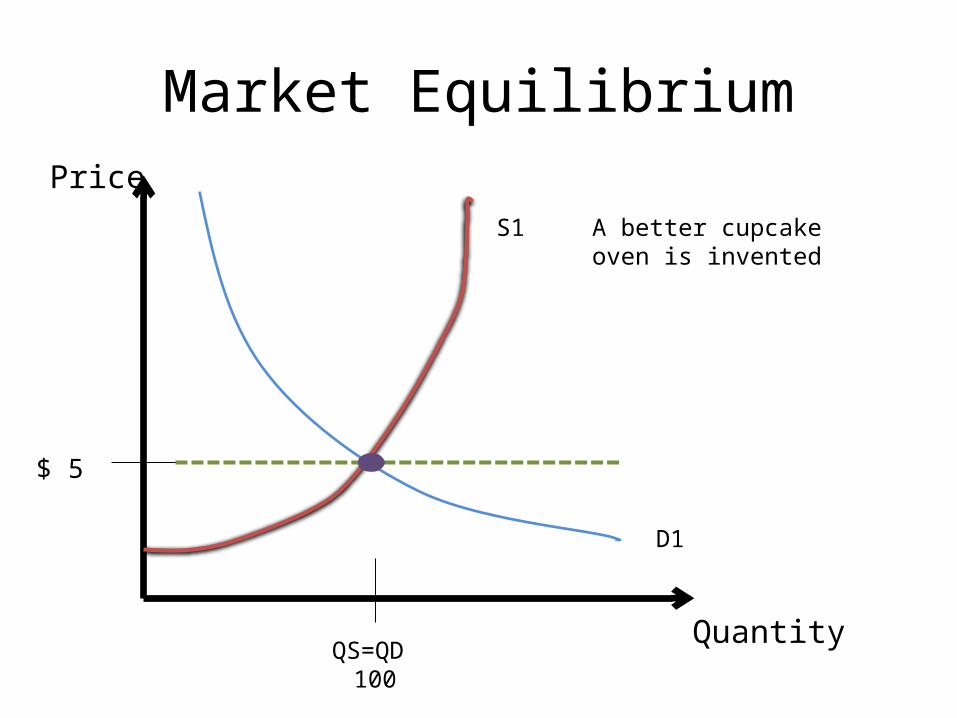
C. The Price System at Work1. Market equilibrium – condition in which quantity
supplied equals quantity demanded (all demand satisfied, all supply purchased)
2. Surplus• Condition in which quantity supplied is greater than quantity
demanded (too much product, not enough buyers)• Price is too high
3. Shortage• Condition in which quantity demanded is greater than
quantity supplied (too many buyers, not enough product)• Price is too low
4. Equilibrium price• Price at which market equilibrium is reached• Price will reach equilibrium on its own (without the
government)
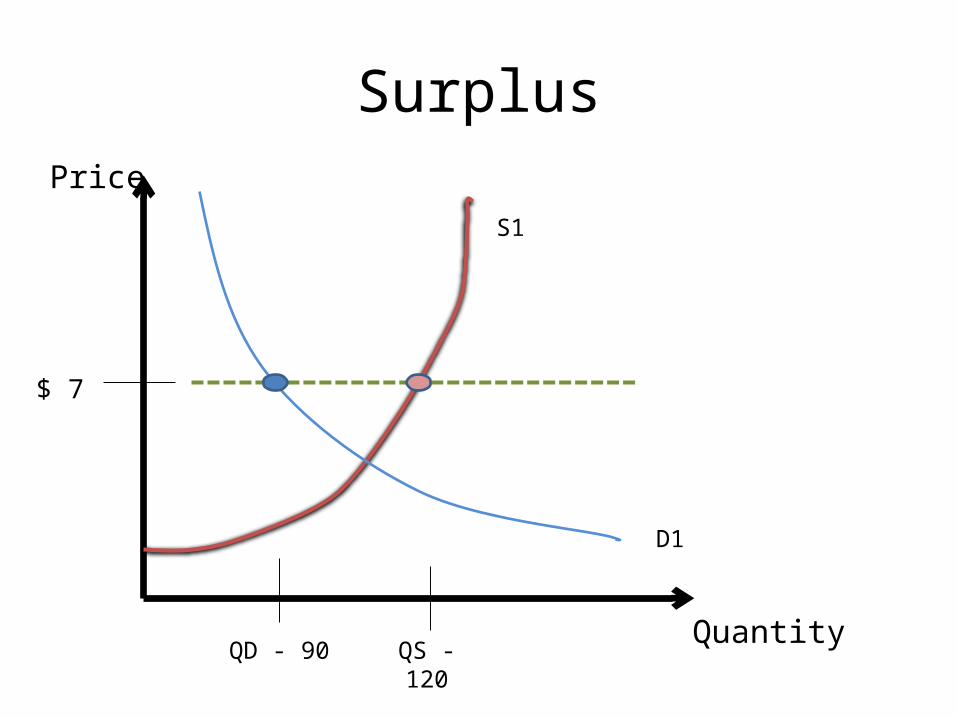
SurplusPrice
Quantity
$ 7
QD - 90 QS - 120
S1
D1

ShortagePrice
Quantity
$ 3
QS - 95 QD - 130
S1
D1

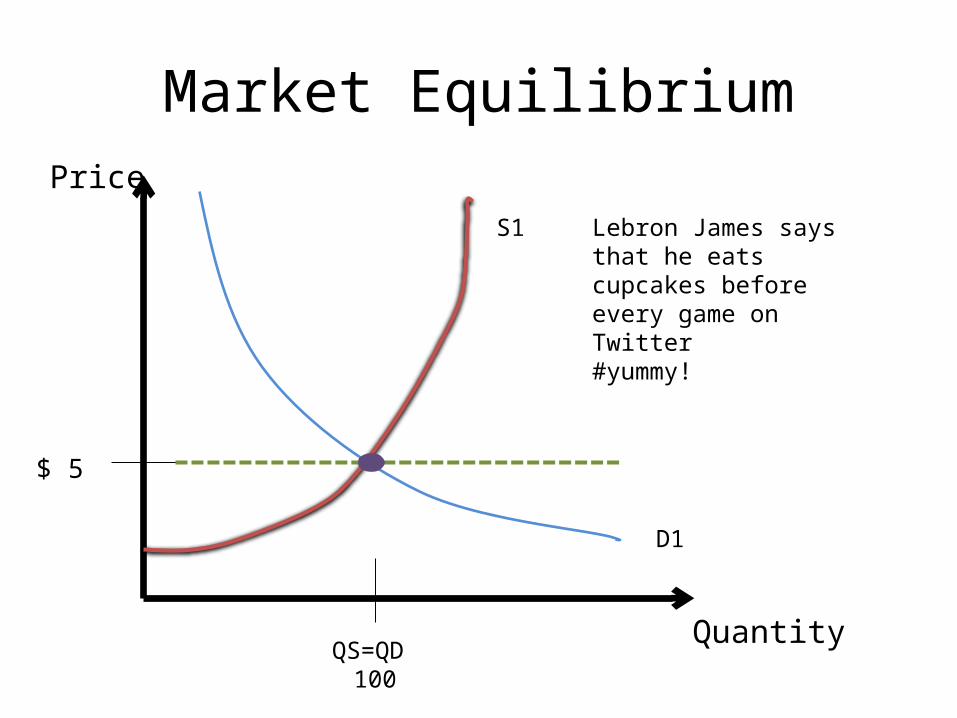
Market EquilibriumPrice
Quantity
$ 5
QS=QD 100
S1
D1

D. Changes in Supply and Demand – a change in supply or demand will change equilibrium price and quantity
1. Supply• Increase (right) – Price will decrease, quantity will
increase• Decrease (left) - Price will increase, quantity will
decrease
2. Demand• Increase (right) – Price will increase, quantity will
increase• Decrease (left) – Price will decrease, quantity will
decrease
Market EquilibriumPrice
Quantity
$ 5
QS=QD 100
S1
D1
A better cupcake oven is invented

Increase in supplyPrice
Quantity
$ 5
QD 100
S1
D1
S2
QS 120
Quantity supplied is now greater than quantity demanded(surplus)
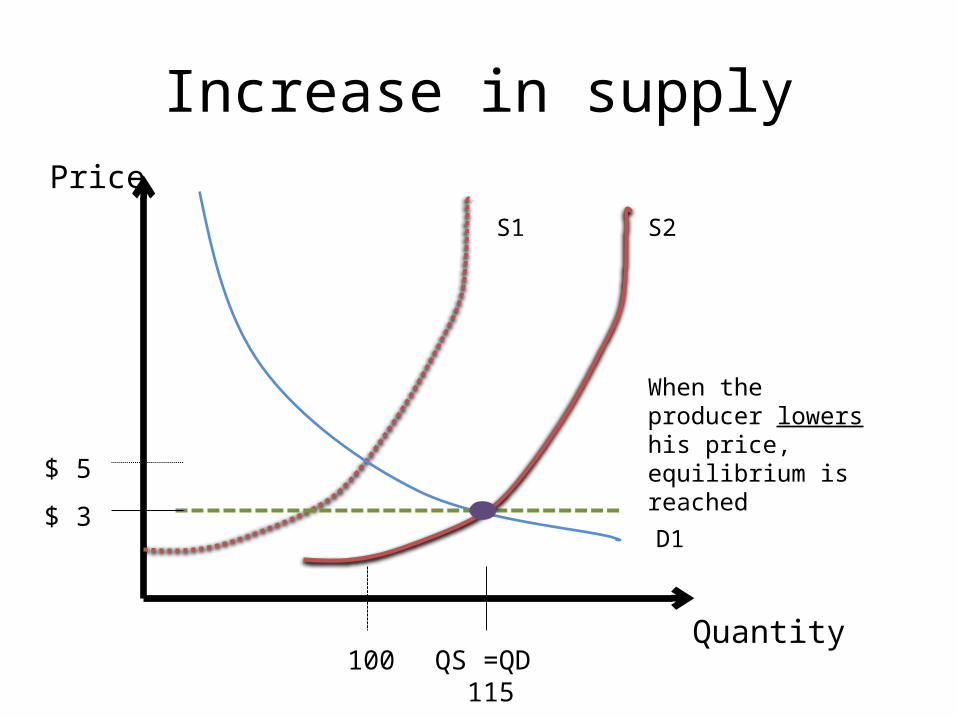
Increase in supplyPrice
Quantity
$ 5
S1
D1
S2
When the producer lowers his price, equilibrium is reached
$ 3
QS =QD 115
100
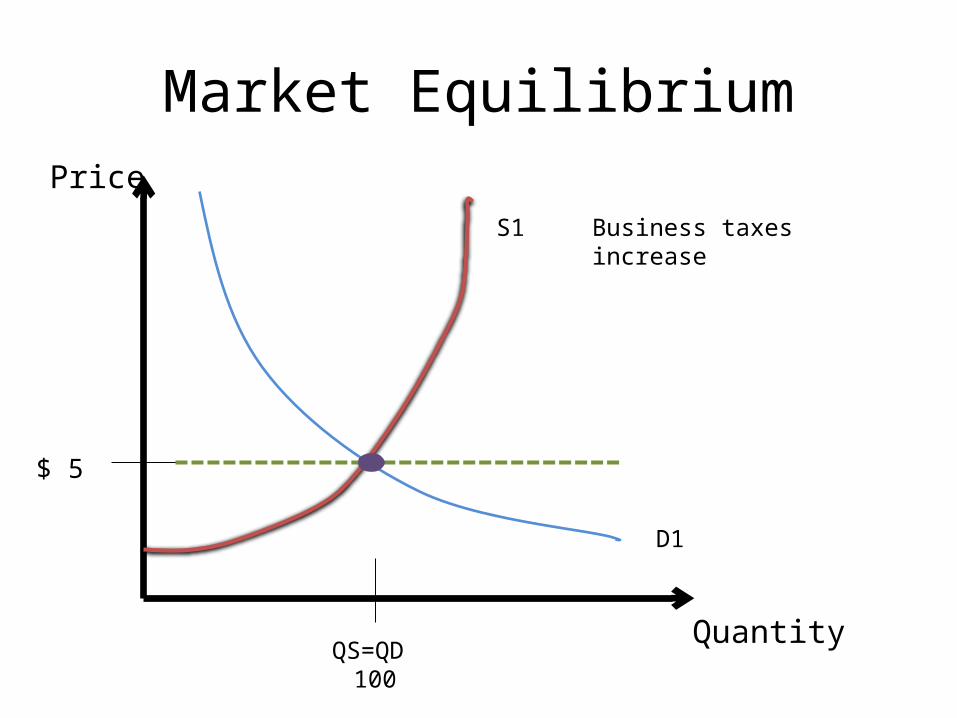
Market EquilibriumPrice
Quantity
$ 5
QS=QD 100
S1
D1
Business taxes increase
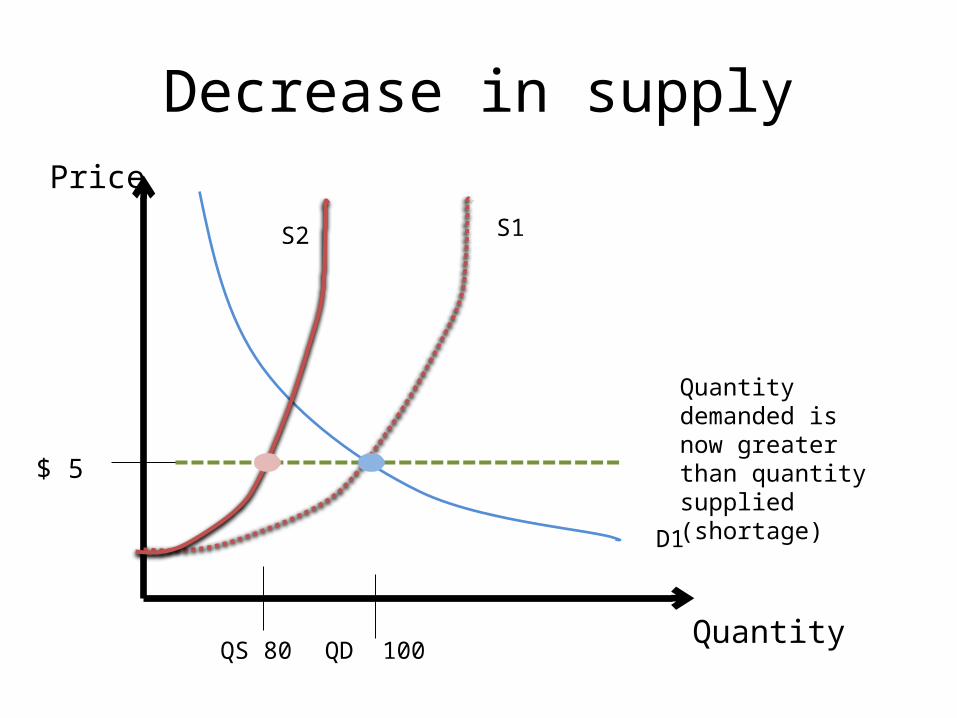
Decrease in supplyPrice
Quantity
$ 5
QD 100
S1
D1
S2
QS 80
Quantity demanded is now greater than quantity supplied (shortage)

Decrease in supplyPrice
Quantity
$ 5
100
S1
D1
S2
QS=QD 80
$ 8When the producer raises his price, equilibrium is reached
Market EquilibriumPrice
Quantity
$ 5
QS=QD 100
S1
D1
Lebron James says that he eats cupcakes before every game on Twitter#yummy!

Increase in DemandPrice
Quantity
$ 5
QS 100
S1
D1
QD 125
Quantity demanded is now greater than quantity supplied (shortage)
D2

Increase in DemandPrice
Quantity
$ 5
S1
D1
QS=QD 110
D2
$ 8When the producer raises his price, equilibrium is reached
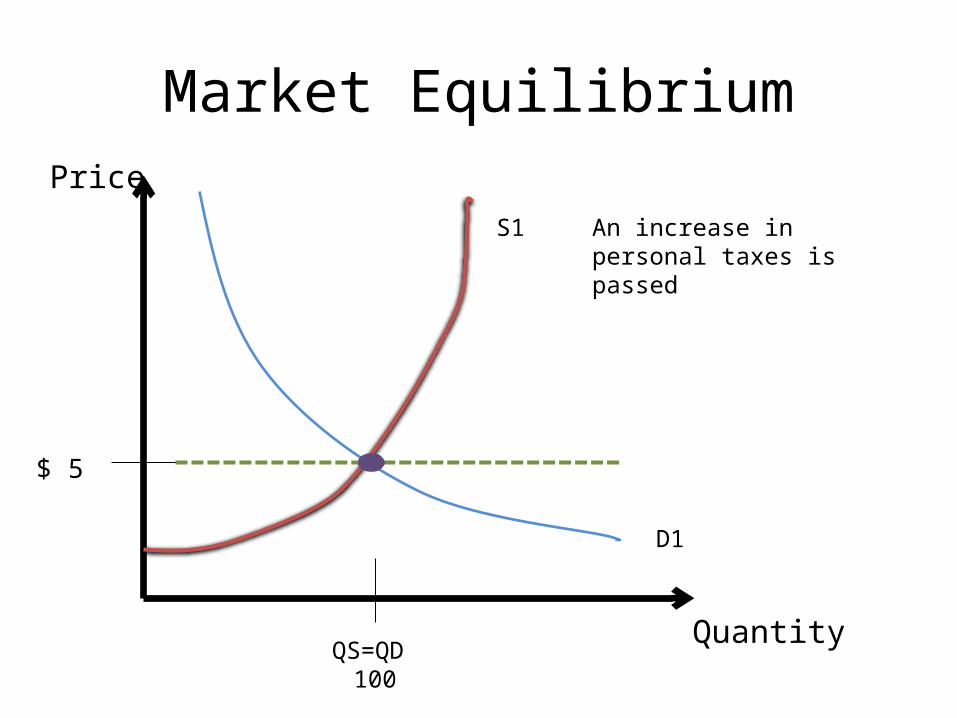
Market EquilibriumPrice
Quantity
$ 5
QS=QD 100
S1
D1
An increase in personal taxes is passed
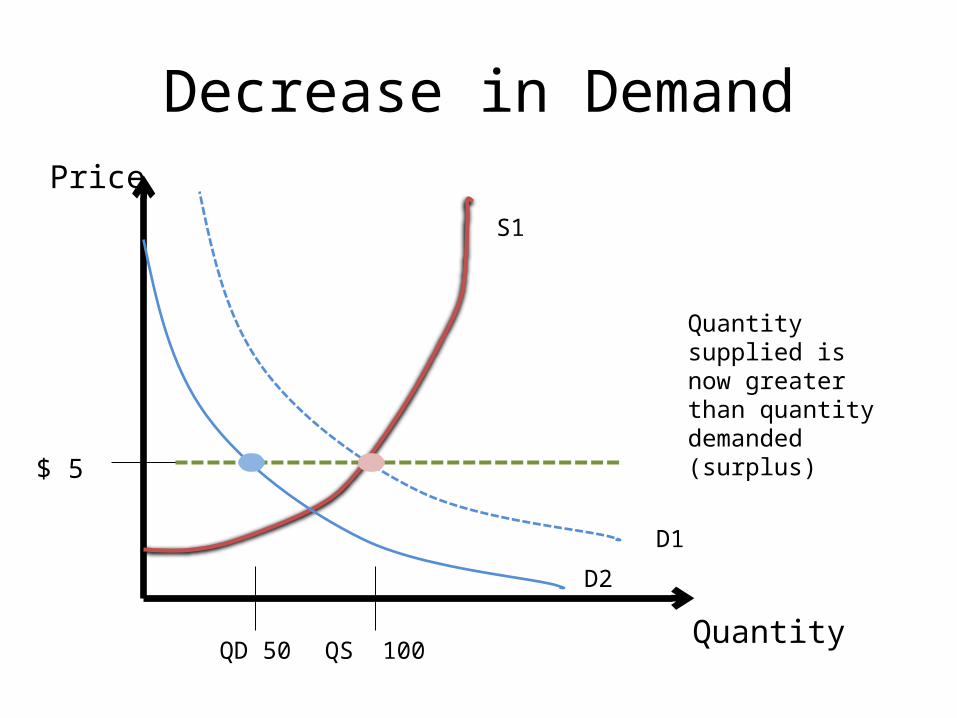
Decrease in DemandPrice
Quantity
$ 5
QS 100
S1
D1
QD 50
Quantity supplied is now greater than quantity demanded (surplus)
D2

Decrease in DemandPrice
Quantity
$ 5
S1
D1
QD=QD 75
D2
$ 3
When the producer lowers his price, equilibrium is reached

E. The role of elasticity1. If demand is inelastic, a change in supply will
result in a large change in price2. If demand is elastic, a change in supply will result
in a small change in price
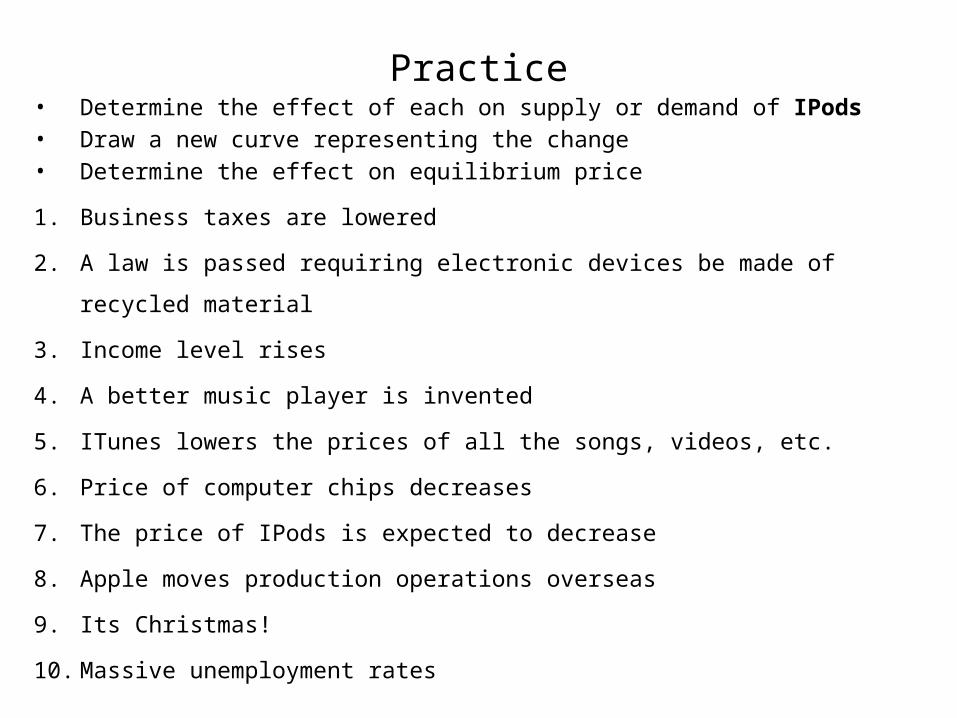
Practice• Determine the effect of each on supply or demand of IPods• Draw a new curve representing the change• Determine the effect on equilibrium price
1. Business taxes are lowered
2. A law is passed requiring electronic devices be made of recycled material
3. Income level rises
4. A better music player is invented
5. ITunes lowers the prices of all the songs, videos, etc.
6. Price of computer chips decreases
7. The price of IPods is expected to decrease
8. Apple moves production operations overseas
9. Its Christmas!
10. Massive unemployment rates

Lead off 2/5/14
Do you think there should be laws against businesses (ex: gas stations) raising prices during an emergency (price gouging)? Why or why not?
Do you think minimum wage should be raised? Why or why not?

IV. Government Intervention and Market Distortion
A. Social goals vs. Efficiency1. In a market economy the following goals will be reached
through the process of price adjustment without any help• Freedom • Full employment• Efficiency• Price stability• Economic growth
2. Security and equity will sometimes be attempted through government intervention (laws and programs)• Interventions will negatively effect efficiency• Societies must determine if the cost in efficiency is worth the goal

B. Price Ceilings1. In the name of security or equity, equilibrium price is
deemed too high2. A law is passed setting a maximum legal price3. The result will be a ____________4. Examples: rent control, price gouging laws
C. Price Floors1. In the name of security or equity, equilibrium price is
deemed too low2. A law is passed setting a minimum legal price3. The result will be a __________4. Example: minimum wage
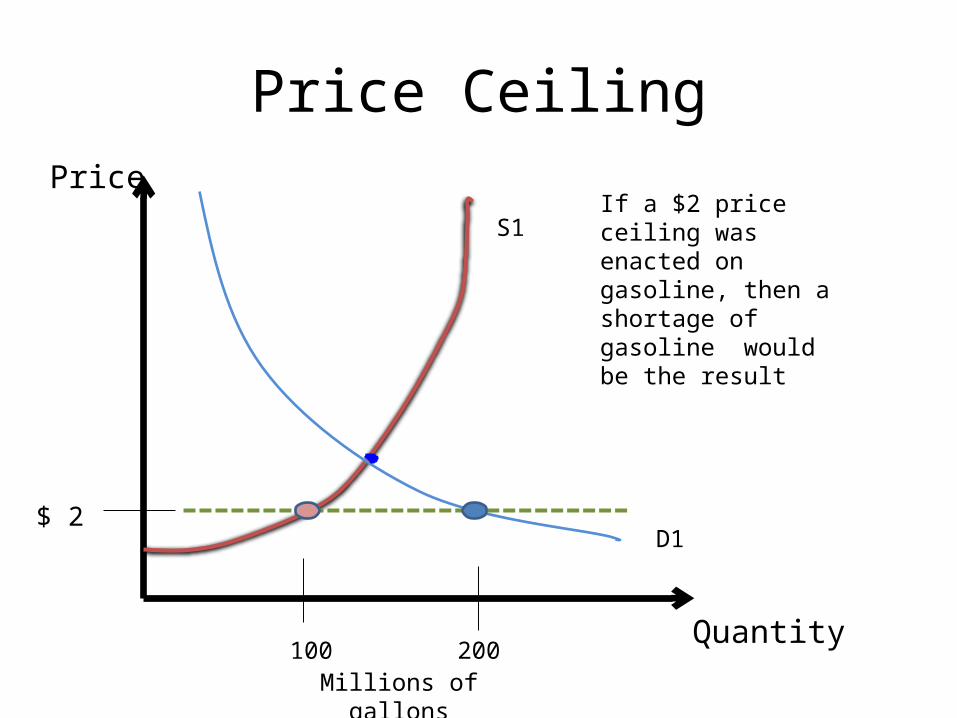
Price CeilingPrice
Quantity
$ 2
100 200
S1
D1
If a $2 price ceiling was enacted on gasoline, then a shortage of gasoline would be the result
Millions of gallons

Price floorPrice
Quantity
$ 8
S1
D1
100 200Thousands of workers
If a $8 minimum wage is enacted, then a surplus of workers would be the result
D. Agricultural Price Supports1. Goal: economic security for farmers2. Loan Supports – farmers borrow money to
operate farm at a target price and then “sell” the surplus to government
3. Deficiency payments – farmers are paid the difference between equilibrium price and target price
4. Opportunity Cost for price supports• Surplus crops (loan supports)• Unused resources (deficiency payments)• Cost to taxpayers for both