Demand Response Valuation...
12
Demand Response Valuation Mechanisms E-CUBE STRATEGY CONSULTANTS APRIL 2010
-
Upload
nguyencong -
Category
Documents
-
view
215 -
download
2
Transcript of Demand Response Valuation...

Demand Response Valuation Mechanisms
E-CUBE STRATEGY CONSULTANTS
APRIL 2010

E-CUBE Strategy Consultants is a rapidly expanding Tier 1 Strategy Boutique focusing on Energy and Environment issues. We combine innovative strategic thinking with deep industry expertise to deliver emphatic business solutions and economic returns. Our expertise covers three main areas:
• Energy: supporting the energy industry (utilities, oil companies) by anticipating and advising on the evolution of its competitive environment: market, regulation, competition and technology
• Eco-strategy: supporting companies from all industries in re-evaluating their strategy to integrate the challenges and opportunities of an environmental “New Deal”
• Eco-business: standing side by side with businesses that create technology, products and services which contribute to a world more environmentally conscious
E-CUBE Strategy Consultants operates globally with offices located in Paris, Munich and Chennai. For more information, please visit www.e-cube.com
PARIS (France)PARIS (France)
MUNICH (Germany)MUNICH (Germany)
CHENNAI (India)CHENNAI (India)
E-CUBE STRATEGY CONSULTANTS
3
APRIL 2010
A ccording to Smart 20201), demand management and smart grid could save close to 8 billion tCO2 worldwide in 2020
to be compared with 29 billion tCO2 emissions in 2007. In a pure power system management perspective, demonstration of demand response benefits has not to be made. The needed communication technologies have been widespread for several years now. In this context, demand response’s large scale deployment seems inevitable on a short term perspective. Then, why aren’t we witnessing a gold rush on this new promising business opportunity? Certainly because, if demand response value is known, its valuation mechanisms are still unclear.
This paper focuses on the demand response (DR) valuation scenarios through the illustrative study of the French case. France was the scene of an early development of DR2) – price strike tariffs and PLC3) pricing signals designed for residential electricity control system (energy manager devices) have been implemented as soon as the eighties. The recent liberalization’s
process shook electricity market’s organization, creating new opportunities and bringing both new entrants and a European perspective to market balancing schemes. This paper puts the rapidly changing French environment in perspective with selected international examples to anticipate DR value flow mechanisms. While specific schemes have been implemented in several electricity markets – PJM and New England ISO in the United States, Greece, Ireland, Spain and Italy in Europe – to incentivize capacity investments (including DR capacity), such schemes are still at an evaluation stage in France; similarly, DR insertion in traditional grid balancing mechanisms requires specific adjustments in processes and in technical and economic selection criteria. Clarification of regulatory frameworks and rules-of-the-game is therefore a preliminary requirement for DR development. Once this clarification achieved (expected end of 2010 in France), potential players will need to understand where the value lies and on which mechanism should their business rely. This paper identifies three main applications for DR – grid investment optimization, grid balancing, generation/supply portfolio optimization – analysing respective value and valuation mechanisms. The last application – generation / supply portfolio optimization – is the sweet spot for the massive development of DR. Where valuation frameworks are yet to be structured (notably in France), the tangible risk of a power system massive failure will drive urgency for new schemes definition: according to RTE (French TSO) and the French Department of Energy, the peak demand could exceed production capacity as soon as 20154). A fact that law-makers certainly bear in mind in their current effort to design a new law organizing the future French Electricity Market.
Demand Response (DR) The term DR covers all mechanisms aimed at managing customer consumption in response to supply conditions or in response to market price. DR schemes are implemented with all market segments (large and small commercials as well as residential customers), often through the use of dedicated control systems to shed loads in response to a request by a utility. Price-based schemes rely on customer shedding loads in response to a price strike signal included in the tariff structure. In some cases, instructions can be communicated through fax, emails or phone calls and require on-site manual operations. DR can involve actual curtailment of power used or starting on-site generation.
1) Smart 2020 is a “The Climate group” 2008 publication on the smart grids based on 25 projects in 10 countries 2) EJP and Tempo tariffs have been respectively introduced in France in 1982 and 1996. These tariffs feature a massive
kWh price increase during 22 days per year to incentivize clients to shed. These tariffs still represent around 2 GW of DR capacity in France
3) Power Line Communication 4) See illustration 1
Demand Response Valuation Mechanisms Abstract

E-CUBE STRATEGY CONSULTANTS
4
APRIL 2010
A s an introduction to its valuation mechanisms, let’s start with DR emergence broad lines. Constant real-
time grid balancing is inerrant to electricity system; if not achieved, it could damage end-users installations or result in massive outages. As in every market mechanism, two natural levers exist, demand and production. However the electricity system is built on an unbalanced philosophy: the production is structured as the only controllable asset and has to cope with a variable demand in any cases. Free of constraints, the demand is highly variable following a day-of-life rhythm; intra-day peaks of consumption exceeded 92 MW in France for a 55 GW average in 2009. Meeting this changing demand creates diseconomy in the electricity system, the grid assets – cables, transformers – have to be oversized, reliability reserves have to be maintained to absorb the variations1) and rarely used peak plants have to be built. Cost optimization on peak generation assets favouring lower investment, it generally results in inefficient, fossil-based and carbon dioxide intensive plants. On top of the environmental
aspects, their energy output cost can be extremely high: Powernext, the French spot market – now EPEXSPOT –, deemed to be
based on the marginal cost of the most expensive plant running, reached its cap price of 3000 €/MWh during four hours in 2009, which is over fifty time the nuclear kWh price. Interestingly enough, all these mechanisms are, for the time-being, almost not reflected on the end-user consumer bill2), tariff structures being essentially static. In this context, four main changes triggered the DR emergence, two evolutions and two revolutions: • The first evolution is the peak consumption
trend: in France, peak consumption increased more than the total consumption – 2% CAGR (Compound Annual Growth Rate) for the peak, compared to 1.5% CAGR on total consumption. The second one is the fossil fuel and carbon dioxide prices increase, which particularly affects the peak production or the balancing assets3) energy cost.
• The first revolution is market liberalization and the unbundling of vertically integrated utilities, questioning the internalization of the balancing externalities between grid
operators, producers, and suppliers. The second is the appearance of the intermittent renewable energy production – expected to
1) On modern grid, energy reserves — from primary reserves (several seconds/minutes) to operating reserves (tenth minutes / hours) — are maintained to secure the grid balancing. These reserve are organized by transmission operators (RTE in France) or system operators (New York ISO, PJM in the United States)
2) With the exception of some industrial clients sourcing part of their consumption on wholesale markets or limited experiments where tariffs reflect sourcing costs during peak period
3) A nuclear plant is a poor contributor to frequency or voltage regulation. Fossil or hydro plants with a low response time are the main contributors
Illustration 1 : Power shortage risk in France by 2015
Demand Response Emergence
Source: RTE
System failure duration [expected value]1)
1.8- - 0.4 4.01.8- - 0.4 4.0Additional required capacity
[GW]2)
20142011 2012 2013 201520142011 2012 2013 2015
5h252h09 2h30 3h33 10h225h252h09 2h30 3h33 10h22
1) System failures considered are these due to unbalance between supply and demand that cannot be tackled by the reserve system; these
failures results in RTE shedding a fraction of clients (without prior consent) to re-establish electric system balance. The expected duration has to be lower than 3h00 on average on all grid clients. The estimation is made considering announced new capacity projects and reference peak consumption
2) Additional capacity required to lower the expected failure duration under 3h00 (assuming expected interconnections exchange sum equal to zero)
Equivalent to one nuclear plant with 3 units

E-CUBE STRATEGY CONSULTANTS
5
APRIL 2010
D R value lies in either reducing the maximum needed power generation base or in providing safety margins to
securely manage the power system. It does not create energy as production assets do; it does not reduce the energy consumption, it just defers it1). However, it can be traded with generation capacity because its contribution to grid balancing is equivalent, though symmetric in its effects. Yet, in some cases, existing valuation mechanisms designed for generation assets would not reflect a fair value for DR capacity. On wholesale power markets, capacity value is integrated in energy prices and their variation over time. However, peak capacity value significantly depends on the asset utilization rate and utilization rates of peak capacity are highly volatile, creating a high degree of uncertainty on revenue generated out of the investment. In a nutshell, most electricity markets are based on energy (kWh) valuation whereas DR value mostly lies on the capacity (kW) made available. This, in addition with possible market imperfections (cap in wholesale market prices), would cause DR value to be blurred. In other cases, valuation mechanisms based on existing electricity markets were not designed to accommodate DR. In France, RTE’s attempt to include DR aggregators’ offers in its balancing market along generation offers resulted in complaints from suppliers against DR aggregators claiming energy value was stolen2).
To understand DR valuation schemes, our approach focuses on three major components of an electricity system – grid investment, grid balancing and generation/supply portfolio optimization – through a business prism confronting the different players – DSO3) & TSO4), ISO5), producers & suppliers – interests and applications.
Grid Investment Optimization The value of DR for DSOs or TSOs mainly lies in reduction or deferral of assets investment. By controlling demand to ensure that it will not exceed a given maximum capacity, a grid operator would be able to postpone investment in existing infrastructures – cables, transformers, feeders and substations – or to optimize new investments sizing. Based on our estimations, T&D investments deferral thanks to DR could represent a value ranging between 10€/kW/year and 15/kW/year in most favourable cases. Nevertheless, DR is scarcely used as a grid investment optimization tool (T&D investment deferral through peak shaving), although alternat ive approaches are already implemented: AEP6) for instance experimented in 2006 a 1 MW NGK Na/S battery as an electricity storage providing daily peak shaving. This investment – estimated between 1.5 and 2.5 M$ with a 15 years lifetime – was used to defer upgrade investment in one ~8MVA feeder
1) In some cases, consumption might decrease by a few percents 2) Mass-market customers are not real time metered. For these “profiled” customers participating to a DR program, their
supplier would inject energy according to their profile but would not be paid for this energy since it was not consumed by their customers. In all cases, coordination between DR aggregators and suppliers is essential, an issue yet to be solved on the French operating reserve market.
3) DSO: Distribution System Operator, maintains and operates the distribution grid - medium and low voltage, usually ranging from several hundred volts to 20kV
4) TSO : Transmission System Operator, maintains and operates the transmission grid— high / very high voltage grid, usually above 20 kV
5) ISO: Independent System Operator. Some regulatory frameworks separate asset ownership and maintenance from actual grid operation (planning, balancing…). This separation is a common framework in the USA with for instance CAISO in California, or New England ISO
6) American Electric Power, one the US largest utilities with a revenue exceeding 14b$, operating 342 000 km of distribution line in Arkansas, Indiana, Kentucky, Louisiana, Michigan, Ohio, Oklahoma, Tennessee, Texas, Virginia, West Virginia
Demand Response Value
represent a significant share of the 20% of the renewable production in 2020 according to the 20/20/20 European commitment. This production cannot be dispatched to meet the demand; on the contrary, it creates new balancing needs.
In addition to these new dynamics, smart meter
programs roll-out will create conditions for DR take-off: smart meters are the missing links facilitating DR implementation for residential and SME market segments by providing information on the effective energy shedding.

E-CUBE STRATEGY CONSULTANTS
6
APRIL 2010
serving ~2000-3000 households. Explanation of this limited use of DR also lies in the grid operators usual missions: on one hand, speaking of purchasing third party DR’s capacity is concerned, DR is definitely accepted for grid balancing. On the other hand, DR is usually not an alternative to grid investment, opex/capex arbitrage depending on the regulatory framework. As far as developing DR capacity in concerned, with the exception of critical situations, TSO missions would not include development of DR programs beyond load shedding programs with large industrials,
through bilateral contracts. In France, to limit the risk of power shortage in Britain (which is a critical “electrical island”), a voluntary residential DR program – Ecowatt – have been rolled-out during winter 2008 and 2009 by RTE, reducing peak-demand by the equivalent of a 4000-inhabitants town. On the long run, although the value created by DR for grid owners is modest, we believe grid investment optimization could become a side application for an already established DR service, especially in the extent that this service can provide geo-localized shedding.
Grid Balancing For an ISO, DR is a critical tool to fulfil its balancing mission. With a massive penetration
of fatal and intermittent production – wind and solar energy – the reserves sizes would have to grow. In Great-Britain, National Grid currently needs ~3.5 GW for all its balancing services, a capacity equivalent to one nuclear plant with 3 units; according to latest estimates, the British TSO would need an additional ~5 GW by 2020. DR could be an answer to those increasing balancing needs requiring no additional investment in power plants. Grid balancing usually relies on several power reserves for different time-scales.
Ancillary services are power and energy reserves designed to secure frequency and voltage regulation which requires short response times – from less than one second to several minutes. In France, more than 600 MW are needed for frequency regulation and more than 700 MW for voltage regulation. This capacity compares to one nuclear unit dispatchable in seconds. Dedicated markets (such as NY ISO) can be organized for different time scales: two reserves called primary and secondary reserves are usually considered. Shorter term reserves usually pay for capacity (vs. energy). Depending on DR mechanism (dedicated control systems or manual operations), DR can be a relevant contributor to short term reserve: PJM integrates DR offers on its “Demand synchronised reserves market”, provided that these offer will guarantee a maximum 10 minutes response.
Illustration 2 : Balancing reserves and response time
Illustration 3 : UK grid balancing reserves requirement by 2020
Rapid tertiary reserve
Reserve refillingRapid tertiary reserve
Reserve refilling
Primary reserve
Frequency regulationPrimary reserve
Frequency regulationTertiary reserves
P&C gap fillingTertiary reserves
P&C gap filling
Response
time
Secondary reserve
Voltage regulationSecondary reserve
Voltage regulation
s min hours
Ancillary services Operating reserves
70%
13%
15%2%
56%
6%
31%
New providers required
1%6%
Interconnection
Generation
Source: National Grid plc
Demand
Storage (Pumped-Hydro)
3.5 GW
8 GW (+ 4.5 GW in 10 years)
2010 : Typical winter UK grid balancing reserve provider breakdown
2020 : Opportunity for new UK grid balancing reserve provider
E-CUBE STRATEGY CONSULTANTS
7
APRIL 2010
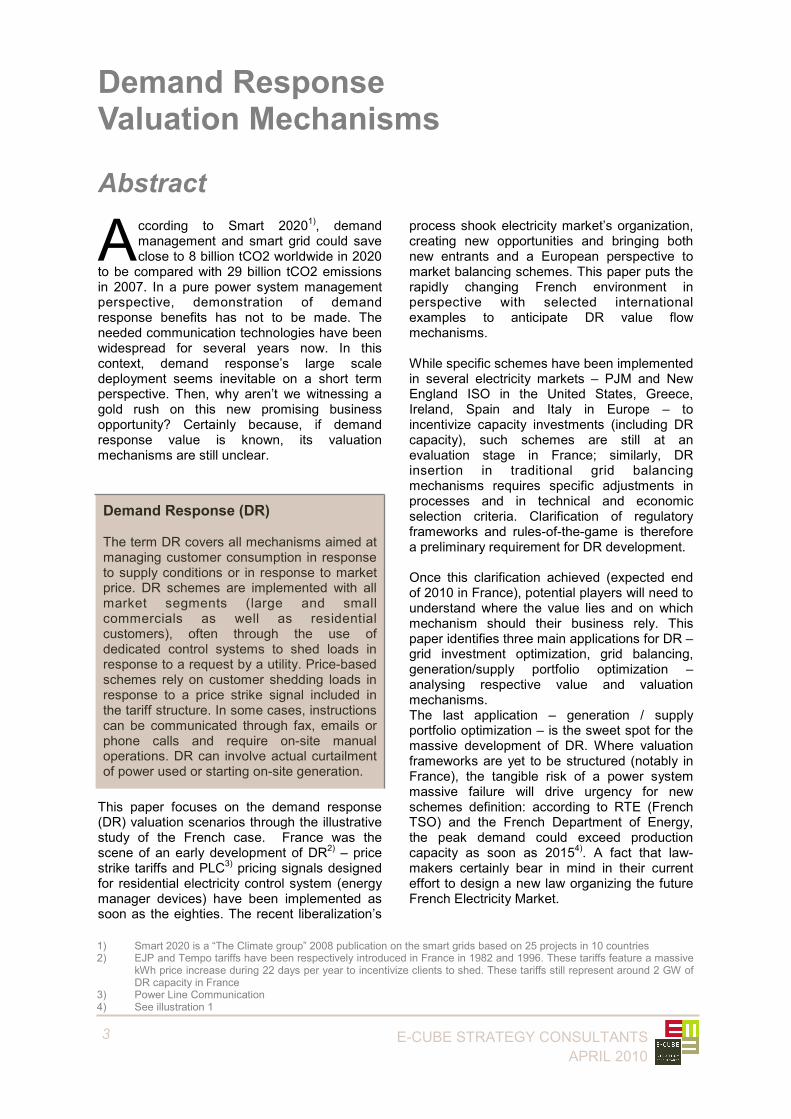
Operating reserves are designed to replenish the ancillary services reserves and to fill the gap between forecasts and actual consumption, with a response time of several minutes (rapid tertiary reserves) to hours (tertiary reserves). These operating reserves were DR’s initial preferred mechanism: load shedding contracts for large industrials were the first mechanisms included on these markets; they often operates as open markets, with public market prices. These markets generally set value on both capacity and energy. In Great Britain, on the Short Term Operating Reserve market (STOR), where both capacity and energy are paid, availability (capacity) revenues are two times higher than energy revenues: capacity revenues on STOR operating reserves market would be around 24€/kW/year according to National Grid. In most cases, the limited size of the operating reserves market (4 TWh in France in 2009 e.g. less than 1% of total generation) and the modest value extracted from this market (we estimate the implicit value of DR capacity to a 20-30 €/kW/year range on French balancing market) will impair capacity of a pure-player aggregator to deliver a sustainable business plan. Nevertheless, operating reserves offer an early-structured market for DR and can be a way to gain experience as well as a first mover advantage.
Generation/Supply portfolio optimization Generation/Supply portfolio optimization is the most promising application for DR. Paradoxically, it is the least developed. Two mechanisms are considered here.
Imbalances minimization is the first one. Uncertainties surrounding demand and generation forecasts and contingencies can
result in discrepancies between extractions and injections on your perimeter. These discrepancies are known as imbalances. These imbalances result in penalties paid by Suppliers / Generators to the System Operator. DR can be a lever to minimize these penalties enabling real-time adjustment in demand to match injections. Optimization of the average sourcing cost is the second one. For an electricity supplier, DR is a way to create a correlation between generation costs (if integrated), or sourcing costs (if not), and revenues. Indeed, retail energy prices are generally fixed, or have limited time-related amplitude whereas sourcing and generation costs can double between off-peak and peak periods in the very same day. This issue is particularly acute during peak consumption when very high marginal cost peak plants are used. Our estimations, based on the yearly benefits of a peak gas combustion turbine investment deferral, ranges between 40 and 70 €/kW/year in Europe (at current CO2 prices) for the peak capacity value. The capacity to create a correlation between revenues and generation costs at an individual customer level depends on the capacity to actually measure its load curve; thus, profiling mechanisms on the mass market customer segment – when & where smart meters have not been rolled-out – will interfere with the potential value that can be extracted. A side benefit of DR, beyond additional flexibility in upstream/downstream portfolio optimization, lies in its capacity to drive new competitive dynamics: DR will be embedded in new pricing schemes and services, creating market differentiation among electricity suppliers.
Source: ISO-NE
Generation
Demand
Import
Generation
Demand
Import
ISO-NE capacity auctions cleared resources [MW]
6.7% of capacity resources provided by demand
2010/2011 (Resources types)
32.208
2.778
2.298
37.284
2011/2012
934
2.279
30.865
34.078
7.5% of capacity resources provided by demand
Existing
2010/2011 (existing / new)
33.178
40
34.078
860
96% of new resources provided by demand
New(breakdown by type)
Illustration 4 : DR weight in NE ISO capacity auctions
E-CUBE STRATEGY CONSULTANTS
8
APRIL 2010
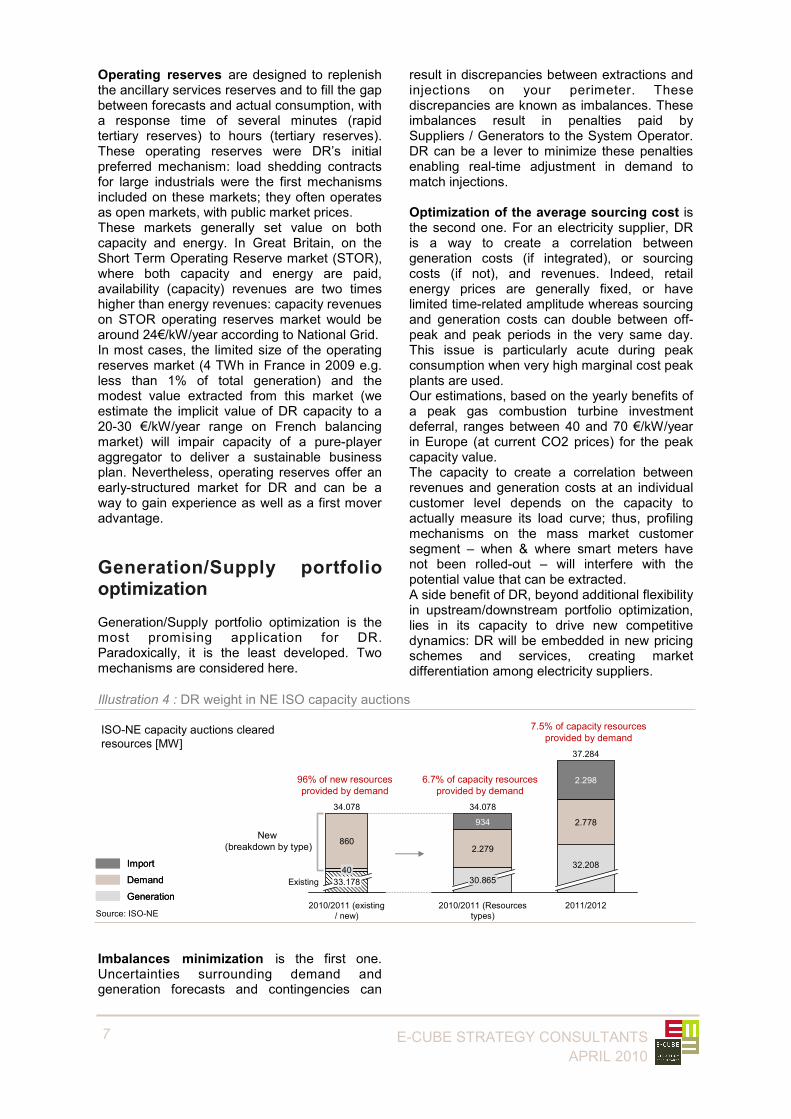
D R capacity’s development is not only driven by economic optimization; this capacity will be critical to maintain
system security of supply. For instance in France, DR installed capacity dropped from 6 GW in 1999 before market opening to ~3 GW in 2009. This erosion is caused by multiple factors. Environmental regulation restricted use of backup generators for load shedding. Market competition transferred large consumers from regulated tariffs – including DR features – into open market pricing schemes that would not include these features. The low profitability of regulated DR-embedded tariffs also caused the incumbent to limit or cease commercialisation in some cases. This dramatic decrease of the power system flexibility will drive public policies and adoption of clarified valuation frameworks: articulation of DR with profiling mechanism, while Automatic Meter Management program has not been rolled-out, typically requires public arbitrage. Competition access to regulated “time-of-use” tariffs, DR embedded tariffs, under profitable conditions, is another possible arbitrage. Other policies will be considered such as setting “flexible” capacity obligations on producers or suppliers, organizing a dedicated capacity market or states tenders for peak capacity in critical areas – such as islands for instance. A capacity obligation for producers or suppliers would create a OTC (bilateral-contract) market between the producers or suppliers and DR service providers. The obligation levels would be set to guarantee the electricity supply during peak consumption. This obligation would most likely be imposed on the suppliers since producers can chose to specialize on certain types of assets for
efficiency reasons or operate on international markets, making it harder to implement such an obligation. Obligations levels would probably be calibrated on volume of energy supplied to customers or on customers aggregated peak demand, although more complex rules could be designed. Such obligations could be enforced on a short term perspective as a response to the increasing power shortage risk. In France, the current workgroup initiated by the Energy and Environment Department (MEEDDM), in charge of proposing solutions for peak demand issues, could pave the path to such obligations. Capacity markets, organized by a central authority like an ISO are an alternative to obligations. At a System Operator level, matching generation and supply on a long term time-scale requires sending the good “price signal” to trigger investment in relevant infrastructures. Unfortunately, for peak capacity, price signal is blurred: prices are high on average but volatile and plant utilization rate is limited and very uncertain. Investors do not receive enough incentive to take the risk. In some systems, the imbalance penalty being capped, the supplier / producer optimization may not always economically justify enough generation investments to cope with peak demand. To answer this issue, Authorities can organize capacity markets to finance all capacity in order to guarantee peak supply. Such organized capacity markets are already existing in the US, featuring a significant contribution of DR programs.
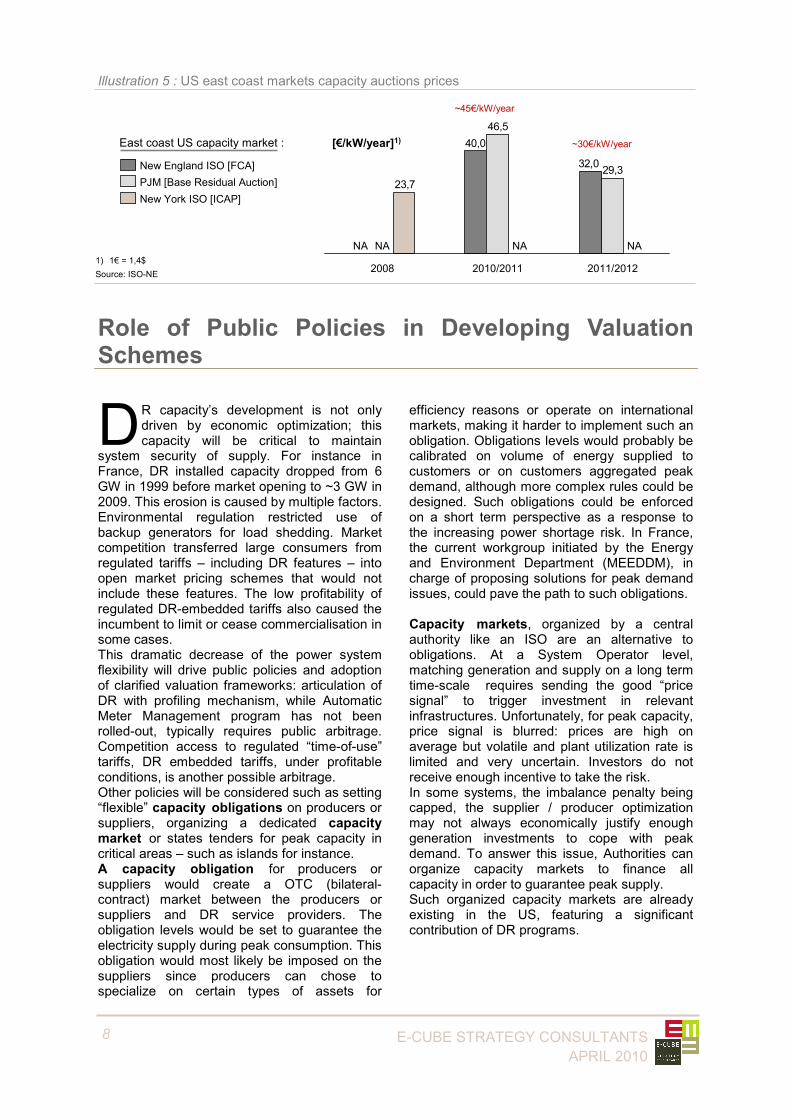
32,0
40,0
29,3
46,5
23,7PJM [Base Residual Auction]
NA
New York ISO [ICAP]
New England ISO [FCA]
2011/2012
NA
2010/2011
NA
2008
NA
Source: ISO-NE
~30€/kW/year
~45€/kW/year
East coast US capacity market : [€/kW/year]1)
1) 1€ = 1,4$
Illustration 5 : US east coast markets capacity auctions prices
Role of Public Policies in Developing Valuation Schemes

E-CUBE STRATEGY CONSULTANTS
9
APRIL 2010
Demand Response Perspectives: Key Take-Aways
I f the regulatory context is not yet always fully set, the outlines are. Stakeholders should already be prepared to seize DR
opportunities: valuation schemes should be structured on a short term perspective, driven by the necessity to anticipate potential failures of electricity systems. One of the difficulty to set-up valuation schemes for DR derives from the fact that most electricity markets are based
on energy (kWh) valuation as opposed to capacity (kW) valuation: examples in several countries suggest possible frameworks to solve this issue. Three major DR applications will offer different opportunities, the first one being the most attractive: • Generation/Supply Portfolio Optimization will
be the DR main application with a significant valuation that could reach 40-70 €/kW/year. Such a market would create a massive dynamic for DR and make some DR
technologies profitable like Diffuse Residential Demand Response. Beyond producer/supplier internal optimization, a new regulatory context will probably emerge to set the rules in order to guarantee the peak supply on a short/medium term perspective. It will either take the shape of a capacity obligation set on suppliers, creating a bilateral contract market that could be organized afterwards, or take
the shape of a capacity market organized by an ISO.
• Grid balancing is an early structured market,
tough DR valuation rules are not always clear. Even if capacity prices are lower on operating reserves markets – around 20-30 €/kW/year – it will at least generate some revenues for first movers and allow aggregators to gain experience on their customers DR potentials and behaviours. Frequency and voltage regulation market could also be an interesting market for specific DR provider with a very low response time.
Illustration 6 : DR valuation perspectives
Valuation Mechanism
Producer/Supplier
internal optimization
Organized open capacity
market
Capacity obligation for
suppliers creating a bilateral contract market
Operating reserves
market
Local tenders
Ancillary services
Examples and comments
Two mechanisms: imbalances and average sourcing cost minimization -
New perspectives introduced by smart meters
Already existing in the US (ex : ISO-NE, PJM) and several European
countries, in discussion in France for a medium term deployment
Short term deployment currently considered in France - this could
create a massive bilateral contract market
Several already existing operating reserves markets (ex : UK, US, France), rules for DR entry are
currently being structured
Limited to local tenders organized by grid operators. Market potentially
driven by smart grid developments
Market limited to fast response DREither an open market operated by an ISO (ex: NYISO) or a closed market
(ex : France).
Client
Balance Responsible
Party2)
DSO or TSO
System Operator1)
Client
Balance Responsible
Party2)
DSO or TSO
System Operator1)
Grid investment optimization
Grid balancing
Generation/Supply
PortoflioOptimization3)
Grid investment optimization
Grid balancing
Generation/Supply
PortoflioOptimization3)
Valuation
40-70€/kW/year
10-15€/kW/year
20-30€/kW/year
Valuation
40-70€/kW/year
10-15€/kW/year
20-30€/kW/year
40-70€/kW/year
10-15€/kW/year
20-30€/kW/year
Sweet spot
Marginal revenues
Early limited revenues for first movers
Applications
1) Independent System Operator (ISO) or Transmission System Operator (TSO)2) Supplier or Integrated Producer + Supplier3) On a system level for System Operators (generation portfolio = total installed national capacity) or at the perimeter of a Balance Responsible Party
4) Smart meters enabling price strike and new time-based tariff-schemes
Market size
10-20% of total
generation capacity
Very limited
1-5% of total
generation capacity
Market size
10-20% of total
generation capacity
Very limited
1-5% of total
generation capacity
10-20% of total
generation capacity
Very limited
1-5% of total
generation capacity
Source: E-Cube Strategy Consultants analysis

E-CUBE STRATEGY CONSULTANTS
10
APRIL 2010
• Grid investment optimization valuation would generally not justify DR development alone but could be an interesting marginal revenues source for an already existing DR.
If DR robust valuation schemes are necessary for new entrants to secure a sustainable business model, they are also critical for historical energy players in a no-more
integrated and competitive market. Attention should be paid, though, to competition among DR mechanisms: the same potential capacity can not be seized (and valued) simultaneously
through multiple mechanisms (price strike and dynamic DR mechanisms for instance).
New Players in DR
DR, and more specifically diffuse DR requires a communication and data management expertise that energy player might not have. Diffuse DR means communication with home appliances and customers that could require a close real-time data management. Cisco estimates the so-called “Internet of things” to be bigger than the internet itself; DR is a major part of it. It represents a new opportunity for IT and Telco players to leverage their expertise and experience of the Internet revolution. Telco might also see a synergy between selling minutes or mega bytes and selling kWh, DR being a perfect gateway. For historical energy players, and mainly for electricity suppliers, this could represent a customer disintermediation risk and be another incentive to build a strong position on DR.
About the author Nicolas Charton is a consultant in E-CUBE’s Paris office. If you would like more information on this report you may contact him by e-mail at [email protected]

E-CUBE STRATEGY CONSULTANTS
11
APRIL 2010
© Copyright 2010 E-CUBE Strategy Consultants Do not reproduce or distribute without the prior written permission of
E-CUBE Strategy Consultants

www.e-cube.com
Plot 64, 2nd link street, Nehru Nagar, O.M.Road, Thiruvanmiyur, Chennai – 600 041 INDIA+91 (0) 98 4033 1364
5 rue de Castiglione, 75001 ParisFRANCE+33 (0)1 53 45 27 61
Kaiserstrasse 2 80801 MunichGERMANY+44 (0) 1716547012
PARIS - MUNICH - CHENNAI