DEMAND RESPONSE MARKET OVERVIEW AND ROLE OF LIGHTING
30
DEMAND RESPONSE MARKET OVERVIEW AND ROLE OF LIGHTING 2020 DOE LIGHTING R&D WORKSHOP JANUARY 30, 2020
Transcript of DEMAND RESPONSE MARKET OVERVIEW AND ROLE OF LIGHTING

/ ©2020 NAVIGANT CONSULTING, INC., N/K/A GUIDEHOUSE, INC. ALL RIGHTS RESERVED1
DEMAND RESPONSE MARKET OVERVIEW AND ROLE OF LIGHTING2020 DOE LIGHTING R&D WORKSHOP
JANUARY 30, 2020

/ ©2020 NAVIGANT CONSULTING, INC., N/K/A GUIDEHOUSE, INC. ALL RIGHTS RESERVED2
TOPICS
• Demand Response Definition
• Demand Response Market Overview and Role of Lighting
• Challenges and Opportunities

/ ©2020 NAVIGANT CONSULTING, INC., N/K/A GUIDEHOUSE, INC. ALL RIGHTS RESERVED3
DEMAND RESPONSE (DR)
DEFINTION
/ ©2020 NAVIGANT CONSULTING, INC., N/K/A GUIDEHOUSE, INC. ALL RIGHTS RESERVED4
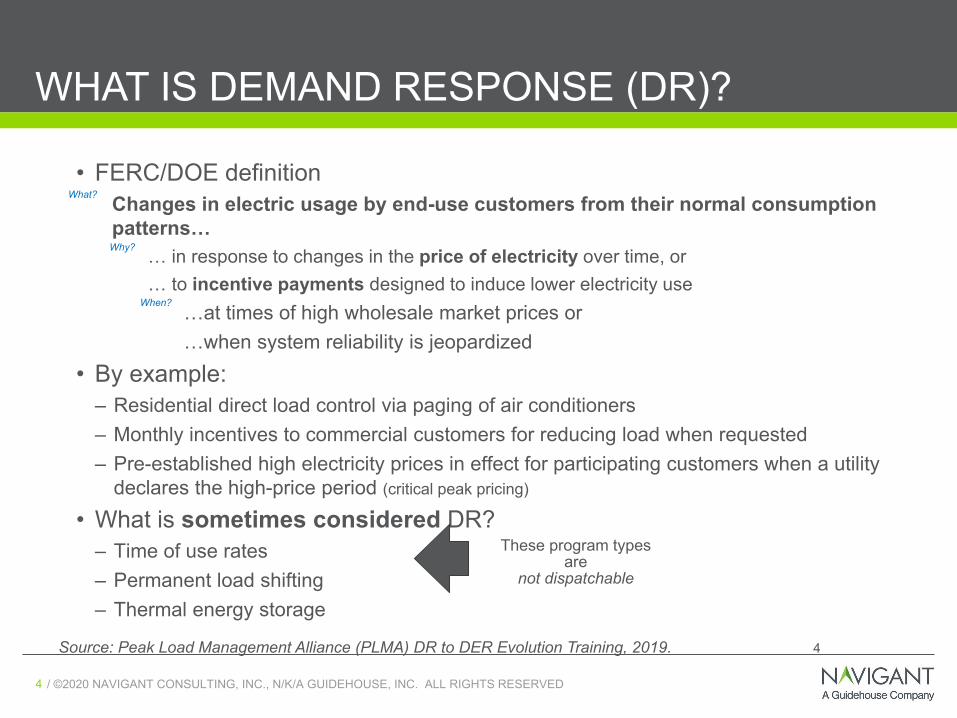
WHAT IS DEMAND RESPONSE (DR)?
• FERC/DOE definitionChanges in electric usage by end-use customers from their normal consumption patterns…
… in response to changes in the price of electricity over time, or … to incentive payments designed to induce lower electricity use
…at times of high wholesale market prices or …when system reliability is jeopardized
• By example:– Residential direct load control via paging of air conditioners– Monthly incentives to commercial customers for reducing load when requested– Pre-established high electricity prices in effect for participating customers when a utility
declares the high-price period (critical peak pricing)
• What is sometimes considered DR?– Time of use rates– Permanent load shifting– Thermal energy storage
When?
Why?
What?
These program types are
not dispatchable
4Source: Peak Load Management Alliance (PLMA) DR to DER Evolution Training, 2019.

/ ©2020 NAVIGANT CONSULTING, INC., N/K/A GUIDEHOUSE, INC. ALL RIGHTS RESERVED5
“SIMPLE” DR & EE DEFINITIONS
Both DR and EE reduce load, but
Energy Efficiency is a permanent change in energy consumption,
generally with no decrease in service level.
Demand Response is a temporary change in energy consumption, generally with
some decrease in service level (e.g., less comfortable climate,
sub-optimal lighting).
5
Source: Peak Load Management Alliance (PLMA) DR to DER Evolution Training, 2019.
/ ©2020 NAVIGANT CONSULTING, INC., N/K/A GUIDEHOUSE, INC. ALL RIGHTS RESERVED6
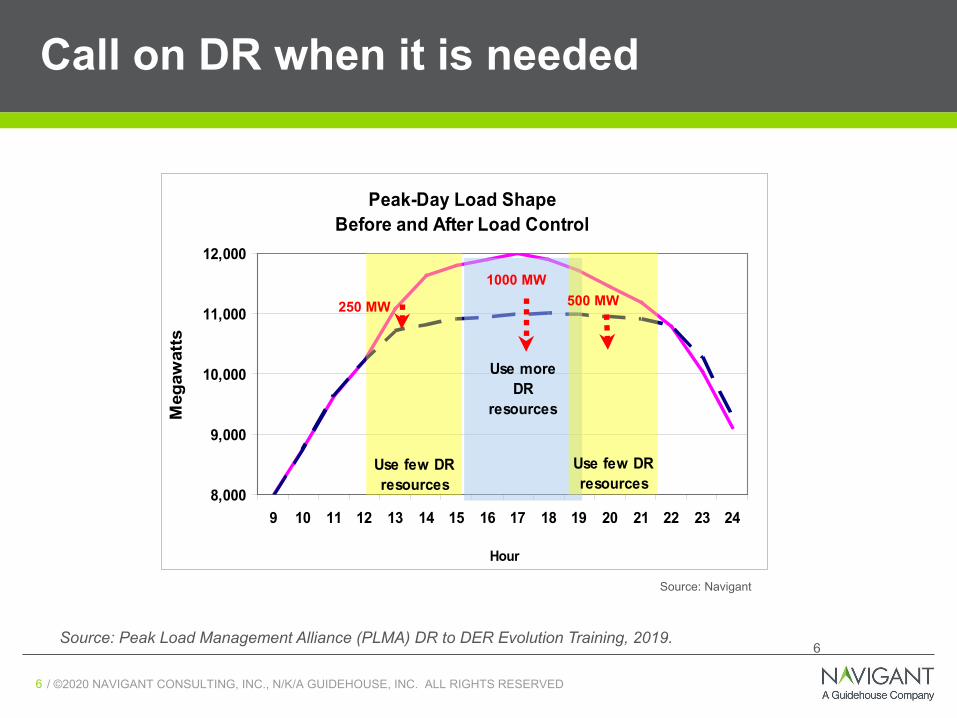
Peak-Day Load Shape Before and After Load Control
8,000
9,000
10,000
11,000
12,000
9 10 11 12 13 14 15 16 17 18 19 20 21 22 23 24
Hour
Meg
awat
ts
Use few DR resources
Use more DR
resources
Use few DR resources
1000 MW
Source: Navigant
500 MW250 MW
Call on DR when it is needed
6Source: Peak Load Management Alliance (PLMA) DR to DER Evolution Training, 2019.

/ ©2020 NAVIGANT CONSULTING, INC., N/K/A GUIDEHOUSE, INC. ALL RIGHTS RESERVED7
DEMAND RESPONSE MARKET OVERVIEW &
ROLE OF LIGHTING

/ ©2020 NAVIGANT CONSULTING, INC., N/K/A GUIDEHOUSE, INC. ALL RIGHTS RESERVED8
NATIONAL MARKET OVERVIEW: 2018 DR CAPACITY
PEAK DEMAND SAVINGS FROM RETAIL DEMAND RESPONSE PROGRAMS
Source: “2019 Assessment of Demand Response and Advanced Metering”; Federal Energy Regulatory Commission Staff Report, December 2019

/ ©2020 NAVIGANT CONSULTING, INC., N/K/A GUIDEHOUSE, INC. ALL RIGHTS RESERVED9
WHOLESALE MARKET DEMAND RESPONSE CAPACITY

/ ©2020 NAVIGANT CONSULTING, INC., N/K/A GUIDEHOUSE, INC. ALL RIGHTS RESERVED10
COMMON APPLICATIONS OF DEMAND RESPONSE
• Curtailment when called by utility or grid operator for system stability
• Common, proven application for reliabilityCapacity Resource/
Emergency Response
• Curtailment called for high market prices or to avoid starting a new unit
• Application for cost savingsEconomic DR
• Operator dispatch for short term relief/ operating reserves, balancing renewables
• Automated response to grid conditions or price signals.
Active Management /Grid Responsive
Source: Navigant 10
Source: Peak Load Management Alliance (PLMA) DR to DER Evolution Training, 2019.

/ ©2020 NAVIGANT CONSULTING, INC., N/K/A GUIDEHOUSE, INC. ALL RIGHTS RESERVED11
TYPES OF DR PROGRAMS
190 utilities responded to SEPA’s 2019 annual Utility Survey:
• Enrolled DR capacity: 20.8 GW
• Dispatched DR capacity: 12.3 GW
Source: “2019 Utility Demand Response Market Snapshot “, presented by Smart Electric Power Alliance (SEPA) at 40th PLMA Conference, November 2019.

/ ©2020 NAVIGANT CONSULTING, INC., N/K/A GUIDEHOUSE, INC. ALL RIGHTS RESERVED12
2018 DEMAND RESPONSE ENROLLED CAPACITY
Top States:1. Florida - 2,911.4 MW
2. California - 1,335.4 MW
3. North Carolina - 1,319.8 MW
4. Maryland - 1,212.8 MW
5. Illinois - 1,146.5 MW
Source: “2019 Utility Demand Response Market Snapshot “, presented by Smart Electric Power Alliance (SEPA) at 40th PLMA Conference, November 2019.

/ ©2020 NAVIGANT CONSULTING, INC., N/K/A GUIDEHOUSE, INC. ALL RIGHTS RESERVED13
NATIONAL MARKET OVERVIEW: 2018 DR CAPACITY
CONTRIBUTION IN DEMAND RESPONSE BY CUSTOMER SECTOR
Source: Based on data in the “2019 Assessment of Demand Response and Advanced Metering”; Federal Energy Regulatory Commission Staff Report, December 2019”
Residential, 29%
Commercial, 22%
Industrial, 49%
DEMAND RESPONSE CONTRIBUTION BY CUSTOMER SECTOR (MW)

/ ©2020 NAVIGANT CONSULTING, INC., N/K/A GUIDEHOUSE, INC. ALL RIGHTS RESERVED14
2018 COMMERCIAL AND INDUSTRIAL DR CAPACITY BY PROGRAM TYPE (GW)

/ ©2020 NAVIGANT CONSULTING, INC., N/K/A GUIDEHOUSE, INC. ALL RIGHTS RESERVED15
TYPES OF END-USES CONTROLLED IN C&I DR PROGRAMS

/ ©2020 NAVIGANT CONSULTING, INC., N/K/A GUIDEHOUSE, INC. ALL RIGHTS RESERVED16
DEMAND RESPONSE EVOLUTION
• Largely manual control
• Interruptible tariffs for large C&I
• 1-way Direct Load Control for Residential
• Used for Capacity Planning & Emergencies
• Introduced To Wholesale Markets
• Increased automation• Increased Precision• Eventually Ancillary
Services• Behavioral/voluntary
Options• Smarter Equipment• 2-way communications• Some Near Real-Time
Visibility
• Provide Multiple Grid Services
• Respond to Controls and/or Price Signals
• Distribution & Transmission Relief
• Introduction of Storage
• Migration to DER
16

/ ©2020 NAVIGANT CONSULTING, INC., N/K/A GUIDEHOUSE, INC. ALL RIGHTS RESERVED17
A RECENT SURVEY REVEALS DR AMONG THE MOST USEFUL DER FOR UTILITY OPERATIONS
Which DER will be the most useful to utility operations by
2025?
Which will be the most prevalentDER in terms of capacity by
2025?
Source: Navigant Consulting, Inc. Public Utilities Fortnightly. July 2017. State & Future of thePower Industry. https://www.Navigant.com/new/corporate-news/2017/state-and-future-of-power-industry-2
Solar is expected to be the most
prevalent DERDR is
expected to be the most useful DER
17

/ ©2020 NAVIGANT CONSULTING, INC., N/K/A GUIDEHOUSE, INC. ALL RIGHTS RESERVED18
DEMAND RESPONSE – ITS “FAST EE” FOR THE GRID
8
LINKING ENERGY EFFICIENCY AND DEMAND RESPONSE

/ ©2020 NAVIGANT CONSULTING, INC., N/K/A GUIDEHOUSE, INC. ALL RIGHTS RESERVED19
DEMAND RESPONSE SERVICE TYPES
Source: 2025 California Demand Response Potential Study, Final Study Results; LBNL, 2017

/ ©2020 NAVIGANT CONSULTING, INC., N/K/A GUIDEHOUSE, INC. ALL RIGHTS RESERVED20
TIME SCALES FOR DR SERVICES
Source: 2025 California Demand Response Potential Study, Final Study Results, LBNL , 2017.

/ ©2020 NAVIGANT CONSULTING, INC., N/K/A GUIDEHOUSE, INC. ALL RIGHTS RESERVED21
LIGHTING SHOWS SIGNIFICANT CONTRIBUTION IN DR POTENTIAL ESTIMATES
Source: 2025 California Demand Response Potential Study, Final Study Results, LBNL, 2017.

/ ©2020 NAVIGANT CONSULTING, INC., N/K/A GUIDEHOUSE, INC. ALL RIGHTS RESERVED22
AUTOMATED DEMAND RESPONSE & OPENADR
What is Automated DR?• Automated Demand Response (Auto-DR) consists of fully automated signaling from
a utility, Independent System Operator (ISO), Regional Transmission Operator (RTO) or other appropriate entity to provide automated connectivity to customer end-use control systems, devices and strategies.
What is OpenADR™?• Open Automated Demand Response (OpenADR) is an open and interoperable
information exchange model and emerging Smart Grid standard. OpenADR standardizes the message format used for Auto-DR so that dynamic price and reliability signals can be delivered in a uniform and interoperable fashion among utilities, ISOs, and energy management and control systems. While previously deployed Auto-DR systems are automated, they are not standardized or interoperable.Source: OpenADR Alliance, https://www.openadr.org/

/ ©2020 NAVIGANT CONSULTING, INC., N/K/A GUIDEHOUSE, INC. ALL RIGHTS RESERVED23
AUTOMATED DEMAND RESPONSE REQUIREMENTS IN BUILDING CODES
California Title 24 2016 Section 130.1(e)Demand Responsive Controls—Lighting and Automation• In buildings larger than 10,000 square feet, total lighting power shall be capable of being
automatically reduced by a demand response signal by at least 15%. • Lighting reduction shall be uniform. • Non-habitable spaces do not count toward this requirement• Spaces with less than 0.5 watts per square feet shall not count toward total power• Demand response controls and equipment shall be capable of receiving and automatically
responding to at least one standards-based messaging protocol.
OpenADR Requirements in City of Austin building codes (starting late 2016) for newly constructed buildings or facilities.Excerpts from the code:• “ C405.2.6 Demand response. For all buildings having central control of a) lighting levels and/or b)
the ability to turn on and off individual lamps, the controls shall have the capability to reduce lighting level in response to signals, based on OpenADR 2.0 or higher protocols, from a centralized contact or software point. Controls may be programmed to provide either an automatic or an operator adjustable degree of lighting reduction.”

/ ©2020 NAVIGANT CONSULTING, INC., N/K/A GUIDEHOUSE, INC. ALL RIGHTS RESERVED24
OPENADR CERTIFIED LIGHTING PRODUCTS EXAMPLES
Source: OpenADR Alliance, https://www.openadr.org/
/ ©2020 NAVIGANT CONSULTING, INC., N/K/A GUIDEHOUSE, INC. ALL RIGHTS RESERVED25
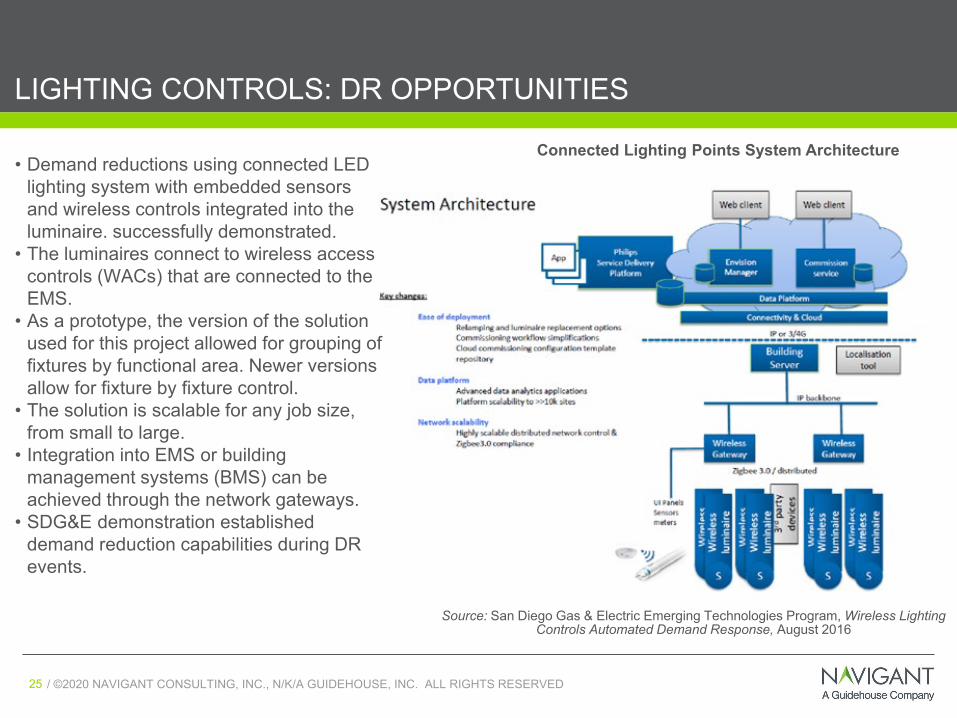
LIGHTING CONTROLS: DR OPPORTUNITIES
Connected Lighting Points System Architecture
Source: San Diego Gas & Electric Emerging Technologies Program, Wireless Lighting Controls Automated Demand Response, August 2016
• Demand reductions using connected LED lighting system with embedded sensors and wireless controls integrated into the luminaire. successfully demonstrated.
• The luminaires connect to wireless access controls (WACs) that are connected to the EMS.
• As a prototype, the version of the solution used for this project allowed for grouping of fixtures by functional area. Newer versions allow for fixture by fixture control.
• The solution is scalable for any job size, from small to large.
• Integration into EMS or building management systems (BMS) can be achieved through the network gateways.
• SDG&E demonstration established demand reduction capabilities during DR events.

/ ©2020 NAVIGANT CONSULTING, INC., N/K/A GUIDEHOUSE, INC. ALL RIGHTS RESERVED26
DEPLOYMENT CHALLENGES AND OPPORTUNITIES

/ ©2020 NAVIGANT CONSULTING, INC., N/K/A GUIDEHOUSE, INC. ALL RIGHTS RESERVED27
TECHNOLOGY DEPLOYMENT DRIVERS
Customer Awareness &
Value Proposition
Market/Regulatory Conditions
Standards & Interoperability

/ ©2020 NAVIGANT CONSULTING, INC., N/K/A GUIDEHOUSE, INC. ALL RIGHTS RESERVED28
COSTS AND ENERGY BENEFITS FROM NETWORKED LIGHTING CONTROLS
• Energy-only cost-effectiveness of demand response-enabled lighting systems varies by building size and service territory.
• In Pacific Gas & Electric Company’s service territory, where commercial retail electricity rates are relatively high (especially on peak), there is a net benefit across all building sizes and types.
• In contrast, in Southern California Edison’s service territory where electricity rates are lower, the cost-effectiveness depends strongly on the building size, with a net benefit for large buildings only.
• The results for the San Diego Gas & Electric Company’s service territory are somewhere between these two cases.
• Primary value proposition for demand response-enabled networked lighting controls comes from the site-level energy savings that are realized with or without demand response participation.
Source: “The Value Proposition for Cost-Effective, Demand Responsive-Enabling, Nonresidential Lighting System Retrofits in California Buildings”, CEC, April 2019.

/ ©2020 NAVIGANT CONSULTING, INC., N/K/A GUIDEHOUSE, INC. ALL RIGHTS RESERVED29
CUSTOMER VALUE PROPOSITION OF NETWORKED LIGHTING CONTROLS: QUANTIFICATION OF NON-ENERGY BENEFITS
• Recent study by the Lawrence Berkeley National Lab (sponsored by the California Energy Commission) developed a framework to capture the high customer values from Networked Lighting Controls (NLC) non-energy benefits to drive DR adoption.
Source: “The Value Proposition for Cost-Effective, Demand Responsive-Enabling, Nonresidential Lighting System Retrofits in California Buildings”, CEC, April 2019.
The study reviewed more than 130 networked lighting control case studies to quantify the non-energy benefits and develop a benefits value intensity model that captures the energy and non-energy benefits related to building, people and revenue

/ ©2020 NAVIGANT CONSULTING, INC., N/K/A GUIDEHOUSE, INC. ALL RIGHTS RESERVED30
CONTACT
DEBYANI GHOSHAssociate Director415.399.2128debyani.ghosh@guidehouse.comwww.guidehouse.com