Demand Response Market Assessment - michigan.gov · PUBLICSECTORCONSULTANTS.COM MPSC DEMAND...
52
Demand Response Market Assessment Michigan Public Service Commission 09.29.17
Transcript of Demand Response Market Assessment - michigan.gov · PUBLICSECTORCONSULTANTS.COM MPSC DEMAND...
Demand Response Market Assessment Michigan Public Service Commission
09.29.17

Prepared by
Public Sector Consultants Lansing, Michigan www.publicsectorconsultants.com with Navigant Consulting www.navigant.com
Prepared for
Michigan Public Service Commission Lansing, Michigan www.michigan.gov/mpsc

TABLE OF CONTENTS
TABLE OF CONTENTS ..................................................................................................................................................... 3
EXECUTIVE SUMMARY ................................................................................................................................................... 4
LARGE COMMERCIAL AND INDUSTRIAL CUSTOMER BASE ............................................................................................ 6
SAMPLING APPROACH ................................................................................................................................................... 7
SURVEY SUMMARY ........................................................................................................................................................ 8
Survey Design ................................................................................................................................................................ 8
Survey Response ........................................................................................................................................................... 9
Survey Results ............................................................................................................................................................. 10
Program Awareness and Participation ........................................................................................................................... 10
Program Preferences ...................................................................................................................................................... 11
Sensitivity to Program Parameters .................................................................................................................................. 14
Enabling Technologies.................................................................................................................................................... 15
Factors Influencing Participation in Demand Response................................................................................................. 17
Participation Costs and Sufficiency of Incentive Levels .................................................................................................. 18
INTERVIEW SUMMARY ................................................................................................................................................. 19
Key Takeaways ............................................................................................................................................................ 19
Program Preferences ................................................................................................................................................... 20
Customer Capabilities and Technology ....................................................................................................................... 21
Customer Motivators and Barriers to Participation....................................................................................................... 21
Energy Efficiency and Demand Response ................................................................................................................... 23
Opportunities for Demand Response for Agricultural Customers ................................................................................ 23
INPUTS TO THE DEMAND RESPONSE POTENTIAL STUDY ............................................................................................ 23
CONCLUSIONS ............................................................................................................................................................. 24
RECOMMENDATIONS.................................................................................................................................................... 25
APPENDIX A: NAICS CODES ....................................................................................................................................... A-1
APPENDIX B: SURVEY INSTRUMENT .......................................................................................................................... B-1
APPENDIX C: INTERVIEW GUIDE ................................................................................................................................ C-1

MPSC DEMAND RESPONSE MARKET ASSESSMENT PUBLICSECTORCONSULTANTS.COM 4
EXECUTIVE SUMMARY The Michigan Public Service Commission (MPSC) enlisted Public Sector Consultants (PSC), in
partnership with Navigant Consulting (Navigant), to conduct a market assessment with large commercial
and industrial (LCI) businesses in Michigan and determine awareness of and interest in demand response
(DR) programs. DR programs provide an “opportunity for customers to play a significant role in the
operation of the electric grid by reducing or shifting their electricity usage during peak periods in response
to time-based rates or other forms of financial incentives.”1
PSC and Navigant (herein referred to as the research team) conducted surveys and in-depth interviews
with business entities having loads over 1 megawatt (MW). These LCIs include manufacturing
establishments, educational and healthcare institutions, shopping malls and entertainment venues,
municipal governments, property management companies, and other entities throughout the state.
The purpose of this market assessment was two-fold: 1) to inform key inputs to the State of Michigan
Demand Response Potential Study by Applied Energy Group, which was conducted concurrently with this
research and 2) to provide important insights that will help guide policy and program development that
encourage LCI participation in programs supporting the efficient operation of Michigan’s electric system.
Through the survey and interviews, the research team found that over half of these LCIs would be willing
and able to participate in DR programs and, depending on the program design, would be able to reduce
load by 5 to 35 percent during periods of peak demand on the electric system.
The research team worked with the utilities, the Michigan Agency for Energy (MAE), and the MPSC to
gather contact information and reach out to LCI energy users, encouraging participation in the market
assessment. In all, 52 surveys and 14 in-depth interviews were conducted with organizations representing
key business segments or industry types in Michigan. The surveys and interviews covered topics
including:
Characteristics of LCI operations in Michigan
Awareness of and experience participating in DR programs
Preference for different program design features and impact on ability to curtail peak period load
Adoption of technologies that could enable participation in DR programs, including energy
management systems, storage, and onsite generation
The research team found that over 80 percent of LCIs are aware of DR programs, and of the survey
respondents, most had heard of DR from their current utility provider. Of the respondents, 32 percent
were participating in Michigan DR programs (including interruptible rates), 18 percent had or were
participating in programs outside of Michigan, and half had not participated in a program. LCIs that had
some experience with DR were far more likely to indicate willingness to participate in future programs.
Most respondents indicating willingness and ability to participate in DR programs reported being able to
reduce their energy consumption during a DR response event between 5 and 35 percent; however, some
very large customers were able to reduce loads by as much as 60 percent if needed for grid stabilization.
1 U.S. Department of Energy. n.d. “Demand Response.” Office of Electricity Delivery and Energy Reliability. Accessed September 1, 2017. https://energy.gov/oe/activities/technology-development/grid-modernization-and-smart-grid/demand-response
PUBLICSECTORCONSULTANTS.COM MPSC DEMAND RESPONSE MARKET ASSESSMENT 5
Many of these very large customers are part of emergency curtailment programs or interruptible rate
tariffs currently offered by Michigan utilities. Programs that provide customers with economic incentives
to curtail load are relatively new in the state, but are of interest to some LCIs. While the market
assessment and the State of Michigan Demand Response Potential Study focus on DR programs designed
to reduce annual electric system peak, typically occurring on hot summer afternoons, the largest LCIs
reported the ability to modify energy use throughout the year to respond to price and resource availability
signals.
The survey asked customers their likelihood/willingness to participate in different DR programs or rate
types based on typical associated incentive or price levels, as well as the extent to which their willingness
to participate was likely to change with incentive-level variations. Survey respondents did not express a
high degree of sensitivity to DR incentives, meaning that their willingness to participate in DR programs
or their ability to achieve certain load reductions did not vary significantly based on typical incentive
levels. The LCIs, however, are a sophisticated customer group and have a strong understanding of
electricity system operations and economics. They seek transparent and straightforward incentives tied to
the system benefits generated by any changes in energy usage patterns.
The LCIs were presented with a variety of program design options and attributes and indicated some
preferences in the structure of programs that were of greatest interest or most feasible to participate in.
Survey respondents expressed highest likelihood of participating in traditional programs like curtailment
agreements2 and time-of-use rates, but also had a strong interest in more innovative programs like
demand buyback3 or critical/variable peak pricing.
When asked about the factors that would influence the decision to participate in a program or not,
respondents rated flexibility (ability to determine load reduction at the time of the event or to opt out of
events as needed) as the factor most likely to encourage participation. The ability to achieve energy
savings though DR participation and visibility into real-time energy usage also contribute to involvement.
Respondents indicated operational constraints as the primary reason for not being able to participate in
DR programs due to little or no flexibility in the LCIs’ production schedules (e.g., producers of perishable
goods or businesses operating 24 hours a day, seven days a week).
Over 60 percent of survey respondents indicated that they had building management systems that
monitored or controlled energy use for lighting, heating, cooling, ventilation, or processes. Less than 10
percent of the surveyed customers reported having storage technologies or onsite generation that might
be used to respond to a DR event. All of the LCIs that were interviewed reported use of energy
management systems that are used to monitor overall energy use. Many of them use those systems to also
monitor peak demand in their facilities. Several of the LCIs that were interviewed reported process
storage capabilities that allow them to shift production to times when electricity costs are lower.
Overall, LCI electricity users represent a large and concentrated group of customers able and willing to
participate in DR programs. The survey and interviews revealed a strong appetite for new and expanded
2 Curtailment agreements represent programs that offer a fixed capacity payment in return for a firm capacity reduction commitment along with energy reduction incentives over the period DR events are called. 3 Demand buyback represents programs that offer only energy payment, that is, a payment per kWh of reduced energy consumption during a DR event, and there is no firm capacity reduction commitment and associated payment, unlike curtailment agreements.
MPSC DEMAND RESPONSE MARKET ASSESSMENT PUBLICSECTORCONSULTANTS.COM 6
program and pricing options designed to improve the reliability of the electric system, avoid costly market
purchases, and delay the necessity for new generating capacity.
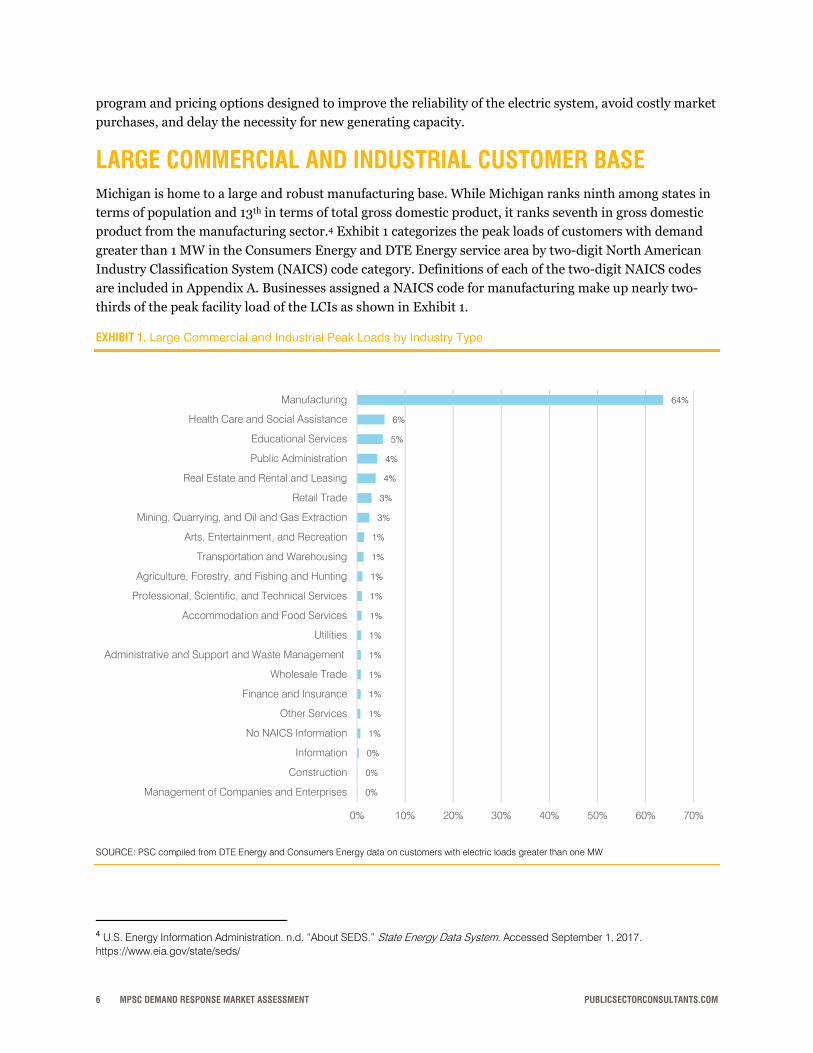
LARGE COMMERCIAL AND INDUSTRIAL CUSTOMER BASE Michigan is home to a large and robust manufacturing base. While Michigan ranks ninth among states in
terms of population and 13th in terms of total gross domestic product, it ranks seventh in gross domestic
product from the manufacturing sector.4 Exhibit 1 categorizes the peak loads of customers with demand
greater than 1 MW in the Consumers Energy and DTE Energy service area by two-digit North American
Industry Classification System (NAICS) code category. Definitions of each of the two-digit NAICS codes
are included in Appendix A. Businesses assigned a NAICS code for manufacturing make up nearly two-
thirds of the peak facility load of the LCIs as shown in Exhibit 1.
EXHIBIT 1. Large Commercial and Industrial Peak Loads by Industry Type
SOURCE: PSC compiled from DTE Energy and Consumers Energy data on customers with electric loads greater than one MW
4 U.S. Energy Information Administration. n.d. “About SEDS.” State Energy Data System. Accessed September 1, 2017. https://www.eia.gov/state/seds/
0%
0%
0%
1%
1%
1%
1%
1%
1%
1%
1%
1%
1%
1%
3%
3%
4%
4%
5%
6%
64%
0% 10% 20% 30% 40% 50% 60% 70%
Management of Companies and Enterprises
Construction
Information
No NAICS Information
Other Services
Finance and Insurance
Wholesale Trade
Administrative and Support and Waste Management
Utilities
Accommodation and Food Services
Professional, Scientific, and Technical Services
Agriculture, Forestry, and Fishing and Hunting
Transportation and Warehousing
Arts, Entertainment, and Recreation
Mining, Quarrying, and Oil and Gas Extraction
Retail Trade
Real Estate and Rental and Leasing
Public Administration
Educational Services
Health Care and Social Assistance
Manufacturing
PUBLICSECTORCONSULTANTS.COM MPSC DEMAND RESPONSE MARKET ASSESSMENT 7
It is important to note that LCIs are assigned to these categories based on ownership or governance,
rather than the specific purpose of a facility. For example, there are several large companies categorized as
manufacturing that are headquartered in Michigan and have diverse facilities in the state, including large
office complexes, machining operations, and assembly plants. Further, the assignment to industry type is
not always clear cut. A shopping mall may be owned and operated by a real estate or property
management company, but occupied by retail outlets. While there are limitations to categorizing electric
customers by industry type, it is useful in understanding the DR opportunities amongst the LCIs.
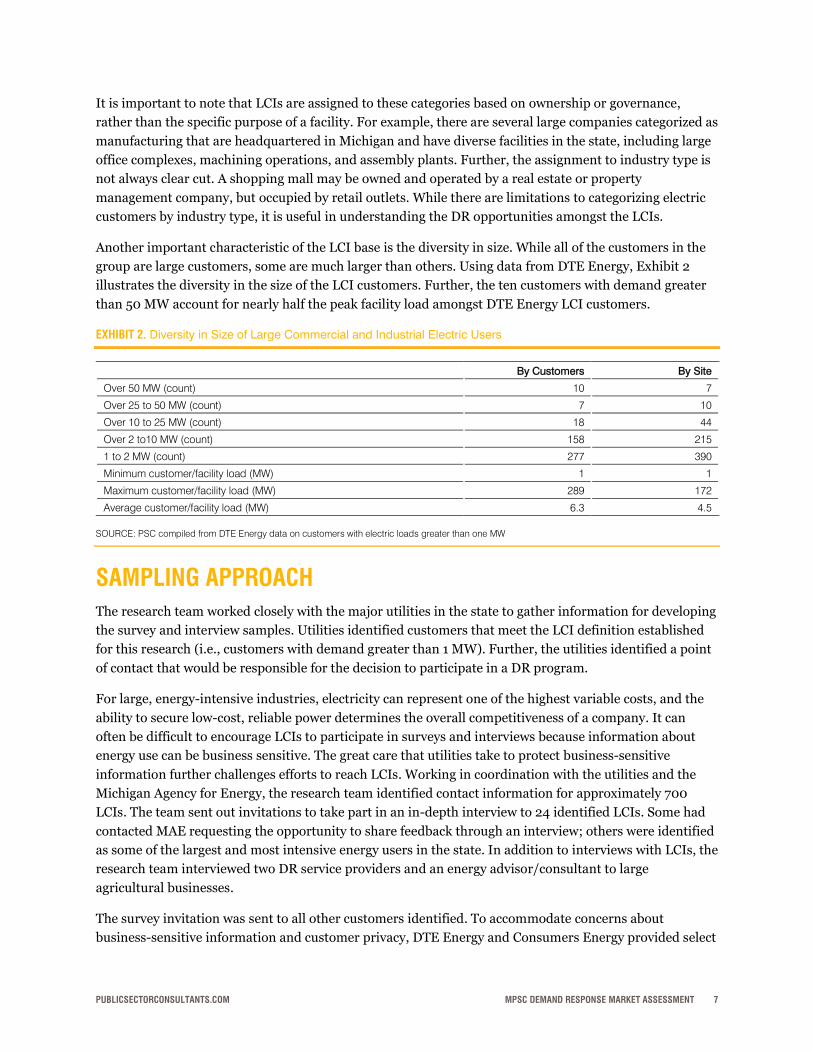
Another important characteristic of the LCI base is the diversity in size. While all of the customers in the
group are large customers, some are much larger than others. Using data from DTE Energy, Exhibit 2
illustrates the diversity in the size of the LCI customers. Further, the ten customers with demand greater
than 50 MW account for nearly half the peak facility load amongst DTE Energy LCI customers.
EXHIBIT 2. Diversity in Size of Large Commercial and Industrial Electric Users
By Customers By Site
Over 50 MW (count) 10 7
Over 25 to 50 MW (count) 7 10
Over 10 to 25 MW (count) 18 44
Over 2 to10 MW (count) 158 215
1 to 2 MW (count) 277 390
Minimum customer/facility load (MW) 1 1
Maximum customer/facility load (MW) 289 172
Average customer/facility load (MW) 6.3 4.5
SOURCE: PSC compiled from DTE Energy data on customers with electric loads greater than one MW
SAMPLING APPROACH The research team worked closely with the major utilities in the state to gather information for developing
the survey and interview samples. Utilities identified customers that meet the LCI definition established
for this research (i.e., customers with demand greater than 1 MW). Further, the utilities identified a point
of contact that would be responsible for the decision to participate in a DR program.
For large, energy-intensive industries, electricity can represent one of the highest variable costs, and the
ability to secure low-cost, reliable power determines the overall competitiveness of a company. It can
often be difficult to encourage LCIs to participate in surveys and interviews because information about
energy use can be business sensitive. The great care that utilities take to protect business-sensitive
information further challenges efforts to reach LCIs. Working in coordination with the utilities and the
Michigan Agency for Energy, the research team identified contact information for approximately 700
LCIs. The team sent out invitations to take part in an in-depth interview to 24 identified LCIs. Some had
contacted MAE requesting the opportunity to share feedback through an interview; others were identified
as some of the largest and most intensive energy users in the state. In addition to interviews with LCIs, the
research team interviewed two DR service providers and an energy advisor/consultant to large
agricultural businesses.
The survey invitation was sent to all other customers identified. To accommodate concerns about
business-sensitive information and customer privacy, DTE Energy and Consumers Energy provided select

MPSC DEMAND RESPONSE MARKET ASSESSMENT PUBLICSECTORCONSULTANTS.COM 8
information to the research team. DTE Energy gave customer contact information and peak loads for sites
with loads greater than 1 MW. The research team identified unique customers, some representing
multiple sites, and sent the survey invitation. Consumers Energy was prohibited from providing customer
contact information due to tariff-mandated confidentiality requirements, but sent an email to customers,
encouraging response to the survey. The email included a link directing customers to PSC’s survey.
The survey was open to responses for four weeks. Throughout the survey fielding period, reminder emails
were sent to the recipients that had not yet responded, each one week apart. Before closing the survey,
potential respondents were encouraged to complete the survey through an incentive offer, in this case, a
contribution to the American Red Cross to aid in hurricane recovery efforts on the survey respondent’s
behalf. While raising a small donation, the incentive did not appreciably increase survey response rates.5
SURVEY SUMMARY
SURVEY DESIGN
The research team developed an online survey to gather information about:
Characteristics of LCI operations in Michigan
Awareness of and experience participating in DR programs
Preference for different program design features and the impact on ability to curtail load during peak
periods
Adoption of technologies that could enable participation in DR programs, including energy
management systems, storage, and onsite generation
The survey included the following sections:
Firmographics. Characteristics of the respondent's organization, such as building size, number of
employees, hours of operation, and industry type.
Awareness and Participation. Familiarity with DR programs and participation history. If
respondents had experience participating in DR programs, they were asked questions about their
experience, including their curtailment strategies, costs incurred to participate, and incentive adequacy.
Program Preferences. Respondents were presented with descriptions of different incentive-based DR
programs and time-varying rate structures. Respondents rated their likelihood to participate on a scale of
one to ten, and for any programs rated six or above, respondents were asked to rank programs in order of
preference. For the top-ranked program, respondents were given typical6 or base program characteristics
(i.e., notification period, event duration, and incentive levels) and were asked to estimate their load
reduction in kilowatts (kW) or percentage of facility peak load. Respondents were presented with
variations in program characteristics and were asked to reassess their load reduction. Changes in load
5 During the survey fielding period, the U.S. was hit with two hurricanes—Hurricane Harvey, which affected Texas and other parts of the gulf coast, and Hurricane Irma, which hit the eastern U.S. coast, predominantly in Florida. 6 Program characteristics that embody features commonly observed in the industry.
PUBLICSECTORCONSULTANTS.COM MPSC DEMAND RESPONSE MARKET ASSESSMENT 9
reduction estimates under varying program characteristics were used to assess sensitivities and program
design preferences.
Customer Capabilities and Technology. Respondents were asked a series of questions regarding the
presence of DR-enabling technology and influence of technology on the decision to participate in DR
programs. If a respondent did not have a DR-enabling technology, the survey gauged the level of interest
in various technologies.
Customer Motivators and Barriers to Participation. Respondents were asked to rate a variety of
factors—including program design parameters, technical assistance provision, availability of information
technology, and firmness of DR commitments—on their influence to participate in programs.
Respondents were asked to identify any additional motivators or barriers to participation.
Costs to Participate in DR Programs and Sufficiency of Incentive Levels. Respondents were
asked to consider the potential direct and/or indirect costs to participate in DR programs. They were then
asked to compare those costs to the typical or base incentive levels presented in the survey’s program
preference section and to assess how well those incentives would cover participation costs.
Closing. Survey respondents were asked for any additional input and directed to the MPSC website for
additional information about the implementation of Michigan’s new energy legislation.
A draft survey instrument was reviewed by MPSC staff, utilities, the contractor conducting the DR
potential study, and others to ensure comprehensiveness and accessibility to respondents with varying
degrees of knowledge. Reviewers noted the complexity of the survey topic and made suggestions to
improve understanding and clarity of the questions, which were then incorporated into a revised survey
instrument fielded to LCI customers.
SURVEY RESPONSE
As noted, survey invitations were sent to nearly 700 LCI entities. Utility account managers helped identify
appropriate contacts at each LCI (i.e., someone who is involved with or responsible for the decision to
participate in DR programs). Key contacts included facility managers, owners or chief executive officers,
energy managers, sustainability coordinators, engineers, operations directors, and others.
Eighty-seven invitees began the survey, but only 52 responses yielded sufficient information to analyze.
Alongside efforts to encourage nonrespondents to complete the survey, PSC contacted those respondents
that began the survey but had not finished it and was able to secure additional completions via phone.
Exhibit 3 shows the survey responses by industry type. As expected, over half of the survey responses are
from manufacturing firms. Other important segments, including educational services, agriculture, and
healthcare, are also represented.

MPSC DEMAND RESPONSE MARKET ASSESSMENT PUBLICSECTORCONSULTANTS.COM 10
EXHIBIT 3. Survey Responses by Industry Type
SOURCE: PSC compiled data of survey responses
SURVEY RESULTS
Program Awareness and Participation
Nearly all survey respondents indicated having heard of DR programs, and most of those learned about
DR from their current utility provider in Michigan (see Exhibit 4).
EXHIBIT 4. Awareness of Demand Response Programs
2%
2%
2%
5%
5%
5%
5%
5%
7%
12%
51%
0% 10% 20% 30% 40% 50% 60%
Accommodation and Food Services
Professional, Scientific, and Technical Services
Arts, Entertainment, and Recreation
Health Care and Social Assistance
Real Estate and Rental and Leasing
Public Administration
Utilities
Wholesale Trade
Agriculture, Forestry, and Fishing and Hunting
Educational Services
Manufacturing
Yes84%
No16%
Percent of Respondents Aware of Demand Response
Current Michigan
utility provider
67%
Another utility
provider3%
Demand response provider
9%
Colleague9%
Other12%
Sources of Information About Demand Response
PUBLICSECTORCONSULTANTS.COM MPSC DEMAND RESPONSE MARKET ASSESSMENT 11
SOURCE: PSC compiled data of survey responses
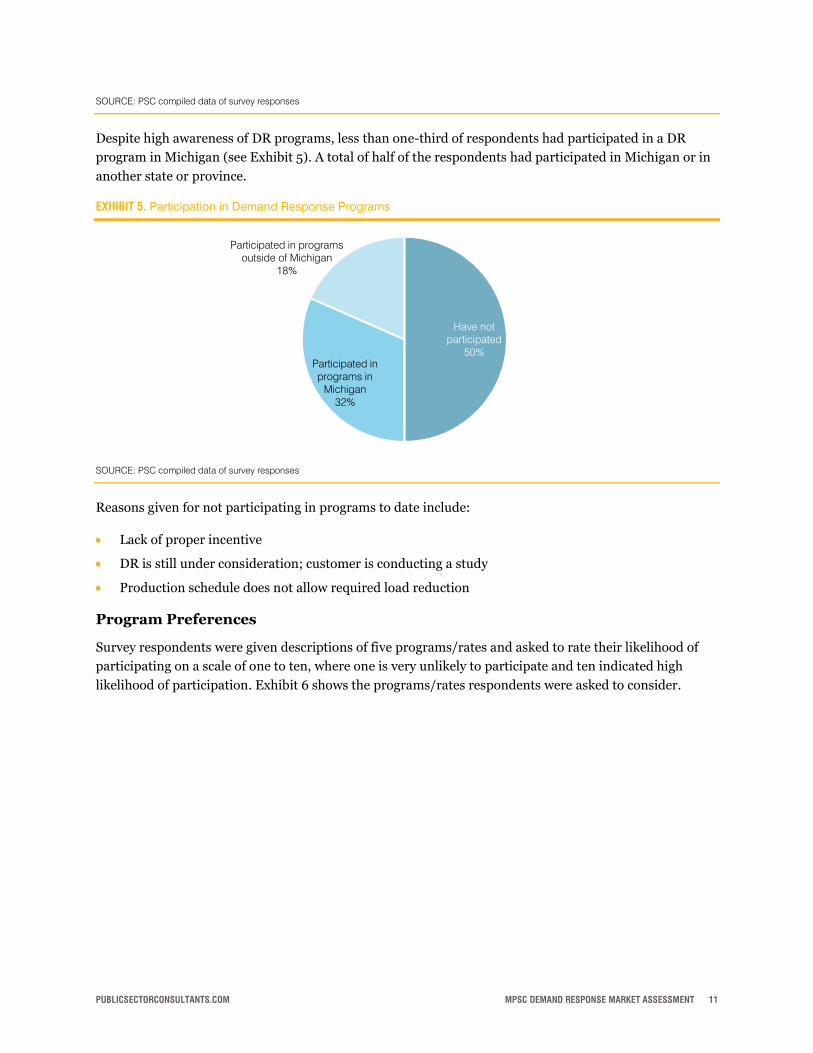
Despite high awareness of DR programs, less than one-third of respondents had participated in a DR
program in Michigan (see Exhibit 5). A total of half of the respondents had participated in Michigan or in
another state or province.
EXHIBIT 5. Participation in Demand Response Programs
SOURCE: PSC compiled data of survey responses
Reasons given for not participating in programs to date include:
Lack of proper incentive
DR is still under consideration; customer is conducting a study
Production schedule does not allow required load reduction
Program Preferences
Survey respondents were given descriptions of five programs/rates and asked to rate their likelihood of
participating on a scale of one to ten, where one is very unlikely to participate and ten indicated high
likelihood of participation. Exhibit 6 shows the programs/rates respondents were asked to consider.
Have not participated
50%Participated in programs in
Michigan32%
Participated in programs outside of Michigan
18%
MPSC DEMAND RESPONSE MARKET ASSESSMENT PUBLICSECTORCONSULTANTS.COM 12
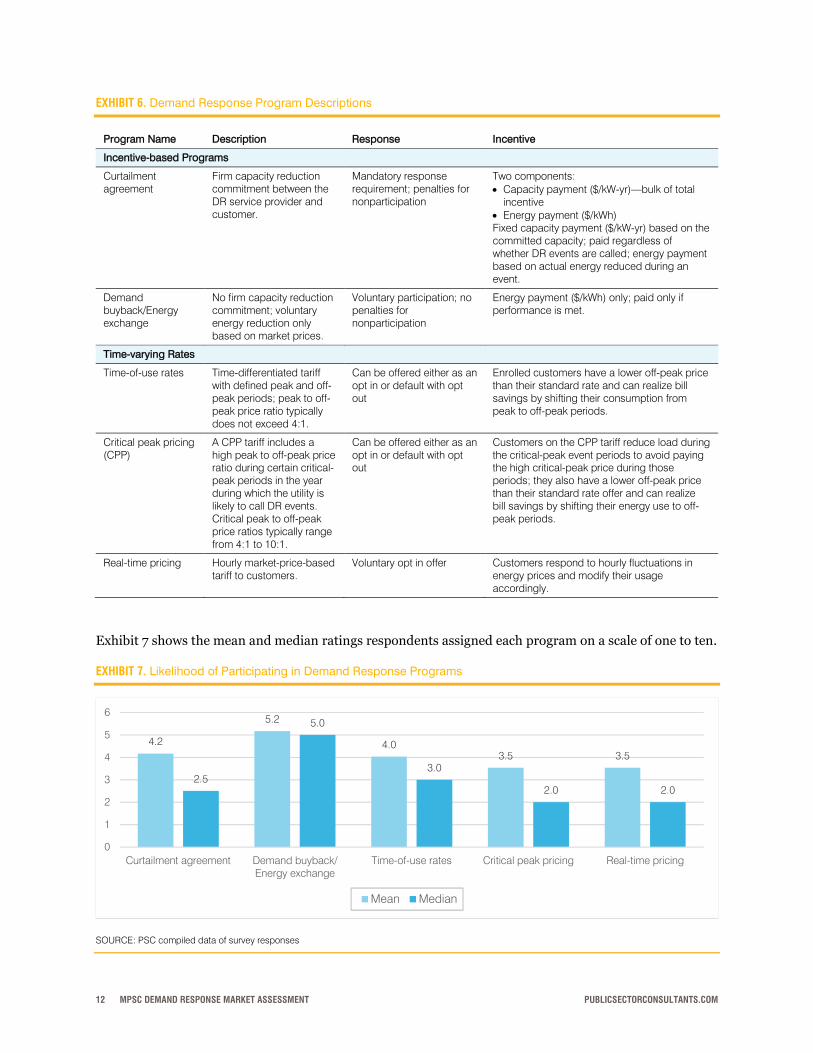
EXHIBIT 6. Demand Response Program Descriptions
Program Name Description Response Incentive
Incentive-based Programs
Curtailment agreement
Firm capacity reduction commitment between the DR service provider and customer.
Mandatory response requirement; penalties for nonparticipation
Two components: Capacity payment ($/kW-yr)—bulk of total
incentive Energy payment ($/kWh) Fixed capacity payment ($/kW-yr) based on the committed capacity; paid regardless of whether DR events are called; energy payment based on actual energy reduced during an event.
Demand buyback/Energy exchange
No firm capacity reduction commitment; voluntary energy reduction only based on market prices.
Voluntary participation; no penalties for nonparticipation
Energy payment ($/kWh) only; paid only if performance is met.
Time-varying Rates
Time-of-use rates Time-differentiated tariff with defined peak and off-peak periods; peak to off-peak price ratio typically does not exceed 4:1.
Can be offered either as an opt in or default with opt out
Enrolled customers have a lower off-peak price than their standard rate and can realize bill savings by shifting their consumption from peak to off-peak periods.
Critical peak pricing (CPP)
A CPP tariff includes a high peak to off-peak price ratio during certain critical-peak periods in the year during which the utility is likely to call DR events. Critical peak to off-peak price ratios typically range from 4:1 to 10:1.
Can be offered either as an opt in or default with opt out
Customers on the CPP tariff reduce load during the critical-peak event periods to avoid paying the high critical-peak price during those periods; they also have a lower off-peak price than their standard rate offer and can realize bill savings by shifting their energy use to off-peak periods.
Real-time pricing Hourly market-price-based tariff to customers.
Voluntary opt in offer Customers respond to hourly fluctuations in energy prices and modify their usage accordingly.
Exhibit 7 shows the mean and median ratings respondents assigned each program on a scale of one to ten.
EXHIBIT 7. Likelihood of Participating in Demand Response Programs
SOURCE: PSC compiled data of survey responses
4.2
5.2
4.03.5 3.5
2.5
5.0
3.0
2.0 2.0
0
1
2
3
4
5
6
Curtailment agreement Demand buyback/Energy exchange
Time-of-use rates Critical peak pricing Real-time pricing
Mean Median

PUBLICSECTORCONSULTANTS.COM MPSC DEMAND RESPONSE MARKET ASSESSMENT 13
Nearly 55 percent of survey respondents rated at least one program six or higher, indicating willingness to
participate in DR programs. Respondents that rated multiple programs six or higher were asked to rank
programs in order of preference. Even though respondents assigned the highest rating for likelihood to
participate to the demand buyback program, more participants selected curtailment agreements as the
program they would be most likely to participate in, followed by time-of-use rates and real-time pricing
(see Exhibit 8). Respondents indicated a high degree of familiarity as the reason for selecting curtailment
agreements or time-of-use rates as their first choice.
EXHIBIT 8. Likelihood of Participating in Demand Response Programs
SOURCE: PSC compiled data of survey responses
Demand buyback and critical/variable peak pricing7 are both relatively new program concepts and were
least likely to be ranked first; however, they were a strong second choice. Flexibility and low risk were
noted as reasons for interest in demand buyback, but respondents also stated the need for sufficient
economic incentive to spur participation, since demand buyback does not have a fixed contracted capacity
payment, unlike curtailment agreements.
Some of the concerns about critical peak pricing were the uncertainty and risk of exposure to peak prices,
but some respondents saw this program as providing somewhat stronger incentive to shift load to off-
peak periods than standard time-of-use rates. Some respondents indicated that real-time pricing would
require the most effort to participate in to consistently monitor market prices, but a few sophisticated
customers with strong energy management capabilities saw this type of program as most-effective at
providing price signals that drive system efficiency during peak periods and throughout the year.
7 Critical peak pricing and variable peak pricing programs are both variants of time-of-use pricing, but in these types of rates, the price can vary based on utility and market conditions. In the market assessment survey, PSC used critical peak pricing while in the DR potential study conducted by Applied Energy Group, this program concept was labeled variable peak pricing. Respondent feedback related to critical peak pricing was used to assess response to both critical and variable peak pricing programs.
Curtailment agreement
45%
Demand buyback
11%
Time-of-use rates
22%
Critical peak
pricing0%
Real-time pricing
22%
Most Likely to Participate In
Curtailment agreement
13%
Demand buyback
53%Time-of-use rates
0%
Critical peak
pricing27%
Real-time pricing
7%
Second Most Likely to Participate In

MPSC DEMAND RESPONSE MARKET ASSESSMENT PUBLICSECTORCONSULTANTS.COM 14
Sensitivity to Program Parameters
For the program that respondents indicated they were most likely to participate in, they were asked to
estimate the amount of load (either in terms of kW or as a percentage of facility peak load) that they could
curtail under base program conditions. Respondents were then presented with variations in key program
parameters, including notification period, duration of events, and incentive level. They were asked to
again estimate load reductions and to explain changes in load reduction estimates, if any. Exhibit 9 shows
the base set of program parameters and the variations presented to customers.
EXHIBIT 9. Program Parameters
Program Name Baseline Increased Event
Duration Shortened Notification
Period Incentive Change
Curtailment agreement
Day-ahead notification 4-hour DR event $25/kW-year and $0.10/kWh
curtailed
6- to 8-hour DR event
30- to 60-minute notification period
$40/kW-year and $0.10/kWh
Demand buyback/Energy exchange
Day-ahead notification 4-hour DR event $0.50/kWh curtailed
6- to 8-hour DR event
30- to 60-minute notification period
$40/kW-year and $0.10/kWh
Time-of-use rates
2:1 on-peak/off-peak price ratio
N/A N/A 4:1 on-peak/off-peak
price ratio
Critical peak pricing
6:1 on-peak/off-peak price ratio
N/A N/A 10:1 on-peak/off-
peak price ratio
Real-time pricing
Prices vary hourly depending on market conditions
N/A N/A
Regarding program design parameters and how they could influence participation specific to curtailment
agreements, survey responses indicated the following:
Changes in event duration (longer event duration, going up to eight hours) minimally impact the
likelihood of customer participation. This would suggest that customers who indicated willingness to
participate have inherent flexibility in their business operations to be able to curtail load over longer
periods of time.
Regarding program notification, some customers indicated that they might be able to reduce more
load with a shorter notification period of 30 minutes to an hour. Some customers, however, indicated
that their load reduction commitment would be 30 to 50 percent lower than what they could reduce
with day-ahead notification.
Customers that indicated willingness to participate in curtailment agreements showed little or no
sensitivity to their load reduction commitments based on increase in incentive level.
Specific to the demand buyback program option, survey responses indicate the following:
Changes in event duration (longer event duration, going up to eight hours) minimally impact the
likelihood of customer participation, and some respondents indicated they would increase their load
reductions. Because demand buyback incentives are paid based on change in energy consumption,
longer-duration events may increase the amount of the incentive paid to participants.
PUBLICSECTORCONSULTANTS.COM MPSC DEMAND RESPONSE MARKET ASSESSMENT 15
One extremely large manufacturing respondent indicated that they would be able to curtail less than
half of the amount under shorter event notification (30 minutes to an hour, instead of day-ahead).
The reason cited for the lower amount was that a higher degree of control is needed to respond that
quickly. The respondent stated, “In a massive plant, without controls, it would take a long time to turn
down equipment.”
One extremely large customer that responded to the question on changes in incentive level did not
indicate any changes to the estimated load reduction based on changes in incentive level (incentives
going down from $0.50/kWh to $0.30/kWh).
We asked respondents how much load they might be able to curtail with very fast response requirements,
such as ten minutes or less. Approximately, 30 percent of survey respondents answered the question, and
expected load reductions varied from 5 percent to 50 percent. Customer segments that responded to this
question indicated a certain percent of their facility load that could be shed in response to short
notifications were education and manufacturing (plastics, steel, auto, process). One large education
facility indicated being able to curtail the same amount of load in ten minutes as with the 30- to 60-
minute notification, which was two-thirds of what they could reduce with day-ahead notification. That
customer would achieve load reductions by shifting to onsite natural gas generation.
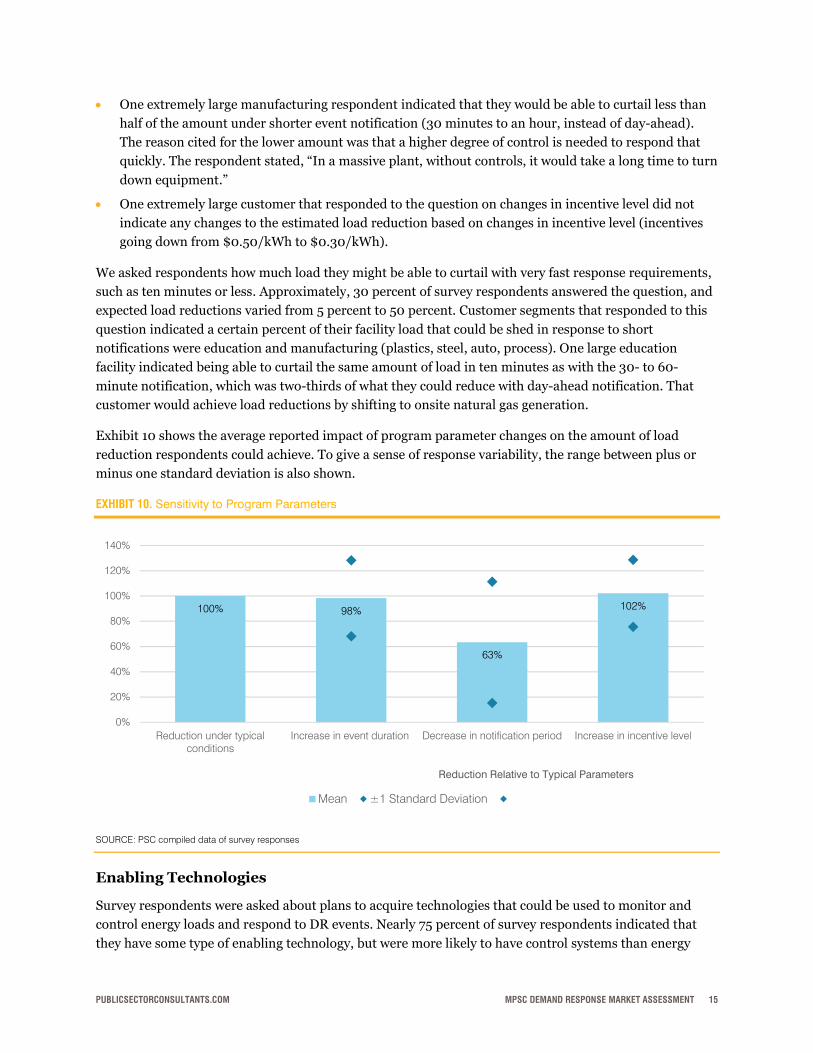
Exhibit 10 shows the average reported impact of program parameter changes on the amount of load
reduction respondents could achieve. To give a sense of response variability, the range between plus or
minus one standard deviation is also shown.
EXHIBIT 10. Sensitivity to Program Parameters
SOURCE: PSC compiled data of survey responses
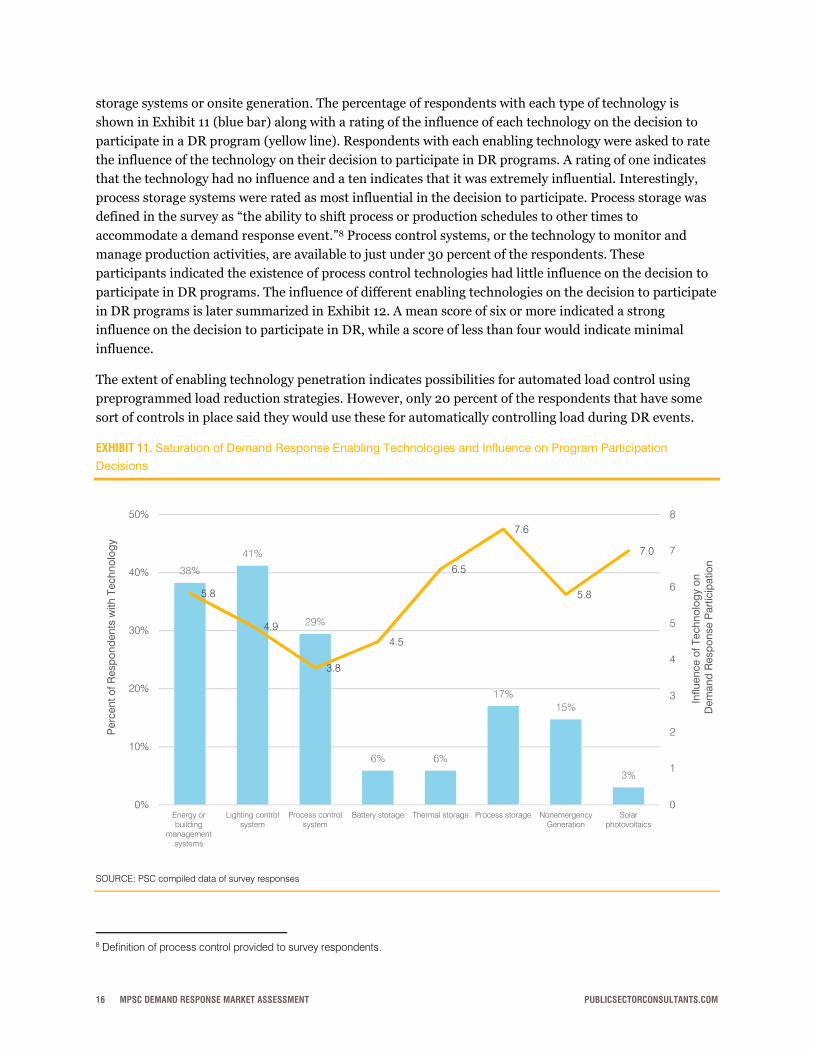
Enabling Technologies
Survey respondents were asked about plans to acquire technologies that could be used to monitor and
control energy loads and respond to DR events. Nearly 75 percent of survey respondents indicated that
they have some type of enabling technology, but were more likely to have control systems than energy
100% 98%
63%
102%
0%
20%
40%
60%
80%
100%
120%
140%
Reduction under typicalconditions
Increase in event duration Decrease in notification period Increase in incentive level
Reduction Relative to Typical Parameters
Mean ±1 Standard Deviation
MPSC DEMAND RESPONSE MARKET ASSESSMENT PUBLICSECTORCONSULTANTS.COM 16
storage systems or onsite generation. The percentage of respondents with each type of technology is
shown in Exhibit 11 (blue bar) along with a rating of the influence of each technology on the decision to
participate in a DR program (yellow line). Respondents with each enabling technology were asked to rate
the influence of the technology on their decision to participate in DR programs. A rating of one indicates
that the technology had no influence and a ten indicates that it was extremely influential. Interestingly,
process storage systems were rated as most influential in the decision to participate. Process storage was
defined in the survey as “the ability to shift process or production schedules to other times to
accommodate a demand response event.”8 Process control systems, or the technology to monitor and
manage production activities, are available to just under 30 percent of the respondents. These
participants indicated the existence of process control technologies had little influence on the decision to
participate in DR programs. The influence of different enabling technologies on the decision to participate
in DR programs is later summarized in Exhibit 12. A mean score of six or more indicated a strong
influence on the decision to participate in DR, while a score of less than four would indicate minimal
influence.
The extent of enabling technology penetration indicates possibilities for automated load control using
preprogrammed load reduction strategies. However, only 20 percent of the respondents that have some
sort of controls in place said they would use these for automatically controlling load during DR events.
EXHIBIT 11. Saturation of Demand Response Enabling Technologies and Influence on Program Participation
Decisions
SOURCE: PSC compiled data of survey responses
8 Definition of process control provided to survey respondents.
38%
41%
29%
6% 6%
17%15%
3%
5.8
4.9
3.8
4.5
6.5
7.6
5.8
7.0
0
1
2
3
4
5
6
7
8
0%
10%
20%
30%
40%
50%
Energy orbuilding
managementsystems
Lighting controlsystem
Process controlsystem
Battery storage Thermal storage Process storage NonemergencyGeneration
Solarphotovoltaics
Influ
en
ce o
f T
ech
no
log
y o
nD
em
an
d R
esp
on
se P
art
icip
atio
n
Perc
en
t o
f R
esp
on
den
ts w
ith
Tech
no
log
y
PUBLICSECTORCONSULTANTS.COM MPSC DEMAND RESPONSE MARKET ASSESSMENT 17
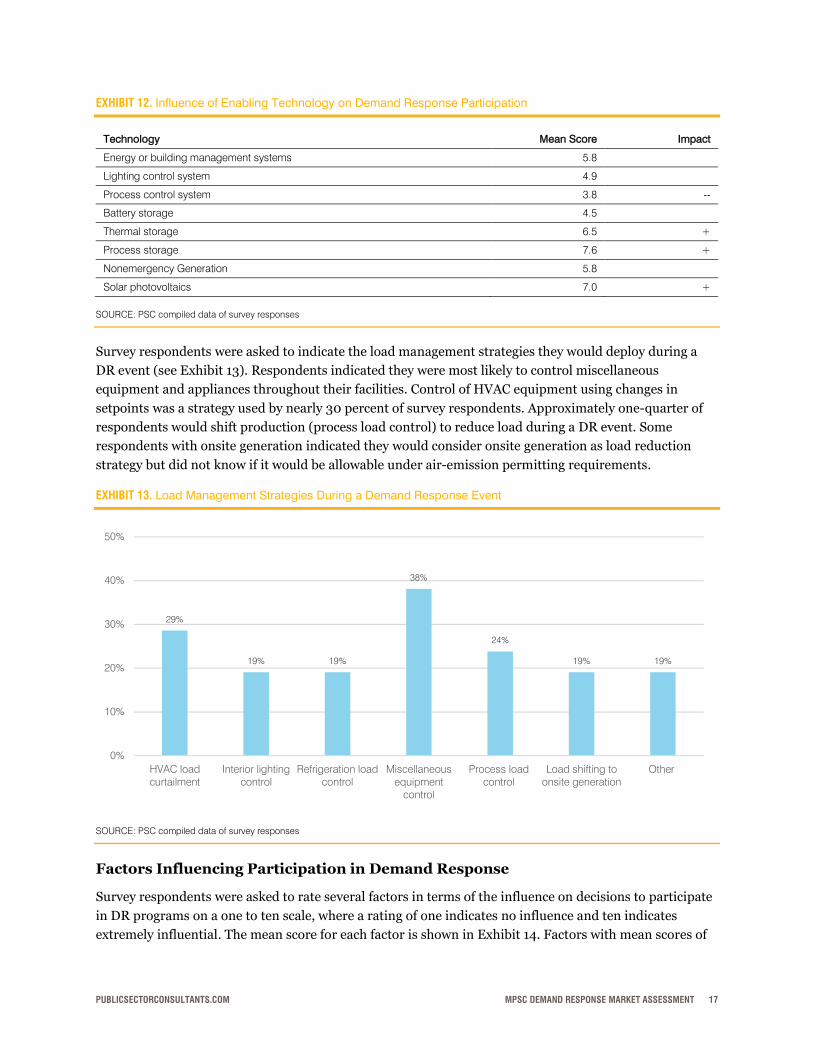
EXHIBIT 12. Influence of Enabling Technology on Demand Response Participation
Technology Mean Score Impact
Energy or building management systems 5.8
Lighting control system 4.9
Process control system 3.8 --
Battery storage 4.5
Thermal storage 6.5 +
Process storage 7.6 +
Nonemergency Generation 5.8
Solar photovoltaics 7.0 +
SOURCE: PSC compiled data of survey responses
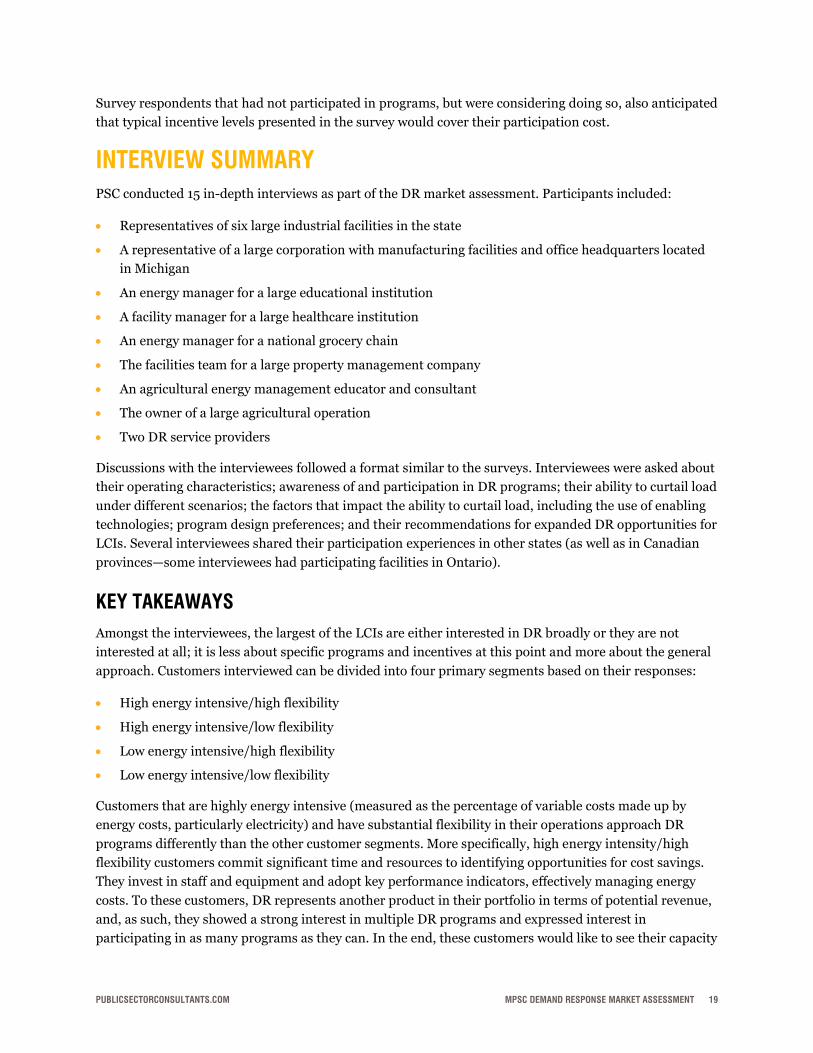
Survey respondents were asked to indicate the load management strategies they would deploy during a
DR event (see Exhibit 13). Respondents indicated they were most likely to control miscellaneous
equipment and appliances throughout their facilities. Control of HVAC equipment using changes in
setpoints was a strategy used by nearly 30 percent of survey respondents. Approximately one-quarter of
respondents would shift production (process load control) to reduce load during a DR event. Some
respondents with onsite generation indicated they would consider onsite generation as load reduction
strategy but did not know if it would be allowable under air-emission permitting requirements.
EXHIBIT 13. Load Management Strategies During a Demand Response Event
SOURCE: PSC compiled data of survey responses
Factors Influencing Participation in Demand Response
Survey respondents were asked to rate several factors in terms of the influence on decisions to participate
in DR programs on a one to ten scale, where a rating of one indicates no influence and ten indicates
extremely influential. The mean score for each factor is shown in Exhibit 14. Factors with mean scores of
29%
19% 19%
38%
24%
19% 19%
0%
10%
20%
30%
40%
50%
HVAC loadcurtailment
Interior lightingcontrol
Refrigeration loadcontrol
Miscellaneousequipment
control
Process loadcontrol
Load shifting toonsite generation
Other

MPSC DEMAND RESPONSE MARKET ASSESSMENT PUBLICSECTORCONSULTANTS.COM 18
six or higher indicate a positive influence on participation and factors with scores less than four are
potential deterrents or barriers to participation.
EXHIBIT 14. Customer-identified Factors Influencing Participation in Demand Response Programs
Factors Considered Mean Score Impact
The utility or other entity would directly control load during a DR event 3.3 --
Participants are responsible for controlling load during a DR event 6.1 +
Program requires a fixed reduction in load during a DR event 3.8 --
Participants are able to determine level of load reduction for each event without a penalty
6.8 +
Ability to opt out of DR for a limited number of events 6.3 +
Minimum load reduction is required to participate 4.7
Incentive payment for load reduction is fixed; participants receive a fixed capacity payment, based on their committed capacity, regardless of whether an event is called
5.3
Energy payment based on real-time market prices with varying bid amounts based on the prices; there is no fixed capacity payment
4.7
Fast response requirement, with less than ten-minute event notification 3.5 --
Load reductions impact operations and business processes 5.1
Utility or other entity provides an audit to identify load curtailment/shifting strategies 5.5
Visibility into real-time energy usage 6.2 +
Energy savings benefits realized through participation in a DR program or tariff 6.4 +
Greater visibility into facility operations through DR program dashboards 5.4
SOURCE: PSC compiled data of survey responses
Some notable deterrents to participation in DR programs included:
The utility or other entity directly control load during a DR event
Requirement of a fixed reduction in load during a DR event
Requirement to respond in ten minutes or less to an event notification
Factors potentially encouraging participation in DR programs included:
Participant ability to control load during DR events
Ability to determine the load reduction for each event and to opt out of demand response for a limited
number of events
Visibility into real-time energy usage to guide load reductions
Realization of energy savings through participation
Participation Costs and Sufficiency of Incentive Levels
Survey respondents were asked to identify their costs for participating in DR programs and events. Cost
incurred includes time to assess load curtailment opportunities, investment in equipment for managing
load, development of curtailment strategies, and potential impacts on production schedules. Participants
in DR programs felt that incentives more than covered their cost to participate—this unanimity may
reflect the fact that those customers for whom costs would exceed current incentives are not participating.
PUBLICSECTORCONSULTANTS.COM MPSC DEMAND RESPONSE MARKET ASSESSMENT 19
Survey respondents that had not participated in programs, but were considering doing so, also anticipated
that typical incentive levels presented in the survey would cover their participation cost.
INTERVIEW SUMMARY PSC conducted 15 in-depth interviews as part of the DR market assessment. Participants included:
Representatives of six large industrial facilities in the state
A representative of a large corporation with manufacturing facilities and office headquarters located
in Michigan
An energy manager for a large educational institution
A facility manager for a large healthcare institution
An energy manager for a national grocery chain
The facilities team for a large property management company
An agricultural energy management educator and consultant
The owner of a large agricultural operation
Two DR service providers
Discussions with the interviewees followed a format similar to the surveys. Interviewees were asked about
their operating characteristics; awareness of and participation in DR programs; their ability to curtail load
under different scenarios; the factors that impact the ability to curtail load, including the use of enabling
technologies; program design preferences; and their recommendations for expanded DR opportunities for
LCIs. Several interviewees shared their participation experiences in other states (as well as in Canadian
provinces—some interviewees had participating facilities in Ontario).
KEY TAKEAWAYS
Amongst the interviewees, the largest of the LCIs are either interested in DR broadly or they are not
interested at all; it is less about specific programs and incentives at this point and more about the general
approach. Customers interviewed can be divided into four primary segments based on their responses:
High energy intensive/high flexibility
High energy intensive/low flexibility
Low energy intensive/high flexibility
Low energy intensive/low flexibility
Customers that are highly energy intensive (measured as the percentage of variable costs made up by
energy costs, particularly electricity) and have substantial flexibility in their operations approach DR
programs differently than the other customer segments. More specifically, high energy intensity/high
flexibility customers commit significant time and resources to identifying opportunities for cost savings.
They invest in staff and equipment and adopt key performance indicators, effectively managing energy
costs. To these customers, DR represents another product in their portfolio in terms of potential revenue,
and, as such, they showed a strong interest in multiple DR programs and expressed interest in
participating in as many programs as they can. In the end, these customers would like to see their capacity

MPSC DEMAND RESPONSE MARKET ASSESSMENT PUBLICSECTORCONSULTANTS.COM 20
treated as another form of generation, and they would like to be compensated accordingly. One
interviewee stated, “Through their integrated planning processes, utilities will look to minimalize the
amount they spend. What we will look for will be compensation approaching their cost for generation. We
are willing to invest in this, but we are going to have to be compensated in a manner approaching the
utilities’ alternatives.”
Historically, DR options for LCIs have included interruptible tariffs that allow curtailment during times of
system emergencies. Many of the interviewees were interested in an expanded portfolio of DR options
that could create cost savings for their companies, their utility company, and ultimately other customers
of the utility providers. One interviewee considered DR flexibility an opportunity for balancing renewable
energy, where pairing DR could help address the intermittency inherent to solar and wind power.
PROGRAM PREFERENCES
Customers group the different programs as DR, and do not necessarily differentiate between them. When
it comes to specific programs, customers understand that emergency response takes precedence, and they
express an understanding of the larger purpose of the program. “This is typically one of their last lines of
defense,” offered one interviewee. “If something bad happens in the grid, they can come to us.”
Customers welcome incentives associated with emergency programs. Emergency customers with
experience in other markets talked about program differences and event frequency. Michigan customers
have never had an event, but it is much more common in other states. “MISO (Midcontinent Independent
System Operator)9 hasn’t had to deal with emergencies in the last ten years, which made it easy for
everybody,” with customers reimbursed not for action but for commitments not to use in times of
emergency. In states with infrequent emergency curtailment events, there is often an annual test that
requires DR participants to demonstrate their ability to curtail load. Though interviewees’ systems have
not been tested in many years, they expressed a high degree of confidence that they would be able to
reduce load if required.
Interviewees expressed interest in opportunities beyond emergency programs. However, there is less
understanding about the benefits of economic programs, even among heavy users, with some seeing these
programs as being more about “saving [the utilities] money.” Overall, interest in economic programs
correlated with customer flexibility, with less-flexible customers expressing less capability to modify loads
being less interested in programs that could entail more frequent load modifications. Customers with high
flexibility expressed interest due to the beneficial opportunities it provided, particularly over emergency
programs viewed as rare.
Customers in multiple service territories expressed favorability towards the programs in the PJM10 service
territory over Michigan/MISO as well as Indiana, referring to the “Very successful program in Ohio—
PJM,” while also stating that “Indiana has the most sophisticated system in the Midwest.” In Indiana, one
of the favorable aspects cited was early engagement with the LCIs through a DR workgroup, resulting in a
variety of program options for customers. In PJM, a respondent stated that energy-efficiency reductions
9 MISO is a regional transmission organization that serves all or part of 15 U.S. states and the Canadian province of Manitoba, including Michigan. 10 PJM Interconnection is a regional transmission organization (RTO) that coordinates the movement of wholesale electricity in all or parts of Delaware, Illinois, Indiana, Kentucky, Maryland, Michigan, New Jersey, North Carolina, Ohio, Pennsylvania, Tennessee, Virginia, West Virginia and the District of Columbia.

PUBLICSECTORCONSULTANTS.COM MPSC DEMAND RESPONSE MARKET ASSESSMENT 21
can count toward peak load reductions. Respondents also cited the ability to transact directly with the
regional transmission organization or the independent system operator to provide load curtailment
services as a key reason for favoring these programs.
In looking at load curtailment, customers utilize a range of technologies from energy management
systems to analog procedures. Interviewees reported limited instances in which a utility would have
control over curtailment; when this is the case, there is an expectation of higher incentives to
accommodate the additional risk. Often, with utility control over load curtailment, there is not an
established notification period or obligation for the utility to notify the customer. However, interviewees
indicated that utilities try to communicate with customers in advance to allow them to prepare for the
curtailment and manage impacts to their operations.
CUSTOMER CAPABILITIES AND TECHNOLOGY
Overall, customer capabilities and technology tend to vary significantly based on customers’ investment in
DR. Customers who see the benefit are willing to invest significantly. In these cases, customer technology
may surpass technology available through utilities, with some customers investing in their own
technology, including metering and real-time pricing monitoring software. Companies with limited
internal energy management capabilities reported hiring a third-party provider to identify load
curtailment opportunities, install load management technologies, manage load during events, and/or
monitor load reduction performance. In other cases, the utility service hired a third-party energy
management or demand response firm to work with the LCIs. Respondents indicated willingness to work
with third-party providers, but overall, preferred to hire their own service provider that could work across
different locations and utility service areas.
LCI capabilities and technology also drive interest in more sophisticated DR programs. For example,
where the capacity exists, customers will consider load shifting to meet incentives that reward production
during off-peak or lower-cost hours, such as time-of-use and critical-peak pricing. In these cases, plants
have developed models that are run to determine the best days and times to operate to attain the lowest
cost possible. The models account for on- and off-peak price variance, the costs of shifting employees’
schedules, labor agreements, shutting down equipment, and production inefficiencies due to heat losses
and risk to equipment. Some users have installed peak-demand-limiting logic control and automation to
limit the peak demand at the plant and avoid paying a large cost for a small number of hours. Users
participating in peak-avoidance programs (or managing their peak loads to control demand charges
incurred) utilize internally developed software to assist in predicting when peaks will occur and notifying
staff when energy use is approaching established thresholds or limits.
For the majority of customers, battery or thermal storage technologies are viewed as having great
potential for a future date, but have not yet been widely implemented. Those with capabilities inherent to
their business, such as condensed-air storage, are focused on the opportunities that storage provides both
for their load management capabilities and as a potential line of business.
CUSTOMER MOTIVATORS AND BARRIERS TO PARTICIPATION
Intensive users are willing to commit time beyond equipment—they want to help shape programs.
“Utilities should develop programs with lots of input from industrials,” responded one customer.

MPSC DEMAND RESPONSE MARKET ASSESSMENT PUBLICSECTORCONSULTANTS.COM 22
More intensive and flexible users are interested in access to energy markets.
“We would like to have ways to participate in the energy markets. We are beyond
the utility in terms of our energy usage. We don’t rely on them at all. We rely on
them to provide us access to markets to provide value to the larger system. They
need to be flexible in allowing industrials to do this, and encourage industrials to do
this. Today in Indiana, prices shot up significantly and our company dropped load.
We should be compensated for taking demand out of the system and buying
power later. This should make everyone more competitive. . . . When we saw the
prices spike, we dropped a few more MW. We were able to grab additional credits
from the utilities. It was an exercise in operational flexibility. We have invested in the
capital equipment, people, and real-time monitoring to make real-time decisions.
We are looking for the lowest price we can buy power over time.”
When it comes to providing access to markets, there are a number of benefits (as well as concerns) for
providing access to day-ahead markets (as opposed to real time) in particular. While day-ahead energy
markets alone don’t promote DR, day-ahead DR programs provide for minimum downtimes and start-
up/shut-down cost recovery, which results in much more efficient DR. Real-time price watching is seen by
some LCIs as “too hard” since prices fluctuate every few minutes. With day-ahead markets, however, DR
customers see themselves as “another seller of energy, competing against other higher-cost generators.”
Among the benefits of day-ahead markets, customers cited the appeal of making production or
operational decisions based on economics. When the independent system operator (ISO) determines
which hours the facility must curtail, this provides certainty to the next day’s operating schedule. It
enables the plant to make staffing and maintenance decisions, minimizes wear and tear on equipment,
ensures recovery of curtailing costs during high-priced periods, and provides generation planning
certainty to the ISO.
As far as Michigan’s approach to DR, respondents indicated there is an opportunity to adjust peak pricing
methodology as a method to encourage load management. Respondents noted that Michigan uses a 12 CP
(coincident peak) methodology for cost allocation, which mutes the signal for DR and does not incentivize
participation by loads to reduce system costs.1112 According to interviewees, the 12 CP sends a signal to
curtail during months with low peaks, and this signal is further muted by ratchets and allocation of costs
based on the aggregate load of a rate class rather than customer-specific characteristics.13 Alternatively,
respondents proposed using four summer CPs as is done in other summer peaking jurisdictions.
According to interviewees, this results in better cost allocation and recovery of costs from customers
driving peak capacity requirements.
11 The 12 CP allocated costs are based on the system peak hour in each month. This compares to four CP or one CP methods where costs are allocated based on loads at the system peak hour on the four highest peak days of a year or a single peak day, respectively. 12 Michigan Public Service Commission. March 24, 2014. “Cost of Service Ratemaking.” Presentation. Accessed September 15, 2017. http://www.michigan.gov/documents/mpsc/2014marchMPSC_450649_7.pdf 13 Under a demand ratchet, monthly demand charges are based on their annual peak demand rather than the peak demand in that month. For example, under a 60 percent ratchet, the demand charge would be based on a minimum of 60 percent of the annual system peak, even in months when demand falls below that level.

PUBLICSECTORCONSULTANTS.COM MPSC DEMAND RESPONSE MARKET ASSESSMENT 23
ENERGY EFFICIENCY AND DEMAND RESPONSE
Some interviewees saw a strong link between energy efficiency and DR. Some of the energy management
systems that would be leveraged to curtail load during a DR event are used to monitor and manage overall
energy consumption levels. Interviewees recognize that certain energy-efficiency upgrades (e.g.,
installation of LED lighting) reduce energy consumption during peak periods. Many of the interviewees
have established sustainability goals for their organization and the combination of energy efficiency and
DR are seen as an important strategy for meeting those targets.
Some interviewees reported receiving incentives for peak load reductions derived through energy-
efficiency improvements. In these instances, the CP impact of an energy-efficiency improvement is
determined and the company gets credit for load reductions for a period of four years after the
installation. Respondents said this provides additional incentive for energy efficiency and prevents a
potential disincentive for DR from reducing the baseline peak demand from which DR performance is
measured.
OPPORTUNITIES FOR DEMAND RESPONSE FOR AGRICULTURAL CUSTOMERS
Based on experiences in other parts of the country, there was interest in the potential for DR from
agricultural customers, particularly in the area of irrigation control. PSC conducted interviews with
individuals directly involved in agriculture and a consultant to agricultural entities that advises on energy
management strategies for farms. These interviewees indicated that agricultural loads are not heavily
coincident with the system peak; their peak loads tend to occur in spring and fall. Very few customers
would be irrigating during a summer peak period (between 2:00 and 6:00 PM). Any irrigation done during
that time would typically be to preserve and protect delicate, high-value crops such as melons or tomatoes
from the same weather conditions that drive peak demand for electricity. Agricultural customers did
indicate there were loads they may be able to curtail during their peak usage periods, for example they use
refrigeration in the fall for storage during harvest periods. They indicated being able to interrupt those
loads for four-hour periods—the length of a typical DR event.
INPUTS TO THE DEMAND RESPONSE POTENTIAL STUDY PSC reviewed the inputs to the State of Michigan Demand Response Potential Study and compared them
to input from large commercial and industrial customers through a survey and interviews. To the extent
possible, we tried to obtain quantitative estimates of the amount of load that customers would be able and
willing to curtail under different program scenarios. However, given the wide variation in characteristics
and challenges in getting businesses to assess their likely behavior under different hypotheticals, our data
does not support precise estimates of potential participation rates or load reductions. We have gained
some useful insights from customers about their program participation decision making that help to
confirm baseline assumptions and identify program attributes important for an alternate “high case”
scenario considered in the potential study that would entail more aggressive program marketing and
higher incentives to garner increased participation. Exhibit 14 summarized the recommendations made to
adjust inputs to the State of Michigan Demand Response Potential Study based on the research conducted
with LCIs.

MPSC DEMAND RESPONSE MARKET ASSESSMENT PUBLICSECTORCONSULTANTS.COM 24
EXHIBIT 15. Recommended Inputs to the Michigan Demand Response Potential Study
Program Name Rationale for Difference
Emergency curtailment PSC estimates a higher dropout rate because a number of large customers expressed interest in other programs that promised greater opportunity for participation and could potentially migrate if these programs were available. Based on the input of interviewees and relative to incentive requirements for other programs, we recommend incentives of $15/kW-year for the low case and $20/kW-year for the high case.
Curtailment agreement PSC estimates a higher potential for participation based on the significant interest expressed by respondents; since these respondents also represent a higher percentage of load (40 percent of load compared to 25 percent of customers), PSC estimates that the percentage of peak reduction could also be higher. In the base case, the percent of load reduction ranged from 5 to 25 percent—larger companies tended to indicate larger load reductions, so PSC recommends a base case load reduction above the midpoint of the 5 to 25 percent range, or 20 percent. In the high case, the potential load reduction was 35 percent in total or a 50 percent increase over the base case. PSC recommends a 30 percent load reduction for the high case. In the interviews, some customers suggested $30–35/kW-year as a threshold level for encouraging participation, but that $50/kW-year would be a target incentive level.
Demand buyback/Energy exchange
Customers expressed interest in the program based on its flexibility, with particularly strong interest among high-load customers, which leads PSC to recommend higher participation rates and potential percentage of load reduction. There was some sensitivity to the length of DR, which leads to a lower PSC estimate. As a relatively new program to customers, there will need to be time allotted for a ramp-up program.
Time-of-use rates PSC recommends a downward adjustment to high-participation cases to allow for customer migration to other time-differentiated rate programs (CPP and real-time pricing).
Critical/variable peak pricing PSC recommended a lower participation rate given customers’ limited expressed capacity to participate in the program, and because those with capacity expressed interest in real-time pricing.
Real-time pricing PSC recommended a higher participation rate under the high case. Sophisticated, heavy users expressed strong interest in the ability to participate in real-time pricing in order to maximize their cost savings and revenue opportunities.
Irrigation control Opportunities for irrigational control are limited. Few customers are irrigating during the system peak are doing so to protect their crops during peak demand conditions.
SOURCE: PSC analysis of survey responses and in-depth interviews
CONCLUSIONS Large commercial and industrial customers with loads greater than one MW represent a significant
potential for DR. Much of the DR potential is concentrated with highly intensive energy users with flexible
loads. These users have a high degree of capability to monitor and adjust energy consumption during the
summer peak period and at other times during the year.
Both survey respondents and interviewees revealed the existence of four LCI user segments that vary
based on their energy intensity and their flexibility, either inherent in their business processes or as result
of the availability of enabling technologies (especially onsite generation). Exhibit 16 shows how various
industry or operation types interviewed the four primary LCI segments identified.

PUBLICSECTORCONSULTANTS.COM MPSC DEMAND RESPONSE MARKET ASSESSMENT 25
EXHIBIT 16. Segmentation Based on Demand Response Capabilities
SOURCE: PSC analysis of survey responses and in-depth interviews
LCIs with high energy intensity seek opportunities to manage their energy costs, often one of the highest
variable costs in their business. The energy users are willing to make firm commitments to reduce their
energy use during peak system times and when it is economically beneficial to them to do so. Less energy-
intensive entities with high degrees of flexibility are willing to reduce load, but are more likely to make
decisions to participate in DR programs based on specific opportunity. The less energy-intensive entities
may be driven by motivations other than energy cost reductions, for example, organizational
sustainability goals. However, participation in programs must be relatively easy and rewarding to gain
their interest.
RECOMMENDATIONS Following are several recommendations based on the surveys and interviews with large commercial and
industrial energy users in Michigan.
Leverage existing and new technologies for DR participation. Market benefits of DR from
control systems as supplemental to the significant operational benefits realized through installation of
these technologies. While both surveys and interviews indicated high penetrations of energy
management technologies, they are not being used for load curtailment. This could be because of
limited program opportunities, but as programs ramp up, leveraging existing capabilities may reduce
cost of participation (and possibly the required incentives) and expand participation. Many
respondents indicated they are evaluating various technology investments, including battery storage
and onsite generation. Program providers should be prepared to work with customers to analyze the
costs and benefits of such investments, including potential participation in DR.
Just-in-time manufacturing, 24/7 operations,
food storage and production
Process industries
Agriculture, healthcare
Universities, office buildings,
property management

MPSC DEMAND RESPONSE MARKET ASSESSMENT PUBLICSECTORCONSULTANTS.COM 26
Determine incremental benefits of auto-DR strategies. Respondents were apprehensive to
allow utilities or third-party providers to initiate load reductions (sometimes referred to as auto-DR)
due to concerns about safety and impact to production processes. Program providers will need to
convey the meaning of auto-DR clearly to potential participants, and develop auto-DR protocols in
order to alleviate some of their concerns. Incentives for auto-DR should reflect any incremental
benefits associated with the remote control of DR resources and potentially shorter notification
periods. Sharing case studies from other markets where this has been successfully implemented may
help gain customer acceptance.
Explore potential synergies between energy efficiency and DR. This could include the use of
common energy management technologies and recognizing peak load reductions from energy waste
reduction efforts. Program providers may consider conducting detailed site assessments that explore
both efficiency and load management opportunities for segments that indicate high willingness to
participate in either.
Convey to LCIs opportunities and constraints for backup generation use for load
shifting during DR events. Respondents seemed unaware and uncertain of the rules and the
extent to which backup generator operation could be allowed for participation in DR. Clarifying these
rules or limitations would enable LCIs with these resources to make informed decisions about
participation.
Keep program design parameters simple and flexible. Keep options for different durations
and notification periods within the same program to maximize flexibility for participation;
participants could opt out for either day-ahead or day-of notification and can choose between four-
hour and eight-hour event duration. This could allow for a wider participation base. Incentives may
reflect the participants’ choices, but the variation should be transparent to allow for informed decision
making.
Explore inherent capabilities of certain segments to participate in DR programs by
taking advantage of process storage in large industrials. Share successful case studies and
experience from other jurisdictions, especially the experiences of Michigan companies with facilities
in areas with more mature DR programs.
Periodically test Michigan’s current DR capabilities. Current interruptible-rate participants
note that it has been several years since load has been curtailed. While there are other jurisdictions
across the country where it has been a long time since emergency curtailments have occurred, it is
typical that a test event is conducted to allow participants to demonstrate their ability to shed load or
reach their firm service levels. A test would confirm the current demand response potential under
contract in the state.
Explore year-round DR opportunities. While the current market assessment and potential
study focused on DR opportunities at the time of the system peak, some respondents and interviewees
indicated the ability to respond to price signals and availability of resources at various times
throughout the year. As the electric generation mix in the state changes, the ability to modify and
shape electric loads may increase in value.
PUBLICSECTORCONSULTANTS.COM MPSC DEMAND RESPONSE MARKET ASSESSMENT A-1
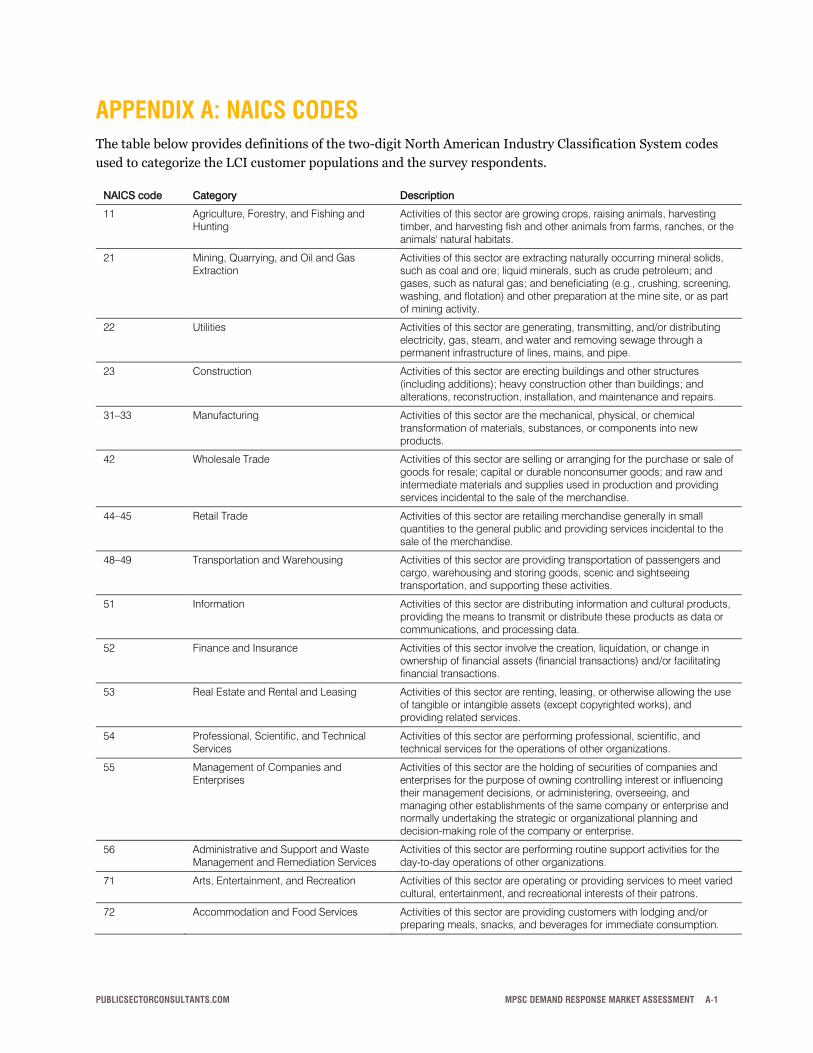
APPENDIX A: NAICS CODES The table below provides definitions of the two-digit North American Industry Classification System codes
used to categorize the LCI customer populations and the survey respondents.
NAICS code Category Description
11 Agriculture, Forestry, and Fishing and Hunting
Activities of this sector are growing crops, raising animals, harvesting timber, and harvesting fish and other animals from farms, ranches, or the animals' natural habitats.
21 Mining, Quarrying, and Oil and Gas Extraction
Activities of this sector are extracting naturally occurring mineral solids, such as coal and ore; liquid minerals, such as crude petroleum; and gases, such as natural gas; and beneficiating (e.g., crushing, screening, washing, and flotation) and other preparation at the mine site, or as part of mining activity.
22 Utilities Activities of this sector are generating, transmitting, and/or distributing electricity, gas, steam, and water and removing sewage through a permanent infrastructure of lines, mains, and pipe.
23 Construction Activities of this sector are erecting buildings and other structures (including additions); heavy construction other than buildings; and alterations, reconstruction, installation, and maintenance and repairs.
31–33 Manufacturing Activities of this sector are the mechanical, physical, or chemical transformation of materials, substances, or components into new products.
42 Wholesale Trade Activities of this sector are selling or arranging for the purchase or sale of goods for resale; capital or durable nonconsumer goods; and raw and intermediate materials and supplies used in production and providing services incidental to the sale of the merchandise.
44–45 Retail Trade Activities of this sector are retailing merchandise generally in small quantities to the general public and providing services incidental to the sale of the merchandise.
48–49 Transportation and Warehousing Activities of this sector are providing transportation of passengers and cargo, warehousing and storing goods, scenic and sightseeing transportation, and supporting these activities.
51 Information Activities of this sector are distributing information and cultural products, providing the means to transmit or distribute these products as data or communications, and processing data.
52 Finance and Insurance Activities of this sector involve the creation, liquidation, or change in ownership of financial assets (financial transactions) and/or facilitating financial transactions.
53 Real Estate and Rental and Leasing Activities of this sector are renting, leasing, or otherwise allowing the use of tangible or intangible assets (except copyrighted works), and providing related services.
54 Professional, Scientific, and Technical Services
Activities of this sector are performing professional, scientific, and technical services for the operations of other organizations.
55 Management of Companies and Enterprises
Activities of this sector are the holding of securities of companies and enterprises for the purpose of owning controlling interest or influencing their management decisions, or administering, overseeing, and managing other establishments of the same company or enterprise and normally undertaking the strategic or organizational planning and decision-making role of the company or enterprise.
56 Administrative and Support and Waste Management and Remediation Services
Activities of this sector are performing routine support activities for the day-to-day operations of other organizations.
71 Arts, Entertainment, and Recreation Activities of this sector are operating or providing services to meet varied cultural, entertainment, and recreational interests of their patrons.
72 Accommodation and Food Services Activities of this sector are providing customers with lodging and/or preparing meals, snacks, and beverages for immediate consumption.

A-2 MPSC DEMAND RESPONSE MARKET ASSESSMENT PUBLICSECTORCONSULTANTS.COM
81 Other Services (except Public Administration)
Activities of this sector are providing services not elsewhere specified, including repairs, religious activities, grantmaking, advocacy, laundry, personal care, death care, and other personal services.
92 Public Administration Activities of this sector are administration, management, and oversight of public programs by federal, state, and local governments.
SOURCE: Executive Office of the President, Office of Management and Budget. 2017. North American Industry Classification System. Accessed September 27, 2017. https://www.census.gov/eos/www/naics/

B-1 MPSC DEMAND RESPONSE MARKET ASSESSMENT PUBLICSECTORCONSULTANTS.COM
APPENDIX B: SURVEY INSTRUMENT
MPSC Demand Response Market Assessment – Large Commercial and Industrial Customer Online Survey – Overview
The objectives of the survey are to assess the potential for demand response (DR) programs and tariffs
specifically for large commercial and industrial customers (>1 MW peak demand). Specifically, this survey will
assess customer preferences for various types of DR programs and tariffs, motivations and barriers to
participation, and customer costs. Results from this survey will be used to inform the DR Market Assessment as
well as inform inputs for the DR potential study.
The following table summarizes the sections of the survey.
Section Description
Section 0. Screening Seeks to ensure the person responding to the survey is responsible for making/influencing decisions regarding their organization’s participation in a DR program or tariff
Section A. Firmographics Seeks to confirm size and type of industry, operating hours
Section B. Current Program Participation Seeks to assess awareness and participation in DR programs currently offered by utilities in Michigan, as well as load nominated and costs incurred
Section C. Program Design Preferences Seeks to assess preference for DR programs and tariffs, as well as how preferences change with changes in program design features (event duration, notification period)
Section D. Customer Capabilities and Technology Seeks to assess existing and planned customer DR-enabling capability and role of technology on program participation
Section E. Customer Motivators and Barriers to Participation
Summary section seeks to assess role of various factors in motivating/preventing participation in a DR program or tariff
Section F. Customer Costs to Participate Seeks to assess type/magnitude of customer costs associated with participating in a DR program or tariff
Section X. Close Closing section
The following table identifies which questions will be used to inform the DR potential study.
Question Input for DR Potential Study
C1 Participation rates for program types by business type/industry
C2-5 Peak load reduction for program types by business type/industry
D1-13 Saturation rates of enabling technologies and back-up generation
B10-11 and F1-3 Customer costs
This survey will target up to 100 completes from large commercial and industrial customers (>1 MW peak
demand) in Michigan, with representation across the state and across business types/industries. The survey
will be conducted online.

B-2 MPSC DEMAND RESPONSE MARKET ASSESSMENT PUBLICSECTORCONSULTANTS.COM
Survey Instrument
INTRO. The Michigan Public Service Commission (MPSC) and the Michigan Agency for Energy thank you for
taking the time to complete this important survey. Your responses will help to guide the implementation of
energy policy in the state to ensure affordable and reliable energy services for Michigan businesses and
residents. The MPSC is collecting this information from hundreds of customers and will aggregate the survey
results to guide development of policies and programs that are both cost-effective and appealing to most
program participants. Your individual responses will be strictly confidential.
This survey asks questions about your awareness of and preferences for demand response programs. Demand
response programs are typically offered by electric utility providers. Through demand response programs,
participating customers commit to reduce their electricity usage when requested. The programs help reduce
emissions from electricity generation, reduce the purchase of expensive energy, and delay the installation of
costly utility equipment.
The survey includes sections that ask about the following topics:
- Information about your business
- Your awareness of and experience participating in demand response programs
- Program design options and preferences for different program features
- The types of energy management technologies your company has and how they might be used to
participate in demand response programs
- The types of costs your company would incur to participate in a demand response program
- Any additional thoughts you would want to share related to demand response policies or programs
Some questions will ask for you to rank concepts or program features; other questions ask for characteristics of
your business or estimates of potential reductions in load under certain program scenarios. Please feel free to
provide your best estimate to these questions or to indicate you don’t know. We are most interested in getting
your broad input on the factors that influence your company’s interest and ability to participate in demand
response programs.
If you have any questions regarding the survey, you may call Jill Steiner at Public Sector Consultants or David
Isakson at the Michigan Public Service Commission. Their contact information is listed below.
Dave Isakson Rates and Tariff, Regulated Energy Division Michigan Public Service Commission Staff [email protected] (517) 284-8285
Jill Steiner Director of Evaluation Public Sector Consultants [email protected] (517) 331-9469
This survey is estimated to take 20 minutes or less. If you begin the survey and must stop, you can return to the
survey any time in the next week using the link in the email invitation to the survey.
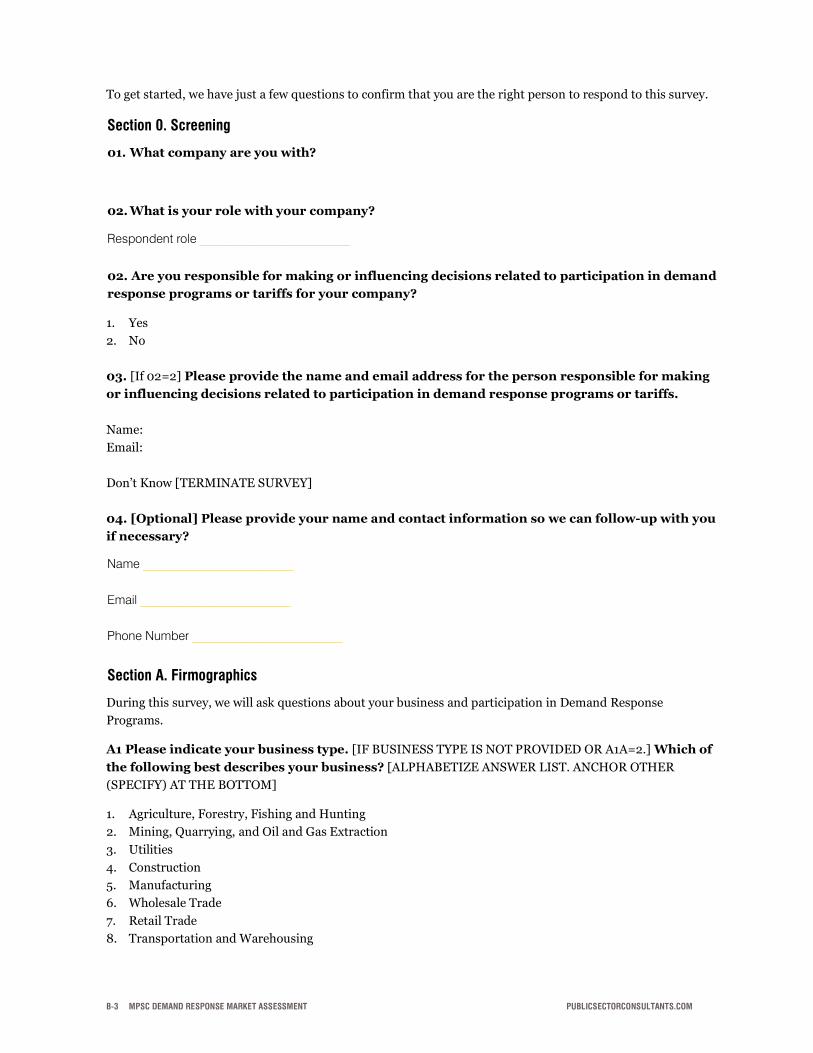
B-3 MPSC DEMAND RESPONSE MARKET ASSESSMENT PUBLICSECTORCONSULTANTS.COM
To get started, we have just a few questions to confirm that you are the right person to respond to this survey.
Section 0. Screening
01. What company are you with?
02. What is your role with your company?
Respondent role ________________________
02. Are you responsible for making or influencing decisions related to participation in demand
response programs or tariffs for your company?
1. Yes
2. No
03. [If 02=2] Please provide the name and email address for the person responsible for making
or influencing decisions related to participation in demand response programs or tariffs.
Name:
Email:
Don’t Know [TERMINATE SURVEY]
04. [Optional] Please provide your name and contact information so we can follow-up with you
if necessary?
Name ________________________
Email ________________________
Phone Number ________________________
Section A. Firmographics
During this survey, we will ask questions about your business and participation in Demand Response
Programs.
A1 Please indicate your business type. [IF BUSINESS TYPE IS NOT PROVIDED OR A1A=2.] Which of
the following best describes your business? [ALPHABETIZE ANSWER LIST. ANCHOR OTHER
(SPECIFY) AT THE BOTTOM]
1. Agriculture, Forestry, Fishing and Hunting
2. Mining, Quarrying, and Oil and Gas Extraction
3. Utilities
4. Construction
5. Manufacturing
6. Wholesale Trade
7. Retail Trade
8. Transportation and Warehousing

B-4 MPSC DEMAND RESPONSE MARKET ASSESSMENT PUBLICSECTORCONSULTANTS.COM
9. Information
10. Finance and Insurance
11. Real Estate and Rental and Leasing
12. Professional, Scientific, and Technical Services
13. Management of Companies and Enterprises
14. Administrative and Support and Waste Management and Remediation Services
15. Educational Services
16. Health Care and Social Assistance
17. Arts, Entertainment, and Recreation
18. Accommodation and Food Services
19. Other Services (except Public Administration)
20. Public Administration
21. Other (please specify) ________________________
A2. About how many locations does your business have in the state of Michigan?
A3. At your largest or primary location in Michigan, approximately what size, in square feet, is the building you occupy or the space that your business operates in? If you do not have a primary or largest location, please consider one of your locations that is typical and answer based on that location. We will ask you to keep that location in mind when answering questions about the types of equipment you have or your likelihood to participate in different types of demand response programs.
________________________ square feet
________________________ Don’t know
A4. Please provide the address of your largest location or the location that you have in mind when answering the survey questions.
Address ________________________
A5. Which best describes the type of building or facility at that address?
1. Education
2. Food Sales
3. Food Service
4. Health Care (Inpatient)
5. Health Care (Outpatient)
6. Lodging
7. Retail
8. Office
9. Public Assembly
10. Public Order and Safety
11. Religious Worship
12. Service
13. Warehouse and Storage
14. Fabrication
15. Food Manufacturing
16. Heavy Industry

B-5 MPSC DEMAND RESPONSE MARKET ASSESSMENT PUBLICSECTORCONSULTANTS.COM
17. Process
18. Tech Facilities
19. Other (please specify) ________________________
A6. Approximately how many full-time and part-time employees work for your company in Michigan?
________________________ employees
________________________ Don’t know
A7. Approximately how many full-time and part-time employees work at the location that you will base your responses on?
________________________ employees
________________________ Don’t know
A9. Which of the following most closely corresponds to hours of operation at the location you are considering? This would be the period when most employees are present.
1. 8 hours per day, 5 days per week
2. 12 hours per day, 5 days per week
3. 8 hours per day, 7 days per week
4. 12 hours per day 7 days per week
5. 24 hours per day 7 days a week
6. Other, (please specify) _______________________
7. Don’t know
Section B. Current Program Participation
The next questions ask about your awareness and experience with demand response programs.
[INTRO ON DR] As described, through demand response programs, participating customers commit to reduce
their electricity usage when requested. By reducing overall energy use at that time of the system peak, demand
response programs help reduce emissions from electricity generation, reduce the purchase of expensive energy,
and delay the installation of costly utility equipment.
Typically, participating customers are asked to reduce their electricity usage for approximately four hours, up
to a maximum of ten times during the summer months (May through September). These requests are often
issued on days when peak demand on the utility system is extremely high, such as a very hot day. The request
to reduce load is often referred to as a Demand Response event (DR event). Participating customers receive a
financial incentive – a monthly incentive, paid per kilowatt pledged to the program, and/or an energy
incentive, paid per kilowatt-hour reduced.
Alternatively, customers may also be enrolled in a demand response tariff, such as Time-Of-Use (TOU), Critical
Peak Pricing (CPP) and Real Time Pricing (RTP), which sends time-differentiated price signals to enrolled
customers to reduce demand during peak periods.
B1. Prior to responding to this survey, had you heard of demand response programs or tariffs
before?
1. Yes
2. No [If no, skip to section C]

B-6 MPSC DEMAND RESPONSE MARKET ASSESSMENT PUBLICSECTORCONSULTANTS.COM
B2. [If B1=1] How did you hear about demand response programs or tariffs?
1. My current utility provider provided information
2. Another utility provider provided information
3. A third-party demand response service provider (sometimes called aggregator) provided information
4. A colleague in my same business/industry
5. A colleague in another business/industry
6. Other, (please specify) ________________________
B3. Are you or have you participated in any demand response programs or tariffs? [SELECT ALL
THAT APPLY]
1. Yes, I am currently participating or have participated in a program offered by Consumers Energy in
Michigan
2. Yes, I am currently participating or have participated in programs offered by another utility provider in
Michigan
3. Yes, I am participating or have participated in programs outside of Michigan
4. No, I am not currently nor have I participated in any demand response programs or tariffs
B4. [If B3=2, 3,4] Are you familiar with any of the demand response programs or tariffs offered
by [utility company] listed below?
[INCLUDE PROGRAM DESCRIPTIONS]
Program Name Yes, I am aware of this
program
1. Program 1
2. Program 2
3. Program 3
B5. [If B4=1,2,3,] Of the programs you are aware of, has your company considered participation
in [pipe in program 1, program2, …]?
Program Name Yes, I have considered
participating
1. Program 1
2. Program 2
3. Program 3
B6. [If B5=1,2,3,4,5,6] What has prevented you from participating?
B7. [If B3=1] Which programs are you participating in offered by [utility company]?
Program Name Yes, I am participating
1. Program 1
2. Program 2
3. Program 3

B-7 MPSC DEMAND RESPONSE MARKET ASSESSMENT PUBLICSECTORCONSULTANTS.COM
B8. [If B3=1,2,3,4,5, or 6] What is the peak demand reduction in kW or percent of your total
facility load you have subscribed to or pledged through [pipe in program 1, program2, … - if
participating in more than one program, display “those programs”]?
________________________ kilowatts
________________________ percent of total facility load
B9. [If B3=1] What motivated you to participate in [pipe in program 1, program2, … - if
participating in more than one program, display “those programs”]?
[RECORD OPEN ENDED RESPONSE]
B10. [If B3=1,2,3,4,5, or 6] What costs have you or do you incur to participate in a demand response program? Please check all that apply.
1. Time to evaluate different participation options
2. Site assessment to identify load curtailment/shifting strategies
3. Investment in equipment to manage load/achieve load reductions
4. Staff time required to manage load/achieve load reductions
5. Lost production/productivity
6. Impact to meet production quotas
7. Occupant comfort issues
8. Safety issues
9. Other (please specify) ________________________
10. Other (please specify) ________________________
11. Don’t know
Programming note: Rotate response options 1-8.
B11. [If B3=1 and F1= 1,2,3, 4, 5] How well do the incentives received cover the direct and indirect
costs incurred to participate in the demand response program?
1. The incentives more than cover the cost of participating in a demand response program.
2. The incentives just the cost of participating in a demand response program.
3. The incentives do not cover the full cost of participating in a demand response program.
4. Don’t know
B12. [If B3=1 and F1= 1,2,3, 4, 5] On a scale of one to ten where one is an extreme barrier and ten is
no barrier at all to participating in program, rate the impact of costs incurred on your decision
to participate in demand response.
Extreme Barrier - 1
2 3 5 5 6 7 8 9 No Barrier at All - 10
Costs to Participate in a Demand Response Program

B-8 MPSC DEMAND RESPONSE MARKET ASSESSMENT PUBLICSECTORCONSULTANTS.COM
Section C. Program Design Preferences
The following sections presents different type of demand response programs for your consideration
[INTRO ON PDP]. As noted previously, the MPSC is interested in supporting the development of demand
response programs that are cost-effective, appeal to customers, and support reliable and affordable energy. The
next series of questions seeks your input on the different types of demand response programs available with the
objective of understanding which program features are most appealing, and which present the greatest barriers
to participation.
C1. The table below identifies and describes two different incentive based DR programs. Please review the table
below carefully before responding to the next series of questions. You can use the link “DR Program
Descriptions” to access this information as you complete the survey.
Program Name Description Response Incentive
Curtailment Agreement
Firm capacity reduction commitment between the DR service provider and customer.
Mandatory response requirement; penalties for failure to reduce load during a DR event
Two components:
Capacity payment ($/kW-yr)
Energy payment ($/kWh)
Fixed capacity payment ($/kW-yr) based on the committed capacity; paid regardless of whether DR events are called; energy payment based on actual energy reduced during an event.
Note that the capacity payment constitutes bulk of the total incentive amount.
Demand Buyback/Energy Exchange
No firm capacity reduction commitment; voluntary energy reduction only based on a set or market price.
Voluntary participation; no penalties for non-participation.
Energy payment ($/kWh) only; paid only if performance is met.
On a scale of one to ten, where one is not at all likely and ten is extremely likely, how likely are
you to participate in the following DR programs or tariffs:
Not at All Unlikely - 1
2 3 4 5 6 7 8 9 Extremely Likely - 10
Don’t know
1. Curtailment Agreement
2. Demand Buyback/ Energy
Exchange
C1a. Could you provide some information about why you gave these ratings?
[RECORD OPEN ENDED RESPONSE]
C2. The table below identifies and describes three DR programs that use time-varying rates. Please review the
table below carefully before responding to the next series of questions. Remember, you can use the link “DR
Program Descriptions” to access this information as you complete the survey.

B-9 MPSC DEMAND RESPONSE MARKET ASSESSMENT PUBLICSECTORCONSULTANTS.COM
Program Name Description Response Incentive
Time-of-use (TOU) Rates
Time-differentiated tariff with defined peak and off-peak periods; peak to off-peak price ratio typically does not exceed 4:1.
Can be offered either as an “opt-in” or “default with opt-out”.
Enrolled customers have a lower off-peak price than their standard rate and can realize bill savings by shifting their consumption from peak to off-peak periods.
Critical Peak Pricing (CPP)
A CPP tariff includes a high peak to off-peak price ratio during certain “critical” peak periods in the year during which the utility is likely to call DR events. Critical peak to off-peak price ratios typically range from 4:1 to 10:1.
Can be offered either as an “opt-in” or “default with opt-out”.
Customers on the CPP tariff reduce load during the critical peak event periods to avoid paying the high critical peak price during those periods; they also have a lower off-peak price than their standard rate offer and can realize bill savings by shifting their energy use to off-peak periods.
Real-time Pricing Hourly market price based tariff to customers.
Voluntary opt-in offer. Customers respond to hourly fluctuations in energy prices and modify their usage accordingly.
On a scale of one to ten, where one is not at all likely and ten is extremely likely, how likely are
you to participate in the following DR programs or tariffs:
Not at All Likely - 1
2 3 4 5 6 7 8 9 Extremely Likely - 10
Don’t know
1. Time-of-use (TOU) Rates
2. Critical Peak Pricing (CPP)
3. Real-time Pricing
In the next set of questions, we will ask you about you to specify how much load you would be
able to curtail or shift when DR events are called if you were participating in that demand
response program. We will present different combinations of notification period, duration of
demand response event, and incentive levels and will ask you to estimate your approximately
how many kilowatts, or what percentage of typical total facility load, you would curtail/shift
under each scenario. Would you prefer to provide your estimates of demand response load
reductions in kW or percent of facility peak demand?
1. kW
2. Percent of facility peak demand
3. Don’t know (skip to section D)
Programming note: Create link “DR Program Descriptions” to allow respondents to access this table while answering the following questions. Customers will get one set of the following questions depending on their answer to QC1.

B-10 MPSC DEMAND RESPONSE MARKET ASSESSMENT PUBLICSECTORCONSULTANTS.COM
C2. [If highest rating in C1 is Curtailment Agreement] Assume the curtailment agreement DR program
will involve a maximum of 10 events per summer, with each event lasting maximum 4 hours
(i.e., a maximum of 40 annual DR event hours). As a participant, you would receive notification
of a DR event one day in advance. In exchange for your participation you would receive
incentives of $25 per kW per year and $0.10 per kWh (for example if you nominated 200 kW,
you would receive an incentive of $5,000 in addition to an $800 energy incentive). How many
kilowatts or what percentage of facility peak demand would you be able to curtail?
Program Name kW Percent of facility peak
demand
Curtailment Agreement
C2a. If the event duration was longer, say 6-8 hours, approximately how many kilowatts or
what percentage of facility peak demand would you be able to curtail under a Curtailment
Agreement? (Note that the annual maximum DR event hours remain at 40, individual events
are longer, so the frequency of dispatch decreases. As a participant, you would continue to be
notified of a DR event one day in advance and receive the same level of incentives).
Program Name kW (original) [from C2; 4-hr. event]
kW (long duration; 6- to 8-hr. event)
Percent of facility peak demand [from C2; 4-hr. event]
Percent of facility peak demand; 6- to 8-hr. event)
Curtailment Agreement
C2b. [If C2-C2a≠0] Please explain why an increase in event duration would result in this change
in curtailment?
[Display C2-C2a] kW ________________________ [Display C2-C2a] % of total demand ________________________ Programming note: If table above can be shown on the same screen, not need for the additional display. Applies throughout section. C2c. If the notification period was shorter, say 30 min.-1hr., approximately how many kilowatts
or what percentage of facility peak demand would you be able to curtail under a Curtailment
Agreement? (Note that the annual maximum DR event hours remain unchanged at 40 hours,
with event duration reverting to a maximum of 4 hours).
Program Name kW (original) [from C2; long notification period, day-ahead]
kW (short notification period, 30 min to 1 hour)
Percent of facility peak demand (original, long notification period; day-ahead) [from C2]
Percent of facility peak demand (short notification period, 30 min-1 hr)
Curtailment Agreement
C2d. [If C2-C2c≠0] Please explain why a shorter notification period would result in this change in
curtailment?
[Display C2-C2c] kW ________________________ [Display C2-C2c] % of facility peak demand ________________________

B-11 MPSC DEMAND RESPONSE MARKET ASSESSMENT PUBLICSECTORCONSULTANTS.COM
C2e. If the incentive increased from $25 per kW-year to $40 per kW-year, how many kilowatts
or what percentage of facility peak demand would you be able to curtail?
Program Name kW (original) [from C2]
kW (lower incentive) Percent of facility peak demand (original) [from C2]
Percent of facility peak demand (lower incentive)
Curtailment Agreement
C2f. [If C2-C2e≠0] Please explain why a change in incentive level would result in this change in
curtailment?
[Display C2-C2e] kW ________________________ [Display C2-C2e] of facility peak demand ________________________
C3. [If highest rating in C1 is Demand Buyback/Energy Exchange] Assume the demand buyback/energy
exchange DR program will involve a maximum of 10 events per summer, with each event lasting
maximum 4 hours (i.e., a maximum of 40 annual DR event hours). As a participant, you would
receive notification of a DR event one day in advance. In exchange for your participation you
would receive an energy incentive of $0.50 per kWh (for example if you nominated 200 kW,
you would receive an incentive of $4,000). How many kilowatts or what percentage of facility
peak demand would you be able to curtail?
Program Name kW Percent of facility peak
demand
Demand Buyback/Energy Exchange
C3a. If the event duration was longer, say 6-8 hours, approximately how many kilowatts or
what % of your typical facility load would you be able to curtail under the Demand
Buyback/Energy Exchange program? (Note that the annual maximum DR event hours remain
at 40, individual events are longer, so the frequency of dispatch decreases. As a participant,
you would continue to be notified of a DR event one day in advance and receive the same level
of incentives).
Program Name kW (original) [from C3; 4-hr. event]
kW (long duration; 6- to 8-hr. event)
Percent of facility peak demand (original) [from C3; 4-hr. event]
Percent of facility peak demand (long duration; 6- to 8-hr. event)
Demand Buyback/Energy Exchange
C3b. [If C3-C3a≠0] Please explain why an increase in event duration would result in this change
in curtailment?
[Display C3-C3a] kW ________________________ [Display C3-C3a] % of facility peak demand ________________________
C3c. If the notification period was shorter, say 30 min.-1hr., approximately how many kilowatts
or what % of your typical facility load would you be able to curtail under the Demand
Buyback/Energy Exchange program? (Note that the annual maximum DR event hours remain
unchanged at 40 hours, with event duration reverting to a maximum of 4 hours).

B-12 MPSC DEMAND RESPONSE MARKET ASSESSMENT PUBLICSECTORCONSULTANTS.COM
Program Name kW (original) [from C3; long notification period, day-ahead]
kW (short notification period, 30 min to 1 hour)
Percent of facility peak demand (original, long notification period; day-ahead) [from C3]
Percent of facility peak demand (short notification period, 30 min-1 hr)
Demand Buyback/Energy Exchange
C3d. [If C3-C3ca≠0] Please explain why a shorter notification period would result in this change
in curtailment?
[Display C3-C3c] kW ________________________ [Display C3-C3c] of facility peak demand ________________________
C3e. If the incentive decreased from $0.50 per kWh to $0.30 per kWh, how many kilowatts or
what percentage of facility peak demand would you be able to curtail?
Program Name kW (original) [from C3]
kW (lower incentive) Percent of facility peak demand (original) [from C3]
Percent of facility peak demand (lower incentive)
Demand Buyback/Energy Exchange
C3f. [If C3-C3e≠0] Please explain why a change in incentive level would result this change in
curtailment?
[Display C3-C3e] kW ________________________ [Display C3-C3e] % of facility peak demand ________________________
C4. [If highest rating in C1 is Critical Peak Pricing] Approximately how many kilowatts, or what
percentage of typical total facility load, would you be able to curtail/shift when critical peak
events are called? Assume the critical peak pricing program will involve a maximum of 10
events per summer, with each event lasting maximum 4 hours (i.e., a maximum of 40 annual
DR event hours). As a participant, you would receive notification of a critical peak pricing event
one day in advance. Also, assume the peak price is six times higher than the off-peak rate (for
example if the off-peak rate is $0.08 per kWh, and the rate during the critical peak event is
$0.48 per kWh).
Program Name kW % of total facility demand
Critical Peak Pricing
C4a. If the event duration was longer, say 6-8 hours, approximately how many kilowatts or
what % of your typical facility load would you be able to curtail under the Critical Peak Pricing
rate? (Note that the annual maximum event hours remain at 40, individual events are longer,
so the frequency of dispatch decreases. As a participant, you would continue to be notified of a
DR event one day in advance and face the same price ratio).
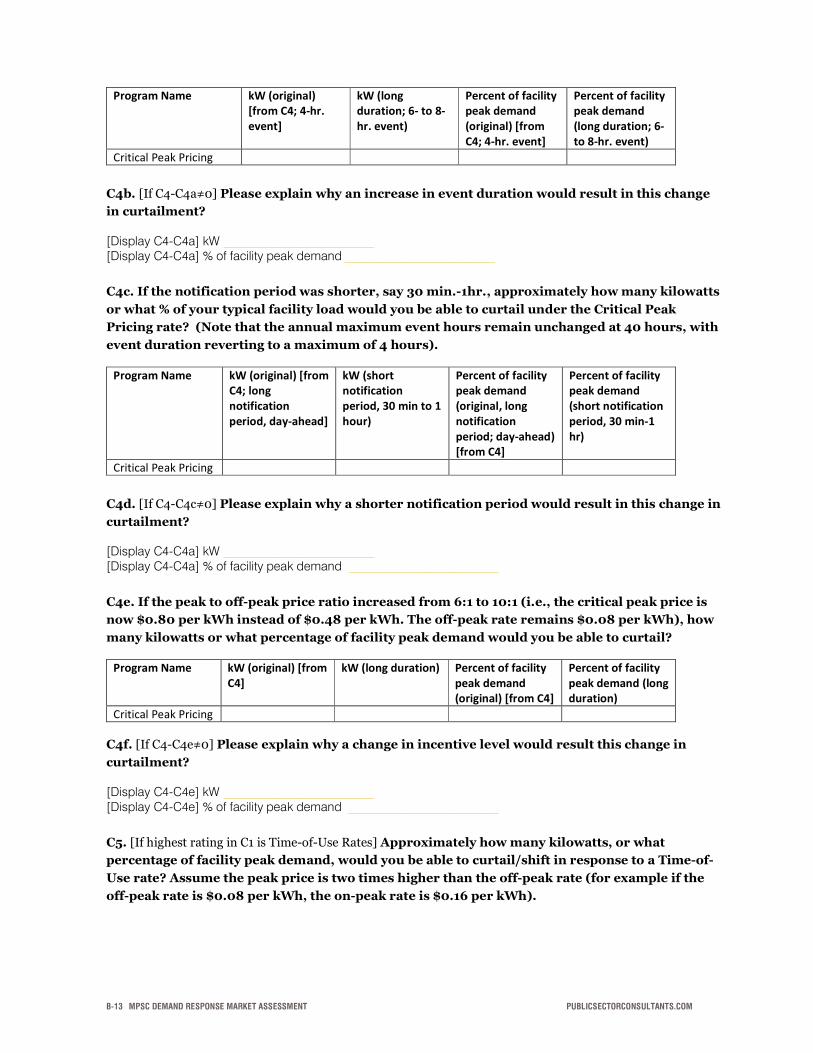
B-13 MPSC DEMAND RESPONSE MARKET ASSESSMENT PUBLICSECTORCONSULTANTS.COM
Program Name kW (original) [from C4; 4-hr. event]
kW (long duration; 6- to 8-hr. event)
Percent of facility peak demand (original) [from C4; 4-hr. event]
Percent of facility peak demand (long duration; 6- to 8-hr. event)
Critical Peak Pricing
C4b. [If C4-C4a≠0] Please explain why an increase in event duration would result in this change
in curtailment?
[Display C4-C4a] kW ________________________ [Display C4-C4a] % of facility peak demand ________________________
C4c. If the notification period was shorter, say 30 min.-1hr., approximately how many kilowatts
or what % of your typical facility load would you be able to curtail under the Critical Peak
Pricing rate? (Note that the annual maximum event hours remain unchanged at 40 hours, with
event duration reverting to a maximum of 4 hours).
Program Name kW (original) [from C4; long notification period, day-ahead]
kW (short notification period, 30 min to 1 hour)
Percent of facility peak demand (original, long notification period; day-ahead) [from C4]
Percent of facility peak demand (short notification period, 30 min-1 hr)
Critical Peak Pricing
C4d. [If C4-C4c≠0] Please explain why a shorter notification period would result in this change in
curtailment?
[Display C4-C4a] kW ________________________ [Display C4-C4a] % of facility peak demand ________________________
C4e. If the peak to off-peak price ratio increased from 6:1 to 10:1 (i.e., the critical peak price is
now $0.80 per kWh instead of $0.48 per kWh. The off-peak rate remains $0.08 per kWh), how
many kilowatts or what percentage of facility peak demand would you be able to curtail?
Program Name kW (original) [from C4]
kW (long duration) Percent of facility peak demand (original) [from C4]
Percent of facility peak demand (long duration)
Critical Peak Pricing
C4f. [If C4-C4e≠0] Please explain why a change in incentive level would result this change in
curtailment?
[Display C4-C4e] kW ________________________ [Display C4-C4e] % of facility peak demand ________________________
C5. [If highest rating in C1 is Time-of-Use Rates] Approximately how many kilowatts, or what
percentage of facility peak demand, would you be able to curtail/shift in response to a Time-of-
Use rate? Assume the peak price is two times higher than the off-peak rate (for example if the
off-peak rate is $0.08 per kWh, the on-peak rate is $0.16 per kWh).

B-14 MPSC DEMAND RESPONSE MARKET ASSESSMENT PUBLICSECTORCONSULTANTS.COM
Program Name kW Percent of facility peak
demand
Time-of-use Rates
C5a. If the peak to off-peak price ratio increased from 2:1 to 4:1 (i.e., the on-peak rate is now
$0.32 per kWh instead of $0.16 per kWh. The off-peak rate remains $0.08 per kWh), how many
kilowatts or what percentage of facility peak demand would you be able to curtail?
Program Name kW (original) [from C2]
kW (long duration) Percent of facility peak demand (original) [from C2]
Percent of facility peak demand (long duration)
Time-of-use Rates
C5b. Please explain why a change in incentive level would result this change in curtailment?
[Display C5-C5a] kW ________________________ [Display C5-C5a] % of facility peak demand ________________________
C6. [If highest rating in C1 is Real Time Pricing] Approximately how many kilowatts, or what
percentage of facility peak demand, would you be able to curtail/shift in response to real time
prices?
Program Name kW Percent of facility peak
demand
Real-time Pricing
C7. If the utility offered a program where the notification period (the time between the utility
calling a DR event and the time when you would be expected to make reductions in load) was
considerably shorter, say 10 minutes or less, approximately how many kilowatts or what
percentage of facility peak demand would you be able to curtail?
Load Curtailment (kw) Load Curtailment (Percent of facility peak demand)
Fast Response Capability (10 min. or less notification)
Section D. Customer Capabilities and Technology
The MPSC is interested in understanding whether your facility has technologies that enable demand response,
such as an Energy or Building Management System (EMS/BMS) or other control system, storage, or on-site
generation. Other customers participating in Demand Response programs have found these technologies useful
for meeting their pledged reductions.
An EMS/BMS or other control system can help to identify which equipment or systems can be
turned off or adjusted to respond to demand response events or varying electricity price signals.
Energy storage (battery, thermal, process) allows participants to store energy when it is most
convenient and rely on the storage to respond to demand response events or varying electricity price
signals.

B-15 MPSC DEMAND RESPONSE MARKET ASSESSMENT PUBLICSECTORCONSULTANTS.COM
Participants can rely on non-emergency on-site generation to respond to demand response
events or varying electricity price signals.
D1. Which of the following technologies, if any, do you have at your typical facilities?
Please select all that apply.
1. Energy or Building Management System (that primarily controls HVAC load)
2. Lighting Control System
3. Process Control System
4. Battery storage
5. Thermal storage
6. Non-Emergency On-Site generation
7. Solar Photovoltaics
8. Other Control Technology (please specify) ________________________
9. None of the above
D2. [IF D1=1 and/or 2, 3] Do you use a control system to automatically reduce power use during a
DR event?
1. Yes
2. No
3. Don't Know
D3. [ASK IF D1=1 and/or 2,3] Approximately how much of your overall energy usage is controlled
by the [PIPE IN D1 response]?
________________________ percent controlled by [If D1=1] Energy or Building Management System
________________________ percent controlled by [If D1=2] Lighting or Process Control System
Programming Note: Answers should not add up to more than 100 percent. If greater than 100 percent present message: Total percent of overall energy usage controlled by EMS/BMS and Lighting or Process Systems cannot be greater than 100. If these systems overlap, enter the percent of energy usage where the system is the primary form of control.
D4. [IF D1=4] You indicated that your facility has battery storage capabilities. What type of
battery storage do you have? Please select all that apply.
1. Lithium Ion
2. Lead Acid
3. Other (please specify) ________________________
D5. [IF D1=4] Approximately what is the battery storage capacity?
________________________ kilowatts
________________________ kilowatt-hours
________________________ percent of your facilities’ daily load
D6. [IF D1=5] Approximately what percentage of your facility load can be shifted to thermal
storage?
Non-battery Storage Type % of total facility load that can be shifted
Thermal storage

B-16 MPSC DEMAND RESPONSE MARKET ASSESSMENT PUBLICSECTORCONSULTANTS.COM
D7. [IF D1=6] You indicated that you have non-emergency on-site generation at your facility.
What type of generator do you have? Please select all that apply.
1. Diesel, engine
2. Natural gas, engine
3. Other (please specify) ________________________
D8. [IF D1=6] Approximately what size is your generating unit(s)?
________________________ kilowatts
D9. [IF D1=6] Approximately what percentage of your facility load can be shifted to the on-site
generator?
________________________ %
D10. [IF D1=7] You indicated that you have Solar Photovoltaics at your facility. Approximately
what size is your system?
________________________ kilowatts
D11. [Show if D1=1-7] Please rate how influential having this technology is on your decision to
participate in a demand response program or tariff on a scale of one to ten, where 1 means no
influence at all and 10 means extremely influential
No Influence
- 1 2 3 5 5 6 7 8 9
Extremely Influential
- 10
[If D1=1] Energy or Building Management System
[If D1=2] HVAC, Lighting, Process, or Other Control System
[If D1 = 3] Battery Storage
[If D1 = 4] Thermal Storage
[If D1 = 5] Process Storage
[If D1=6] Non-Emergency On-Site Generation
[If D1=7] Solar Photovoltaics
[If D1=8] Other Control Technology
D12. Do you currently have process storage capabilities at your typical facilities? Process
storage is the ability shift process schedules to accommodate a demand response event or peak
period.
1. Yes
2. No
D13. [IF D12=1] Please rate how influential having process storage is on your decision to
participate in a demand response program or tariff on a scale of one to ten, where 1 means no
influence at all and 10 means extremely influential.
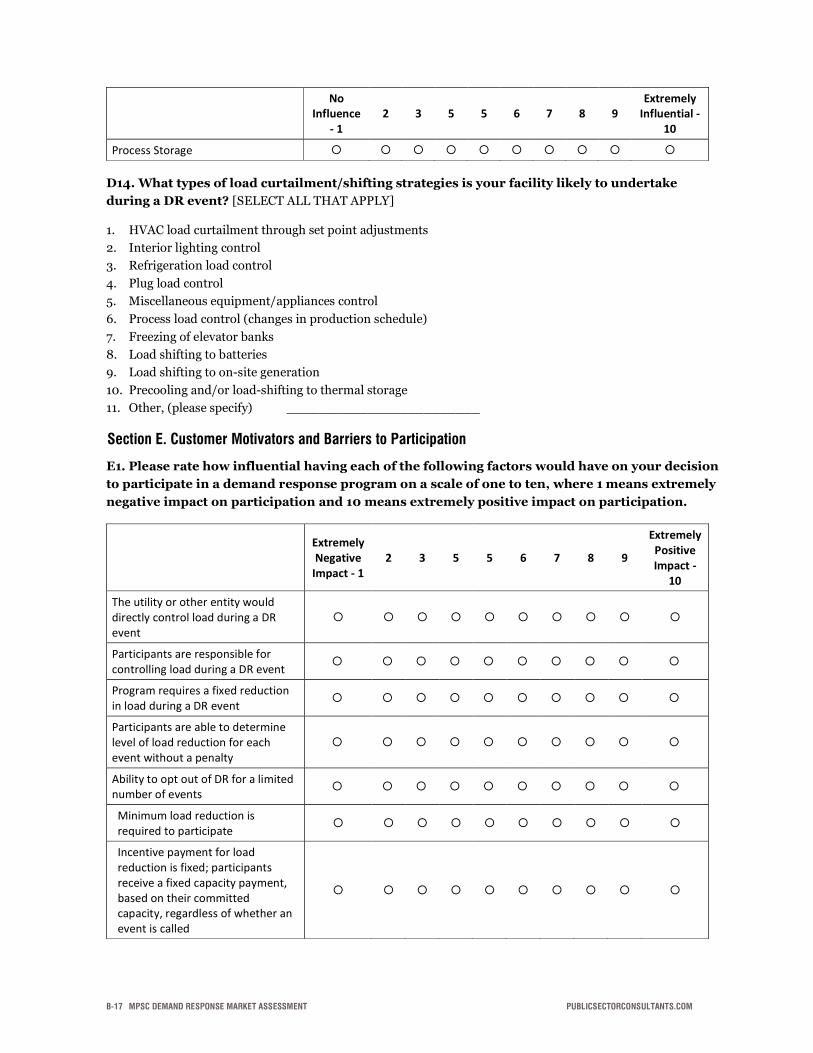
B-17 MPSC DEMAND RESPONSE MARKET ASSESSMENT PUBLICSECTORCONSULTANTS.COM
No Influence
- 1 2 3 5 5 6 7 8 9
Extremely Influential -
10
Process Storage
D14. What types of load curtailment/shifting strategies is your facility likely to undertake
during a DR event? [SELECT ALL THAT APPLY]
1. HVAC load curtailment through set point adjustments
2. Interior lighting control
3. Refrigeration load control
4. Plug load control
5. Miscellaneous equipment/appliances control
6. Process load control (changes in production schedule)
7. Freezing of elevator banks
8. Load shifting to batteries
9. Load shifting to on-site generation
10. Precooling and/or load-shifting to thermal storage
11. Other, (please specify) ________________________
Section E. Customer Motivators and Barriers to Participation
E1. Please rate how influential having each of the following factors would have on your decision
to participate in a demand response program on a scale of one to ten, where 1 means extremely
negative impact on participation and 10 means extremely positive impact on participation.
Extremely Negative
Impact - 1 2 3 5 5 6 7 8 9
Extremely Positive Impact -
10
The utility or other entity would directly control load during a DR event
Participants are responsible for controlling load during a DR event
Program requires a fixed reduction in load during a DR event
Participants are able to determine level of load reduction for each event without a penalty
Ability to opt out of DR for a limited number of events
Minimum load reduction is required to participate
Incentive payment for load reduction is fixed; participants receive a fixed capacity payment, based on their committed capacity, regardless of whether an event is called

B-18 MPSC DEMAND RESPONSE MARKET ASSESSMENT PUBLICSECTORCONSULTANTS.COM
Energy payment based on real-time market prices with varying bid amounts based on the prices; there is no fixed capacity payment
Fast response requirement, with less than ten-minute event notification
Load reductions impact operations and business processes
Utility or other entity provides an audit to identify load curtailment/shifting strategies
Visibility into real-time energy usage
Energy savings benefits realized through participation in a DR program or tariff
Greater visibility into facility operations through DR program dashboards
Programming Note: Employ a slider bar. Randomize list.
E2. Are there any other factors that would motivate you to participate in a demand response
program or tariff?
[RECORD OPEN ENDED RESPONSE]
E3. Are there any other factors that would prevent you from participating in a demand
response program or tariff?
[RECORD OPEN ENDED RESPONSE]
Section F. Customer Costs to Participate
F1. [If B3=2,3] What costs do you anticipate that you would incur to participate in a demand response program? Please check all that apply.
1. Time to evaluate different participation options
2. Site assessment to identify load curtailment/shifting strategies
3. Investment in equipment to manage load/achieve load reductions
4. Staff time required to manage load/achieve load reductions
5. Lost production/productivity
6. Impact to meet production quotas
7. Occupant comfort issues
8. Safety issues
9. Other (please specify) ________________________
10. Other (please specify) ________________________
11. Don’t know
Programming note: Rotate response options 1-8.
B-19 MPSC DEMAND RESPONSE MARKET ASSESSMENT PUBLICSECTORCONSULTANTS.COM
F2. [If B3=2,3] Thinking back to the example incentive levels, how would the incentives offered
cover the direct and indirect costs incurred to participating in a demand response program?
1. The incentives would more than cover the cost of participating in a demand response program.
2. The incentives would just the cost of participating in a demand response program.
3. The incentives may not cover the full cost of participating in a demand response program.
4. The incentive would not fully cover the cost of participation.
5. Don’t know.
[If C1= Curtailment Agreement] Assume an incentive of $25 per kW-yr and $0.10 per kWh for a
curtailment program.
[If C1= Demand Buyback] Assume an incentive of $0.30 per kWh for a demand buyback/energy
exchange program.
[If C1 = Critical Peak Pricing] Assume a peak to off-peak price ratio of six to one for a critical peak
pricing program.
[If C1 = Time-of-use Rates] Assume a peak to off-peak price ratio of four to one for a time-of-use
rate.
[If C1 = Real-time Pricing, no additional text provided]
F3. [If B3=2,3] On a scale of one to ten where one is an extreme barrier and ten is no barrier at
all to participating in program, rate the impact costs would have on your decision to participate
in demand response.
Extreme Barrier - 1
2 3 5 5 6 7 8 9 No Barrier at All - 10
Costs to Participate in a Demand Response Program
Section X. Closing
X1. Do you have any additional comments or feedback about demand response programs and
how they may affect your business operations in Michigan? If so, please provide your comments
below.
[RECORD OPEN ENDED RESPONSE]
________________________________________________
You have now completed the demand response survey. Please click "Next" to submit your answers. We deeply
appreciate the time and thoughtful opinions you've shared with us. Your input will help shape the policies and
programs that will ensure a reliable and affordable energy future for Michigan. To find out more about
implementation of Michigan’s energy policy, visit the Michigan Public Service Commission website at:
Michigan's Energy Law Updates
C-1 MPSC DEMAND RESPONSE MARKET ASSESSMENT PUBLICSECTORCONSULTANTS.COM
APPENDIX C: INTERVIEW GUIDE
INTRODUCTION
The Michigan Public Service Commission (MPSC) and the Michigan Agency for Energy thank you for
taking the time to participate in this in-depth interview. This discussion will help to guide the
implementation of energy policy in the state to ensure affordable and reliable energy services for
Michigan businesses and residents. The MPSC is reaching out to select customers to learn how they
approach demand response (DR) in their operations. Your answers today will help guide the development
of policies and programs that are both cost effective and acceptable to most program participants. Your
individual responses will be strictly confidential.
SECTION A. FIRMOGRAPHICS (5 MINUTES)
A1: How would you describe your business? (Probe: business type, number of locations in
Michigan, number of employees, typical site characteristics)
SECTION B: CURRENT PROGRAM PARTICIPATION (10 MINUTES)
B1. How familiar are you with demand response programs? (If needed: Demand response
programs are typically offered by electric utility providers. Through demand response programs,
participating customers reduce their electricity usage when requested in exchange for incentives.
Alternately, they may sign up for rates that vary [higher during peak periods and lower during off-peak
periods]. The programs help reduce emissions from electricity generation, reduce the purchase of
expensive energy, and delay the installation of costly utility equipment.)
B2. Are you participating or have you participated in any demand response programs?
(Probe: specific programs in and outside of Michigan. If necessary: prompt with different programs by
utility provider.)
B3. What is your commitment to the program in terms of kW reduction and/or percent of
your total facility load(s)?
B4: Tell me about your experiences participating in these programs. (Probe: what works and
what could be improved, what type of loads are they able to curtail, do they use energy management
systems or storage technologies, what were motivators to participate, were there any barriers, do they
participate in multiple programs and if so, where and what programs?)

C-2 MPSC DEMAND RESPONSE MARKET ASSESSMENT PUBLICSECTORCONSULTANTS.COM
SECTION C: PROGRAM DESIGN PREFERENCES (20 MINUTES)
The MPSC is interested in understanding which program features are most appealing, which present the
greatest barrier to participation, and how financial incentives might be structured to encourage
participation.
This is an opportunity for you to discuss what kind of program you would like to see. Typical program
types include:
Curtailment agreements
Demand buyback or energy exchange
Time-of-use rates
Critical peak pricing
Real-time pricing
C1: On a scale of one to ten, where one is not at all likely and ten is extremely likely, how
likely are you to participate in these potential DR programs/tariffs?
a. Curtailment Agreement—Firm capacity reduction commitment between the DR service provider and customer that is mandatory and penalizes nonparticipation; incentives include both capacity payments ($kW/month or $kW/year) and energy payments ($kW/h). Customers receive the capacity payment as a “reservation” payment, irrespective of whether they curtail load or not (e.g., $25/kW) and the energy payment ($0.10/kWh) based on actual reductions. 1–10. Why?
b. Demand Buyback/Energy Exchange—No firm capacity reduction commitment, voluntary energy reduction only based on market prices, no penalties for nonparticipation with incentives in the form of energy payments. A typical payment might be $0.50/kWh. 1–10. Why?
c. Time-of-use Rates—Time-differentiated rate offer with defined peak and off-peak periods; peak to off-peak price ratio typically does not exceed four to one; can be opt in or opt out, where enrolled customers have a lower off-peak rate than their standard rate and can realize bill savings from shifting their consumption from peak to off-peak periods. 1–10. Why?
d. Critical Peak Pricing (CPP)—A CPP rate includes a high peak to off-peak price ratio during certain critical-peak periods in the year during which the utility is likely to call DR events. Critical peak to off-peak price ratios typically range from six to one to ten to one and can be either opt in or opt out. Customers on the CPP rate reduce load during the critical-peak event periods to avoid paying the high critical-peak rate during those periods; they also have a lower off-peak rate than their standard rate offer and can realize bill savings by shifting their energy use to off-peak periods. 1–10. Why?
e. Real-time Pricing—Hourly market-price-based rate to customers, voluntary opt in only; customers respond to hourly fluctuations in energy prices and modify their usage accordingly. 1–10. Why?
C2: Are there other types of programs that are not on the list that should be considered?
(Probe: programs offered in other states they are operating in, programs that they have heard about)
C3. Could you describe your ideal program? (If necessary: take into consideration
voluntary/mandatory, firm capacity reduction commitment versus voluntary energy reduction only, opt
in/opt out, rate differences based on peak/off-peak price ratios, fixed incentives based on firm
commitment versus pay for performance incentive only, etc.)

C-3 MPSC DEMAND RESPONSE MARKET ASSESSMENT PUBLICSECTORCONSULTANTS.COM
C4. If the utility offered a program where the notification period (the time between the
utility calling a DR event and the time when you would be expected to make reductions in
load) was considerably shorter, say ten minutes or less, approximately how many kilowatts
or what percentage of your total facility load would you be able to curtail?
Load Curtailment (kw) Load Curtailment (percentage of total demand)
Fast Response Capability (10 min. or less notification)
C5. What direct or indirect costs does your company incur as a result of participating in DR
programs? (Probe: time to evaluate different participation options, site assessment to identify load
curtailment/shifting strategies, investment in equipment to manage load/achieve load reductions, staff
time required to manage load/achieve load reductions, lost production/productivity, impact on
production schedule/quotas, occupant comfort issues, safety issues)
C6. These were typical incentive levels that we discussed:
Program Type Incentive Level
Curtailment Agreement $25 per kW per year and $0.10 per kWh
Demand Buyback $0.50 per kWh
Critical Peak Pricing Peak to off-peak ratio 6:1
Time-of-use Rates Peak to off-peak ratio of 4:1
C7. Would these incentive levels be sufficient to participate in demand response programs?
(Probe: sufficient to cover the costs of participating in programs, more than sufficient, insufficient)
C8. What is the ideal incentive structure and level from your perspective?
SECTION D. CUSTOMER CAPABILITIES AND TECHNOLOGY (10 MINUTES)
The MPSC is interested in understanding whether your facilities have technologies that enable demand
response, such as an energy or building management system (EMS/BMS) or other control system, battery
storage, or onsite generation. Other customers participating in demand response programs have found
these technologies useful for meeting their pledged reductions. These systems could include:
An EMS/BMS or other control system can help to identify which equipment or systems can be turned off or adjusted to participate in a demand response program
Any other types of control, such as lighting or process

C-4 MPSC DEMAND RESPONSE MARKET ASSESSMENT PUBLICSECTORCONSULTANTS.COM
Energy storage in different forms (battery, thermal, process [could include shifts in batch processes so that customers can store some of the intermediary products from their processes for rescheduled production]) that allows participants to store energy when it is most convenient and rely on the storage to respond to demand response events
Nonemergency onsite generation to respond to demand response events
D1. Which energy management technologies, if any, do you have at your facilities? (Probe:
describe equipment, how much of the overall load does it control?)
D2. [If they are participating in programs.] How do you achieve the reductions during DR
events or peak pricing times? (Probe: manual controls, automated control operated internally,
automated control operated remotely, etc.)
D3. Are you currently considering installation of any additional load control/management
technologies that could help in demand response participation? (If needed: describe any of
the technologies you are considering and when you are looking at making the investment.)
D4. How much would this technology influence your participation in a demand response
program?
SECTION E. CUSTOMER MOTIVATORS AND BARRIERS TO PARTICIPATION (10 MINUTES)
E1. Are there any factors that would motivate you to participate in a demand response
program or tariff?
E2. Are there any factors that would prevent you from participating in a demand response
program or tariff?
SECTION X. CLOSING (5 MINUTES)
X1. Do you have any additional comments or feedback about demand response programs
and how they may affect your business operations in Michigan? If so, please provide your
comments below.

230 N. Washington Square
Suite 300
Lansing, MI 48933