Demand Response from Day-Ahead Hourly Pricing for Large Customers
12
Nicole Hopper is a Senior Research Associate in the Environmental Energy Technologies Division of Lawrence Berkeley National Laboratory, a Department of Energy national laboratory where she conducts research and provides technical assistance to policymakers on issues related to demand response and energy efficiency. She holds an M.S. degree from the Energy and Resources Group at the University of California at Berkeley. Charles Goldman is a Staff Scientist and Group leader in Lawrence Berkeley’s Environmental Energy Technologies Division. He has more than 20 years’ consulting and research experience in energy efficiency and demand response policy, programs, and technology analysis, utility integrated resource planning, and retail energy services. Like Ms. Hopper, he holds an M.S. degree from the Energy and Resources Group at the University of California at Berkeley. Bernie Neenan is Vice President of Neenan Associates, a Utilipoint Company, and has more than 20 years’ experience designing, implementing, and evaluating retail electricity services. He holds advanced degrees in Agricultural Economics from Cornell University and the University of Florida. The work described in this article was supported by the Office of Electricity Delivery and Energy Reliability of the U.S. Department of Energy under contract no. DE-AC02-05CH11231. Demand Response from Day-Ahead Hourly Pricing for Large Customers Day-ahead default-service RTP for large customers not only improves the linkage between wholesale and retail markets, but also promotes the development of retail competition. The default service sets a standard for competitive alternatives and its structure shapes the types of retail market products that develop. Nicole Hopper, Charles Goldman and Bernie Neenan I. Introduction In recent years, policymakers have shown increasing interest in dynamic pricing as a means to encourage demand response (DR). Proponents of real-time pricing (RTP) and critical peak pricing (CPP) rates rely heavily on conceptual portrayals of the DR benefits that would inure from their wide-scale adoption. 1 A few empirical studies of voluntary RTP tariffs implemented by ver- tically integrated utilities confirm that at least some of the largest customers can adjust their usage in response to high prices. 2 Recent CPP and RTP pilot programs involving residential customers suggest that some of these custo- mers too might adjust usage to price signals. 3 However, the overall experience with RTP in vertically integrated settings has been less than encouraging, with several notable exceptions. 4 Furthermore, these results do not necessarily translate to situations in which RTP is implemented as the default service in the context of retail competition. D uring the past five years, regulatory commissions in 52 1040-6190/$–see front matter # 2006 Elsevier Inc. All rights reserved., doi:/10.1016/j.tej.2006.02.002 The Electricity Journal
Transcript of Demand Response from Day-Ahead Hourly Pricing for Large Customers
s
5
Nicole Hopper is a Senior ResearchAssociate in the Environmental
Energy Technologies Division ofLawrence Berkeley National
Laboratory, a Department of Energynational laboratory where she
conducts research and providestechnical assistance to policymakers
on issues related to demand responseand energy efficiency. She holds an
M.S. degree from the Energy andResources Group at the University of
California at Berkeley.
Charles Goldman is a StaffScientist and Group leader in
Lawrence Berkeley’s EnvironmentalEnergy Technologies Division. He
has more than 20 years’ consultingand research experience in energy
efficiency and demand responsepolicy, programs, and technology
analysis, utility integrated resourceplanning, and retail energy services.Like Ms. Hopper, he holds an M.S.
degree from the Energy andResources Group at the University of
California at Berkeley.
Bernie Neenan is Vice President ofNeenan Associates, a Utilipoint
Company, and has more than 20years’ experience designing,
implementing, and evaluating retailelectricity services. He holds
advanced degrees in AgriculturalEconomics from Cornell University
and the University of Florida.
The work described in this article wassupported by the Office of Electricity
Delivery and Energy Reliability ofthe U.S. Department of Energy undercontract no. DE-AC02-05CH11231.
2 1040-6190/$–see front matter # 2006 Els
Demand Response fromDay-Ahead Hourly Pricingfor Large Customers
Day-ahead default-service RTP for large customers notonly improves the linkage between wholesale and retailmarkets, but also promotes the development of retailcompetition. The default service sets a standard forcompetitive alternatives and its structure shapes the typeof retail market products that develop.
Nicole Hopper, Charles Goldman and Bernie Neenan
I. Introduction
In recent years, policymakers
have shown increasing interest in
dynamic pricing as a means to
encourage demand response
(DR). Proponents of real-time
pricing (RTP) and critical peak
pricing (CPP) rates rely heavily on
conceptual portrayals of the DR
benefits that would inure from
their wide-scale adoption.1 A few
empirical studies of voluntary
RTP tariffs implemented by ver-
tically integrated utilities confirm
that at least some of the largest
customers can adjust their usage
evier Inc. All rights reserved., doi:/10.1016/j.
in response to high prices.2 Recent
CPP and RTP pilot programs
involving residential customers
suggest that some of these custo-
mers too might adjust usage to
price signals.3 However, the
overall experience with RTP in
vertically integrated settings has
been less than encouraging, with
several notable exceptions.4
Furthermore, these results do not
necessarily translate to situations
in which RTP is implemented as
the default service in the context
of retail competition.
D uring the past five years,
regulatory commissions in
tej.2006.02.002 The Electricity Journal
Critical questionsmust be resolvedbefore policymakerswill be comfortableimplementingdynamic pricingon a large scale.
A
several states (Maryland, New
Jersey, New York, and Pennsyl-
vania) have adopted default-
service pricing for large custo-
mers that is indexed to day-
ahead or real-time energy mar-
kets operated by independent
system operators (ISOs). These
initiatives were driven primarily
by retail market development
goals with DR being a secondary
objective in a few cases.5 While
there are indications default
service RTP has resulted in more
customers facing, and possibly
responding to, high prices, no
study has been undertaken to
fully characterize or measure this
response.6
D espite its promise, critical
questions must be resolved
before policymakers will be com-
fortable implementing dynamic
pricing on a large scale. To what
extent does default-service RTP
actually encourage price
response? Does RTP-type default
service also satisfy the goal of
switching customers to competi-
tive suppliers? To what extent do
retail market choices, such as
hedges, complicate RTP’s capacity
to elicit price response? What are
the relative roles of default-service
RTP and ISO-sponsored emer-
gency programs in eliciting DR?
Which factors and characteristics
account for differences in custo-
mers’ willingness and ability to
respond to hourly varying prices?
We contribute to the resolution
of these issues, for day-ahead RTP,
with a study of the largest custo-
mers at Niagara Mohawk
(NMPC), a National Grid Com-
pany, that have been exposed to
pril 2006, Vol. 19, Issue 3 1040-6190/$–see
default-service electricity pricing
indexed to the New York Inde-
pendent System Operator
(NYISO) day-ahead market since
retail competition was introduced
in 1998.7
The study, conducted in two
phases, included customer sur-
veys and interviews (in summer
2003 and fall 2004) to collect
information on customers’ facility
and business characteristics, their
perceived ability and willingness
to respond to prices or other sig-
nals to curtail, and their electricity
supply and hedging choices.8
These data were combined with
NMPC billing records to estimate
price response. The study focused
on the summers of 2000-04, to
characterize how customers
adapted to changing market cir-
cumstances, alternative supply
choices, and, after 2001, oppor-
tunities to participate in NYISO
demand response programs.
T he 149 subject customers,
served under the ‘‘SC-3A’’
service classification, range in
peak demand from 2 MW (the
threshold for inclusion) to over
20 MW and include manufac-
front matter # 2006 Elsevier Inc. All rights r
turers (32 percent), government/
education facilities (30 percent),
commercial and retail businesses
(11 percent), and health care (11
percent) and public works (16
percent) facilities.
II. Energy Pricing,Products and Services
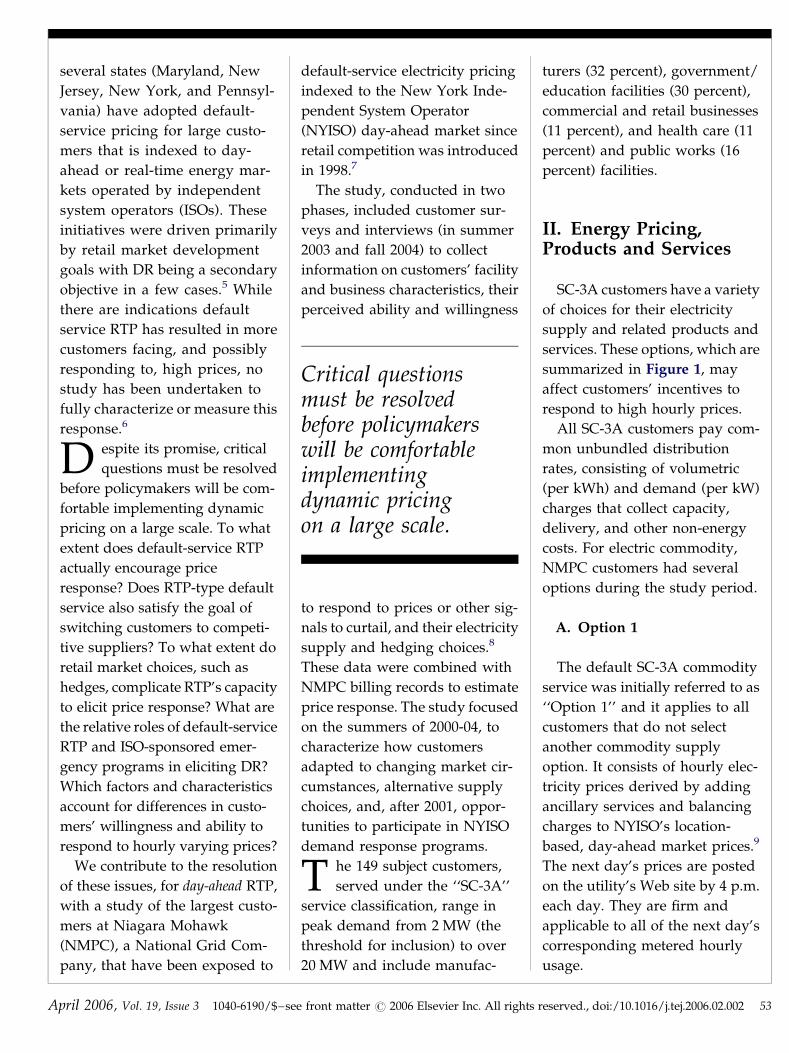
SC-3A customers have a variety
of choices for their electricity
supply and related products and
services. These options, which are
summarized in Figure 1, may
affect customers’ incentives to
respond to high hourly prices.
All SC-3A customers pay com-
mon unbundled distribution
rates, consisting of volumetric
(per kWh) and demand (per kW)
charges that collect capacity,
delivery, and other non-energy
costs. For electric commodity,
NMPC customers had several
options during the study period.
A. Option 1
The default SC-3A commodity
service was initially referred to as
‘‘Option 1’’ and it applies to all
customers that do not select
another commodity supply
option. It consists of hourly elec-
tricity prices derived by adding
ancillary services and balancing
charges to NYISO’s location-
based, day-ahead market prices.9
The next day’s prices are posted
on the utility’s Web site by 4 p.m.
each day. They are firm and
applicable to all of the next day’s
corresponding metered hourly
usage.
eserved., doi:/10.1016/j.tej.2006.02.002 53
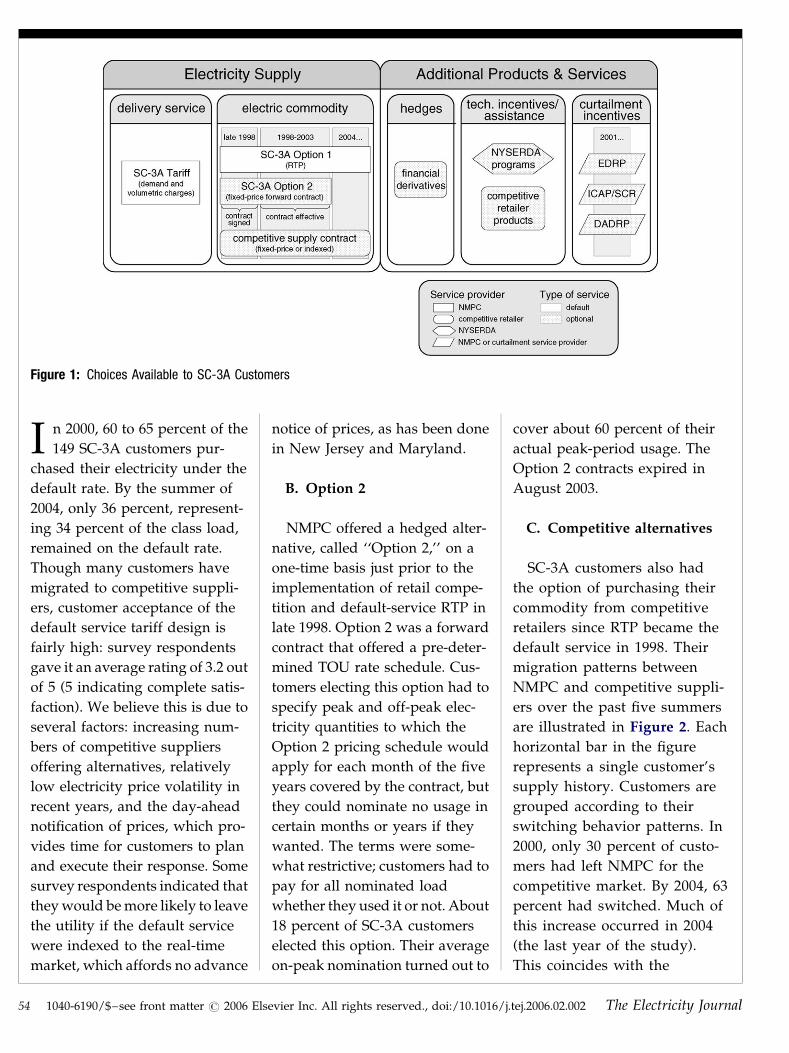
Figure 1: Choices Available to SC-3A Customers
54
I n 2000, 60 to 65 percent of the
149 SC-3A customers pur-
chased their electricity under the
default rate. By the summer of
2004, only 36 percent, represent-
ing 34 percent of the class load,
remained on the default rate.
Though many customers have
migrated to competitive suppli-
ers, customer acceptance of the
default service tariff design is
fairly high: survey respondents
gave it an average rating of 3.2 out
of 5 (5 indicating complete satis-
faction). We believe this is due to
several factors: increasing num-
bers of competitive suppliers
offering alternatives, relatively
low electricity price volatility in
recent years, and the day-ahead
notification of prices, which pro-
vides time for customers to plan
and execute their response. Some
survey respondents indicated that
they would be more likely to leave
the utility if the default service
were indexed to the real-time
market, which affords no advance
1040-6190/$–see front matter # 2006 Els
notice of prices, as has been done
in New Jersey and Maryland.
B. Option 2
NMPC offered a hedged alter-
native, called ‘‘Option 2,’’ on a
one-time basis just prior to the
implementation of retail compe-
tition and default-service RTP in
late 1998. Option 2 was a forward
contract that offered a pre-deter-
mined TOU rate schedule. Cus-
tomers electing this option had to
specify peak and off-peak elec-
tricity quantities to which the
Option 2 pricing schedule would
apply for each month of the five
years covered by the contract, but
they could nominate no usage in
certain months or years if they
wanted. The terms were some-
what restrictive; customers had to
pay for all nominated load
whether they used it or not. About
18 percent of SC-3A customers
elected this option. Their average
on-peak nomination turned out to
evier Inc. All rights reserved., doi:/10.1016/j.
cover about 60 percent of their
actual peak-period usage. The
Option 2 contracts expired in
August 2003.
C. Competitive alternatives
SC-3A customers also had
the option of purchasing their
commodity from competitive
retailers since RTP became the
default service in 1998. Their
migration patterns between
NMPC and competitive suppli-
ers over the past five summers
are illustrated in Figure 2. Each
horizontal bar in the figure
represents a single customer’s
supply history. Customers are
grouped according to their
switching behavior patterns. In
2000, only 30 percent of custo-
mers had left NMPC for the
competitive market. By 2004, 63
percent had switched. Much of
this increase occurred in 2004
(the last year of the study).
This coincides with the
tej.2006.02.002 The Electricity Journal
Figure 2: Migration Patterns of SC-3A Customers
A
expiration of the Option 2 con-
tracts and was also aided by the
growth and maturation of the
retail market in New York as
well as in neighboring states that
implemented retail choice and
default-service RTP.
Figure 2 provides insights into
large customers’ switching beha-
vior. First, about 28 percent of
pril 2006, Vol. 19, Issue 3 1040-6190/$–see
customers never left the utility at
all. Of those that did, three-quar-
ters did not return to NMPC once
they had left. Only 18 percent
moved back and forth between
NMPC and the competitive mar-
ket. Another group of customers
(17 percent) had already left the
utility by the summer of 2000 and
never returned.
front matter # 2006 Elsevier Inc. All rights r
C ustomers report that com-
petitive suppliers offered
two basic types of commodity
pricing during the study period:
fixed and indexed. Fixed-rate
tariffs reported by customers
include TOU and flat-rate pricing,
typically applying to all of the
customer’s usage. These products
reduce or eliminate the custo-
mer’s incentive to respond to
hourly prices. However, affected
customers may still respond to
other curtailment signals, such as
NYISO emergency program
events, if they are inclined to do
so.
The majority of survey
respondents that switched
reported taking indexed com-
modity products. Most were
indexed to NMPC’s Option 1
tariff, but some customers
reported products indexed
directly to the NYISO day-ahead
market or to some other reference
prices. These indexed products
typically provided a discount
relative to the default SC-3A rate
(derived from a shopping credit
built into the SC-3A service), but
were of the same day-ahead RTP
structure.
B ased on survey responses
and tariff history informa-
tion provided by Niagara
Mohawk, we estimate that 7 to 25
percent of SC-3A customers took
an indexed supply product in
2004. Together with customers
taking the default service (Option
1), we estimate that 45 to 60 per-
cent of SC-3A customers were
facing day-ahead, hourly prices in
2004. Clearly, default-service RTP
can result in large numbers of
eserved., doi:/10.1016/j.tej.2006.02.002 55
56
customers facing hourly prices,
even among those switching to
competitive suppliers.
D. Financial hedge products
SC-3A customers also had
opportunities to purchase finan-
cial hedges through the retail
market during the study period.
Separate from the supply of
electricity, these products provide
price risk protection, typically for
a pre-specified volume of electri-
city, with the customer still
exposed to hourly prices for
marginal usage.10 Fewer than 10
percent of SC-3A customers
appear to have purchased these
price protection products. In sur-
veys and interviews, most custo-
mers were either unclear what a
financial hedge is or reported
difficulties procuring them,
largely due to restrictions or
purchasing practices imposed
by their organization. Some
reported that different depart-
ments are responsible for pur-
chasing energy and financial
products, which complicates
the decision. Others reported
rules prohibiting them from
purchasing financial derivatives
altogether.
E. Enabling technologies
Figure 3: Self-Reported Load Response Strategies
One reason often offered for
low price response is that custo-
mers lack the information and
controls they need to effectively
carry out a price response strat-
egy. Many SC-3A customers had
available, or installed during the
study period, technologies with
1040-6190/$–see front matter # 2006 Els
the potential to enhance their
price response capability, in some
cases funded by New York State
Research and Development
Agency (NYSERDA) programs
explicitly designed to encourage
DR. The impact of these technol-
ogies on customers’ price
response is described in Section
III.
F. NYISO Emergency DR
programs
Some 42 percent of SC-3A cus-
tomers enrolled in one or both of
NYISO’s two emergency DR
programs – the Emergency
Demand Response Program
(EDRP) and the Installed Capa-
city/ Special Case Resource Pro-
gram (ICAP/SCR) – for at least
one summer between 2001 and
2004.11 EDRP is a voluntary pro-
gram that pays the higher of a
$500/MWh floor price or the
locational real-time energy mar-
ket price when NYISO calls
emergency events. ICAP/SCR
participants receive capacity
payments and, since 2003, energy
payments for load curtailed when
NYISO declares emergency
evier Inc. All rights reserved., doi:/10.1016/j.
events. The ICAP/SCR program
levies penalties for participating
customers who fail to curtail
when called upon to do so. We
discuss the contribution of the
NYISO emergency programs to
SC-3A customers’ price response
in Section V.
III. How CustomersRespond
Customers’ survey and inter-
view responses provide impor-
tant insights into how large
customers currently adapt and
respond to day-ahead market
prices. We highlight the following
results.
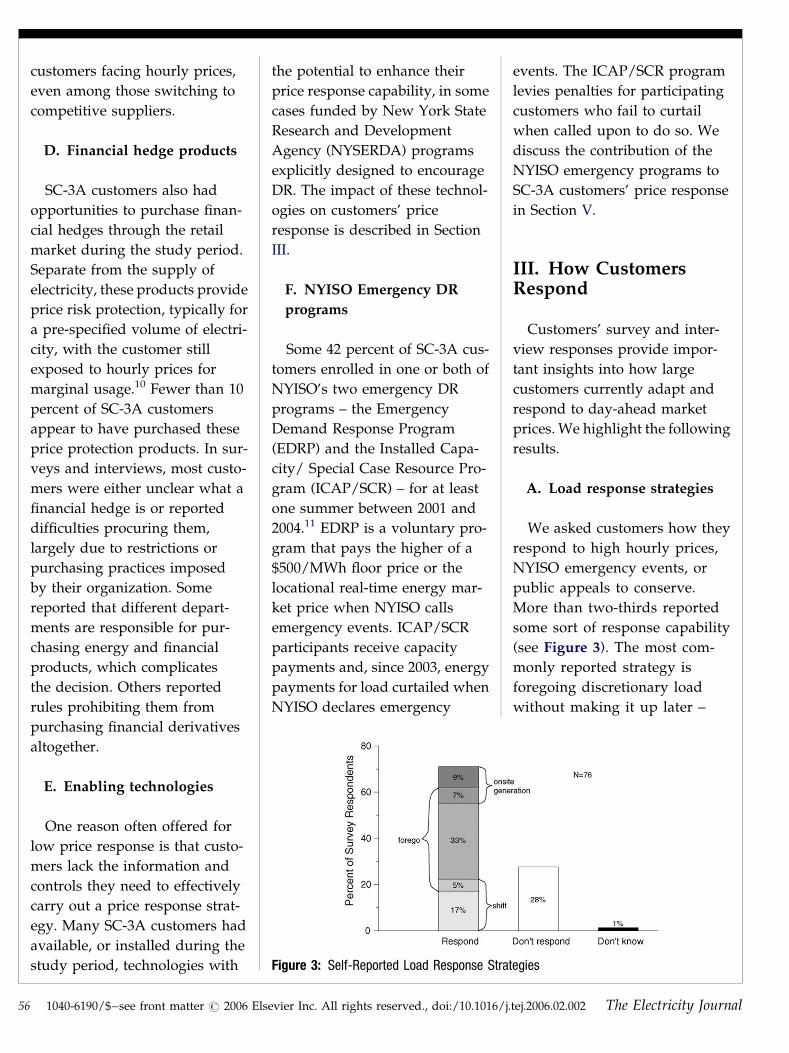
A. Load response strategies
We asked customers how they
respond to high hourly prices,
NYISO emergency events, or
public appeals to conserve.
More than two-thirds reported
some sort of response capability
(see Figure 3). The most com-
monly reported strategy is
foregoing discretionary load
without making it up later –
tej.2006.02.002 The Electricity Journal
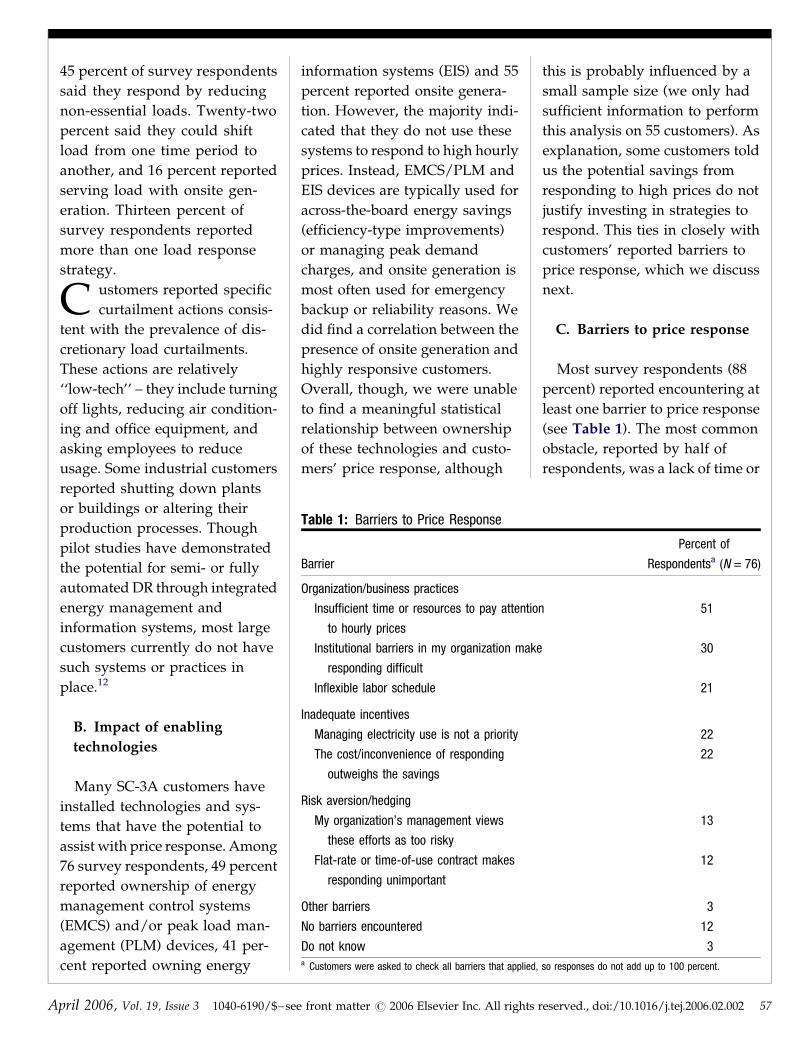
Table 1: Barriers to Price Response
Barrier
Percent of
Respondentsa (N = 76)
Organization/business practices
Insufficient time or resources to pay attention
to hourly prices
51
Institutional barriers in my organization make
responding difficult
30
Inflexible labor schedule 21
A
45 percent of survey respondents
said they respond by reducing
non-essential loads. Twenty-two
percent said they could shift
load from one time period to
another, and 16 percent reported
serving load with onsite gen-
eration. Thirteen percent of
survey respondents reported
more than one load response
strategy.
C ustomers reported specific
curtailment actions consis-
tent with the prevalence of dis-
cretionary load curtailments.
These actions are relatively
‘‘low-tech’’ – they include turning
off lights, reducing air condition-
ing and office equipment, and
asking employees to reduce
usage. Some industrial customers
reported shutting down plants
or buildings or altering their
production processes. Though
pilot studies have demonstrated
the potential for semi- or fully
automated DR through integrated
energy management and
information systems, most large
customers currently do not have
such systems or practices in
place.12
Inadequate incentives
Managing electricity use is not a priority 22
The cost/inconvenience of responding 22
B. Impact of enabling
technologies
outweighs the savings
Risk aversion/hedging
My organization’s management views
these efforts as too risky
13
Flat-rate or time-of-use contract makes
responding unimportant
12
Other barriers 3
No barriers encountered 12
Do not know 3a Customers were asked to check all barriers that applied, so responses do not add up to 100 percent.
Many SC-3A customers have
installed technologies and sys-
tems that have the potential to
assist with price response. Among
76 survey respondents, 49 percent
reported ownership of energy
management control systems
(EMCS) and/or peak load man-
agement (PLM) devices, 41 per-
cent reported owning energy
pril 2006, Vol. 19, Issue 3 1040-6190/$–see
information systems (EIS) and 55
percent reported onsite genera-
tion. However, the majority indi-
cated that they do not use these
systems to respond to high hourly
prices. Instead, EMCS/PLM and
EIS devices are typically used for
across-the-board energy savings
(efficiency-type improvements)
or managing peak demand
charges, and onsite generation is
most often used for emergency
backup or reliability reasons. We
did find a correlation between the
presence of onsite generation and
highly responsive customers.
Overall, though, we were unable
to find a meaningful statistical
relationship between ownership
of these technologies and custo-
mers’ price response, although
front matter # 2006 Elsevier Inc. All rights r
this is probably influenced by a
small sample size (we only had
sufficient information to perform
this analysis on 55 customers). As
explanation, some customers told
us the potential savings from
responding to high prices do not
justify investing in strategies to
respond. This ties in closely with
customers’ reported barriers to
price response, which we discuss
next.
C. Barriers to price response
Most survey respondents (88
percent) reported encountering at
least one barrier to price response
(see Table 1). The most common
obstacle, reported by half of
respondents, was a lack of time or
eserved., doi:/10.1016/j.tej.2006.02.002 57
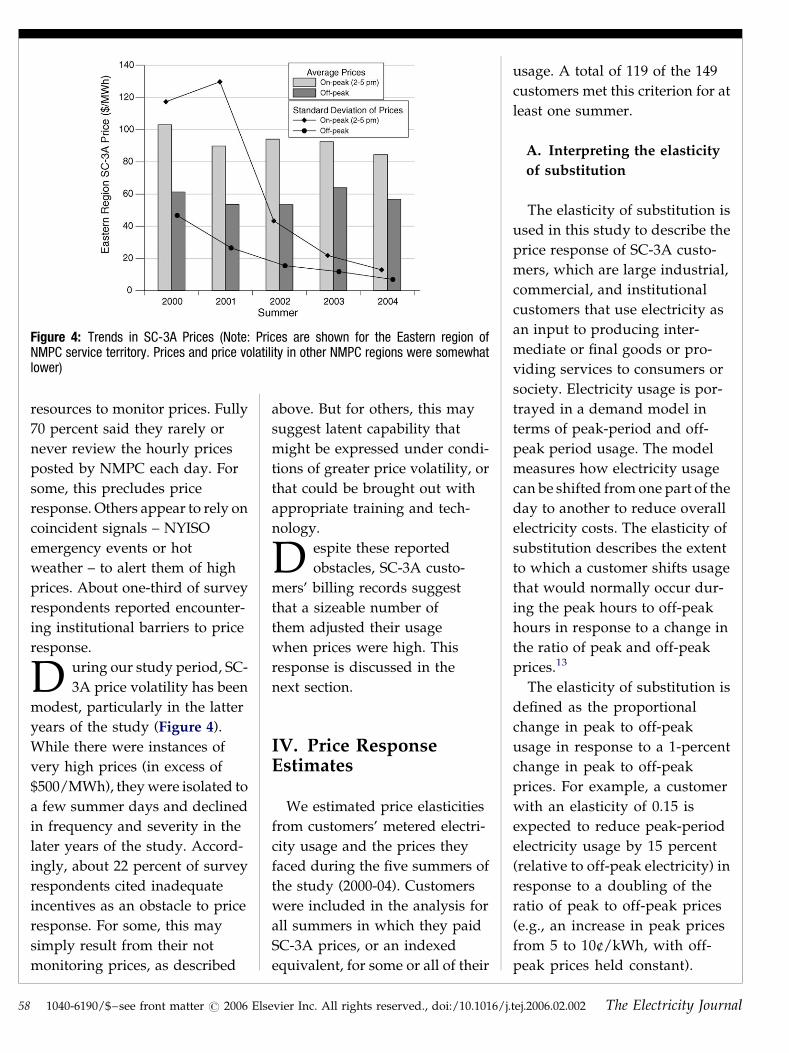
Figure 4: Trends in SC-3A Prices (Note: Prices are shown for the Eastern region ofNMPC service territory. Prices and price volatility in other NMPC regions were somewhatlower)
58
resources to monitor prices. Fully
70 percent said they rarely or
never review the hourly prices
posted by NMPC each day. For
some, this precludes price
response. Others appear to rely on
coincident signals – NYISO
emergency events or hot
weather – to alert them of high
prices. About one-third of survey
respondents reported encounter-
ing institutional barriers to price
response.
D uring our study period, SC-
3A price volatility has been
modest, particularly in the latter
years of the study (Figure 4).
While there were instances of
very high prices (in excess of
$500/MWh), they were isolated to
a few summer days and declined
in frequency and severity in the
later years of the study. Accord-
ingly, about 22 percent of survey
respondents cited inadequate
incentives as an obstacle to price
response. For some, this may
simply result from their not
monitoring prices, as described
1040-6190/$–see front matter # 2006 Els
above. But for others, this may
suggest latent capability that
might be expressed under condi-
tions of greater price volatility, or
that could be brought out with
appropriate training and tech-
nology.
D espite these reported
obstacles, SC-3A custo-
mers’ billing records suggest
that a sizeable number of
them adjusted their usage
when prices were high. This
response is discussed in the
next section.
IV. Price ResponseEstimates
We estimated price elasticities
from customers’ metered electri-
city usage and the prices they
faced during the five summers of
the study (2000-04). Customers
were included in the analysis for
all summers in which they paid
SC-3A prices, or an indexed
equivalent, for some or all of their
evier Inc. All rights reserved., doi:/10.1016/j.
usage. A total of 119 of the 149
customers met this criterion for at
least one summer.
A. Interpreting the elasticity
of substitution
The elasticity of substitution is
used in this study to describe the
price response of SC-3A custo-
mers, which are large industrial,
commercial, and institutional
customers that use electricity as
an input to producing inter-
mediate or final goods or pro-
viding services to consumers or
society. Electricity usage is por-
trayed in a demand model in
terms of peak-period and off-
peak period usage. The model
measures how electricity usage
can be shifted from one part of the
day to another to reduce overall
electricity costs. The elasticity of
substitution describes the extent
to which a customer shifts usage
that would normally occur dur-
ing the peak hours to off-peak
hours in response to a change in
the ratio of peak and off-peak
prices.13
The elasticity of substitution is
defined as the proportional
change in peak to off-peak
usage in response to a 1-percent
change in peak to off-peak
prices. For example, a customer
with an elasticity of 0.15 is
expected to reduce peak-period
electricity usage by 15 percent
(relative to off-peak electricity) in
response to a doubling of the
ratio of peak to off-peak prices
(e.g., an increase in peak prices
from 5 to 10¢/kWh, with off-
peak prices held constant).
tej.2006.02.002 The Electricity Journal
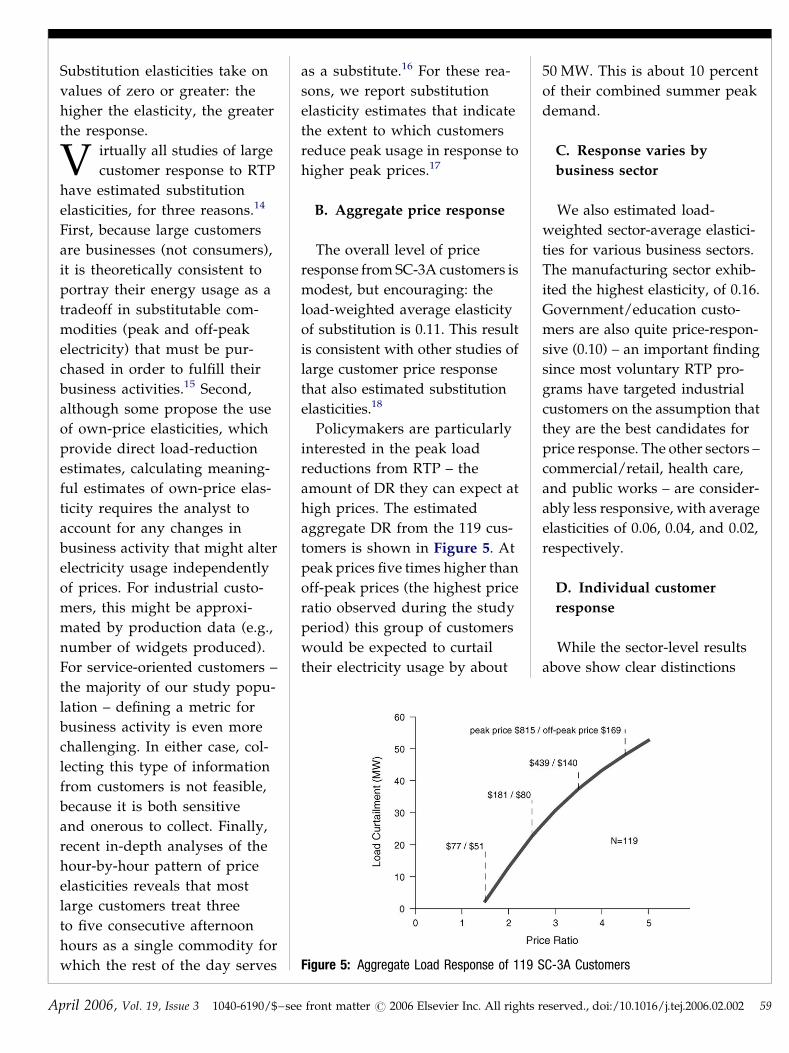
Figure 5: Aggregate Load Response of 119 SC-3A Customers
A
Substitution elasticities take on
values of zero or greater: the
higher the elasticity, the greater
the response.
V irtually all studies of large
customer response to RTP
have estimated substitution
elasticities, for three reasons.14
First, because large customers
are businesses (not consumers),
it is theoretically consistent to
portray their energy usage as a
tradeoff in substitutable com-
modities (peak and off-peak
electricity) that must be pur-
chased in order to fulfill their
business activities.15 Second,
although some propose the use
of own-price elasticities, which
provide direct load-reduction
estimates, calculating meaning-
ful estimates of own-price elas-
ticity requires the analyst to
account for any changes in
business activity that might alter
electricity usage independently
of prices. For industrial custo-
mers, this might be approxi-
mated by production data (e.g.,
number of widgets produced).
For service-oriented customers –
the majority of our study popu-
lation – defining a metric for
business activity is even more
challenging. In either case, col-
lecting this type of information
from customers is not feasible,
because it is both sensitive
and onerous to collect. Finally,
recent in-depth analyses of the
hour-by-hour pattern of price
elasticities reveals that most
large customers treat three
to five consecutive afternoon
hours as a single commodity for
which the rest of the day serves
pril 2006, Vol. 19, Issue 3 1040-6190/$–see
as a substitute.16 For these rea-
sons, we report substitution
elasticity estimates that indicate
the extent to which customers
reduce peak usage in response to
higher peak prices.17
B. Aggregate price response
The overall level of price
response from SC-3A customers is
modest, but encouraging: the
load-weighted average elasticity
of substitution is 0.11. This result
is consistent with other studies of
large customer price response
that also estimated substitution
elasticities.18
Policymakers are particularly
interested in the peak load
reductions from RTP – the
amount of DR they can expect at
high prices. The estimated
aggregate DR from the 119 cus-
tomers is shown in Figure 5. At
peak prices five times higher than
off-peak prices (the highest price
ratio observed during the study
period) this group of customers
would be expected to curtail
their electricity usage by about
front matter # 2006 Elsevier Inc. All rights r
50 MW. This is about 10 percent
of their combined summer peak
demand.
C. Response varies by
business sector
We also estimated load-
weighted sector-average elastici-
ties for various business sectors.
The manufacturing sector exhib-
ited the highest elasticity, of 0.16.
Government/education custo-
mers are also quite price-respon-
sive (0.10) – an important finding
since most voluntary RTP pro-
grams have targeted industrial
customers on the assumption that
they are the best candidates for
price response. The other sectors –
commercial/retail, health care,
and public works – are consider-
ably less responsive, with average
elasticities of 0.06, 0.04, and 0.02,
respectively.
D. Individual customer
response
While the sector-level results
above show clear distinctions
eserved., doi:/10.1016/j.tej.2006.02.002 59
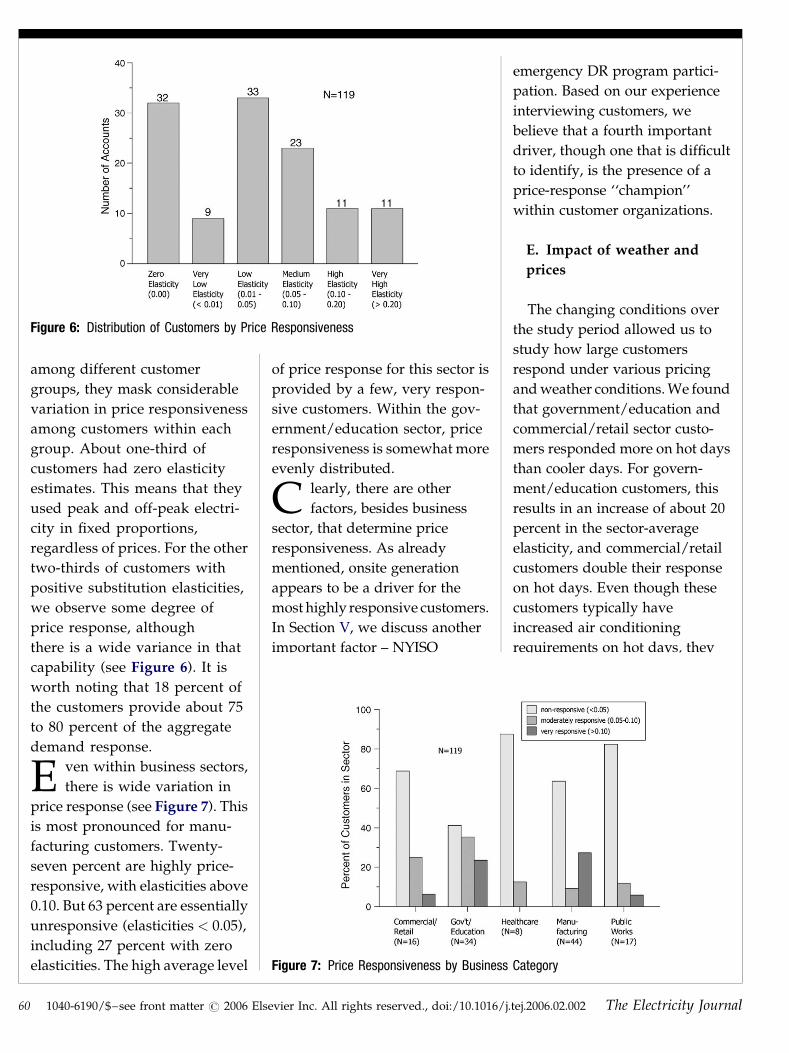
Figure 6: Distribution of Customers by Price Responsiveness
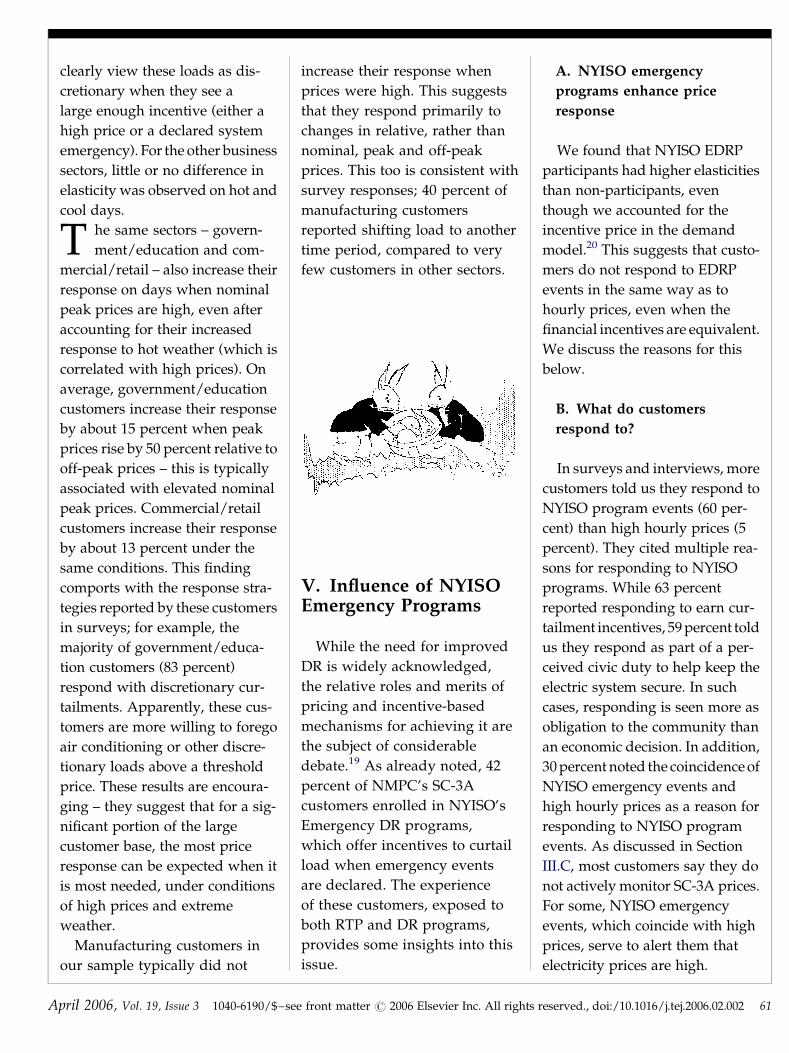
Figure 7: Price Responsiveness by Business Category
60
among different customer
groups, they mask considerable
variation in price responsiveness
among customers within each
group. About one-third of
customers had zero elasticity
estimates. This means that they
used peak and off-peak electri-
city in fixed proportions,
regardless of prices. For the other
two-thirds of customers with
positive substitution elasticities,
we observe some degree of
price response, although
there is a wide variance in that
capability (see Figure 6). It is
worth noting that 18 percent of
the customers provide about 75
to 80 percent of the aggregate
demand response.
E ven within business sectors,
there is wide variation in
price response (see Figure 7). This
is most pronounced for manu-
facturing customers. Twenty-
seven percent are highly price-
responsive, with elasticities above
0.10. But 63 percent are essentially
unresponsive (elasticities < 0.05),
including 27 percent with zero
elasticities. The high average level
1040-6190/$–see front matter # 2006 Els
of price response for this sector is
provided by a few, very respon-
sive customers. Within the gov-
ernment/education sector, price
responsiveness is somewhat more
evenly distributed.
C learly, there are other
factors, besides business
sector, that determine price
responsiveness. As already
mentioned, onsite generation
appears to be a driver for the
most highly responsive customers.
In Section V, we discuss another
important factor – NYISO
evier Inc. All rights reserved., doi:/10.1016/j.
emergency DR program partici-
pation. Based on our experience
interviewing customers, we
believe that a fourth important
driver, though one that is difficult
to identify, is the presence of a
price-response ‘‘champion’’
within customer organizations.
E. Impact of weather and
prices
The changing conditions over
the study period allowed us to
study how large customers
respond under various pricing
and weather conditions. We found
that government/education and
commercial/retail sector custo-
mers responded more on hot days
than cooler days. For govern-
ment/education customers, this
results in an increase of about 20
percent in the sector-average
elasticity, and commercial/retail
customers double their response
on hot days. Even though these
customers typically have
increased air conditioning
requirements on hot days, they
tej.2006.02.002 The Electricity Journal
A
clearly view these loads as dis-
cretionary when they see a
large enough incentive (either a
high price or a declared system
emergency). For the other business
sectors, little or no difference in
elasticity was observed on hot and
cool days.
T he same sectors – govern-
ment/education and com-
mercial/retail – also increase their
response on days when nominal
peak prices are high, even after
accounting for their increased
response to hot weather (which is
correlated with high prices). On
average, government/education
customers increase their response
by about 15 percent when peak
prices rise by 50 percent relative to
off-peak prices – this is typically
associated with elevated nominal
peak prices. Commercial/retail
customers increase their response
by about 13 percent under the
same conditions. This finding
comports with the response stra-
tegies reported by these customers
in surveys; for example, the
majority of government/educa-
tion customers (83 percent)
respond with discretionary cur-
tailments. Apparently, these cus-
tomers are more willing to forego
air conditioning or other discre-
tionary loads above a threshold
price. These results are encoura-
ging – they suggest that for a sig-
nificant portion of the large
customer base, the most price
response can be expected when it
is most needed, under conditions
of high prices and extreme
weather.
Manufacturing customers in
our sample typically did not
pril 2006, Vol. 19, Issue 3 1040-6190/$–see
increase their response when
prices were high. This suggests
that they respond primarily to
changes in relative, rather than
nominal, peak and off-peak
prices. This too is consistent with
survey responses; 40 percent of
manufacturing customers
reported shifting load to another
time period, compared to very
few customers in other sectors.
V. Influence of NYISOEmergency Programs
While the need for improved
DR is widely acknowledged,
the relative roles and merits of
pricing and incentive-based
mechanisms for achieving it are
the subject of considerable
debate.19 As already noted, 42
percent of NMPC’s SC-3A
customers enrolled in NYISO’s
Emergency DR programs,
which offer incentives to curtail
load when emergency events
are declared. The experience
of these customers, exposed to
both RTP and DR programs,
provides some insights into this
issue.
front matter # 2006 Elsevier Inc. All rights r
A. NYISO emergency
programs enhance price
response
We found that NYISO EDRP
participants had higher elasticities
than non-participants, even
though we accounted for the
incentive price in the demand
model.20 This suggests that custo-
mers do not respond to EDRP
events in the same way as to
hourly prices, even when the
financial incentives are equivalent.
We discuss the reasons for this
below.
B. What do customers
respond to?
In surveys and interviews, more
customers told us they respond to
NYISO program events (60 per-
cent) than high hourly prices (5
percent). They cited multiple rea-
sons for responding to NYISO
programs. While 63 percent
reported responding to earn cur-
tailment incentives, 59 percent told
us they respond as part of a per-
ceived civic duty to help keep the
electric system secure. In such
cases, responding is seen more as
obligation to the community than
an economic decision. In addition,
30 percent noted the coincidence of
NYISO emergency events and
high hourly prices as a reason for
responding to NYISO program
events. As discussed in Section
III.C, most customers say they do
not actively monitor SC-3A prices.
For some, NYISO emergency
events, which coincide with high
prices, serve to alert them that
electricity prices are high.
eserved., doi:/10.1016/j.tej.2006.02.002 61
62
C. Some observations
Drawing from these results, we
make the following observations.
First, day-ahead RTP and emer-
gency DR programs fulfill sepa-
rate needs through distinct
designs and attributes. Day-ahead
RTP involves routinely sending
price signals to customers on a
day-ahead basis and promotes
economic price response, in which
customers are motivated by sav-
ings from curtailing usage when
prices are high. This response
provides system-wide benefits in
the form of lower wholesale
market clearing prices. In con-
trast, NYISO emergency pro-
grams send signals on a
contingency basis (two-hour
timeframe) to promote emergency
response, thereby providing sys-
tem reliability benefits.
T here are also considerable
synergies in implementing
day-ahead RTP in conjunction
with emergency programs. In
interviews, we encountered cus-
tomers who had developed
response strategies specifically to
respond to NYISO programs
which they subsequently adapted
to respond to high SC-3A prices.
The converse was also true for
other customers. Thus, RTP can
provide a training ground for
customers to respond in emer-
gency DR programs, and vice versa.
We conclude that day-ahead
RTP and emergency DR programs
complement each other. Rather
than viewing the decision to
implement these two DR-enhan-
cing mechanisms as an ‘‘either-or’’
proposition, policymakers should
1040-6190/$–see front matter # 2006 Els
recognize their synergies. Not
only do they provide different
types of signals to satisfy different
system needs, but the overall DR
potential from exposing customers
to both is potentially greater.
VI. Conclusions
The Niagara Mohawk SC-3A
pricing program provides a
unique source of information
about how customers adapt to
default service pricing (1) based
on day-ahead market hourly
prices, (2) in the context of retail
competition, and (3) in conjunc-
tion with opportunities to parti-
cipate in emergency DR
programs. It was implemented on
a permanent basis, not as a pilot,
over several years, so this study
reflects a relatively mature cus-
tomer understanding of price and
market trends.
T he results provide evidence
that default-service day-
ahead RTP does promote every-
day economic price response
among large customers, even
among many who have switched
suppliers but still elect to face
evier Inc. All rights reserved., doi:/10.1016/j.
day-ahead market prices.
Analysis of SC-3A customers’
billing data and hourly prices
suggest that they would reduce
their coincident peak demand by
about 10 percent in response to
prices of $500/MWh and
higher. We also found that about
15 to 20 percent of the customers
account for 80 percent of the
observed demand reductions.
Policymakers need to recognize
that most large customers
are currently not very price
responsive, in part because they
do not adopt fully automated DR
strategies, even though many
have installed the technologies
necessary to do so. This suggests
that there is a role for targeted
technical assistance programs to
help customers develop more
sophisticated price response
strategies.
Day-ahead default-service RTP
for large customers serves not
only as an effective means to
improve the linkage between
wholesale and retail markets, but
it also promotes the development
of retail competition. The default
service sets a standard for com-
petitive alternatives and its
structure shapes the types of
retail market products that
develop, so implementing RTP
can have a wide-reaching influ-
ence on the amount of load
in the market that is exposed to
and can respond to hourly
prices. Moreover, this default
tariff service is compatible with
emergency DR programs imple-
mented to protect system relia-
bility. While initial price response
is relatively modest, by providing
tej.2006.02.002 The Electricity Journal
A
technical assistance where it is
most needed, policymakers
can build a diverse and substan-
tial DR resource from large
customers.&
Endnotes:
1. See Severin Borenstein, Long-RunEfficiency of Real-Time Pricing, ENERGY
J., 26 (3), 2005, at 96, and L. Ruff,Demand Response: Reality versus‘‘Resource,’’ ELEC. J., Dec. 2002, at 10–23.
2. Jay Zarnikau, CustomerResponsiveness to Real-Time Pricing ofElectricity, ENERGY J., 11(4), 1990, at 99–116; J. A. Herriges, S. M. Baladi, D. W.Caves and B. F. Neenan, The Responseof Industrial Customers to Electric RatesBased Upon Dynamic Marginal Costs,REV. OF ECON. & STAT., 75(20), 1993, at446–454; Steven Braithwait andMichael O’Sheasy, RTP CustomerDemand Response: Empirical Evidenceon How Much You Can Expect, Ch. 12 inELECTRICITY PRICING IN TRANSITION, A.Faruqui and K. Eakin, eds. (KluwerAcademic Publishers, 2001); P. M.Schwarz, T. N. Taylor, M.Birmingham and S. L. Dardan,Industrial Response to Electricity Real-Time Prices: Short Run and Long Run,ECON. INQUIRY, 40(4), 2002, at 597–610,and Richard Boisvert, Peter Cappers,Bernie Neenan and Bryan Scott,Industrial and Commercial CustomerResponse to Real Time Electricity Prices,Dec. 2003, available online athttp://eetd.lbl.gov/ea/EMS/drlm-pubs.html.
pril 2006, Vol. 19, Issue 3 1040-6190/$–see
customers at Commonwealth Edisonpaying day-ahead hourly pricesreduced load by 5 to 10 percent whenprices rose above typical levels.
4. G. Barbose, C. Goldmanand B. Neenan, Real Time PricingTariffs: A Survey of Utility ProgramExperience, Lawrence BerkeleyNational Laboratory, LBNL-54238,Mar. 2004.
5. G. Barbose, C. Goldman, R.Bharvirkar, N. Hopper, M. Ting and B.Neenan, Real Time Pricing as a Defaultor Optional Service for C&I Customers: AComparative Analysis of Eight CaseStudies, report to California EnergyCommission, Lawrence BerkeleyNational Laboratory, LBNL-57661,Aug. 2005.
6. Id.
7. We do not address the question ofwhether RTP indexed to real-timemarkets, with no advance notice ofprices, elicits DR. This issue iscurrently unresolved (see Barboseet al., supra note 5).
8. See C. Goldman, N. Hopper, O.Sezgen, M. Moezzi, R. Bharvirkar, B.Neenan, R. Boisvert, P. Cappers andD. Pratt, Customer Response to Day-Ahead Wholesale Market ElectricityPrices: Case Study of RTP ProgramExperience in New York, report toCalifornia Energy Commission,Lawrence Berkeley NationalLaboratory, LBNL-54761, June 2004,and C. Goldman, N. Hopper, R.Bharvirkar, B. Neenan, R. Boisvert, P.Cappers, D. Pratt and K. Butkins,Customer Strategies for Responding toDay-Ahead Market Hourly ElectricityPricing, report to California EnergyCommission, Lawrence BerkeleyNational Laboratory, LBNL-57128,Aug. 2005.
9. All ancillary services are procuredby NYISO, which collects the coststhrough uplift charges that areassessed to load-serving entities basedon energy usage.
10. The specific types of financialhedge products purchased by SC-3Acustomers are described in Goldmanet al., 2005, supra note 8.
11. NYISO also offers an economic DRprogram – the Day-Ahead Demand
front matter # 2006 Elsevier Inc. All rights r
Response Program (DADRP) – inwhich only 3 percent of SC-3Acustomers enrolled.
12. M. A. Piette, O. Sezgen, D. Watson,N. Motegi, C. Shockman and L. tenHope, Development and Evaluation ofFully Automated Demand Response inLarge Facilities, California EnergyCommission: CEC-500-2005-013, Jan.2005.
13. We defined the peak periodempirically. Based on a preliminaryanalysis of customers’ usage data, theperiod from 2 p.m. to 5 p.m. affordedthe most distinct patterns in customerusage in response to prices.
14. See note 2.
15. See Goldman et al., 2005, supranote 8.
16. R. Patrick and F. Wolak, EstimatingCustomer-Level Demand for Electricityunder Real-Time Market Conditions,NBER Working Paper 8213, Apr. 2001,available at http://www.nber.org/papers/w8213 and T. Taylor, P.Schwarz, and J. Cochell, 24/7 HourlyResponse to Electricity Real-Time Pricingwith up to Eight Summers of Experience,J. REG. ECON., 27 (3), at 235–62.
17. The substitution elasticity definesrelative changes in peak and off-peakusage resulting from a relative pricechange. However, as demonstrated inGoldman et al., 2005, supra note 8, thesubstitution elasticity is consistentwith reducing discretionary peakusage and operating on-sitegeneration, neither of which results inincreased off-peak usage. However,the resulting elasticity inherentlyunderestimates the extent of peakreduction by about 5 to 10 percent.
18. See note 14.
19. See Ruff, supra note 1, Borenstein,supra note 1, and Richard Boisvert andBernard Neenan, Social WelfareImplications of Demand ResponsePrograms in Competitive ElectricityMarkets, report to Lawrence BerkeleyNational Laboratory, LBNL-52530,Aug. 2003.
20. See Goldman et al., 2005, supranote 8 for a discussion of how NYISOprogram incentives were incorporatedinto the demand model.
3. Ahmad Faruqui and StephenGeorge, Quantifying Customer Responseto Dynamic Pricing, ELEC. J., May 2005,at 53–63, summarizing the results of aCalifornia pilot that involved TOUand CPP pricing, report thatparticipants adjusted loads by 6 to 35percent when faced with higher-than-normal prices, with the highestresponses exhibited by those on CPP.Summit Blue, Evaluation of the Energy-Smart Pricing Plan: Project Summaryand Research Issues, report toCommunity Energy Cooperative, Feb.2004, reports that residential
eserved., doi:/10.1016/j.tej.2006.02.002 63