
EVERYBODY NEEDS A CLEAN ENVIRONMENT BY ARYAN RANGAN & HAYDEN MERVOLD
Upload
truongkhanhCategory
view
213download
0
Demand Response Framework for
India
Workshop on DSM & DR IIT Bombay - 4th March 2016
Rangan Banerjee

What is Demand Response?
• Changes in electric usage by end-use customers from their normal consumption patterns in response to changes in the price of electricity
• DR includes all intentional electricity consumption pattern modifications by end-use customers that are intended to alter the timing, level of instantaneous demand, or total electricity consumption
7
Albadi and EL-Saadany (2008)

DR Programme Classification
• Incentive Based Programmes
– Direct Load Control
– Interruptible Load Control
– Market Based – Demand Bidding, Emergency DR, Capacity Market, Ancillary Services Market
• Price Based Programmes
– Time of Use Pricing
– Critical Peak Pricing
– Real Time Pricing
Albadi and EL-Saadany (2008)

Role of DR in Power Planning
4USDOE, 2006

Schematic of DR framework
5

#1 Understand variations in demand
6
0
50
100
150
200
250
300
0:00 6:00 12:00 18:00 0:00 6:00 12:00 18:00
Lo
ad
(in
kW
)
Day 1 Day 2
Features ParametersEvening
setback
Evening
shoulderMorning
ramp-up
Morning
Start-up
High load
duration
Near-Peak LoadNear-Base Load
Rise time
Fall time
LBNL, 2011

Delhi Load Curve
7

Seasonal Variations - Delhi
Source: NRLDC 2006
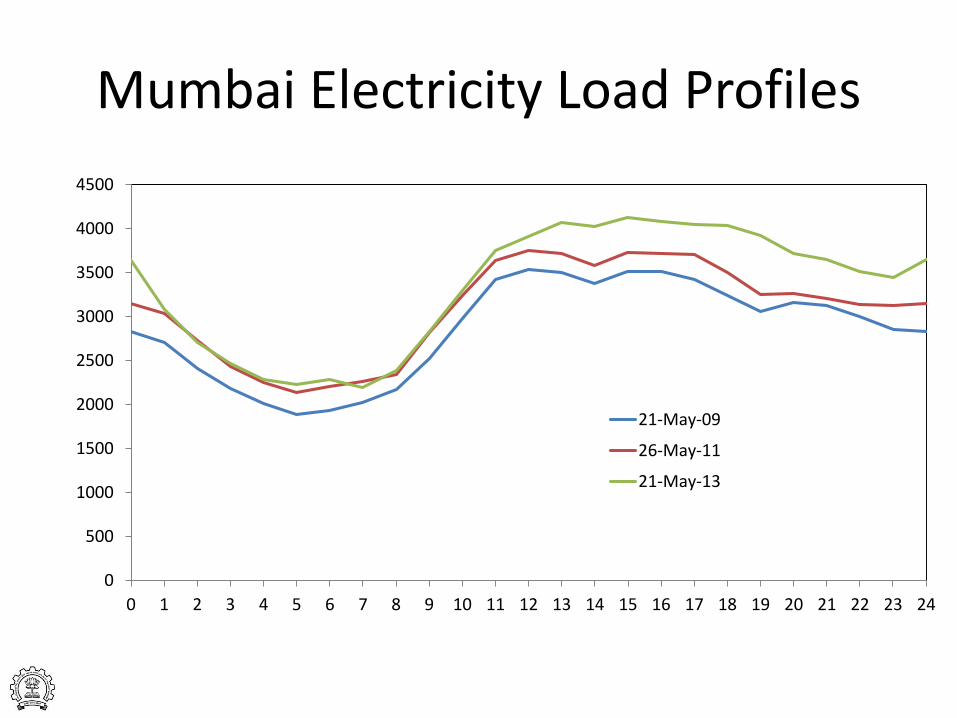
Mumbai Electricity Load Profiles
0
500
1000
1500
2000
2500
3000
3500
4000
4500
0 1 2 3 4 5 6 7 8 9 10 11 12 13 14 15 16 17 18 19 20 21 22 23 24
21-May-09
26-May-11
21-May-13

IITB Hospital
-2000
0
2000
4000
6000
8000
10000
12000
12:0
0:0
0 A
M
12:2
6:0
0 A
M
12:5
2:0
0 A
M
1:1
8:0
0 A
M
1:4
4:0
0 A
M
2:1
0:0
0 A
M
2:3
6:0
0 A
M
3:0
2:0
0 A
M
3:2
8:0
0 A
M
3:5
4:0
0 A
M
4:2
0:0
0 A
M
4:4
6:0
0 A
M
5:1
2:0
0 A
M
5:3
8:0
0 A
M
6:0
4:0
0 A
M
6:3
0:0
0 A
M
6:5
6:0
0 A
M
7:2
2:0
0 A
M
7:4
8:0
0 A
M
8:1
4:0
0 A
M
8:4
0:0
0 A
M
9:0
6:0
0 A
M
9:3
2:0
0 A
M
9:5
8:0
0 A
M
10:2
4:0
0 A
M
10:5
0:0
0 A
M
11:1
6:0
0 A
M
11:4
2:0
0 A
M
12:0
8:0
0 P
M
12:3
4:0
0 P
M
1:0
0:0
0 P
M
1:2
6:0
0 P
M
1:5
2:0
0 P
M
2:1
8:0
0 P
M
2:4
4:0
0 P
M
3:1
0:0
0 P
M
3:3
6:0
0 P
M
4:0
2:0
0 P
M
4:2
8:0
0 P
M
4:5
4:0
0 P
M
5:2
0:0
0 P
M
5:4
6:0
0 P
M
6:1
2:0
0 P
M
6:3
8:0
0 P
M
7:0
4:0
0 P
M
7:3
0:0
0 P
M
7:5
6:0
0 P
M
8:2
2:0
0 P
M
8:4
8:0
0 P
M
9:1
4:0
0 P
M
9:4
0:0
0 P
M
10:0
6:0
0 P
M
10:3
2:0
0 P
M
10:5
8:0
0 P
M
11:2
4:0
0 P
M
11:5
0:0
0 P
M
Pow
er
(in W
att
s)
Time of Day
IIT Hospital ( Old Feeder )
Chart 3: IITB Hospital – (Logged Data)

#1 Demand Variability –World Cup
http://webarchive.nationalarchives.gov.uk/20121217150421/http://www.decc.gov.uk/assets/decc/statistics/publications/trends/articles_issue/560-trendssep10-electricity-demand-article.pdf
9

Gujarat Wind – March 3, 2016
12

PV Output Variability
Apt et al, 2011
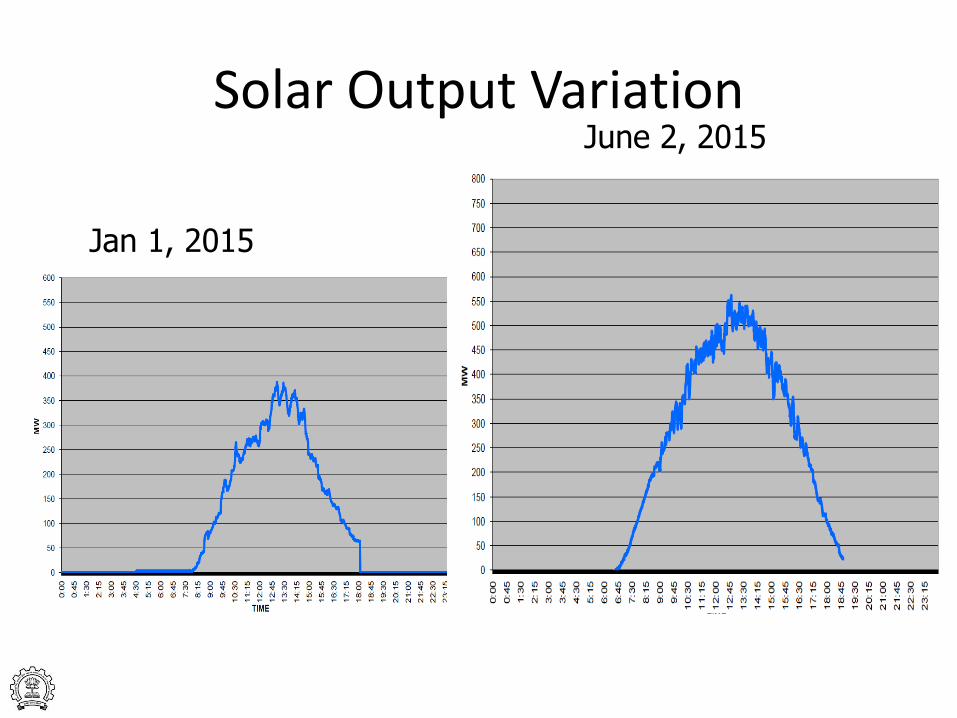
Jan 1, 2015
June 2, 2015
Solar Output Variation
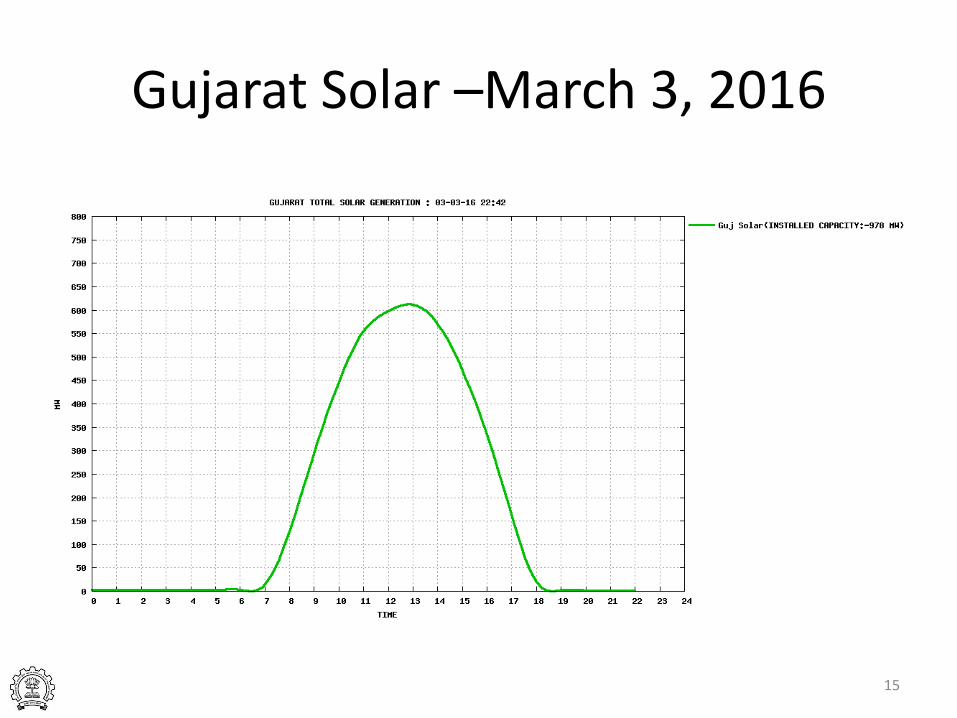
Gujarat Solar –March 3, 2016
15
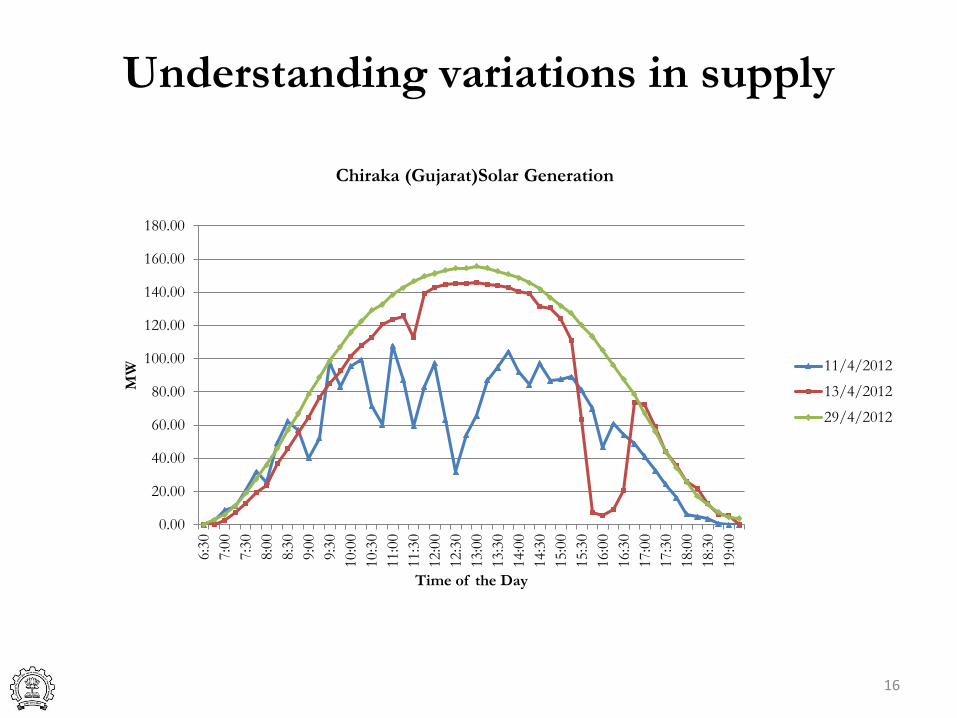
Understanding variations in supply
16
0.00
20.00
40.00
60.00
80.00
100.00
120.00
140.00
160.00
180.00
6:3
0
7:0
0
7:3
0
8:0
0
8:3
0
9:0
0
9:3
0
10:0
0
10:3
0
11:0
0
11:3
0
12:0
0
12:3
0
13:0
0
13:3
0
14:0
0
14:3
0
15:0
0
15:3
0
16:0
0
16:3
0
17:0
0
17:3
0
18:0
0
18:3
0
19:0
0
MW
Time of the Day
Chiraka (Gujarat)Solar Generation
11/4/2012
13/4/2012
29/4/2012

#2 Determine Sector wise and End-Use
wise Load Patterns.
17

Determine Sector wise Load Patterns.
18

#2 Determine Sector wise and End-Use
wise Load Patterns.
19

Estimation of load profiles IITB MB
0
10
20
30
40
50
60
70
80
12:0
0 A
M
1:0
0 A
M
2:0
0 A
M
3:0
0 A
M
4:0
0 A
M
5:0
0 A
M
6:0
0 A
M
7:0
0 A
M
8:0
0 A
M
9:0
0 A
M
10:0
0 A
M
11:0
0 A
M
12:0
0 P
M
1:0
0 P
M
2:0
0 P
M
3:0
0 P
M
4:0
0 P
M
5:0
0 P
M
6:0
0 P
M
7:0
0 P
M
8:0
0 P
M
9:0
0 P
M
10:0
0 P
M
11:0
0 P
M
Energy savings from
DSM
New Load curve
Old Load curve(kW)
Total peak demand savings = 20.5 kW = 20.7 kVA (@0.99 pf lag)
Energy savings = 161 kWh/day
20
0
10
20
30
40
50
60
70
80
12:00…
2:00…
4:00…
6:00…
8:00…
10:00…
12:00…
2:00…
4:00…
6:00…
8:00…
10:00…
MB TotalLoad
MB totallighting
Total fans
Totalcomputers
Total AC

Schematic of DR framework
21

Determining hardware control strategies.
22
DR strategies for Air Conditioning (AC) loads:

Determining hardware control strategies.
23

Determining hardware control strategies.
24
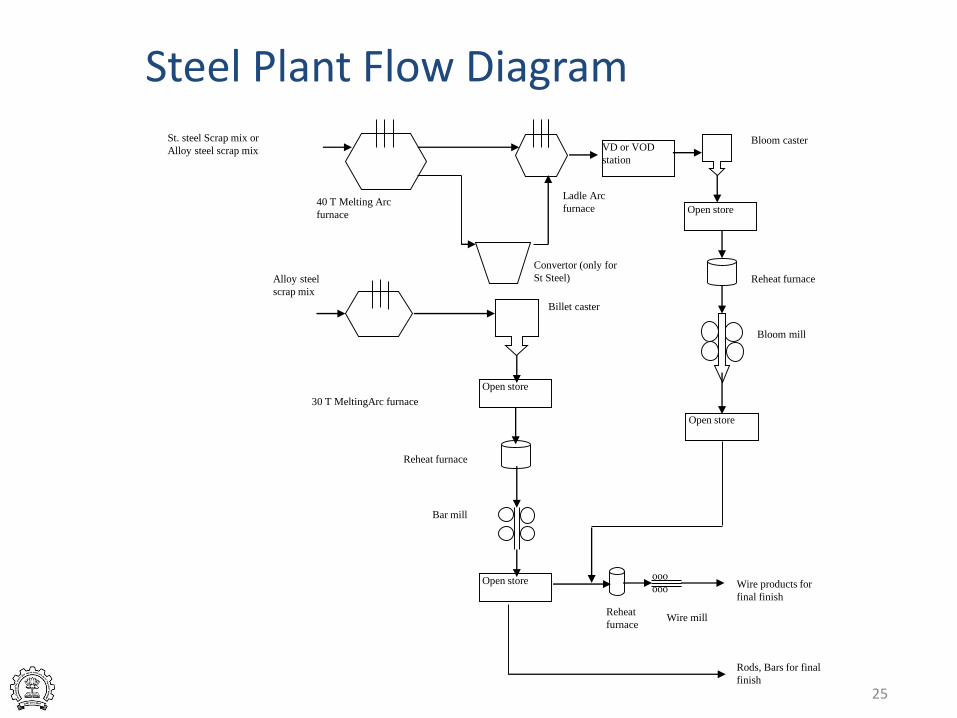
30 T MeltingArc furnace
Bar mill
Wire mill
40 T Melting Arc
furnace
St. steel Scrap mix or
Alloy steel scrap mix
Alloy steel
scrap mix
Convertor (only for
St Steel)
Ladle Arc
furnace
VD or VOD
station
Bloom caster
Billet caster
Bloom mill
ooo
ooo
Reheat furnace
Reheat furnace
Reheat
furnace
Wire products for
final finish
Rods, Bars for final
finish
Open store
Open store
Open store
Open store
Steel Plant Flow Diagram
25

0
10
20
30
40
50
60
Time hours
Lo
ad
MW
Optimal with TOU tariff
Optimal with flat tariff
2 4 6 8 10 12 14 16 18 20 22 24
Steel Plant Optimal Response to TOU tariff
26

Schematic of DR framework
27

Load Forecasting
• Black Box methods – Time series forecasting, Day matching, Artificial Neural Network Models
• Weather dependent models – Forecast Temperature
• Forecast variability in Supply
• Uncertainty in forecasts
• Improve suplly, demand forecasting methods
28
Need for DR
• Supply – Demand Matching
• Potential Shortfall based on forecasts
• Sudden tripping, outage
• Sudden load increases
• Storage, Pumped Hydro etc..
• Notification Period, Amount Needed
29

Schematic of DR framework
30

Example Of DR Baseline
31https://www.naesb.org//pdf4/dsmee100608enernoc_2.pdf
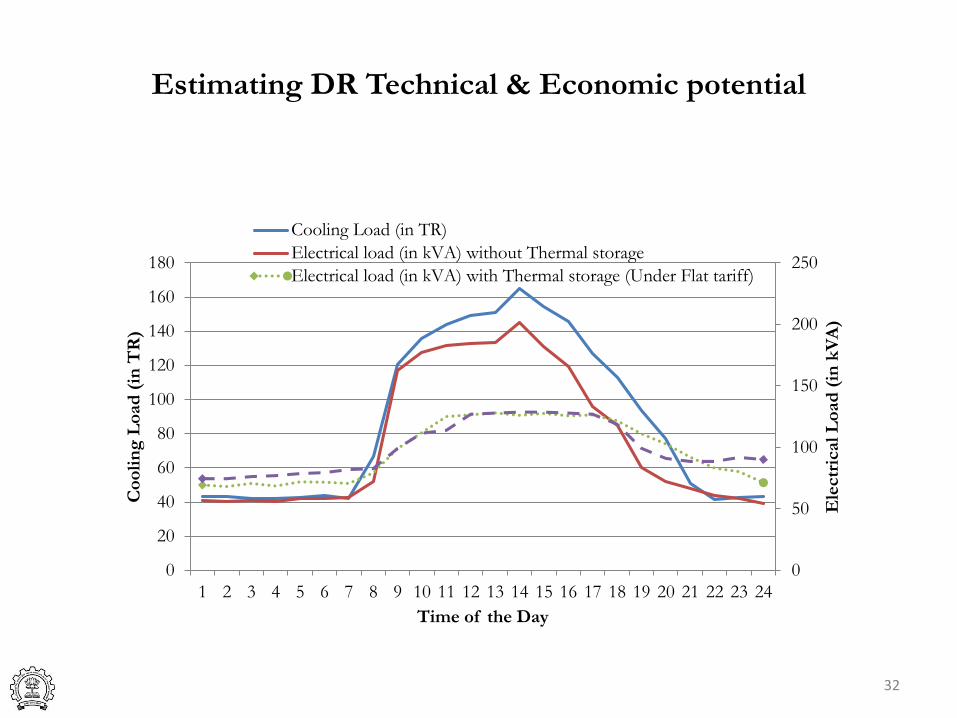
Estimating DR Technical & Economic potential
32
0
50
100
150
200
250
0
20
40
60
80
100
120
140
160
180
1 2 3 4 5 6 7 8 9 10 11 12 13 14 15 16 17 18 19 20 21 22 23 24
Ele
ctr
ical L
oad
(in
kV
A)
Co
oli
ng
Lo
ad
(in
TR
)
Time of the Day
Cooling Load (in TR)
Electrical load (in kVA) without Thermal storage
Electrical load (in kVA) with Thermal storage (Under Flat tariff)

Estimating DR Technical & Economic potential
33
0
500
1000
1500
2000
2500
3000
3500
0:1
5
1:1
5
2:1
5
3:1
5
4:1
5
5:1
5
6:1
5
7:1
5
8:1
5
9:1
5
10:1
5
11:1
5
12:1
5
13:1
5
14:1
5
15:1
5
16:1
5
17:1
5
18:1
5
19:1
5
20:1
5
21:1
5
22:1
5
23:1
5
Lo
ad
(in
kW
)
Time of the day
Use of thermal storage during DR call: Tata power-Mumbai
Customer Baseline (in kW)
Event Day customer meter data (in kW)

Schematic of DR framework
34

Deciding Policies, Regulations & incentives for DR and identifying
various responses to DR Call/Trigger.
35

Deciding Policies, Regulations & incentives for DR and identifying
various responses to DR Call/Trigger.
36
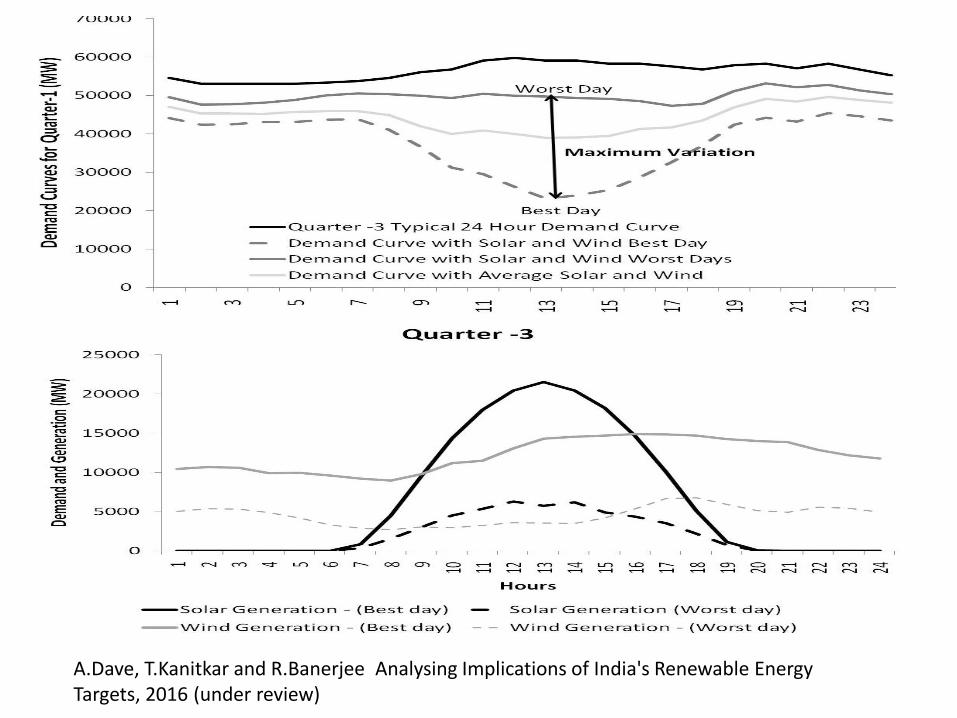
A.Dave, T.Kanitkar and R.Banerjee Analysing Implications of India's Renewable Energy Targets, 2016 (under review)

Summing Up
• Need to have an overall framework
• Need to document transaction costs, participation rates
• Need to improve forecasting and analytical tools
• Assess effectiveness and viability of DR by scaling pilots to utility wide deployment
• Public domain information, analysis
38

End Note
39
https://www.cartoonstock.com/directory/p/power_saving.asp
Thank You


![Http://. zip Developing browser based applications [SysReader Programmers Festival ‘97] T.N.C.Venkata Rangan Vishwak Associates.](https://static.fdocuments.us/doc/165x107/56649ed35503460f94be3bfb/httpwwweasytoolscomfestival-zip-developing-browser-based-applications.jpg)


