
Performance evaluation and load demand management of grid ...

Place your chosen
image here. The four
corners must just
cover the arrow tips.
For covers, the three
pictures should be the
same size and in a
straight line.
DEMAND CONTROL
Tim Truscott – Network Operations

2
Safety & Housekeeping
Fire Alarm
Toilets
Refreshments
Lunch

3
System Balancing
● Need to Balance Energy
● Allow for largest credible real time loss (1320MW)
● Demand uncertainty
● Generator breakdown
● Actions on BMU’s (Demand and Generation)
● Standing Reserve (BMU’s and non BMU’s)
● Manual Demand Control (DNOs and Directly Connected Customers)
● Automatic Action (LF Relays)

4
Demand Control - Grid Code OC6.5
● <20% Demand Reduction in 4 blocks of 4-6%
● Reductions over 20% can be required in 5% steps up to 40% (If High Risk of Demand Reduction issued at day ahead, otherwise on best endeavours basis)
● DNO to use voltage reduction or demand disconnection to achieve target
● Reduction based on demand at the time
● Reduction must be achieved in 5 minutes
● Traditionally assumed that the first 10% of demand reduction achievable by 6% voltage reduction

5
Demand Control Effectiveness
● First queried during Exercise Phoenix (2006/7)
● Limited tests carried out by EDF Energy and Central Networks in Summer and Autumn 2008
● Tests were on 3 types of demand
● Domestic, commercial & large industrial
● 3% voltage reduction gave average of 3.4% demand reduction (5% historically expected)
● Minimum 2.6%, maximum 5.1% demand reduction
● Reduction was sustained but difficult to identify amongst normaldemand variation
● Customer supplies may be interrupted earlier than previously anticipated

6
Demand Control 27 May 2008
Frequency Deviation following exceptional generation loss (1993MW)
48.2
48.4
48.6
48.8
49.0
49.2
49.4
49.6
49.8
50.0
50.2
11:3
0
11:3
1
11:3
2
11:3
3
11:3
4
11:3
5
11:3
6
11:3
7
11:3
8
11:3
9
11:4
0
11:4
1
11:4
2
11:4
3
11:4
4
Time (BST)
Fre
qu
en
cy
(H
z)
Loss of
Generator A
(345MW)
Loss of
Generator B
(1237MW)
Loss of 40MW large
generation and
>92MW
embedded generation
Loss of 279MW
embedded
generation
Loss of
1993MW within
3.5 minutes
Loss of
>1714MW
within 2 minutes
Outside of statutory limits for 9 minutes
Loss of 546MW of demand,
(totaling 278MWh)
Loss of 2020MW in 3 mins

7
Demand Control 27 May 2008
● 546 MW Demand (1.5%) Tripped by LF Relay
● Stabilised frequency
● 2266MW Demand armed to trip at 48.8Hz
● Relay tolerance and stable frequency prevented other trips
● Stage 1 Demand Control Instructed at 11:40 to 11:46
● Issued to 9 DNOs (5% = 1200MW)
● National Grid estimate that ~500MW delivered in 5 mins
● Demand Control not used since 1996 (at least)
● LF Relays not Operated since 1981

8
Demand Control - GCRP
● Exercise Phoenix Report Presented to Grid Code Review Panel February 2011
● 3% Voltage reduction more likely to provide 3% demand reduction
● Greater use of power electronics
● Increasing level of air conditioning
● Reduction in manufacturing
● Single Voltage Reduction could take up to 13 Mins to implement
● Due to functionality of current SCADA and voltage control systems
● Failure to implement manual (controlled) action increases likelihood of automatic (uncontrolled) action
9
Demand Control - GCRP
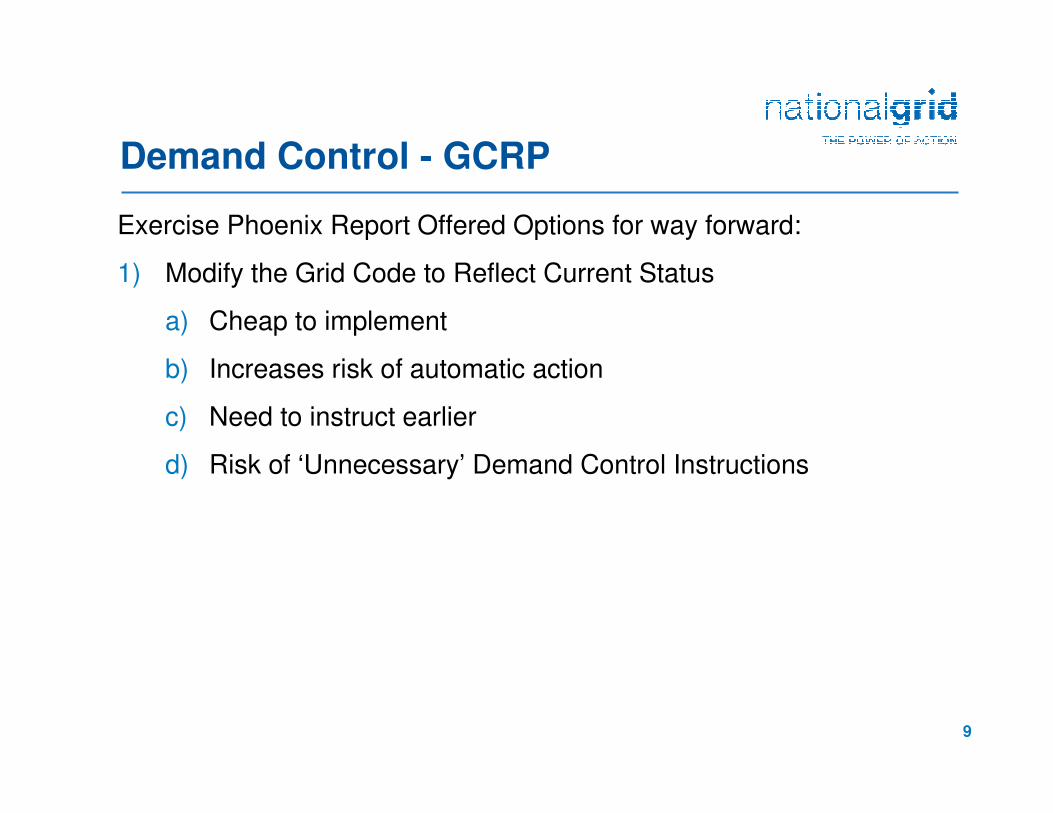
Exercise Phoenix Report Offered Options for way forward:
1) Modify the Grid Code to Reflect Current Status
a) Cheap to implement
b) Increases risk of automatic action
c) Need to instruct earlier
d) Risk of ‘Unnecessary’ Demand Control Instructions

10
Demand Control - GCRP
2) Improve Control Schemes
a) Improves implementation speed
b) Does not improve efficiency of voltage reduction
c) High cost
3) Accept that Demand Control will involve Demand Disconnection
a) Little cost
b) Fast response
c) Higher impact on customers
11
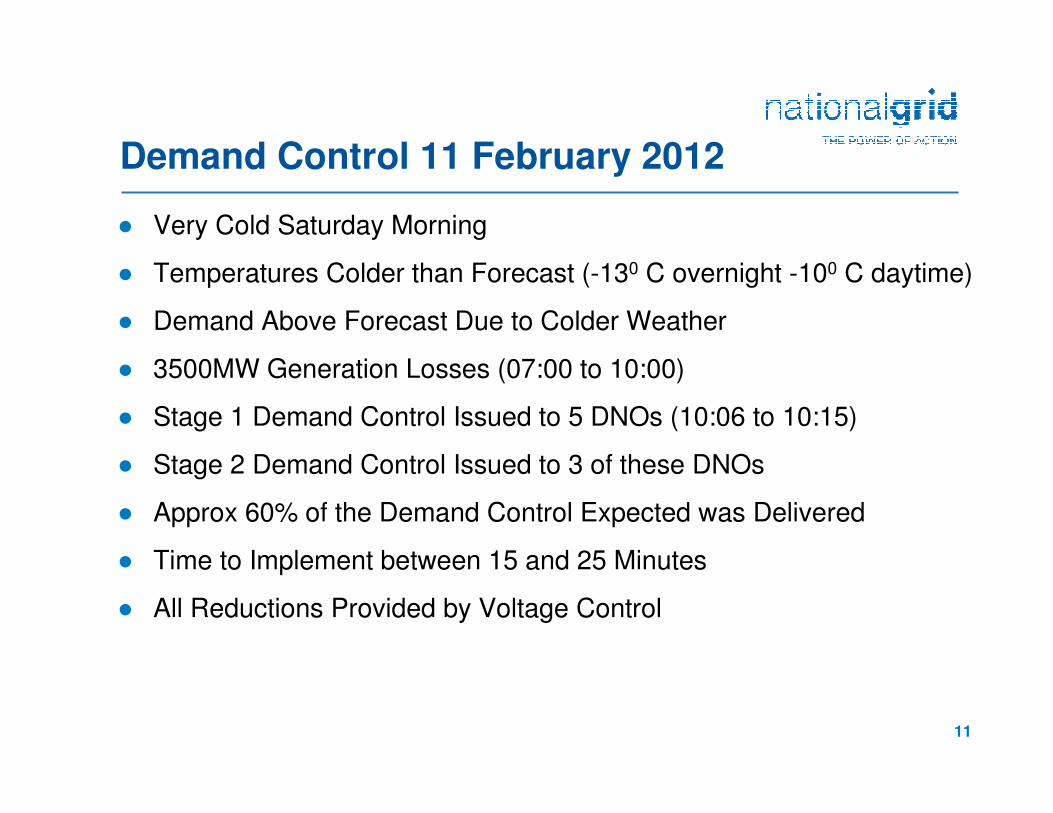
Demand Control 11 February 2012
● Very Cold Saturday Morning
● Temperatures Colder than Forecast (-130 C overnight -100 C daytime)
● Demand Above Forecast Due to Colder Weather
● 3500MW Generation Losses (07:00 to 10:00)
● Stage 1 Demand Control Issued to 5 DNOs (10:06 to 10:15)
● Stage 2 Demand Control Issued to 3 of these DNOs
● Approx 60% of the Demand Control Expected was Delivered
● Time to Implement between 15 and 25 Minutes
● All Reductions Provided by Voltage Control
12
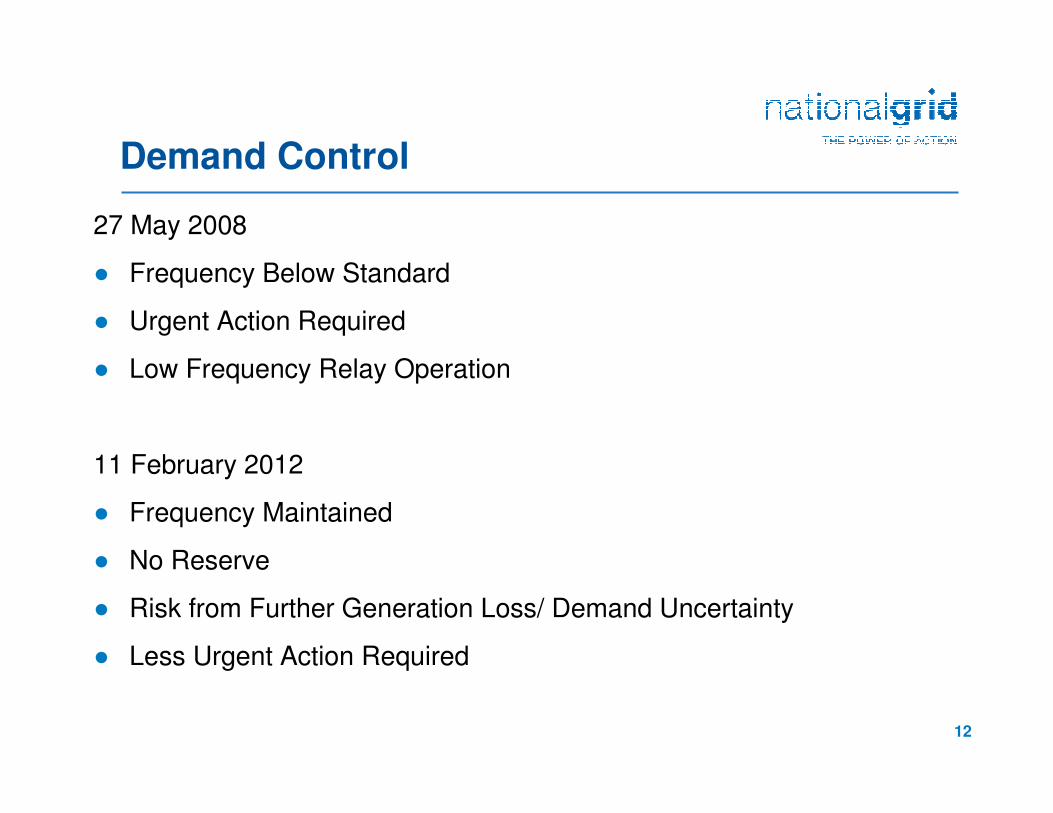
Demand Control
27 May 2008
● Frequency Below Standard
● Urgent Action Required
● Low Frequency Relay Operation
11 February 2012
● Frequency Maintained
● No Reserve
● Risk from Further Generation Loss/ Demand Uncertainty
● Less Urgent Action Required
13
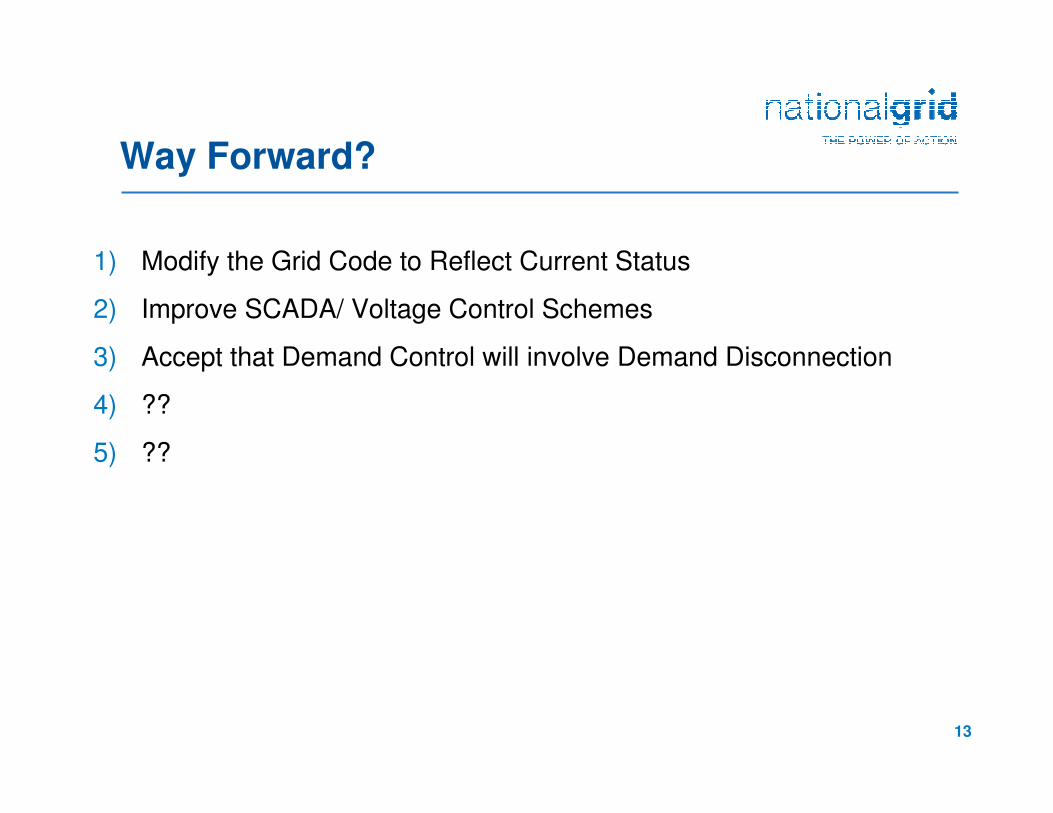
Way Forward?
1) Modify the Grid Code to Reflect Current Status
2) Improve SCADA/ Voltage Control Schemes
3) Accept that Demand Control will involve Demand Disconnection
4) ??
5) ??