Demand and Supply Scenarios - Home - ENTSOG Network... · Demand and Supply Scenarios Carmen...
17
Demand and Supply Scenarios Carmen Rodriguez Adviser TYDNP 2013/22 Brussels – 15 November 2012
Transcript of Demand and Supply Scenarios - Home - ENTSOG Network... · Demand and Supply Scenarios Carmen...

Demand and Supply Scenarios
Carmen Rodriguez
Adviser
TYDNP 2013/22
Brussels – 15 November 2012

2
Demand Scenarios
Introduction
> ENTSOG scenario is the sum of TSOs’ forecasts.
> Crossroad between Bottom-up scenario with a Top-down definition of situation.
Yearly volumes, used to analyze the average day, these figures allow the comparison with other outlooks
High daily demand:
o Design case: The peak demand design situation as calculated by TSOs and laid down in National Development Plans and TSO capacity outlooks where existing.
o Simultaneous high daily demand: 1-day based on a common probability occurrence using the percentile 5% on the climatic parameter (Top-down definition of climatic conditions).
o 14-days simultaneous demand: average simultaneous high daily demand on a 14-day period based on a common (Top-down) definition of climatic conditions.

3
High daily demand: Design Case and Simultaneous peak
Design case: demand breakdown
3.5%
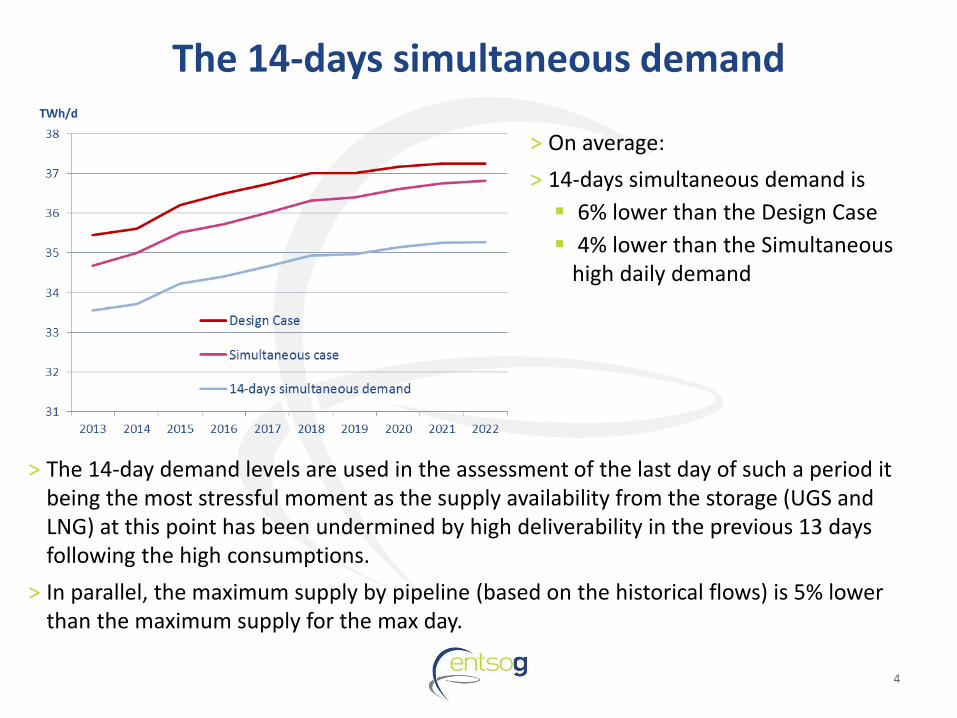
> On average:
> The Design Case is 3.5% lower than the High Daily demand in TYNDP 2011/20 (decrease to be explained by national conditions)
> The Simultaneous is slightly lower (2.2%) than the Design Case.
4
> The 14-day demand levels are used in the assessment of the last day of such a period it being the most stressful moment as the supply availability from the storage (UGS and LNG) at this point has been undermined by high deliverability in the previous 13 days following the high consumptions.
> In parallel, the maximum supply by pipeline (based on the historical flows) is 5% lower than the maximum supply for the max day.
The 14-days simultaneous demand
> On average:
> 14-days simultaneous demand is
6% lower than the Design Case
4% lower than the Simultaneous high daily demand
5
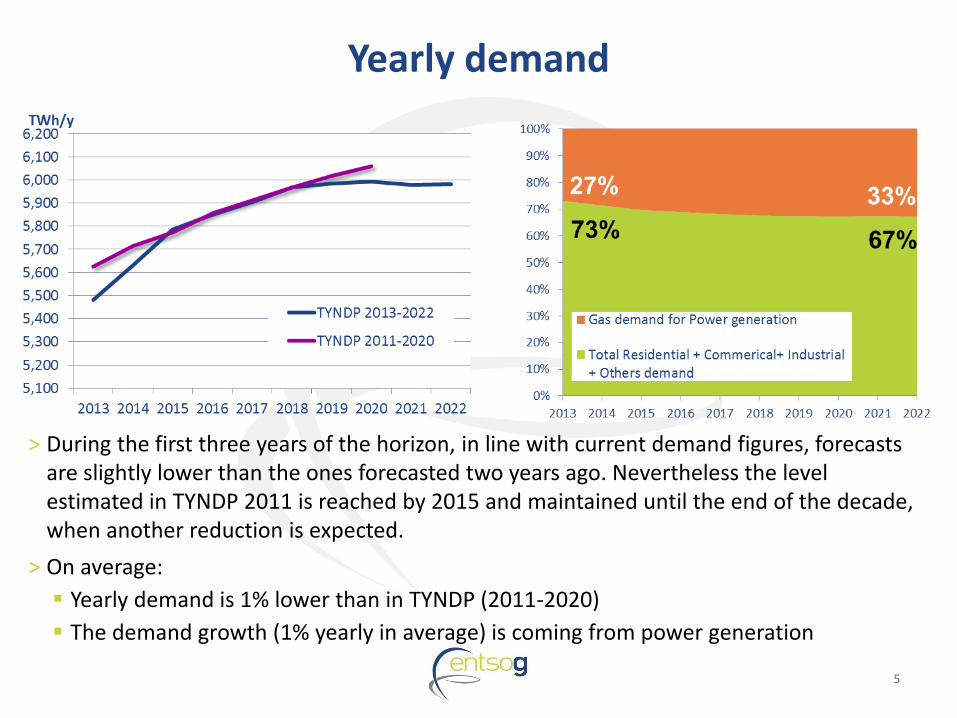
> During the first three years of the horizon, in line with current demand figures, forecasts are slightly lower than the ones forecasted two years ago. Nevertheless the level estimated in TYNDP 2011 is reached by 2015 and maintained until the end of the decade, when another reduction is expected.
> On average:
Yearly demand is 1% lower than in TYNDP (2011-2020)
The demand growth (1% yearly in average) is coming from power generation
Yearly demand

6
> Very close to the demand scenario of 2 years ago – Even when the demand scenario in certain countries has significantly changed from the previous one, changes in other countries‘ demand forecast neutralize the effect.
Where are we?

7
Introduction
> Supply falls out of the TSO’s remit. The supply potential is defined on the basis of publicly available data from governmental sources and others, based on the yearly level. In TYNDP there is no room for supply forecasts.
> Multi-scenario approach: Range of potential supply scenarios by source:
Maximum
Intermediate
Minimum
> As general limitation, none of the supply cases are allowed to go over the technical capacity.
Supply Scenarios

8
Use of the different potential supply scenarios
Supply Scenarios
Supply Reference Case - yearly average
Maximization
Minimization
Maximum
Minimum
Intermediate
YEARLY AVERAGE
> Supply reference case: Based on the historical shares of the different supply sources within the European supply mix, taking the Intermediate potential supply scenario as upper constraint.
HIGH DAILY DEMAND
> Supply reference case based on the historical daily maximums for pipeline imports, leaving LNG and UGS as last resort.

9
Supply Scenarios Indigenous Production
> The uncertainty in the Indigenous production is limited on the 10 years range
> Most of the information regarding unconventional sources is based on initial estimations, and therefore, when no precise information was available it was not considered – particularly in Poland.

10
Supply Scenarios Norway
> Maximum scenario – GASSCO
> Minimum scenario – Minimum from NPD (Norwegian Petroleum Directorate)
> Intermediate as the average btw. Max and min.

11
Russia
> Public Source: Russian Energy Strategy– Even the highest scenario is lower than the average one considered in TYNDP 2011.
> Figures based on gas sales
Supply Scenarios
12
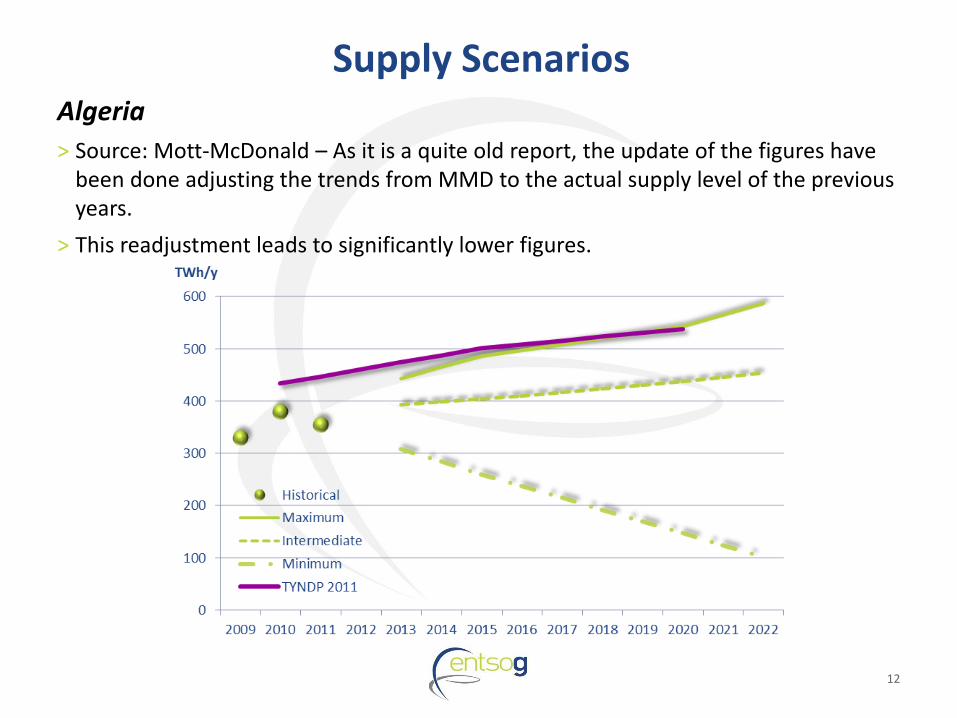
Algeria
> Source: Mott-McDonald – As it is a quite old report, the update of the figures have been done adjusting the trends from MMD to the actual supply level of the previous years.
> This readjustment leads to significantly lower figures.
Supply Scenarios
13
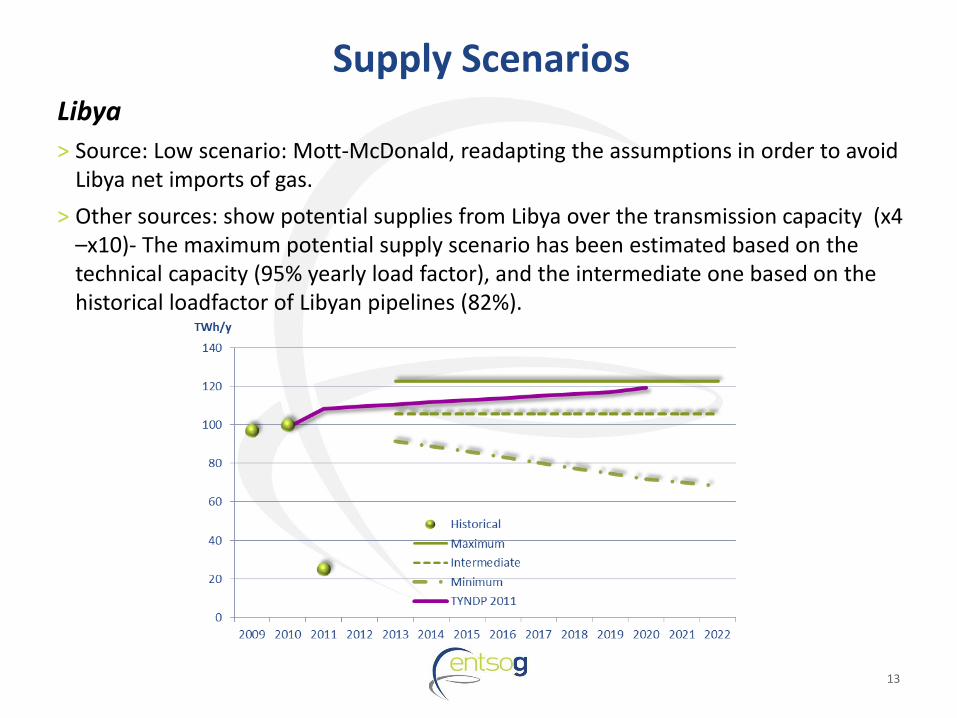
Libya
> Source: Low scenario: Mott-McDonald, readapting the assumptions in order to avoid Libya net imports of gas.
> Other sources: show potential supplies from Libya over the transmission capacity (x4 –x10)- The maximum potential supply scenario has been estimated based on the technical capacity (95% yearly load factor), and the intermediate one based on the historical loadfactor of Libyan pipelines (82%).
Supply Scenarios

14
LNG
> High uncertainty in the LNG supply, with sharp changes from one year to the other.
> High scenario: based on the liquefaction capacity by basin, and shares of each basin coming to Europe
> Intermediate and Low scenarios based on the scenario of regasification capacity and the historical loadfactors of the LNG terminals in Europe
Supply Scenarios

15
Supply-Demand balance
16
> There is not a big change in the demand scenario:
refinement in the first years for the alignment with the actual figures
Similar long term trend as estimated two years before
> Definition of high daily demand cases:
Simultaneous peak – only slightly lower than the design case
14-days average day – potentially the most challenging from the network point of view.
> The aggregation of potential scenarios is over demand scenario.
> Different Supply scenarios will be assessed under different cases.
> ENTSOG welcomes inputs on the supply scenarios.
Conclusion
Thank You for Your Attention
ENTSOG -- European Network of Transmission System Operators for Gas Avenue de Cortenbergh 100, B-1000 Brussels
EML: WWW: www.entsog.eu
Carmen Rodríguez ENTSOG Adviser, System Development