
Demand and Supply
42
Slide 1 of 42 Demand and Supply “Talk is cheap because supply exceeds demand.” -Author Unknown
-
Upload
lumen-learning -
Category
Education
-
view
27 -
download
0
Transcript of Demand and Supply

Slide 1 of 42
Demand and Supply
“Talk is cheap because supply exceeds demand.”-Author Unknown

Slide 2 of 42
Demand and Supply
As we will learn in this module, prices and quantities are determined by participants in each market.
But who are the participants?HouseholdsBusinesses

Slide 3 of 42
These participants interact to determine what is produced and how much it costs!
BusinessBuy ResourcesSell Products
HouseholdsSell ResourcesBuy Products
Resource Market
Product Market
Goods & Services
Land
, L
abor
, C
apita
l, E
ntre
pren
eurs
Goo
ds & S
ervices
Resources
Wages, Rents, Interest, profitsC
onsumptio
n E
xpenditu
res
Costs
Revenue
Participants include businesses and households
Households sell resources to businesses in exchange for payment. They use these
payments to purchase products.

Slide 4 of 42
So what is demand?
A schedule or curve that shows the quantity of a product that customers (households) would purchase at a
given set of possible prices in a particular time.

Slide 5 of 42
An example of a demand schedule
Imagine that I talked to every consumer in an economy (or in this class) and found out what quantity of a good they
would want at particular prices. Perhaps that survey would generate the following results:
At a price of $10, no one would want this good
At a price of $2, 8 units would be demanded
We could plot these data points to see a “demand curve” as is
done on the next slide…

Slide 6 of 42
Demand Curve – price (P) and quantity demand (Qd) have a negative relationship
Note: market demand is the sum of each individual demand
This is the Demand curve
A red box like this usually means that this information is important and will appear on
your test!
Notice the “downward slope” suggesting that as price
increases, consumer want less of this item. This leads us to the
law of demand…
The Law of Demand- All else equal, as price falls, the
quantity demanded increases and as price rises, the
quantity demanded decreases

Slide 7 of 42
Let’s turn our attention to supply
Imagine that I talked to every company in an economy and found out what quantity of a good they would produce at particular prices. Perhaps
the table below would summarize my findings:
We could plot these data points to see a “supply curve” as is done on the next slide…
At a price of $10, producers may be
excited and want to supply 10 units
At a price of $2, only 2 units would be supplied
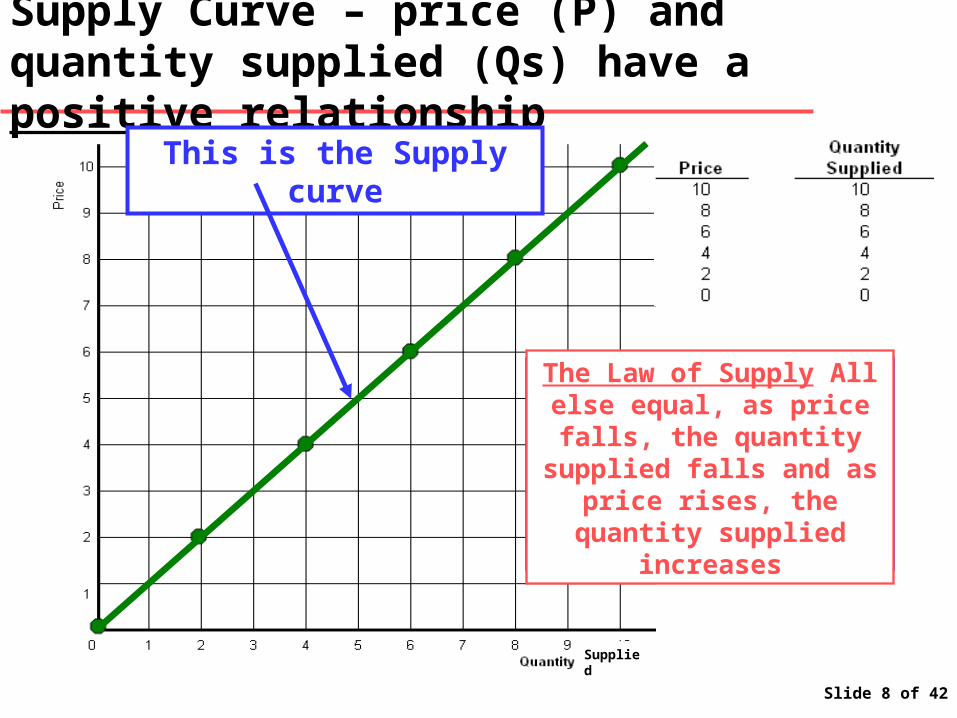
Slide 8 of 42
Supply Curve – price (P) and quantity supplied (Qs) have a positive relationship
This is the Supply curve
Supplied
Notice the “upward slope” suggesting that as price
increases, producers want to make more of this item. This
leads us to the law of supply…
The Law of Supply All else equal, as price falls, the
quantity supplied falls and as price rises, the quantity
supplied increases

Slide 9 of 42
Putting them together gives us a market
For this market, the equilibrium price will be $5
For this market, the equilibrium quantity will be 5 units
If left alone, a market will always
find this “equilibrium”
point.
But how do we know that this
will work?
Now we have a market…we have a demand curve representing the
buyer and a supply curve representing a seller.
So what will happen? How will these “participants” determine price
and quantity?
It is at this point where supply
equals demand. Here, these
participants agree upon price!

Slide 10 of 42
How do we know that the market will price this good at $5 and supply 5 units?
If the price was set at $6
Then quantity demanded (Qd) would be 4 units…
…and quantity supplied (Qs) would be 6 units
Producers would wind up with a surplus
and would eventually
reduce prices to sell the extra
units!
In other words, there would be a surplus of 2 units!

Slide 11 of 42
On the other hand, shortages drive prices up
If the price was set at $2
Then Qs would be 2 units…
…and Qd would be 8 units
Producers would wind up
with a shortage.
Consumers would
eventually offer a higher price!
In other words, there would be a shortage of 6 units!

Slide 12 of 42
Markets are amazing things!
So if left alone, a market…or specifically the participants in it…
will drive prices to this point.
It is at equilibrium that the forces of supply and demand are equal…
And the market clears!

Slide 13 of 42
Let’s explore Supply and Demand in more detail
• There are differences between changes in quantity demand and changes in demand
• There are differences between changes in quantity supplied and changes in supply

Slide 14 of 42
Changes in quantity demand:Movements along the demand curves
A change in price (from $7 to $4) will result in a change in the
quantity demanded (from 3 to 6 units)

Slide 15 of 42
Real world example: airline pricing
What do airlines do if many seats are open a week before the flight?
They sell them at reduced prices, perhaps in Internet specials.

Slide 16 of 42
Changes in quantity supplied:Movements along the supply curves
A change in price (from $5 to $8) will result in a change in the quantity supplied (from 5 to 8
units)
Supplied

Slide 17 of 42
Changes in demand cause a shift in the demand curve (in this case an increase)
Think of it this way…each of the points that make up this line have
shifted to the right!
Previously, at a price of $8, 2 units were
demanded.
Now, given some new information, we demand
4 units at $8.
Note that the new demand curve is shown as D with an
apostrophe after it (D’).

Slide 18 of 42
Here is an example of a decrease in demand
Here, the idea is the same…except we are
demanding LESS of this good!

Slide 19 of 42
Changes in demand have an impact on price and quantity
• If Demand P Q
• If Demand P Q
We are now exploring another Key Learning Outcome: Economic events can shift supply
and demand curves and that affects the price of a good and how much of it we buy!

Slide 20 of 42
Factors affecting demand: Prices of related goods can affect demand
If french fry prices double, demand for ketchup will probably decline
Demand for Ketchup
These goods are compliments
When the price of one goes up, we demand less of the other!

Slide 21 of 42
Factors affecting demand: Price of related goods can affect demand
If beer prices double, demand for wine will probably increase
Demand for Wine
These goods are substitutes
When the price of one goes up, we demand MORE of the other!

Slide 22 of 42
Factors affecting demand: Income can affect demand
If income increases, demand for most goods will probably increase
Demand for normal goods
These goods are normal
When our income goes up, we demand more of these items.

Slide 23 of 42
Factors affecting demand: Income can affect demand
If income increases, demand for inferior goods will probably decrease
Demand for Inferior Goods
Some goods such as Spam are inferior (at least according to me. You may love Spam.)
When our income goes up, we demand less of these items!

Slide 24 of 42
Other factors affecting demand
Expected Future Prices
Population
Tastes and Preferences
If consumers think prices will fall, they may demand less of a product now
As population grows, demand for most goods increases
Fads can affect demand. For example a hot Christmas item such as an Xbox or a “Tickle Me Elmo” may cause demand to increase

Slide 25 of 42
Changes in supply cause a shift in the supply curve (in this case an increase)

Slide 26 of 42
Here is an example of a decrease in supply

Slide 27 of 42
Changes in supply have an impact on price and quantity
• If Supply P Q
• If Supply P Q

Slide 28 of 42
Factors affecting supply: Prices of related goods can affect supply
If price of beef falls, supply of leather will probably fall
Supply of Leather
These goods are compliments in production

Slide 29 of 42
Factors affecting supply: Price of related goods can affect supply
If corn prices fall, supply of soybeans will probably increase
Supply of Soybeans
These goods are substitutes in production

Slide 30 of 42
Factors affecting supply: number of suppliers
As more suppliers enter the market, supply will increase

Slide 31 of 42
Factors affecting supply: Weather
Weather can help or hurt a market
Market for Orange JuiceMarket for Skiing
Cold weather
can destroy
the orange market
Cold weather can help the ski market

Slide 32 of 42
Factors affecting supply: Technology
Improved technology may increase supply
Market for Autos

Slide 33 of 42
Other factors affecting supply
Expected Future Prices
Taxes and Incentives
If producers think prices will fall, they may provide more of a product now
Governments use taxes and incentives to encourage of discourage the production of certain goods

Slide 34 of 42
In Summary
In a command economy, some
central authority has to decide price and
quantity for every good sold.
That is obviously difficult to do and
errors routinely result in surpluses or
shortages.
A market has its own built in rationing system.
Those that want it at the prevailing price get to buy it. Those that do
not want to pay that much can leave it.
If an item becomes very popular, its price may rise and new suppliers
may add to the supply.
If an item loses appeal, it’s price may fall. That will discourage
producers and reduce the amount of goods made.
Therefore, markets serve as great rationing mechanisms!
Here we see another Key Learning Outcome: Many events can shift
supply and demand curves and when they
do, prices and quantities change!

Slide 35 of 42
Supply and Demand:Individual exercises
Review the following six slides and determine the new price and quantity
Answers appear at the end of this presentation.

Slide 36 of 42
#1- Computers

Slide 37 of 42
#2 - Beanie Babies

Slide 38 of 42
#3 - Oil

Slide 39 of 42
#4 - Websites

Slide 40 of 42
#5 – Orange Juice

Slide 41 of 42
#6 - Widgets

Slide 42 of 42
Answers
Q1: New equilibrium price is $2, new equilibrium quantity is 3 units.
Q2: New equilibrium price is $5, new equilibrium quantity is 4 units.
Q3: New equilibrium price is $4, new equilibrium quantity is 1 units.
Q4: New equilibrium price is $2, new equilibrium quantity is 6 units.
Q5: Cannot be determined…Buyers and Sellers do not agree on a price!
Q6: New equilibrium price is $2, new equilibrium quantity is 5 units.
Expect questions like this on the test. If you do not understand these, please let me know!


