DEMAND
22
description
DEMAND. Definition: The various quantities of a good or service that someone is WILLING and ABLE to buy at DIFFERENT PRICES at a PARTICULAR TIME WILLING and ABLE Does Mr. Hayward have demand for…?:. YES!. NO!!!. NO!. Individual Demand vs. Market Demand. - PowerPoint PPT Presentation
Transcript of DEMAND


DEMAND• Definition: The various quantities of a good or service that
someone is WILLING and ABLE to buy at DIFFERENT PRICES at a PARTICULAR TIME
• WILLING and ABLE
•Does Mr. Hayward have demand for…?:

YES!

NO!!!

NO!

Individual Demand vs. Market Demand• I may not have demand for a porsche, but
others do…•Market Demand – Sum of all individual’s
demand

Demand Schedule
Grade Upgrade Certificates

Graphing Demand
Demand Schedule Demand Curve

Law of Demand
•As Price increases, Quantity Demanded decreases•As Price decreases, Quantity
Demanded increases
As P↑, Qd↓As P↓, Qd↑

Nature of Demand Curve
• Diminishing marginal utility•What would compel you to buy
additional JBCs?

Change in Quantity Demanded• Income Effect• Buying power
• Substitution Effect• Pepsi vs. Coke

Change in Quantity Demanded
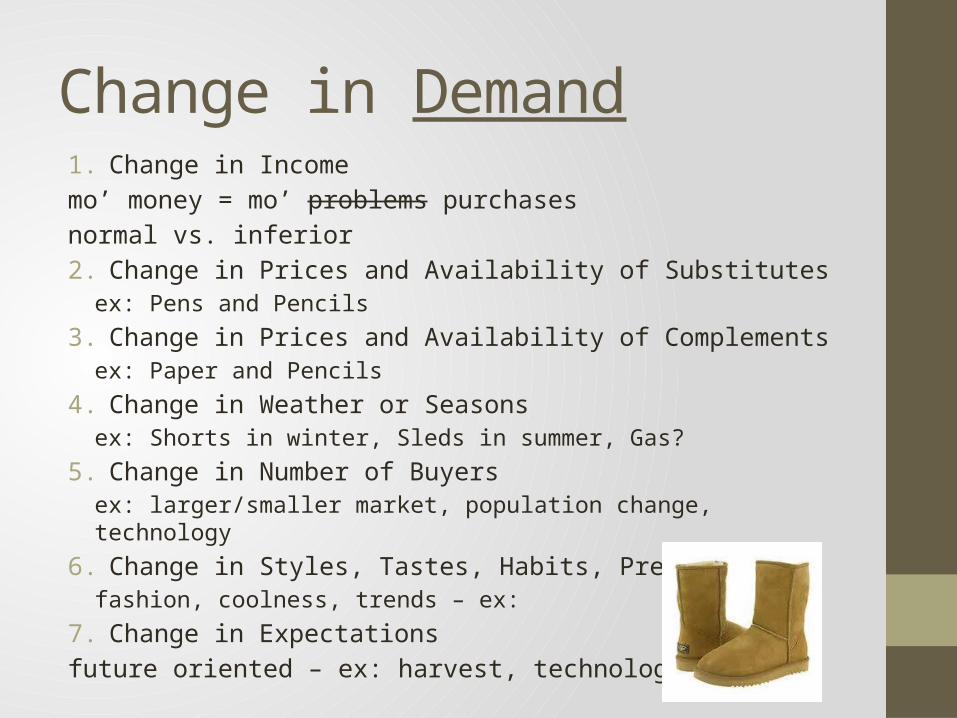
Change in Demand1. Change in Income
mo’ money = mo’ problems purchases normal vs. inferior
2. Change in Prices and Availability of Substitutesex: Pens and Pencils
3. Change in Prices and Availability of Complementsex: Paper and Pencils
4. Change in Weather or Seasonsex: Shorts in winter, Sleds in summer, Gas?
5. Change in Number of Buyersex: larger/smaller market, population change, technology
6. Change in Styles, Tastes, Habits, Preferencesfashion, coolness, trends – ex:
7. Change in Expectationsfuture oriented – ex: harvest, technology

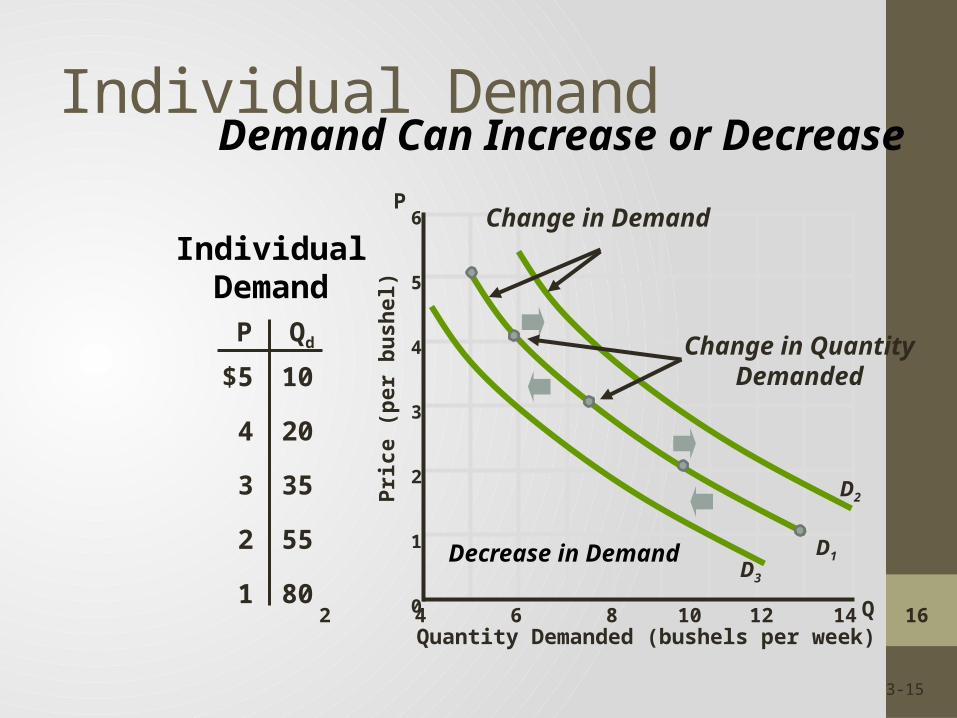
Individual Demand
6
5
4
3
2
1
0
Quantity Demanded (bushels per week)
Pri
ce (
per
bu
shel
)
P Qd
$5
4
3
2
1
10
20
35
55
80
IndividualDemand
P
Q
D1
2 4 6 8 10 12 14 16 18
Demand Can Increase or Decrease
Increase in Demand
Decrease in Demand
D2
D3
3-14
Individual Demand
6
5
4
3
2
1
0
Quantity Demanded (bushels per week)
Pri
ce (
per
bu
shel
)
P Qd
$5
4
3
2
1
10
20
35
55
80
IndividualDemand
P
Q
D1
2 4 6 8 10 12 14 16 18
Demand Can Increase or Decrease
Decrease in Demand
D2
D3
Change in Demand
Change in Quantity Demanded
3-15

Elasticity•Measurement of a good’s
responsiveness to a change in price• The price effect is greater for some
goods than for others• Examples:


Elasticity• Large Price Effect → Elastic
Ex:
• Small Price Effect → InelasticEx:
Other Examples?

Factors Affecting Elasticity• Time:• Can purchase be delayed?• Time to adjust…• Longer price change persists = more elastic• Immediately after price change = more inelastic
•Availability, Suitability, Price of Substitutes• More/better/cheaper substitutes = more elastic• Ex: Ibuprofen vs. Insulin
•Percentage of Budget• Larger % = more elastic• Ex: New Car for me vs. LeBron James

Testing for Elasticity• Graphical Comparison
The flatter the curve, the more Elastic the good.The steeper the curve, the more Inelastic the good.
Inelastic
Elastic
Testing for Elasticity• Total Revenue Test --- TR = P x Q• Example:• If P and TR move in the same
direction, demand isinelastic
• If P and TR move in oppositedirections, demand iselastic
• Hot Dogs?• Gas?

Extending Elasticity
• How does elasticity of demand affect us?• What do these have in common?
• Government taxes inelastic goods…• Why doesn’t govt. tend to tax elastic goods?