deloitte-cn-ibs-2018-africa-construction-trends-report-en ...
60
If you want to prosper, first build roads Africa Construction Trends Report 2018
Transcript of deloitte-cn-ibs-2018-africa-construction-trends-report-en ...

If you want to prosper, first build roadsAfrica Construction Trends Report2018

Africa Construction Trends Report 2018 | Africa Construction in Focus
2
Contents
Preface 3
Africa Construction in Focus 4
Economic Realities for Infrastructure & Capital Projects Spending 13
Regional Construction Focus 18
East Africa 18
Southern Africa 25
Central Africa 30
West Africa 37
North Africa 42
Connecting the Dots: How Africa links to China’s Belt and Road Initiative (BRI) 49
Methodology 56
Endnotes 57
Contacts 58

Africa Construction Trends Report 2018 | Preface
3
Preface
The impact of infrastructure cannot be overemphasised, and the challenges facing governments providing and enabling private sector development and involvement in infrastructure is still important. This report looks at the infrastructure gap and how governments have been spending on projects to try and address this gap. Projects are analysed across Africa, and per region. Areas of analysis include ownership, and, in Africa, government plays a significant role.
Another factor is funding, a discussion which unpacks the role of both private and public sector institutions, in particular development finance institutions (DFIs) and China. What is noticeable is the relatively low funding by African DFIs compared to others.
We also look at who builds, and the rise of foreign contractors who are beginning to overshadow local contractors: 33% of projects tracked were built by Chinese companies, while 24% were built by local contractors.
Following Transport, another sector showing an increase is Real Estate, with a rising number of real estate projects. Real Estate is broken down into the following categories: Industrial, Commercial and Residential; both Industrial and Commercial projects’ growth is significant. Industrial Real Estate projects support a number of governments’ strategies in improving the
manufacturing base of their economies; whether it is by Export Processing Zones (EPZ) or Special Economic Zones (SEZ), increasing the level of value addition to primary market commodities is a common thread among many government strategies. Improving the manufacturing base, however, relies on transport routes to facilitate the ease of moving goods both within a country and certainly inter-regionally.
This year’s report also focusses on the role of China in Africa and in particular what the Belt and Road Initiative (BRI) means, contributes and promises to many African governments. Governments, contractors, and financiers are wondering how to adapt and what role they can play in the infrastructure space in line with the BRI: Deloitte Africa is working closely with the Deloitte China practice to help companies, governments and investors understand the roles and opportunities within the BRI. This report is available in both English and Chinese, highlighting the synergies of our Deloitte offering across borders.
Deloitte teams have advised on many of the world’s largest and most complex Infrastructure and Capital Projects (I&CP). Our teams advise clients across the lifecycle of an infrastructure asset and other large capital projects, so that investors, project developers, sponsors and operators in both the public and private sectors can take every step
with confidence. The unprecedented magnitude of current African infrastructure development plans and private sector growth initiatives requires significant capital management skills. With a presence in 34 countries and service to 51 countries, Deloitte is well positioned and understands the nuances of doing business in Africa.
Our integrated pan-African I&CP team includes dedicated professionals based in South Africa, Kenya, Uganda, Ghana, Nigeria, Côte d’Ivoire, France, the United Arab Emirates, and Tunisia, serving governments and private sector clients across the continent.
As a team we welcome your thoughts and considerations on this and future reports of this nature.
J-P LabuschagneDeloitte East and West Africa Infrastructure & Capital Projects Leader
If you want to prosper, first build roads, says a Chinese proverb. In this year’s Africa Construction Trends (ACT) Report, the proverb certainly holds true, as the Transport sector continues to lead the way with almost 40% of the 482 projects tracked being either roads, bridges or rail: the sector continues to grow and so does the role of China on the continent.

Africa Construction Trends Report 2018 | Africa Construction in Focus
4
Continental statistics
0
100
200
300
400
500
2014 2015 2016 2017 2018
Number of projects Value (US$bn)
257
326301
375
286324 303 307
482 471
0
20
40
60
80
100
Egypt Kenya Ethiopia South Africa Algeria
Number of projects Value (US$bn)
46
79.2
41 38.2 38
19.1
37
49.5
32
51.9
0
100
200
300
400
500
2014 2015 2016 2017 2018
Number of projects Value (US$bn)
257
326301
375
286324 303 307
482 471
0
20
40
60
80
100
Egypt Kenya Ethiopia South Africa Algeria
Number of projects Value (US$bn)
46
79.2
41 38.2 38
19.1
37
49.5
32
51.9
Top 5 countries by number of projects
Source: Deloitte analysis, 2018
Africa Construction in FocusThe number of projects qualifying for inclusion increased by 59.1%, while the total value of projects increased by 53.3% year-on-year. As a region, and for the first time since the inception of this report, East Africa has the largest number of recorded projects with 139 projects. North Africa accounts for the largest share of projects in terms of value at 31.5% (or US$148.3bn).
The projects included are spread over 43 of Africa’s 54 countries. Egypt is the single country having the most projects with 46 projects (9.5% of projects on the continent) as well as the most projects by value at US$79.2bn (17% of the continent’s value), edging out South Africa and Nigeria respectively.
The 2018 edition of Deloitte’s Africa Construction Trends Report includes 482 projects valued at US$50m or above, that had broken ground by 1 June 2018. In total, these projects are worth US$471bn.
Source: Deloitte analysis, 2018

Africa Construction Trends Report 2018 | Africa Construction in Focus
5
100%
90%
80%
70%
60%
50%
40%
30%
20%
10%
0%
22.6%
28.8%
21.4%
5.4%
21.8%
31.5%
18.5%
26.6%
5.7%
17.6%
North Africa East Africa West AfricaSouthern Africa Central Africa
Number of projects (%) Value of projects (%)
Regional split
Source: Deloitte analysis, 2018
The majority of projects in this year’s report lie in the lower US$50m-US$500m value range. A total of 80 projects have a value greater than US$1.1bn, of which 14 of those projects have a value greater than US$10bn. This distribution falls in line with findings from the 2017 Africa Construction Trends Report on the difficulty in structuring, financing, and delivering mega projects on the continent.
The top three projects in Africa are made up of two projects in the Oil & Gas sector, and one project in the Energy & Power sector. These three projects account for a combined value of US$62bn, representing 13.0% of the continent’s combined project value.
Over US$10bn – 14 projects (2.9%)
US$5.1bn-US$10bn – 5 projects (1.0%)
US$1.1bn-US$5bn – 61 projects (12.7%)
US$501m-US$1bn – 63 projects (13.1%)
US$50m-US$500m – 339 projects (70.3%)
Source: Deloitte analysis, 2018
Projects by value

Africa Construction Trends Report 2018 | Africa Construction in Focus
6
North Africa 2014 2015 2016 2017 20182018% of
continental projects
Number of projects 8 29 42 40 109 22.6
Value (US$bn) 9.1 25.8 76.1 77.1 148.3 31.5
Southern Africa 2014 2015 2016 2017 20182018% of
continental projects
Number of projects 119 109 85 93 103 21.4
Value (US$bn) 144.9 140 93.4 89.7 125.4 26.6
East Africa 2014 2015 2016 2017 20182018% of
continental projects
Number of projects 51 61 43 71 139 28.8
Value (US$bn) 60.7 57.5 27.4 32.6 87.1 18.5

Africa Construction Trends Report 2018 | Africa Construction in Focus
7
West Africa 2014 2015 2016 2017 20182018% of
continental projects
Number of projects 66 79 92 79 105 21.8
Value (US$bn) 74.8 116.2 119.8 98.3 82.8 17.6
Central Africa 2014 2015 2016 2017 20182018% of
continental projects
Number of projects 13 23 24 20 26 5.4
Value (US$bn) 33.2 35.8 7 9.5 26.9 5.7
Source: Deloitte analysis, 2018May not total to 100% due to rounding.

Africa Construction Trends Report 2018 | Africa Construction in Focus
8
Projects by sector Number of
projectsShare of projects
by number (%)
Change in number of
projects from 20171
Value of projects (US$bn)
Share of projects by value (%)
Change in value of projects
from 2017 (US$bn) 2
Energy & Power 66 13.7 8 114.6 24.4 47.2
Transport 186 38.6 77 107.0 22.7 35.3
Real Estate 110 22.8 42 123.3 26.2 81.0
Water 26 5.4 12 6.3 1.3 2.5
Mining 32 6.6 22 29.4 6.2 21.6
Oil & Gas 8 1.7 -5 39.0 8.2 -38.4
Shipping & Ports 36 7.5 12 49.0 10.4 12.7
Social Development 3 0.6 1 0.3 0.1 -0.1
Healthcare 13 2.7 10 1.7 0.4 1.3
Education 2 0.4 0 0.5 0.1 -0.1
Source: Deloitte analysis, 2018
The North Africa region witnessed the largest change in the number of projects, with an increase of 69 projects, representing a 172.5% increase from last year’s count of 40 projects. At the same time, the total US dollar value of projects in the North Africa region increased by 92.3%.
In terms of the total US dollar value of projects in Africa, the Central Africa region witnessed the largest change with an increase of US$17.1bn (174.5%). This increase corresponds with a 30% increase in the number of projects in Central Africa.
West Africa is the only region to see a decrease in the US dollar value of projects, decreasing by US$15.5bn (-15.8%) despite an increase of 32.9% in the number of projects. This is most likely the result of the region’s largest economy, Nigeria, experiencing slow economic recovery, straining expenditure on larger-scale construction projects.

Africa Construction Trends Report 2018 | Africa Construction in Focus
9
Industrial Construction – 43 projects (US$59.1bn)
Commercial Construction – 60 projects (US$62.2bn)
Residential Construction – 7 projects (US$2.0bn)
Real Estate
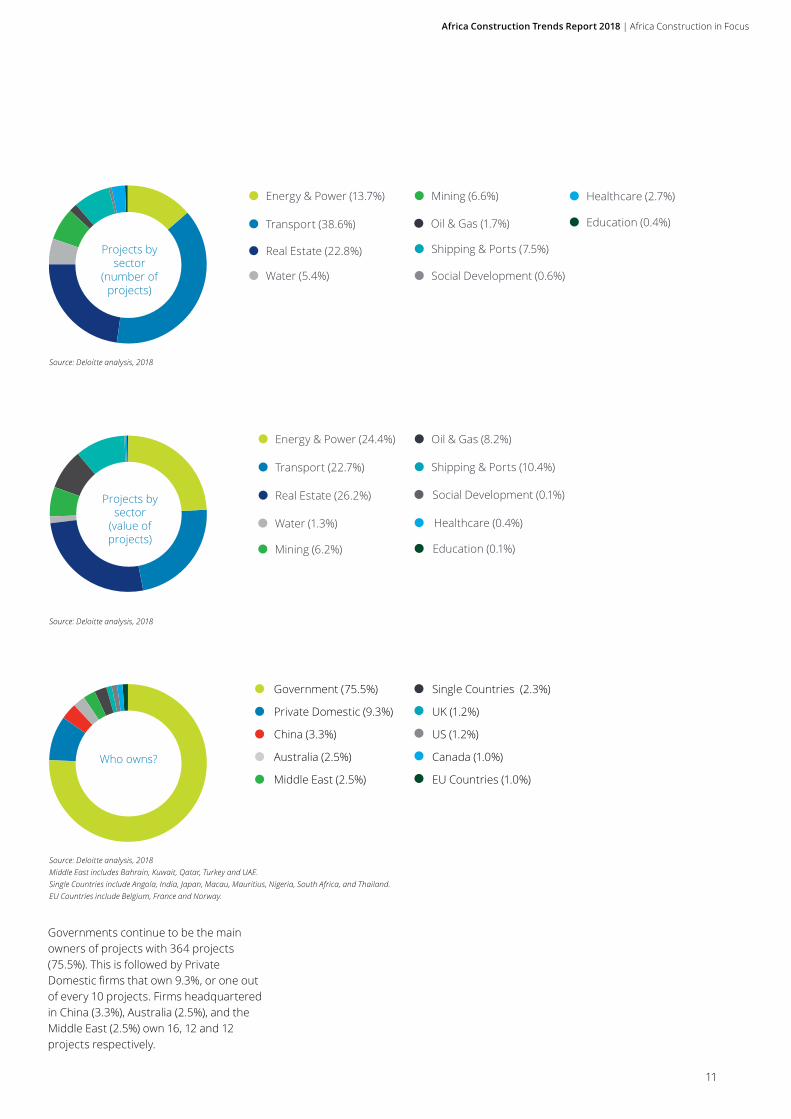
The greatest number of projects fall into the Transport sector (38.6%), followed by Real Estate (22.8%), Energy & Power (13.7%) and Shipping & Ports (7.5%). The Real Estate sector is comprised of Industrial
Construction, Commercial Construction, as well as Residential Construction. The Real Estate sector in Africa is made up as follows:
Of the 186 Transport projects featured in this year’s analysis, 72.5% (135) represent road and bridge construction activity. This can be interpreted as a concerted attempt by governments to enhance trade and growth-supporting infrastructure across the continent. This goes to prove that “if you want to prosper, first build roads”.
The Transport sector, valued at US$107bn, represents 22.7% of the continent’s total US dollar spend on large construction projects, with governments and China being the two significant funders within the sector.
Large-scale investment into Social Development and Education projects remains low at 0.1% (each) across the continent. Large-scale investment into the Education sector in particular will become more urgent in the future as the continent continues its growth trajectory towards a large population of employable youth.
Source: Deloitte analysis, 2018

Africa Construction Trends Report 2018 | Africa Construction in Focus
10
Projects by sector 2014% 2015% 2016% 2017% 2018%
Energy & Power 37 28 21 19 14
Transport 34 37 34 36 39
Real Estate 6 6 22 22 23
Water 5 8 4 5 5
Mining 9 7 3 3 7
Oil & Gas 4 6 5 4 2
Shipping & Ports / / 8 8 8
Social Development / 4 1 1 1
TMT 1 1 / / /
Healthcare 1 1 2 1 3
Education 1 1 1 1 1
Agriculture 1 / / / /
Mixed Use 1 1 / / /
Source: Deloitte analysis, 2018May not total to 100% due to rounding.
Share of projects by number
Africa Construction Trends Report 2018 | Africa Construction in Focus
11
Projects by sector
(number of projects)
Energy & Power (13.7%)
Transport (38.6%)
Real Estate (22.8%)
Water (5.4%)
Oil & Gas (1.7%) Education (0.4%)
Shipping & Ports (7.5%)
Mining (6.6%) Healthcare (2.7%)
Source: Deloitte analysis, 2018
Social Development (0.6%)
Projects by sector
(value of projects)
Source: Deloitte analysis, 2018
Energy & Power (24.4%)
Transport (22.7%)
Real Estate (26.2%)
Water (1.3%)
Oil & Gas (8.2%)
Education (0.1%)
Shipping & Ports (10.4%)
Mining (6.2%)
Healthcare (0.4%)
Social Development (0.1%)
Who owns?
Government (75.5%)
Private Domestic (9.3%)
China (3.3%)
Australia (2.5%)
Middle East (2.5%)
Single Countries (2.3%)
UK (1.2%)
US (1.2%)
Canada (1.0%)
EU Countries (1.0%)
Source: Deloitte analysis, 2018Middle East includes Bahrain, Kuwait, Qatar, Turkey and UAE.Single Countries include Angola, India, Japan, Macau, Mauritius, Nigeria, South Africa, and Thailand.EU Countries include Belgium, France and Norway.
Governments continue to be the main owners of projects with 364 projects (75.5%). This is followed by Private Domestic firms that own 9.3%, or one out of every 10 projects. Firms headquartered in China (3.3%), Australia (2.5%), and the Middle East (2.5%) own 16, 12 and 12 projects respectively.

Africa Construction Trends Report 2018 | Africa Construction in Focus
12
Who funds?
Government (24.5%)
International DFIs (13.7%)
China (18.9%)
Private Domestic (10.6%)
African DFIs (9.1%)
EU Countries (5.0%)
Single Countries (3.7%)
UAE (3.9%)
Australia (2.3%)
UK (2.3%)
Consortiums (2.1%)
US (1.7%)
South Africa (1.2%)
Canada (1.0%)
Source: Deloitte analysis, 2018EU Countries include Austria, Belgium, France, Germany, Italy, Luxembourg, Norway, and Portugal.Single Countries include Angola, Brazil, Ghana, India, Japan, Macau, Mauritius, Morocco, Nigeria, Russia, South Korea, Switzerland, and Thailand.
Who builds?
China (33.2%)
Private Domestic (23.9%)
Other EU Countries (6.8%)
Other Asian Countries (6.6%)
Middle East (4.4%)
Italy (4.4%)
African Countries (3.5%)
North America (3.3%)
France (3.1%)
Australia (2.3%)
South Africa (1.9%)
Latin America (1.7%)
Consortiums (1.9%)
Government (1.2%)
UK (1.2%)
Other Countries (0.6%)
Source: Deloitte analysis, 2018Other EU Countries include Austria, Belgium, Denmark, Finland, Germany, Greece, the Netherlands, Portugal, and Spain.Other Asian Countries include India, Japan, Macau, Russia, Singapore, and South Korea.Middle East includes Kuwait, Qatar, Saudi Arabia, Turkey, and the UAE.African Countries include Botswana, Burkina Faso, Côte d’Ivoire, Egypt, Ethiopia, Gabon, Liberia, Mauritius, Morocco, Rwanda, Tanzania, and Tunisia.North America includes Canada and the US.Latin America include Brazil and Chile. Other Countries include Iceland and Switzerland.
In line with ownership, governments continue to fund the largest share of projects, financing 118 projects (24.5%) in the period under review, with the majority of government-funded projects on the continent falling into the Transport sector. China funds 91 projects (18.9%), close to one in every five projects, followed by International DFIs with 66 projects (13.7%), and Private Domestic firms with 51 projects (10.6%).
China leads as the most prolific (and single country) builder of projects, constructing 160 (33.2%) projects, up from 85 projects last year. Other notable single-country builders include Italian firms, albeit some way behind with 21 (4.4%) projects, followed by French firms with 15 projects (3.1%). The majority of Chinese construction falls within the Transport sector.

Africa Construction Trends Report 2018 | Economic Realities for Infrastructure & Capital Projects Spending
13
Economic Realities for Infrastructure & Capital Projects Spending According to the International Monetary Fund’s (IMF) October 2018 World Economic Outlook (WEO) update, global growth is projected at 3.7% for 2018-19,3 a slight decrease of 0.2 percentage points from the IMF’s April 2018 forecast. Though the projection remains in line with the IMF’s previous growth forecast in April 2018, global growth is expected to decline going forward, with an increase in risks added to the outlook.
Emerging markets – expected to grow at 4.7% in 2018 and 2019 – will face increasingly uneven growth prospects, the result of global trade tensions, downward pressures on local currencies, as well as rising oil prices. Developed economies will grow at 2.4% over the same period.
Sub-Saharan Africa’s (SSA) growth has seen a slight recovery to 3.1% in 2018, with a further increase to 3.8% expected in 2019, highlighting the region’s resilience. Such resilience is the result of structural reforms, improved macroeconomic policies, and rising domestic demand. This forecast falls in line with global growth projections of 3.7% for 2019. According to the IMF, improvements in SSA’s growth prospects reflect a more supportive external environment, including stronger global growth, higher commodity prices, and improved capital market access.
Three of SSA’s biggest four economies are growing incrementally. Nigeria will experience average growth of 2.1% in 2018-19, while South Africa will grow at an average 1.1% during the same period. Ethiopia, expected to grow at an average of 8% during 2018-19, is the only economy among SSA’s top four economies that will exceed the 2018-19 emerging market growth rate of 4.7%. Angola, the second largest oil exporter in the region, is expected to shrink by 0.1% in 2018, but recover in 2019 at 3.1%.
East Africa continues to be the best performing region, being one of the least dependent on hard commodity price movements. As countries such as Ethiopia, Kenya, Rwanda, and Tanzania continue to be the frontier growth stories of the continent, the region is expected to post the highest regional growth at 6.4% over the 2018-19 period.
North Africa’s weighted growth rate over the 2018-19 period is expected to be 4.0%, as economic activity continues to recover in Libya, particularly oil production in the country. Egypt, now Africa’s largest economy, is expected to drive growth in the region to above 5%; however, South Sudan’s ongoing civil unrest will continue to drag down economic growth.
While Africa’s growth bottomed out in 2016, thereafter demonstrating signs of recovery, commodity exporters (particularly oil-dependent economies) remain vulnerable to fluctuations in commodity prices. Central Africa has seen an improvement, with an average growth rate of 2.0% expected for 2018, recovering to a weighted growth of 3.1% over the 2018-19 period.
Furthermore, despite economies such as Côte d’Ivoire, Ghana, Benin, and Senegal expected to report growth of 6% or above in West Africa, the region’s weighted growth – dragged down mostly by low growth in Nigeria – is expected to reach 3.4% over the 2018-19 period. Similarly, Southern Africa is among the slowest growth regions for 2018-19, dragged down by poor performance in South Africa and its spill-over effect into neighbouring countries.
SSA’s growth is thus expected to average 3.5% over the 2018-19 period, while Africa as a whole is likely to average 3.9% growth over the same period.

Africa Construction Trends Report 2018 | Economic Realities for Infrastructure & Capital Projects Spending
14
Regional weighted real GDP growth outlook (2018e-19f)
North Africa
Source: Deloitte analysis based on IMF, 2018
3.4%4.0%
East Africa
6.4%
Southern Africa
1.7%
Central Africa
3.1%
West Africa
Investment in I&CP is essential for enabling GDP growth and more diversified economic and private sector activity. By providing access to basic services such as water, education, and healthcare, infrastructure ensures that economic growth is both sustainable and inclusive.
Furthermore, a productive infrastructure base proves essential to the industrialisation and diversification efforts of emerging economies, particularly resource dependent and agrarian economies such as those found in Africa. This is because investment in infrastructure tends to increase business confidence, and foster innovation and productivity, while at the same time lowering transaction costs, making it easier for companies to move people and goods, as well as provide services.
Foreign Direct Investment (FDI) also tends to increase with the development of infrastructure, resulting in the transfer of skills and best practices between foreign and domestic corporations.
Governments that invest in enabling infrastructure are therefore seen as more proactive and often friendlier towards business and attracting investment, and more likely to achieve economic and export diversification objectives. Africa’s industrialisation is key to ending poverty across the continent, as well as
ensuring enough jobs are created for the 12 million young people entering the continent’s labour force each year. Productive infrastructure projects assist in this regard by facilitating the economic growth and financial resources required for industrialisation to take place, and estimates made by the African Development Bank (AfDB) place the continent’s infrastructure needs at US$130bn-US$170bn a year.4
In reality, however, insufficient productive infrastructure in water, transport, and power continue to hamper the continent’s industrialisation and development efforts, due to a shortfall in financing for infrastructure development across the continent, estimated by the AfDB to fall in the range of US$68bn-US$108bn.5
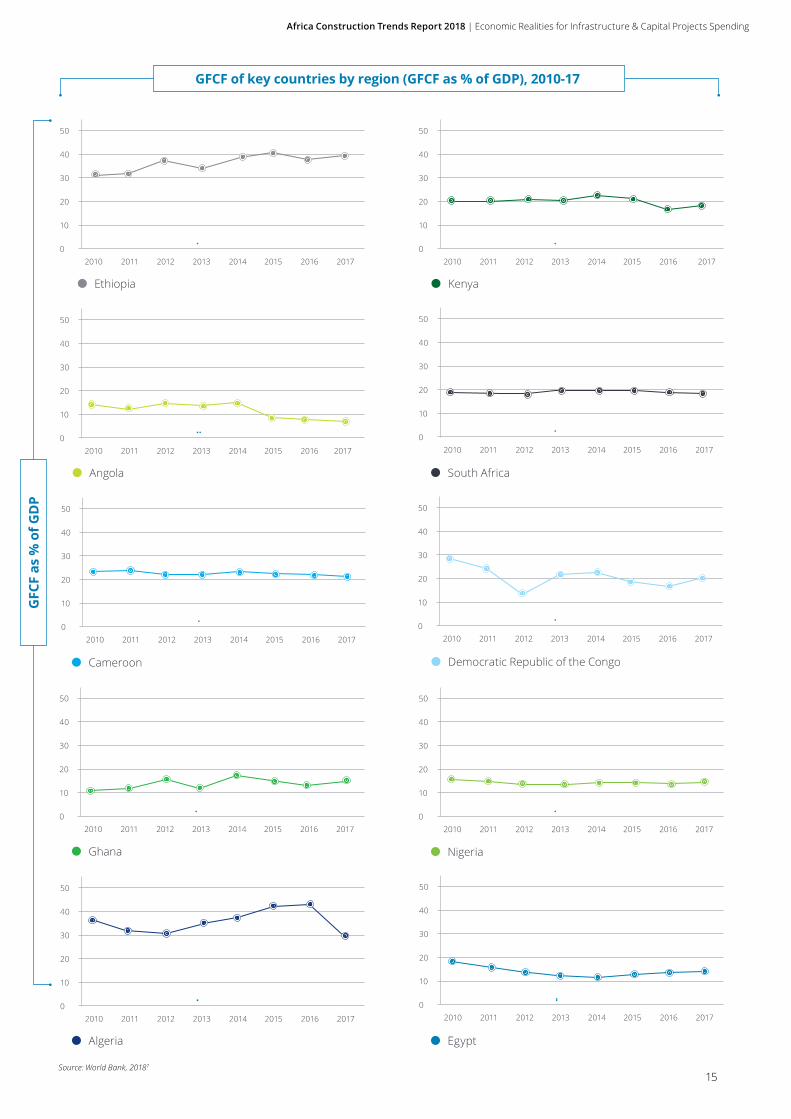
Gross fixed capital formation (GFCF) as a percentage of GDP, which includes land improvements and the construction of infrastructure by both the private and public sector, is indicative of infrastructure spend of countries. This and the last edition of this report track GFCF spend relative to GDP of key countries.
Across Africa, GFCF continues to vary strongly – both by country and by region. The larger the GFCF spend (relative to GDP), the more the country spends on improving and building infrastructure. A rule of thumb is that economies that are investing approximately 30% of GDP into
GFCF are able to create an environment conducive to growth.
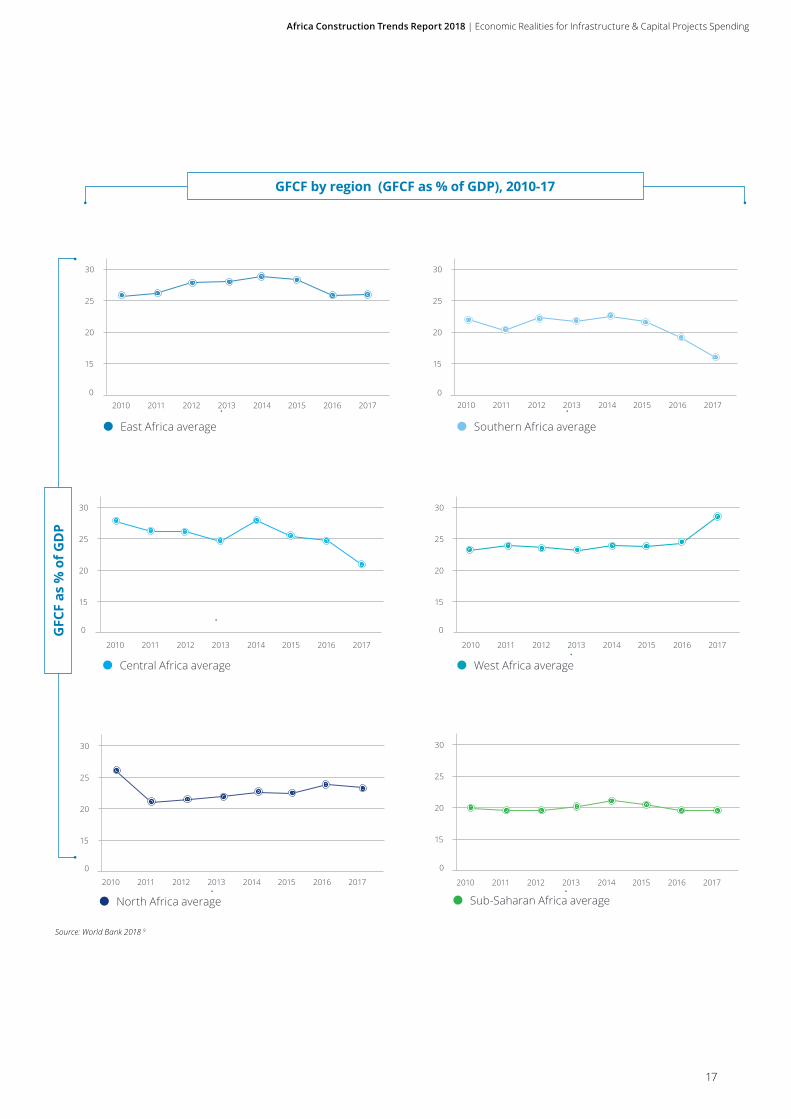
In 2017, SSA’s average GFCF was 19.5%, while the average for North Africa was 23.4%. West Africa had the highest regional average of GFCF spend at 28.6%, followed closely by East Africa at 26.1%; this is indicative of both regions’ drive to close Africa’s infrastructure gap.
Fitch Solutions forecasts expect GFCF spend for Nigeria to increase to 18.7% in 2021 from 18.1% in 2017. Forecasts for South Africa see a decrease in spend by 0.5 percentage points between 2017 and 2021, which the South African government is hoping to reverse through a renewed focus on infrastructure investment. This includes the launch of a R400bn (US$27.8bn) infrastructure fund aimed at reducing the fragmentation of spending on infrastructure.6 A 1.9 percentage point increase is estimated for Egypt, while Kenya is expected to decrease its GFCF spend by 1.4 percentage points.
Only Ethiopia (the seventh largest economy on the continent in 2018) has consistently spent over the required 30% of GDP on GFCF, spending the equivalent of 39% of GDP in 2017, one of the highest GFCF ratios globally. This level of spending is expected to remain, increasing marginally to 39.9% of GDP in 2020.
Africa Construction Trends Report 2018 | Economic Realities for Infrastructure & Capital Projects Spending
15
40
20
50
30
10
02010 2011 20132012 2014 2015 2016 2017
40
20
50
30
10
02010 2011 20132012 2014 2015 2016 2017
40
20
50
30
10
02010 2011 20132012 2014 2015 2016
40
20
50
30
10
02010 2011 20132012 2014 2015 2016 2017
40
20
50
30
10
02010 2011 20132012 2014 2015 2016 2017
40
20
50
30
10
02010 2011 20132012 2014 2015 2016 2017
40
20
50
30
10
02010 2011 20132012 2014 2015 2016 2017
40
20
50
30
10
02010 2011 20132012 2014 2015 2016
GFCF of key countries by region (GFCF as % of GDP), 2010-17
GFC
F as
% o
f GD
P
Source: World Bank, 20187
Ghana
South Africa
KenyaEthiopia
40
20
50
30
10
02010 2011 20132012 2014 2015 2016 2017 2017
Angola
Cameroon Democratic Republic of the Congo
2017
Nigeria
Algeria
40
20
50
30
10
02010 2011 20132012 2014 2015 2016 2017
Egypt

Africa Construction Trends Report 2018 | Economic Realities for Infrastructure & Capital Projects Spending
16
GFCF forecast by country (GFCF as % of GDP), 2016-21f
GFC
F as
% o
f GD
P
Source: Fitch Solutions, 2018 8
40
20
50
30
10
02016 2017e 2019f2018f 2020f 2021f
Egypt Ethiopia
40
20
50
30
10
0
40
20
50
30
10
0
Kenya
40
20
50
30
10
0
Nigeria
40
20
50
30
10
0
South Africa
2016 2021f2017e 2019f2018f 2020f
2016 2017e 2019f2018f 2020f 2021f 2016 2017e 2019f2018f 2020f 2021f
2016 2017e 2019f2018f 2020f 2021f
Africa Construction Trends Report 2018 | Economic Realities for Infrastructure & Capital Projects Spending
17
30
20
25
15
2010 2011 20132012 2014 2015 2016 2017
30
20
25
15
2010 2011 20132012 2014 2015 2016 2017
30
20
25
15
2010 2011 20132012 2014 2015 2016 2017
30
20
25
15
2010 2011 20132012 2014 2015 2016 2017
30
20
25
15
2010 2011 20132012 2014 2015 2016 2017
GFCF by region (GFCF as % of GDP), 2010-17
GFC
F as
% o
f GD
P
Source: World Bank 2018 9
East Africa average
30
20
25
15
2010 2011 20132012 2014 2015 2016 2017
Southern Africa average
Central Africa average West Africa average
North Africa average Sub-Saharan Africa average
0 0
0 0
0 0

Africa Construction Trends Report 2018 | Regional Construction Focus: East Africa
18
2014 2015 2016 2017 20182018% of continental
projects
Projects 51 61 43 71 139 28.8
Value (US$bn) 60.7 57.5 27 32.6 87.1 18.5
East Africa
Regional Construction Focus
The East Africa region – which includes Burundi, Comoros, Djibouti, Eritrea, Ethiopia, Kenya, Rwanda, Seychelles, Somalia, Tanzania, and Uganda – has a total of 139 projects at a combined value of US$87.1bn. East Africa accounts for 28.8% of projects on the continent and 18.5% in terms of US dollar value.
The total number of projects in East Africa has risen by a substantial 96% between 2017 and 2018 with an equally substantial increase of 167% in the total US dollar value of projects. This is mostly the result of high-value new projects in the region – such as the Konza Technology Park, and the Bagamoyo Mega Port – both of which are outlined in the top 10 projects below. Kenya has the largest number of projects in East Africa with 41 projects at a value of US$38.2m, followed by Ethiopia with 38 projects at a value of US$19.1m. The total value of projects in Kenya is double the value of projects in Ethiopia.

Africa Construction Trends Report 2018 | Regional Construction Focus: East Africa
19
Projects by sector 2014% 2015% 2016% 2017% 2018%
Energy & Power 37 30 26 23 18
Transport 59 51 47 52 45
Real Estate / 1 11 14 17
Water / 8 / 6 6
Mining 2 2 / / 4
Oil & Gas 2 3 2 1 1
Shipping & Ports / / 9 3 7
Social Development / 5 / / /
TMT / / / / /
Healthcare / / 5 / 2
Education / / / 1 /
Source: Deloitte analysis, 2018May not total 100% due to rounding.
Share of projects by number

Africa Construction Trends Report 2018 | Regional Construction Focus: East Africa
20
Source: Deloitte analysis, 2018
Energy & Power (18.0%)
Transport (45.3%)
Real Estate (17.3%)
Water (5.8%)
Oil & Gas (0.7%)
Healthcare (2.2%)
Shipping & Ports (6.5%)
Projects by sector
(number of projects)
Projects by sector
(value of projects)
Mining (4.3%)
Energy & Power (21.1%)
Transport (26.6%)
Real Estate (23.1%)
Water (1.5%)
Oil & Gas (2.4%)
Shipping & Ports (21.4%)
Healthcare (0.6%)Mining (3.3%)
Source: Deloitte analysis, 2018
The Transport sector continues to be the largest sector in East Africa, accounting for 45.3% of all projects in the region and 26.6% in terms of US dollar value. Energy & Power projects account for a significantly lower share of projects at 18.0% in the region and 21.1% in value terms. The focus on these two sectors reflects the fact that a well-developed transport network as well as reliable energy supply and access are integral to the East African Community’s (EAC) Development Strategy.
Completion of Kenya’s US$3.2bn Nairobi-Mombasa rail line – built and funded by Chinese construction companies and financiers respectively – marks the completion of the first phase of the intra-regional railway line that will eventually extend to Uganda, Rwanda, South Sudan, and Ethiopia, effectively placing Kenya at the centre of East Africa’s rail ecosystem.
Regional projects such as these demonstrate a shift towards trade-enabling infrastructure that aims to spur intra-Africa trade and integration. Furthermore, alignment through regional projects allows African economies – particularly smaller economies – to participate in collective bargaining, making it easier for them to secure funding for infrastructure projects.
Shipping & Ports accounts for 6.5% of all projects in the region and 21.4% in terms of US dollar value. One such port project – the Bagamoyo Mega Port in Tanzania – is the second largest project in East Africa in US dollar terms with a total value of US$11bn, demonstrating the significant level of investment intrinsic to port projects.

Africa Construction Trends Report 2018 | Regional Construction Focus: East Africa
21
Who owns?
China (5.8%)
Government (84.2%)
Single Countries (5.8%)
Private Domestic (4.3%)
Source: Deloitte analysis, 2018
Who funds?
China (25.9%)
International DFIs (20.1%)
African DFIs (14.4%)
Government (12.9%)
Single Countries (10.1%)
UK (3.6%)
EU Countries (7.2%)
Private Domestic (4.3%)
Consortiums (1.4%)
Source: Deloitte analysis, 2018
The majority of projects in East Africa are government-owned (84.2%), indicating the important role played by East African governments as facilitators of infrastructure development through national and regional development policy plans. One such regional policy plan is the EAC’s Vision 2050 – a blueprint for the mutual development of the East Africa region through improved regional integration.
East African governments fund only 12.9% of projects in the region, with China and International DFIs funding 25.9% and 20.1% respectively. The significant role played by China in advancing funding for infrastructure development in East Africa speaks to the importance of the region as a touch-point for China’s BRI.

Africa Construction Trends Report 2018 | Regional Construction Focus: East Africa
22
Who builds?
China (54.7%)
Private Domestic (11.5%)
Other EU Countries (7.2%)
India (4.3%)
Italy (3.6%)
Portugal (2.9%)
Single Countries (12.2%) Middle East (2.9%)
International Consortiums (0.7%)
Source: Deloitte analysis, 2018
Where building is concerned, China continues to be the most visible contributor, constructing over half of all projects. Private domestic firms are responsible for building 11.5% of projects, while firms from single countries collectively account for 12.2% of projects. Other European countries’ construction firms collectively build 7.2% of projects.
Indian companies construct 4.3% of projects in the region, while companies from Italy, Portugal, and the Middle East construct 3.6%, 2.9%, and 2.9% of projects each.
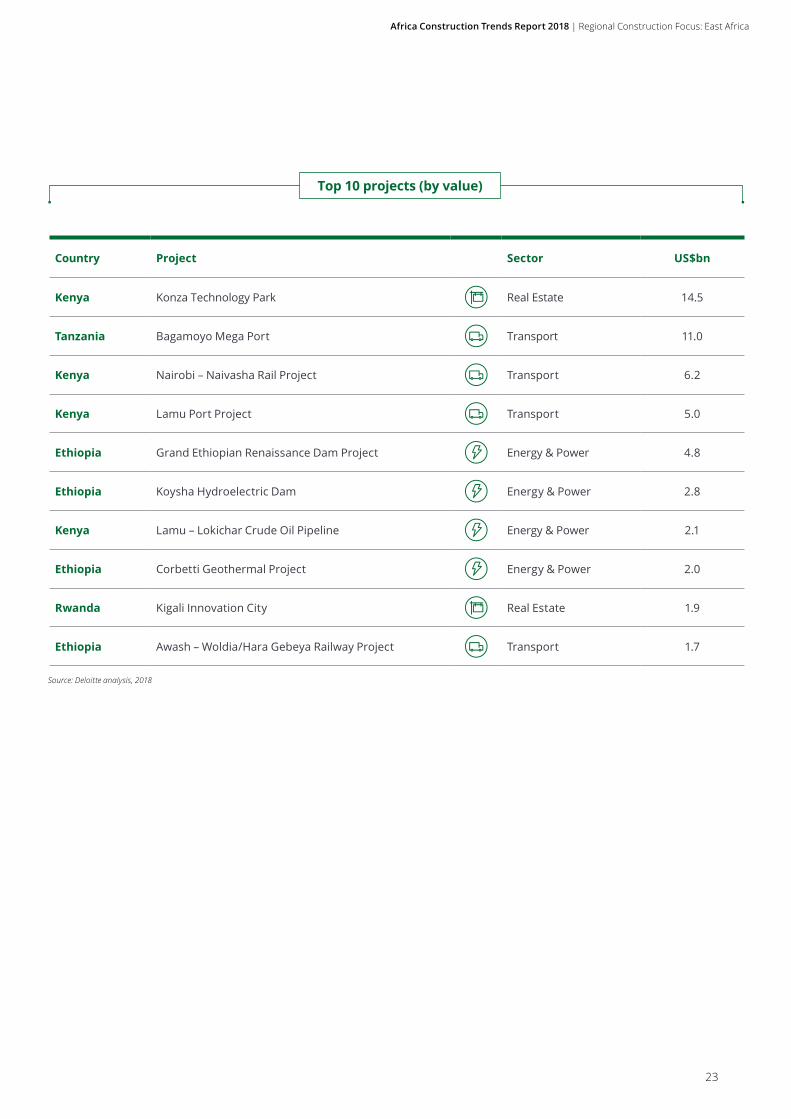
East Africa’s 10 largest projects make up 59.6% of the total US dollar value of projects in the region, indicating a high degree of concentration. Four of the largest projects in the East Africa region fall within the Transport sector (including
two rail and two port projects), with a further four projects in the Energy & Power sector, and two in Commercial Real Estate.
Konza Technology Park in Kenya – also known as “Silicon Savannah” – is worth US$14.5bn, and remains the most valuable project in the region. The project aims to make Konza Technology Park East Africa’s first “technopolis” – a city built specifically for technology firms.
Africa Construction Trends Report 2018 | Regional Construction Focus: East Africa
23
Country Project Sector US$bn
Kenya Konza Technology Park Real Estate 14.5
Tanzania Bagamoyo Mega Port Transport 11.0
Kenya Nairobi – Naivasha Rail Project Transport 6.2
Kenya Lamu Port Project Transport 5.0
Ethiopia Grand Ethiopian Renaissance Dam Project Energy & Power 4.8
Ethiopia Koysha Hydroelectric Dam Energy & Power 2.8
Kenya Lamu – Lokichar Crude Oil Pipeline Energy & Power 2.1
Ethiopia Corbetti Geothermal Project Energy & Power 2.0
Rwanda Kigali Innovation City Real Estate 1.9
Ethiopia Awash – Woldia/Hara Gebeya Railway Project Transport 1.7
Source: Deloitte analysis, 2018
Top 10 projects (by value)

Africa Construction Trends Report 2018 | Regional Construction Focus
24

Africa Construction Trends Report 2018 | Regional Construction Focus: Southern Africa
25
Southern Africa2014 2015 2016 2017 2018
2018% of continental projects
Projects 119 109 85 93 103 21.4
Value (US$bn) 144.9 140 93.5 89.7 125.4 26.6
The Southern Africa region – which includes Angola, Botswana, Lesotho, Madagascar, Malawi, Mauritius, Mozambique, Namibia, South Africa, Swaziland, Zambia, and Zimbabwe – has 103 projects in total, with a total value of US$125.4bn. Southern Africa accounts for 21.4% of all projects in Africa and 26.6% in terms of US dollar value.
Overall, the number of projects in Southern Africa increased by 10.8% from 2017, while the value of projects increased by 39.8%. Notable new projects in Southern Africa include a Joint Venture ( JV) project in Angola, where a US$12bn refinery is under construction, complete with a railway line. Although Angola remains one of Africa’s largest oil producers, the country still has to import refined fuel due to a shortage of domestic refining infrastructure.
South Africa continues to account for the largest share of I&CP activity in Southern Africa with 35.9% of projects, followed by Angola with 14.6% and Mozambique with 13.6% of projects.

Africa Construction Trends Report 2018 | Regional Construction Focus: Southern Africa
26
Projects by sector 2014% 2015% 2016% 2017% 2018%
Energy & Power 44 34 25 25 11
Transport 24 27 20 23 32
Real Estate 7 7 31 29 25
Water 5 8 7 5 9
Mining 10 12 5 4 9
Oil & Gas 2 3 5 5 2
Shipping & Ports / / 7 8 10
Social Development
/ 4 / / 2
TMT 2 2 / / /
Healthcare 1 2 1 1 1
Education 1 1 / / /
Agriculture 1 / / / /
Mixed Use 3 / / / /
Other / / / / /
Source: Deloitte analysis, 2018May not total to 100% due to rounding.
Share of projects by number

Africa Construction Trends Report 2018 | Regional Construction Focus: Southern Africa
27
Projects by sector
(number of projects)
Projects by sector
(value of projects)
Transport (32.0%)
Real Estate (25.2%)
Energy & Power (10.7%) Shipping & Ports (9.7%)
Mining (8.7%) Social Development (1.9%)
Oil & Gas (1.9%)
Water (8.7%)
Energy & Power (33.8%)
Transport (16.3%)
Real Estate (27.6%)
Water (2.1%)
Oil & Gas (12.8%)
Shipping & Ports (4.8%)
Social Developemnt (0.2%)Mining (2.1%)
Healthcare (1.0%)
Healthcare (0.1%)
Source: Deloitte analysis, 2018
Source: Deloitte analysis, 2018
The Transport sector accounts for 32.0% of projects, followed by Real Estate with 25.2%. Energy & Power projects make up the third largest share at 10.7% of projects, followed by Shipping & Ports with 9.7%, and Mining and Water projects both at 8.7% respectively. However, and as in previous reports, in US dollar terms, Energy & Power projects dominate with US$42.4bn, taking into account the overspend on key energy projects particularly in South Africa.
The next largest sector by project value, Real Estate, is valued at US$34.6bn.
The Mining sector saw the greatest growth in the number of projects featured, growing 125% with five new projects added during the 2018 report period from an initially low base. Botswana is home to four of the new mining projects, including a coal mine valued at US$767m.
The number of Oil & Gas projects saw the greatest decline in terms of number of projects, from five projects in 2017 to two projects in 2018, following the completion of key projects such as the Saldanha Gas Import and Storage Terminal – the largest liquefied petroleum gas (LPG) import and
storage terminal in Africa. There were no new Healthcare projects with the sector remaining stagnant with one project. All other sectors saw a slight increase or decrease in the number of projects.
In Southern Africa, government-owned projects account for 69.9% of total projects, followed by private domestic-owned projects with 15.5% and China-owned projects at 1.9%. Six single countries (combined) own 7.8% of projects, while Australia accounts for 4.9% of projects.
Who owns?
Government (69.9%)
Private Domestic (15.5%)
Single Countries (7.8%)
Australia (4.9%)
China (1.9%)
Source: Deloitte analysis, 2018Single Countries include Canada, France, South Korea, Turkey, the UK and the US.

Africa Construction Trends Report 2018 | Regional Construction Focus: Southern Africa
28
Who funds?
Who builds?
Government (30.1%)
Private Domestic (17.5%)
China (21.4%)
Single Countries (11.7%)
International DFIs (7.8%)
African DFIs (2.9%)
Australia (4.9%)
South Africa (3.9%)
Private Domestic (40.8%)
China (30.1%)
Single Countries (14.6%)
Australia (4.9%)
South Africa (4.9%)
Portugal (4.9%)
Source: Deloitte analysis, 2018Single Countries include Canada, France, Russia, Turkey, the UK, and the US.
Source: Deloitte analysis, 2018Single Countries include Botswana, Brazil, Canada, Chile, Italy, Japan, Mauritius, Russia, South Korea, Spain, Turkey, and the US.
In line with the projects featured in 2017, governments in Southern Africa fund the greatest share of projects (30%) in the region. China funds a total of 21.4% of projects in the region, up from 8.6% in 2017. China’s increased funding is driven by a number of new, China-funded projects in Zimbabwe, Mozambique, and Zambia in the Transport, Energy & Power, as well as Real Estate sectors.
Private domestic firms fund 17.5% of projects in Southern Africa, while international DFIs and African DFIs fund similar shares as in previous years, only 7.8% and 2.9% of projects respectively. Australia-based entities fund 4.9% of projects in Southern Africa, while South African-based entities fund 3.9% of projects in Southern Africa, outside of South Africa. Various other countries fund the remaining 11.7% of featured projects.

Africa Construction Trends Report 2018 | Regional Construction Focus: Southern Africa
29
Country Project Sector US$bn
Angola Kaombo, Block 32 Oil & Gas 16.0
South Africa Kusile Power Station Energy & Power 15.2
South Africa Medupi Power Station Energy & Power 13.2
Angola Namibe Refinery Project Industrial Construction 12.0
South Africa Waterfall City Development Commercial Construction 6.8
Angola Luanda International Airport Transport 6.4
MozambiquePalma e Mocimbao da Praia Natural Gas Processing Facility Project
Industrial Construction 5.0
Angola Caculo Cabaca Hydropower Project Energy & Power 4.5
Angola Lauca Hydropower Project Energy & Power 4.3
ZimbabweBeitbridge–Harare–Chirundu Highway Dualisation
Transport 2.7
Source: Deloitte analysis, 2018
Top 10 projects (by value)
Southern Africa has seen a diverse range of organisations from all over the world participate in the construction of large projects.
Private domestic construction organisations build 40.8% of projects, while Chinese companies build 30.1%. Chinese contractors are concentrated in Mozambique, where they are constructing seven projects; Angola, where they are constructing six projects; and in Zimbabwe, where five Chinese-built projects are currently underway.
Portuguese firms continue to construct projects in Angola and Mozambique – Portugal’s former colonies – but have also continued with the construction of projects in Zambia, constructing 4.9% of projects in the Southern Africa region.
South African firms also continue to be prominent in other countries in the region, also with 4.9% of projects. South African construction firms are involved in the construction of projects in Botswana, Mozambique, and Zambia.
Australian firms are responsible for 4.9% of projects in the Southern Africa region, and companies from a number of countries are responsible for three or fewer projects (fewer than 3% of projects) each and make up the remaining 14.6% of projects.
Angola has the largest share of the top 10 projects in the region with five projects, while South Africa is home to three projects. Mozambique and Zimbabwe account for the remaining two projects, with one project in Mozambique and one project in Zimbabwe. The top 10 projects
account for 68.6% of total project value in US dollar terms in Southern Africa.
The Kaombo, Block 32 project in the Oil & Gas sector remains the largest project in the region, worth US$16bn. The Kusile Coal-Fired Power Plant in South Africa is the second largest project in Southern Africa with a price tag of US$15.2bn, followed by Medupi Power Station, a US$13.2bn project also in South Africa.
There are five new additions to the top 10 projects, with the highest-valued project being the Namibe Refinery Project in Angola, valued at US$12bn. Modderfontein City, a mixed-use development with a price tag of US$7.3bn, which was the third largest project in 2017, is no longer included in the list of featured projects after facing delays and being downgraded from initial plans.

Africa Construction Trends Report 2018 | Regional Construction Focus: Central Africa
30
Central Africa
2014 2015 2016 2017 20182018% of continental
projects
Projects 13 23 24 20 26 5.4
Value (US$bn) 33.2 35.8 7 9.8 26.9 5.7
The Central Africa region is made up of Cameroon, Central African Republic (CAR), Chad, the Democratic Republic of the Congo (DRC), Equatorial Guinea, Gabon, Congo-Brazzaville, and São Tomé and Príncipe. The region represents 5.4% of all projects in Africa and 5.7% in terms of US dollar value.
The Central Africa region is home to 26 projects worth US$26.9bn. The number of projects as well as the corresponding US dollar value represent an increase of 30% and 174.5% respectively from the previous year. Two significant mining projects in the resource-rich region, among other new projects, have added an additional US$6bn and US$4.7bn respectively in value to projects in Central Africa.
Cameroon accounts for the largest share of projects in the region with 50% of all projects, and 56.4% of projects by value. The DRC follows, accounting for 23.1% of projects and 20.2% in terms of US dollar value.

Africa Construction Trends Report 2018 | Regional Construction Focus: Central Africa
31
Projects by sector 2014% 2015% 2016% 2017% 2018%
Energy & Power 27 19 29 20 4
Transport 60 65 42 30 19
Real Estate 6 4 8 15 19
Water / 4 4 / 4
Mining 7 4 8 15 38
Oil & Gas / / / / 4
Shipping & Ports / / 4 10 4
Social Development
/ 4 4 5 /
Education / / / 5 4
Healthcare / / / / 4
Source: Deloitte analysis, 2018May not total to 100% due to rounding.
Share of projects by number

Africa Construction Trends Report 2018 | Regional Construction Focus: Central Africa
32
Projects by sector
(number of projects)
Projects by sector
(value of projects)
Energy & Power (3.8%)
Transport (19.2%)
Real Estate (19.2%)
Water (3.8%)
Mining (38.5%)
Oil & Gas (3.8%)
Shipping & Ports (3.8%)
Healthcare (3.8%)
Education (3.8%)
Energy & Power (1.8%)
Transport (4.0%)
Real Estate (10.5%)
Water (0.3%)
Oil & Gas (0.6%)
Shipping & Ports (4.4%)
Healthcare (0.2%)Mining (76.6%)
Education (1.5%)
Source: Deloitte analysis, 2018
Source: Deloitte analysis, 2018
Mining projects dominate the sectoral composition of projects in Central Africa with 38.5% of the 26 projects, representing 76.6% in US dollar terms. Central Africa remains one of the least diversified regions in Africa in terms of economic activities, maintaining a heavy reliance on natural resources and extractives.
Transport projects follow, accounting for 19.2% of projects and 4% in terms of US dollar value. The Port of Banana, a multipurpose port project in the DRC – the first deep-sea port in the country – represents a key Shipping & Ports project in the region.

Africa Construction Trends Report 2018 | Regional Construction Focus: Central Africa
33
Who owns?
Source: Deloitte analysis, 2018Single Countries include Canada, India, Mauritius and Norway.
Government (53.8%)
Single Countries (15.4%)
China (11.5%)
Australia (7.7%)
UK (7.7%)
US (3.8%)
Who funds?
China (26.9%)
Single Countries (23.1%)
Middle East (11.5%)
International DFIs (7.7%)
Private Domestic (7.7%)
UK (7.7%)
EU Countries (7.7%)
African DFIs (3.8%)
Government (3.8%)
Source: Deloitte analysis, 2018Single Countries include Australia, Canada, India, Mauritius, South Korea, and the US. Middle East includes Turkey, and the UAE.EU Countries include Italy and Norway.
Governments own 53.8% of projects in the region, with the majority of government-owned projects being in the Transport sector. The Kribi-Lolabe Double Carriage Road Project, a 38.5km long highway in Cameroon under construction by a Chinese construction firm, valued at US$456m, is one of five road infrastructure projects in the region. Investments of this nature are the result of Central African countries falling among countries with the lowest coverage of paved roads in Africa.
Foreign interests in the ownership of Central African projects are concentrated in the Mining sector, with China, Australia, the UK, the US, and Canada being significant participants.
This is in contrast to project funding, where governments in Central Africa finance only 3.8% of projects. China is the largest funder, accounting for 26.9% of projects, with an affinity for the Mining and Transport sectors of the region.
Africa Construction Trends Report 2018 | Regional Construction Focus: Central Africa
34
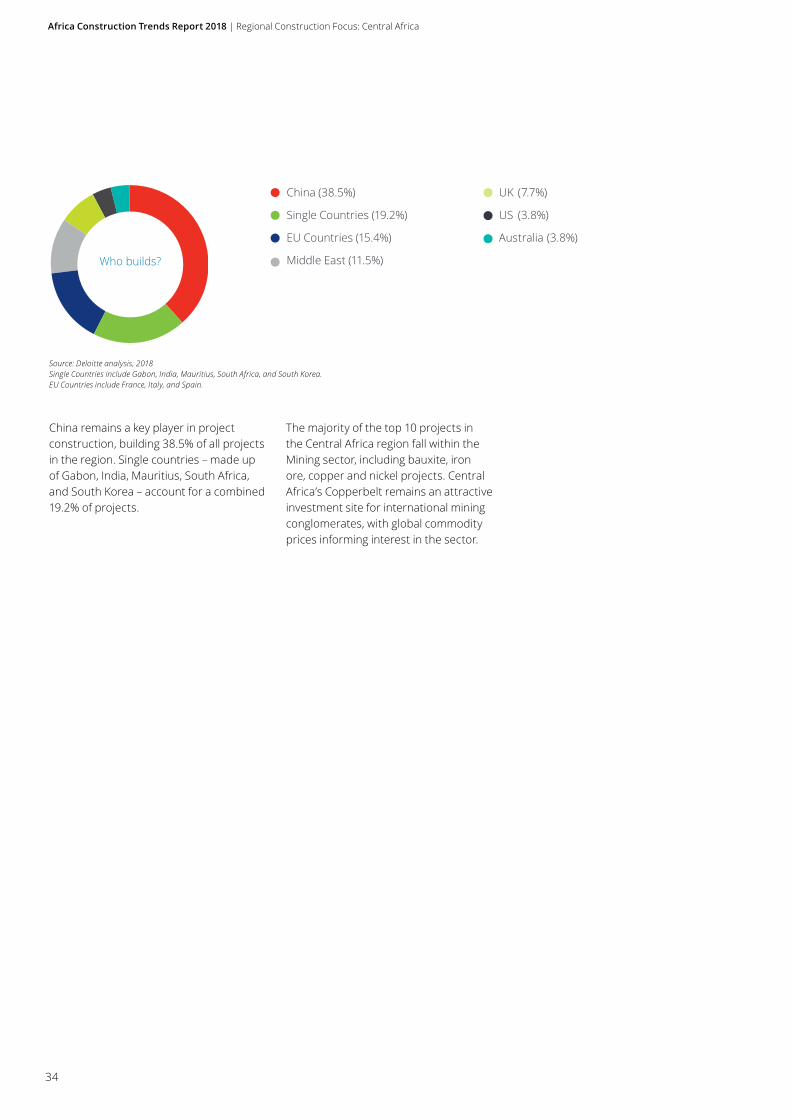
Who builds?
China (38.5%)
Single Countries (19.2%)
EU Countries (15.4%)
Middle East (11.5%)
UK (7.7%)
US (3.8%)
Australia (3.8%)
Source: Deloitte analysis, 2018Single Countries include Gabon, India, Mauritius, South Africa, and South Korea.EU Countries include France, Italy, and Spain.
China remains a key player in project construction, building 38.5% of all projects in the region. Single countries – made up of Gabon, India, Mauritius, South Africa, and South Korea – account for a combined 19.2% of projects.
The majority of the top 10 projects in the Central Africa region fall within the Mining sector, including bauxite, iron ore, copper and nickel projects. Central Africa’s Copperbelt remains an attractive investment site for international mining conglomerates, with global commodity prices informing interest in the sector.

Africa Construction Trends Report 2018 | Regional Construction Focus: Central Africa
35
Country Project Sector US$bn
Cameroon Ngaoundal & Minim-Martap Mining 6.0
Cameroon Mbalam-Nabeba Mining 4.7
Congo-Brazzaville
Zanaga Mining 4.7
DRC Kamoa-Kakula Mining 2.9
Cameroon Sonara Expansion Project Real Estate 1.3
DRC Banana Deep-water Port Shipping & Ports 1.2
Cameroon Nkamouna-Mada Mining 0.83
DRC Kolwezi Mining 0.61
Equatorial Guinea
Bioko Oil Storage Terminal Industrial Construction 0.50
Cameroon Lom Pangar Hydropower Project Energy & Power 0.49
Source: Deloitte analysis, 2018
Top 10 projects (by value)

Africa Construction Trends Report 2018 | Regional Construction Focus
36

Africa Construction Trends Report 2018 | Regional Construction Focus: West Africa
37
West Africa
2014 2015 2016 2017 20182018% of continental
projects
Projects 66 79 92 79 105 21.8%
Value (US$bn) 74.8 116.2 119.8 98.3 82.8 17.6%
West Africa has 105 projects currently underway, with a total US dollar value of US$82.8bn. The region accounts for 21.8% of all projects in Africa and 17.6% of the continent’s total project US dollar value. West Africa includes Benin, Burkina Faso, Cape Verde, Côte d’Ivoire, the Gambia, Ghana, Guinea, Guinea-Bissau, Liberia, Mali, Mauritania, Niger, Nigeria, Senegal, Sierra Leone, and Togo.
The West Africa region has experienced an increase of 32.9% in the number of projects, while the US dollar value decreased by 15.8%. This is due to the completion of some of the region’s largest projects in the last year, such as Nigeria’s US$15bn Engina Gas Field project, as well as Ghana’s US$7bn Block Offshore Integrated Oil & Gas Development Project, both of which have entered production.
Other sizeable projects which have been completed include Nigeria’s US$8.3bn Lagos-Kano Rail Project, and Ghana’s US$4bn Ada Estuary Tidal Power Plant, which has since been commissioned. These projects have a combined value of US$34.3bn.
Nigeria continues to be home to the greatest number of projects in West Africa, with 32 projects (30.5% of the regional total), valued at US$63bn (76.4% in US dollar value terms). Nigeria is followed by Ghana with 30 projects, valued at US$10bn. These two countries account for 59% of all projects in West Africa and 89.5% by value.

Africa Construction Trends Report 2018 | Regional Construction Focus: West Africa
38
Projects by sector 2014% 2015% 2016% 2017% 2018%
Energy & Power 21 23 18 13 11
Transport 29 30 34 43 50
Real Estate 8 8 22 19 17
Water 12 10 2 4 5
Mining 14 9 2 4 3
Oil & Gas / 14 3 3 1
Shipping & Ports / / 12 11 9
Social Development
/ 4 1 1 1
TMT 1 / / / /
Healthcare 3 2 3 3 4
Education / / 2 / /
Mixed Use 2 / / / /
Other 10 / / / /
Source: Deloitte analysis, 2018May not total to 100% due to rounding.
Share of projects by number

Africa Construction Trends Report 2018 | Regional Construction Focus: West Africa
39
Projects by sector
(number of projects)
Projects by sector
(value of projects)
Energy & Power (11.4%)
Transport (49.5%)
Real Estate (17.1%)
Water (4.8%)
Mining (2.9%)
Oil & Gas (1.0%)
Shipping & Ports (8.6%)
Social Development (1.0%)
Healthcare (3.8%)
Energy & Power (6.7%)
Transport (19.5%)
Real Estate (27.1%)
Water (2.1%)
Oil & Gas (19.3%)
Shipping & Ports (22.8%)
Social Development (0.1%)Mining (1.9%)
Healthcare (0.4%)
Source: Deloitte analysis, 2018
Source: Deloitte analysis, 2018
Government (82.9%)
Private Domestic (4.8%)
Single Countries (4.8%)
China (1.9%)
France (1.9%)
Nigeria (1.9%)
US (1.9%)
Who owns?
Source: Deloitte analysis, 2018Single Countries include Australia, Belgium, Canada, Macau, and Turkey.
The Transport sector continues to have the largest number of projects in West Africa, with 52 projects, representing 49.5% of total projects in the region. Projects in the Transport sector have a combined US dollar value of US$16.2bn, representing 19.5% of the region’s projects by value.
The Real Estate sector follows, accounting for 17.1% of all projects in West Africa, and 27.1% in terms of US dollar value.
Transport projects in West Africa, particularly road, bridge, and rail projects, represent a joint effort by the Economic Community of West African States (ECOWAS) to develop the movement of persons, goods, and services within the region.
Large-scale industrial construction projects in the Real Estate sector continue to keep Real Estate the most valuable sector in US dollar terms, despite the sector only accounting for 17.1% of total
projects. Nigeria’s Dangote Oil refinery, at US$12bn, is one such ongoing project that is expected to enter production in 2019.
Projects in West Africa are predominantly owned by governments, which account for 82.9% of projects in the region. Private domestic firms and single countries follow, each accounting for 4.8% of projects in the region. Of the 87 government-owned projects, 60 are in the Transport sector, with a particular concentration on road infrastructure.

Africa Construction Trends Report 2018 | Regional Construction Focus: West Africa
40
Who funds?
Who builds?
Government (26.7%)
China (21.0%)
African DFIs (14.3%)
Single Countries (8.6%)
International DFIs (8.6%)
Private Domestic (8.6%)
EU Countries (5.7%)
Consortiums (2.9%)
Brazil (1.9%)
US (1.9%)
China (27.6%)
Private Domestic (21.9%)
EU Countries (14.3%)
Single Countries (9.5%)
Brazil (5.7%)
Middle East (4.8%)
Egypt (3.8%)
Government (2.9%)
Japan (1.9%)
South Africa (1.9%)
Consortiums (1.9%)
Burkina Faso (1.9%)
US (1.9%)
Source: Deloitte analysis, 2018Single Countries include Australia, Canada, Ghana, Japan, Macau, Morocco, Nigeria, South Africa, and Turkey.EU Countries include Austria, Belgium, and France.
Source: Deloitte analysis, 2018Single Countries include Australia, Canada, Côte d’Ivoire, India, Liberia, Macau, Singapore, Tunisia, the UK, and the US.EU Countries include Belgium, Finland, France, and Italy. Middle East includes Saudi Arabia and Turkey.
Governments fund the majority of projects in the region, 26.7% of projects, followed by China at 21.0%. Of the 22 Chinese-funded projects in the West Africa region, 13 are in the Transport sector, five in Energy & Power, with the remaining four projects in other sectors.
Chinese builders dominate construction activities in the West African region with 27.6% of projects, followed by private domestic companies with 21.9% of projects. Similar to Chinese funders,
Chinese builders are heavily concentrated in the Transport sector. Nigeria’s Lagos-Badagry Expressway Expansion project is one such Chinese-built Transport project, valued at US$1.9bn. China continues to be a global leader in the construction of road, rail and highways, having the most kilometres of highway in the world within its own borders, and now projecting these capabilities overseas.
West Africa’s 10 largest projects account for 70.1% of the region’s total project value,
with seven of the 10 projects falling in the Transport and Shipping & Ports sectors.Nigeria’s OML 130 – an Oil & Gas development – is the region’s largest project by value at US$16bn, followed by Nigeria’s Olokola Deep-sea Port at US$12bn. Nine of the top 10 projects in West Africa are in Nigeria.

Africa Construction Trends Report 2018 | Regional Construction Focus: West Africa
41
Country Project Sector US$bn
Nigeria OML 130 Oil & Gas 16.0
Nigeria Olokola Deep-sea Port Shipping & Ports 12.0
Nigeria Dangote Refinery Real Estate 12.0
Nigeria Eko Atlantic Real Estate 6.0
Nigeria Calabar–Katsina–Ala Super Highway Transport 2.9
Nigeria Onne Port Complex Transport 2.7
Nigeria Lagos–Badagry Expressway Expansion Transport 1.9
Ghana Tema Port Expansion Project Transport 1.5
Nigeria Lagos–Ibadan Railway Modernisation Transport 1.5
Nigeria Lekki Deep-sea Port Transport 1.5
Source: Deloitte analysis, 2018
Top 10 projects (by value)

Africa Construction Trends Report 2018 | Regional Construction Focus: North Africa
42
North Africa
2014 2015 2016 2017 20182018% of continental
projects
Projects 8 29 42 40 109 22.6
Value (US$bn) 9.1 25.8 76.1 77.1 148.3 31.5
North Africa – made up of Algeria, Egypt, Libya, Morocco, South Sudan, Sudan, Tunisia, and Western Sahara – has 109 projects, at a total value of US$148.3bn. The region accounts for 22.6% of projects on the continent and 31.5% in terms of US dollar value.
The number of projects in North Africa increased by 172.5%, while the value of projects increased by 92.3%. Within the region, Egypt has the most projects with 46 projects, followed by Algeria with 32 projects, and then Morocco with 15 projects.

Africa Construction Trends Report 2018 | Regional Construction Focus: North Africa
43
Projects by sector 2014% 2015% 2016% 2017% 2018%
Energy & Power 75 28 10 12 16
Transport 25 41 43 28 30
Real Estate / 7 26 33 34
Water / 7 5 5 3
Mining / / / / 4
Oil & Gas / 8 12 12 3
Shipping & Ports / 3 5 10 6
Social Development / 3 / / /
Healthcare / / / / 4
Education / / / / 1
Other / 3 / / /
Source: Deloitte analysis, 2018May not total to 100% due to rounding.
Share of projects by number

Africa Construction Trends Report 2018 | Regional Construction Focus: North Africa
44
Projects by sector
(number of projects)
Projects by sector
(value of projects)
Energy & Power (15.6%)
Transport (30.3%)
Real Estate (33.9%)
Water (2.8%)
Mining (3.7%)
Oil & Gas (2.8%)
Shipping & Ports (6.4%)
Healthcare (3.7%)
Education (0.9%)
Energy & Power (32.2%)
Transport (31.1%)
Real Estate (29.2%)
Water (0.3%)
Oil & Gas (2.8%)
Shipping & Ports (2.9%)
Healthcare (0.1%)Mining (1.1%)
Education (0.4%)
Source: Deloitte analysis, 2018
Source: Deloitte analysis, 2018
Real Estate continues to make up the majority of projects, accounting for 33.9% of all projects in the North Africa region and 29.2% in terms of US dollar value. Of the 37 Real Estate projects in the region, 20 are in Egypt, with the most prominent project being Egypt’s Tahrir Petrochemical Complex – the largest petrochemical complex to be built in Egypt.
The Transport sector accounts for 30.3% of projects and a similar share (31.1%) in US dollar terms, with a number of intra-regional transport corridors in progress. The US$11.2bn Algerian East-West Highway Project is one such corridor. The six-lane toll highway is being constructed between Algeria’s borders with Morocco and Tunisia, and is considered an important road project for infrastructure interconnectivity within the region, fundamental to cross-border economic activities.
The Energy & Power sector accounts for only 15.6% of total projects in the North Africa region, but has the largest share of projects by value at 32.3%. Egypt’s El-Dabaa Nuclear Power Plant, one such Energy & Power project, is not only the largest project in the North Africa region, but also on the continent.

Africa Construction Trends Report 2018 | Regional Construction Focus: North Africa
45
Who owns?
Government (67.9%)
Private Domestic (16.5%)
Middle East (8.3%)
Single Countries (3.7%)
Australia (2.8%)
China (0.9%)
Source: Deloitte analysis, 2018Single Countries include Canada, Japan, Thailand, and the UK.The Middle East includes Bahrain, Kuwait, Qatar, and the UAE.
Who funds?
Government (36.7%)
International DFIs (17.4%)
Private Domestic (14.7%)
Middle East (8.3%)
Single Countries (4.6%)
African DFIs (4.6%)
Consortiums (4.6%)
China (3.7%)
Australia (2.8%)
EU Countries (2.8%)
Source: Deloitte analysis, 2018The Middle East includes Bahrain, Kuwait, Qatar, and the UAE.Single Countries include Canada, Russia, Thailand, the UK, and the US.EU Countries include Germany and Italy.
Governments continue to own the largest share of projects with 67.9% of projects, followed by private domestic ownership at 16.5%. Countries such as Algeria continue to limit foreign shareholding to 49% of any Algerian company, resulting in either the Algerian government or Algerian domestic private firms retaining majority ownership of joint ventures entered into with foreign investors in that market.
Governments are the largest funders of infrastructure projects in the region (36.7%). International DFIs fund 17.4% of projects, while private domestic entities fund 14.7% of projects. Infrastructure funding gaps continue to stunt project development in the region, with a number of projects experiencing delays associated with funding shortfalls.

Africa Construction Trends Report 2018 | Regional Construction Focus: North Africa
46
Who builds?
Private Domestic (32.1%)
China (12.8%)
Single Countries (9.2%)
Middle East (7.3%)
Spain (7.3%)
South Korea (7.3%)
Italy (6.4%)
Other EU Countries (6.4%)
Consortiums (5.5%)
US (3.7%)
Government (1.8%)
Source: Deloitte analysis, 2018Single Countries include Australia, Canada, Japan, Russia, Switzerland, and the UK.Middle East includes Kuwait, Qatar, Turkey, and the UAE.Other EU Countries include Belgium, France, Germany, and Greece.
Private domestic companies account for the majority of construction activities within the region, constructing 32.1% of projects. Egyptian construction companies are the most visible private domestic firms, building 25 of the 35 private domestically constructed projects in North Africa.
Chinese construction firms account for 12.8% of construction in the region, an increase from 5% last year. This comes as the relationship between the economies of North Africa and China continues to strengthen, with Egypt leading Sino-North Africa bilateral relations.
Companies from the Middle East, Spain, and South Korea each are building 7.3% of projects in North Africa, and firms from Italy are responsible for the construction of 6.4% of projects.
North Africa’s top 10 largest projects account for 60.2% of the total US dollar value of projects in the region. The top five projects are all in excess of US$10bn in value. Notably, most of the top 10 projects are concentrated in the region’s two largest economies, Egypt and Algeria, with four and five projects respectively.
The El-Dabaa Nuclear Power Plant is Egypt’s first nuclear power plant and aims to increase the country’s electricity supply in response to its growing population and expanding industrial activity.

Africa Construction Trends Report 2018 | Regional Construction Focus: North Africa
47
Country Project Sector US$bn
Egypt El-Dabaa Nuclear Power Plant Energy & Power 30.0
Algeria East-West Highway Project Transport 11.2
Egypt Tahrir Petrochemical Complex Real Estate 10.6
Algeria Hauts-Plateaux Motorway Transport 10.2
Egypt Alexandria-Cairo-Aswan High-Speed Rail Project Transport 10.0
Algeria Dounia Parc Real Estate 5.0
Egypt Mostorod Refinery Upgrade Project Real Estate 3.7
Algeria Touat Oil & Gas 3.0
Tunisia Tunis Financial Harbour Project Real Estate 3.0
Algeria Sonatrach Skikda Refinery Expansion Project Real Estate 2.6
Top 10 projects (by value)
Source: Deloitte analysis, 2018

Africa Construction Trends Report 2018 | Connecting the Dots: How Africa links to China’s Belt and Road Initiative
48

Africa Construction Trends Report 2018 | Connecting the Dots: How Africa links to China’s Belt and Road Initiative
49
Connecting the Dots: How Africa links to China’s Belt and Road InitiativeChina’s mounting engagement in Africa has become a dominant narrative in the continent’s recent economic development. China launched a “new” Africa policy at the turn of the last century, which culminated in the establishment of the Forum on China-Africa Co-operation (FOCAC). The latter is a multilateral forum within which China has been planning and implementing its foreign policy goals toward the broader continent.
Since the launch of FOCAC in October 2000, China has carefully set out and implemented three-year Africa engagement plans. These have included financing support for African I&CP (in the form of loans and investment), as well as active participation of Chinese construction firms in Africa’s infrastructure and construction sectors, making China one of the most notable and visible players in this sector in Africa to date.
BRI renews Chinese infrastructure focus in AfricaAlthough China’s interests and activities on the continent have become widely diversified over the past two decades, a renewed emphasis on infrastructure construction has been seen with the announcement of China’s Belt and Road Initiative (BRI).
The BRI was first announced by Chinese President Xi Jinping in 2013. The transcontinental development project looks to improve connectivity between Asia, Europe, and Africa, and, ultimately, increase trade, globalisation, and connectivity of economies, development, and prosperity along economic corridors.
The BRI consists of two parts. The first is the Silk Road Economic Belt, which refers to the land connection through Central Asia to Europe; second is the 21st Century Maritime Silk Road, which refers to the connection through Southeast Asia, South Asia, Africa, and, finally, Europe.
With China’s vision and leadership of linking its land neighbours in Central Asia and partners across the Indian Ocean, 105 countries and international associations have signed 123 documents under the auspices of the BRI. This includes 37 African countries and the African Union (AU), who in September 2018 at the 7th FOCAC meeting signed BRI-related MOUs.10
Over the past five years to June 2018, the trade volume between China and the BRI countries passed US$5trn, growing 1.1% annually. A total of US$70bn of FDI was made and over US$500bn worth of Engineering, Procurement and Construction (EPC) contracts were signed. More than 82 trade cooperation zones have been established, which in turn have created 244 000 jobs for host countries.

Africa Construction Trends Report 2018 | Connecting the Dots: How Africa links to China’s Belt and Road Initiative
50
Source: Lowy Institute in Deloitte Insights, 201811
China is currently undergoing a transition in its economic growth model, as well as an industrial upgrade. With the sublimation of traditional industrial focus and the shift to a higher position in the value chain, Chinese construction firms and state-owned enterprises (SOEs) now have the chance to offshore their tremendous and often excess capacity, and apply their knowledge and experienced workforce, based on years of infrastructure building in the domestic market.
This is both to the advantage of Chinese firms in their overseas projects, as well as to African economies receiving the investment and infrastructure assets. Under the BRI, Chinese firms have access to concessional loans and tax incentives for overseas investments, as well as customs-free exports of Chinese goods and machinery.
However, there has been a declining trend of outbound mergers and acquisitions (M&A) and infrastructure investment since 2017. Chinese authorities have made efforts to curb irrational investments overseas, setting stricter rules, and advising companies to make more careful investment decisions.
In a document released in August 2017, the State Council stated that overseas investments in areas including real estate, hotels, cinemas, and entertainment would be limited, while investments in sectors such as gambling would be banned. Consumer, telecom, transportation, and energy resources infrastructure are the key sectors for outbound activities.12
Russia
KazakhstanMongolia
China
Fuzhou
QuanzhouGuangzhou
BeihaiHaikou
Philippines
Indonesia
Malaysia
Kuala Lumpur
Singapore
Sri Lanka
MaldivesSeychellesTanzania
Kenya Somalia
Ethiopia
SudanChad
EgyptLibya
Saudi Arabia
Gwadar
India
Pakistan
Iran
TajikistanItaly
FranceVenice
GermanyPoland
China
Economic corridor
Silk Road Economic Belt
21st Century Maritime Silk Road
UzbekistanTurkmenistan Kyrgyzstan
Djibouti
Suez
Turkey
Regions covered by BRI

Africa Construction Trends Report 2018 | Connecting the Dots: How Africa links to China’s Belt and Road Initiative
51
Africa’s infrastructure investment gapThe infrastructure deficit in Africa and the need to develop infrastructure that provides a functional business environment is well documented. Insufficient clean water, power supply, telecommunication, roads, ports, and railways raise transaction costs and hinder countries from realising their full potential through unlocking value chains in sectors such as agriculture, mining, construction, housing, industry, and manufacturing, as well as fully leveraging their populations.
To improve those functional business environments, Africa’s funding gap is estimated at between US$67.6bn and US$107.5bn per year, with infrastructure needs of between US$130bn and US$170bn annually, according to the AfDB. Such estimates translate into the minimum
infrastructure requirements for countries to sustain the growth of their economies, population, and income level, and replace aging legacy infrastructure.13
Currently, African infrastructure is largely funded by traditional Official Development Assistance (ODA), Organization for Economic Co-operation and Development (OECD) investors, and non-OECD players including China, India, and the Gulf states, with China being by far the largest player.14
Financing from DFIs is followed by bilateral arrangements and Public Private Partnerships (PPPs). Funding commitments from DFIs usually have long time horizons and include conditions such as requiring countries to meet certain minimum environmental and civic standards.
Other financing options have been relatively limited, including from the national fiscus of African economies. The poor legal and institutional framework and immature local equity markets also challenge investors’ expectations and risk tolerance. Furthermore, finding experienced private parties who can accomplish large financing or equity investments poses a challenge.
Chinese infrastructure financing and construction in AfricaOver the past two decades, Chinese financiers have helped to bridge Africa’s infrastructure financing gap, with China estimated to be the single largest financier of African infrastructure.
Source: ICA 2017, 2018
Note: ICA refers to the Infrastructure Consortium for Africa and MDBs refers to Multilateral Development Banks.
Source 2012 2013 2014 2015 2016 Average
African governments 26.3 30.5 43.6 24.0 26.3 30.1
Donors (ICA members) 18.7 25.3 18.8 19.8 18.6 20.2
MDBs and other bilaterals 1.7 2.0 3.5 2.4 3.1 2.5
China 13.7 13.4 3.1 20.9 6.4 11.5
Arab countries 5.2 3.3 3.4 4.4 5.5 4.4
Private sector 9.5 8.8 2.9 7.4 2.6 6.2
Total 75.1 83.3 75.4 78.9 62.5 75.0
Trends in infrastructure finance in Africa, by source (US$bn)

Africa Construction Trends Report 2018 | Connecting the Dots: How Africa links to China’s Belt and Road Initiative
52
0
10
20
30
40
50
60
0
100
200
300
400
500
600
11.5%
26.9%
38.5%
5.8%
25.9%
54.7%
0.9%3.7%
12.8%
1.9%
21.4%
30.1%
1.9%
21.0%
27.6%
3.3%
18.9%
33.2%
482
105
103
109
139
26
Ownership % Funding % Building % Total projects (right y-axis)
Central Africa East Africa North Africa Southern Africa West Africa Continental
China’s Share of Regional and Continental Project Activity
Source: Deloitte analysis, 2018
China’s share of regional and continental project activity
China has participated in over 200 African infrastructure projects to date. Chinese enterprises have completed and are building projects in Africa that will help to add and upgrade about 30 000km of highways, 2 000km of railways, 85 million tonnes per year of port throughput capacity, more than nine million tonnes per day of clean water treatment capacity, about 20 000MW of power generation capacity, and more than 30 000km of transmission and transformation lines.15 Chinese financing for infrastructure projects has been mainly from two policy banks – China Exim Bank and China Development Bank. China Exim Bank has provided 67%, and China Development Bank 13% of the Chinese loans from 2000 to 2015.16
Infrastructure financing provided by China to Africa averaged US$11.5bn between 2012 and 2016, peaking at US$20.9bn in 2015, as indicated in the table above. This included a number of larger transport and energy deals. For example, Chinese lenders provided over 50% of the finance for the Mambila Hydropower Plant (Nigeria) valued at US$5.8bn. Another example is the potential Lamu Coal-Fired Power Plant (Kenya), a US$2bn PPP.17
According to the findings of our report, it is clear that China is the most visible single-country funder and builder of infrastructure projects on the continent – financing one in five and constructing one in three projects. On the finance side, the findings speak to the attractiveness of Chinese finance in a climate where
African countries are looking to alternative sources of development finance. On the construction side, the findings indicate the global appetite Chinese construction firms have for projects outside of China, as well as the available capacity to undertake them.
Most activity as tracked in this edition of our report shows a concentration of activity by Chinese financiers and builders in East Africa (54.7% of projects built and 25.9% of projects financed) and Central Africa (38.5% and 26.9% of projects built and financed respectively). Except for North Africa, one in five projects in Southern and West Africa, and one in four projects in East and Central Africa is financed by China.

Africa Construction Trends Report 2018 | Connecting the Dots: How Africa links to China’s Belt and Road Initiative
53
On average, and as part of their attractiveness, Chinese loans offer subsidised low interest rates and maturity of 15 years or more. China Exim Bank is an export credit agency, rather than a development agency. It offers loans on a bilateral basis and evaluates the concession degree on the nature of the projects. The bank’s competitive edge is that it allows countries that do not have enough financial guarantees to back their loan commitments to receive such approval by packaging their natural resources for infrastructure development: this funding model, known as the “Angola model”, has come in for serious criticism.
Other than concessional loans provided by China Exim Bank and China Development Bank, other Chinese financing sources have also emerged over the past decade. The China-Africa Development Fund (CADFund) was set up in 2007 with an initial fund size of US$5bn. In 2018, the CADFund reached US$10bn and has invested more than US$4.6bn in over 90 projects in 36 African countries, covering infrastructure, capacity
and equipment, agricultural livelihood, energy and resources development, and other sectors. Post implementation, CADFund projects are expected to boost local exports by US$5.8bn and create local tax revenue of US$1bn.18
Although Africa’s US$100bn+ financing gap may not be solely met by Chinese financing, China’s role is seen by many to be crucial. China’s commitment was reiterated in September 2018, when President Xi announced a further US$60bn funding package for Africa and exempted a portion of African debt maturing at the end of 2018. The package includes US$15bn of interest-free or concessional loans, US$20bn of credit loans, US$15bn of special loans, and US$10bn in FDI.19
Specifically mentioned was the China-Africa Infrastructure Cooperation Plan, to be co-written by China and the AU. It is considered an important milestone, since this proposal of the 6th FOCAC meeting was moving into the stage of implementation. The plan states that China will strengthen
mutually beneficial cooperation with Africa in infrastructure planning, design, construction, operation, and maintenance, and support Chinese enterprises to actively participate in the construction of railway, highway, regional aviation, port, and power and telecommunications infrastructure in Africa, so as to enhance Africa’s sustainable development capacity.
While China’s infrastructure investments on the continent have assisted a number of African states to overcome dependency on conditional foreign assistance and follow a non-interference clause, the impact of such infrastructure projects has often been questioned. However, infrastructure investments, coupled with the establishment of SEZs in a number of African countries, could encourage positive spill-overs and unlock economic potential in value-adding industries across the continent through the complementary nature of trade-facilitating infrastructure and export-orientated industrial zones.

Africa Construction Trends Report 2018 | Connecting the Dots: How Africa links to China’s Belt and Road Initiative
54
What the BRI means for Africa’s future infrastructure developmentUnder the auspices of the BRI, African countries in East and North Africa have been the largest recipients of Chinese investment to date, though countries in West and Southern Africa have also signed cooperation agreements. The Eastern African coastal region is being brought into China’s expanding sphere of commercial influence through the so-called Maritime Silk Route. This strategic maritime trade initiative connects China to Southeast Asia, South Asia, and the Arabian Peninsula, and down the east coast of Africa.
Of strategic importance to East Africa is the ongoing construction of railway lines linking the hinterland of the region to coastal ports. Major projects include the Addis Ababa-Djibouti railway, and the Nairobi-Mombasa railway, part of the greater East Africa Railway Masterplan also linking Kampala, Kigali, Bujumbura, and Juba.
The Addis Ababa-Djibouti railway, estimated to cost US$4.5bn, has cut the 759km route from three days by road to 12 hours by rail.20 The project eases logistical bottlenecks in the region, allowing Ethiopia’s manufactured exports greater access to global markets. In January 2018, Chinese Ambassador to Ethiopia, Tan Jian, stated that the project is “the first trans-boundary and longest electrified railway on the African continent. We […] see this as an early harvest project of the Belt and Road Initiative. It is regarded by many as a lifeline project for both countries, for Ethiopia and for Djibouti”.21
Almost 70% of Djibouti’s trade is related to transhipment for Ethiopia, which is expected to increase with projects including the Mekele-Tadjourah Port railway and the Doraleh Multi-Purpose Port providing greater logistics capacity and stronger transport links.22 Chinese-financed infrastructure developments will leave Djibouti in a strong position as a logistics hub for the East Africa region. Besides the port, the Djibouti multipurpose free trade zone is financed by China to support international trade. Chinese firms have also been active in the planning and rehabilitation of and investment in port infrastructure along the East African coastline. Chinese SOEs are financing and building an expansion of the port at Lamu in Kenya. The three additional berths will cost US$500m and are projected to increase the annual throughput to 23.9m tonnes in the next decade.23
In Tanzania, the US$11bn Bagamoyo port is also currently under construction, set to become the largest port in East Africa.24 Built in partnership between Tanzania, Oman, and China, the port is expected to begin operation by 2022.25 Located just 75km from Dar es Salaam, the port is to be coupled with an SEZ that aims to house export-oriented manufacturing.26
The Nairobi-Mombasa railway, which opened in June 2017 at an estimated cost of US$3.2bn, could replace the 4 000 trucks that use the road daily.27 China’s investment in East African railway projects forms part of a broader regional integration
scheme supporting the ambitions of the EAC. Beyond the Nairobi-Mombasa link, the railway is intended to be extended to Kampala, the Ugandan capital, and then south to Kigali in Rwanda.
Similarly, in North Africa, the Suez Canal corridor in Egypt has attracted Chinese investors’ attention and plans to expand to a second canal as well as new terminals at the port of Alexandria are moving forward. Extra capacity from the expansion of a second canal, including the new terminals, will help to revitalise the Egyptian economy.
Although geographically the BRI has emphasised East Africa and the Horn of Africa, greater focus on infrastructure construction under the BRI is expected to shift to West and Central Africa. For example, Senegal was lauded as the first country in West Africa to officially sign a BRI cooperation agreement with China during President Xi’s visit to that country in July 2018.28 Similarly, China Civil Engineering Construction Company (CCECC), which participated in the construction of the Addis-Djibouti railway, is involved in the new major rail lines in Nigeria; China Merchants Holdings Company, the major investor in the Djibouti port, has also invested in port holdings in Lomé, Togo and Lagos, Nigeria.29

Africa Construction Trends Report 2018 | Connecting the Dots: How Africa links to China’s Belt and Road Initiative
55
Beyond financing and construction support, the anticipated benefits of BRI projects include:
• Improved connectivity and logistics.
BRI projects and initiatives are an extension of the BRI goals and the AU’s Agenda 2063 and Programme for Infrastructure Development in Africa (PIDA), which push for greater regional integration within the continent. Thus the BRI is connecting Africa to what is becoming a multidimensional international infrastructure network, underpinned by various economic corridors of land-sea-air transportation routes. The success of the BRI projects for Africa will depend on the ability to tap into the economic corridors of BRI economies. The inland, hinterland and naval connection could boost African countries’ logistical efficiency and export capacity, making the products of African countries available at lower shipping costs and higher turnover rates.
• Promoting intra-regional and global trade.
Improving connectivity and logistics is a key function of promoting African goods and creating commodity exports, thus helping African countries to better integrate into global value chains. According to the World Bank, a reduction of trade costs of 1% is likely to increase bilateral trade between economies that participate in the BRI projects by 1.3%.30 The improvement in the capacity and network of railways and other transport infrastructure across borders could thus lead to more intra-African trade, as well as increased investment and, hence, improved growth in African economies. Regional cooperation on infrastructure improvements is needed. Unlocking Africa’s global and regional trade value chains will be linked to the rapid pace of cross-border infrastructure development, especially significant for landlocked countries looking to integrate into global trade and supply networks.
• Greater investment in BRI and non-BRI countries.
Initial research shows that the BRI transportation networks are estimated to boost FDI in Africa by 7.4%, with an increase in FDI also estimated to have the largest effect on GDP growth in the SSA region.31 Both BRI and non-BRI countries, through cross-border transportation infrastructure linkages to the hinterland and thus better access to ports in BRI countries, could realise the benefit of greater investment specifically for manufacturing sectors with a reduction in transportation costs.
• Technology and skills transfers and spill-overs.
China’s imperative to expand its industrial capacity will present opportunities for African industry and manufacturing. African leaders can leverage the capital and technical capacity that China offers to meet infrastructure needs, which in turn can attract greater foreign investment. The effects that foreign firms produce through technological spill-overs may lead to broader processes of technology transfer and economic transformation, both of which are crucial for resource and commodity-exporting economies seeking to diversify and move up the global value chain.31
• Raising the profile of specific countries for investment.
BRI-led projects carry social currency, as industrial estates and economic cooperation zones have proven in Kenya and Ethiopia. These zones have been able to raise their profile under this initiative. With Chinese companies having set up more than 56 economic cooperation zones in more than 20 countries, generating US$1.1bn of tax revenues and 180 000 jobs over the 2014-16 period, such hubs for capital and manufacturing investments may trigger broader market reforms, open up benefits for local employment, create export earnings, and stimulate growth.32
• Fast-tracking infrastructure development.
As BRI countries are favoured in terms of accessing loans from the China Exim Bank, these projects are likely to receive faster approval and execution than other infrastructure projects in Africa. The National Development and Reform Commission, responsible for China’s industrial policy, is the primary body responsible for guiding and approving overseas projects. The BRI also has its own dedicated Leading Small Group (LSG) reporting directly to President Xi.

Africa Construction Trends Report 2018 | Methodology
56
Methodology
The annual Deloitte African Construction Trends Report monitors the progress of capital-intensive infrastructure on the continent. To qualify for inclusion, infrastructure construction projects are required to be valued at over US$50 million. For this year’s edition, projects must have broken ground, but not yet been commissioned, by 1 June 2018.
The analysis of construction trends focuses on projects that are physically under construction, with construction crews on-site at the annual cut-off date. The successive annual reports track the value of construction projects underway as at 1 June of each year, so the numbers should not be read as reflecting the total value of projects constructed during a 12-month period.
In this edition, we are able to draw comparisons across five years of data, both from a continental and regional perspective, drilling down into the sectoral, project ownership, project funder, and project builder landscape.
Categorisation of regions covered in this report followed that of the AfDB. Data collected was limited to publicly available information and informed the Africa Construction Trends 2018 dataset. All graphics displayed in this report, unless otherwise indicated, are based on this dataset.
Africa Construction Trends Report 2018 | Endnotes
57
Endnotes1This is a difference in the total number of projects and is not equivalent to the number of new projects, as projects are completed and new projects are started.
2 This is a difference in the total US dollar value of projects and is not equal to the value of new projects, as projects are completed and new projects are started.
3 International Monetary Fund. (2018). World Economic Outlook. Retrieved from https://www.imf.org/external/
4 African Development Bank. (2018). African Economic Outlook 2018. Retrieved from https://www.afdb.org/en/knowledge/publications/african-economic-outlook/
5 Ibid.
6 IOL. (2018). Government’s R400bn Infrastructure Fund needs to generate revenue – IRDC. Retrieved from https://www.iol.co.za/news/politics/governments-r400bn-infrastructure-fund-needs-to-generate-revenue-irdc-17424873
7 World Bank. (2018). Open Data. Retrieved from https://data.worldbank.org/
8 Fitch Solutions. (2018). Data Tool. Retrieved from https://www.fitchsolutions.com/
9 World Bank (2018).
10 Forum on China-Africa Cooperation (FOCAC). (2018) China signs MOUs with 37 African countries, AU on B&R development. Retrieved from https://www.focac.org/eng/zfgx_4/rwjl/t1593958.htm
11 Deloitte Insights. (2018). Embracing the BRI Ecosystem in 2018: Navigating pitfalls and seizing opportunities. Retrieved from https://www2.deloitte.com/content/dam/insights/us/articles/4406_Belt-and-road-initiative/4406_Embracing-the-BRI-ecosystem.pdf
12 China State Council (2017). Circular of the Ministry of Foreign Affairs of Renmin Bank of Commerce of the National Development and Reform Commission on further guiding and standardizing the direction of overseas investment. Retrieved from http://www.gov.cn/zhengce/content/2017-08/18/content_5218665.htm
13 AfDB (2018).
14 Foster, V. (2009). Building Bridges: China’s Growing Role as Infrastructure Financier for Sub-Saharan Africa. Executive Summary. Retrieved from https://elibrary.worldbank.org/doi/abs/10.1596/978-0-8213-7554-9
15 Zhang, H. (2018). National Business Daily. Retrieved from http://www.nbd.com.cn/articles/2018-09-03/1251687.html
16 Atkins, L., Brautigam, D., Chen, Y., and Hwang, J. (2017). Online Journal. China-Africa Economic Bulletin #1: Challenges of and opportunities from the commodity price slump. CARI Economic Bulletin #1. John Hopkins University School of Advanced International Studies.
17 Chen, Y. (2018). Silk Road to the Sahel: African ambitions in China’s Belt and Road Initiative. CARI Policy Brief.
18 Li, D. (2018). . Shanghai Security News. Retrieved from http://news.cnstock.com/news,bwkx-201809-4267327.htm
19 Zhu, Y. (2018).
20 School of Advanced International Studies (SAIS). (2018). Policy Brief. Retrieved from www.sais-cari.org/
21 New China. (2018). Chinese-built Ethiopia-Djibouti railway begins commercial operations. Retrieved from www.xinhuanet.com/english/2018-01/01/c_136865306.htm
22 Chen (2018).
23 China Daily. (2017). Chinese contractor to complete first berth of Kenya’s Lamu port in mid 2018. Retrieved from www.chinadaily.com.cn/business/2017-04/07/content_28831548.htm 24 Construction Review Online. (2018). Construction of US$10bn Bagamoyo port in good progress. Retrieved from https://constructionreviewonline.com/2017/11/construction-us-10bn-bagamoyo-port-good-progress/
25 AllAfrica. (2017). Tanzania: Bagamoyo Port Project Now Revived. Retrieved from https://allafrica.com/stories/201711240835.html
26 Construction Review Online (2018).
27 Quartz Africa. (2017). Kenya’s $3.2 billion Nairobi-Mombasa rail line opens with help from China. Retrieved from https://qz.com/africa/996255/kenyas-3-2-billion-nairobi-mombasa-rail-line-opens-with-help-from-china/ 28 The Diplomat. (2018). China’s Belt and Road Makes Inroads in Africa. Retrieved from https://thediplomat.com/2018/07/chinas-belt-and-road-makes-inroads-in-africa/
29 Li (2018).
30 World Bank (2018).
31 Chen, M. X., and Lin, C. (2018). Foreign Investment across the Belt and Road: Patterns, Determinants and Effects. World Bank. Retrieved from http://documents.worldbank.org/curated/en/394671539175518256/pdf/WPS8607.pdf 32 Interact Analysis (2017). Will the Manufacturing Growth Cycle Continue in China? Part 2. Retrieved from https://www.interactanalysis.com/china-manufacturing-growth-part-2/

Africa Construction Trends Report 2018 | Contacts
58
Jean-Pierre LabuschagneEast and West Africa Infrastructure & Capital Projects LeaderDeloitte [email protected]
Victor Z LiChina Desk DirectorDeloitte AfricaWechat:zheng_li_vic
Dave van der MerweDeloitte [email protected]
Rajiv SharmaDeloitte East [email protected]
Mehdi SerghiniDeloitte Francophone [email protected]
Ellen FayorseyDeloitte West [email protected]
Temitope OdukoyaDeloitte West [email protected]
Mahendra DedasaniyaAfrica Infrastructure & Capital Projects LeaderDeloitte [email protected]
Contacts
Southern and Central Africa:
East Africa: Francophone and North Africa:
West Africa:
Lauren BaronetDeloitte [email protected]
Hannah EdingerDeloitte [email protected]
Nhlanhla NgulubeDeloitte [email protected]
Marketing: Authors:
Dr Martyn DaviesManaging Director: Emerging Markets & AfricaDeloitte [email protected]
Derek LaiGlobal Belt & Road LeaderDeloitte China [email protected]
China:
Patrick FungChina Infrastructure & Capital Project Advisory Leader Deloitte [email protected]
Johnny ZhangGlobal Chinese Services Group Partner Deloitte [email protected]

Africa Construction Trends Report 2018 | Endnotes
59

Africa Construction Trends Report 2018 | Africa Construction in Focus
60
Deloitte refers to one or more of Deloitte Touche Tohmatsu Limited, a UK private company limited by guarantee (“DTTL”), its network of member firms, and their related entities. DTTL and each of its member firms are legally separate and independent entities. DTTL (also referred to as “Deloitte Global”) does not provide services to clients. Please see www.deloitte.com/about to learn more about our global network of member firms.
Deloitte provides audit, consulting, financial advisory, risk advisory, tax and related services to public and private clients spanning multiple industries. Deloitte serves four out of five Fortune Global 500® companies through a globally connected network of member firms in more than 150 countries and territories bringing world-class capabilities, insights, and high-quality service to address clients’ most complex business challenges. To learn more about how Deloitte’s approximately 245 000 professionals make an impact that matters, please connect with us on Facebook, LinkedIn, or Twitter.
This communication contains general information only, and none of Deloitte Touche Tohmatsu Limited, its member firms, or their related entities (collectively, the “Deloitte network”) is, by means of this communication, rendering professional advice or services. Before making any decision or taking any action that may affect your finances or your business, you should consult a qualified professional adviser. No entity in the Deloitte network shall be responsible for any loss whatsoever sustained by any person who relies on this communication.
© 2018. For information, contact Deloitte Touche Tohmatsu Limited (815761/mar)


![TREATMENT GUIDE FOR CLINICIANS Gut Conditions...disease itself [1]. There are several subtypes of IBS including IBS with constipation (IBS-C), IBS with diarrhea (IBS-D), mixed (IBS-M),](https://static.fdocuments.us/doc/165x107/5f38943d280f7e4dd170e7c4/treatment-guide-for-clinicians-gut-conditions-disease-itself-1-there-are.jpg)