Deloitte Africa Construction Trends 2017 Nov 2016
56
Africa’s changing infrastructure landscape Africa Construction Trends Report 2016
-
Upload
red-fox-communications -
Category
Investor Relations
-
view
27 -
download
0
Transcript of Deloitte Africa Construction Trends 2017 Nov 2016
Africa’s changing infrastructure landscapeAfrica Construction Trends Report2016

01
Africa Construction Trends Report | Contents
Preface 3
African Construction in Focus 4
The Changing Realities Facing Africa 12
External factors affecting Africa’s growth and I&CP outlook 14
Internal factors affecting Africa’s growth and I&CP outlook 16
Regional Construction in Focus 19
East Africa 19
Southern Africa 23
Central Africa 28
West Africa 32
North Africa 37
Drying Up? A Focus on Africa’s Water Projects 41
References 48
Methodology 50
Industry Contacts & Research Team 52
Contents
Durban, South Africa
02
03
Africa Construction Trends Report | Preface
This edition of Deloitte’s Africa Construction Trends Report cumulates and compares data from the last four years, delivering insights on both a continental and regional level.
The report also examines the driving forces behind infrastructure and capital projects on the continent, looking at both external and internal drivers that are shaping the new macroeconomic and financial realities that a number of countries are facing. The data within this annual research by the firm pinpoints the trends around ownership, funding and construction of large-scale projects while also identifying the trends in the sectoral spread of projects.
Africa has seen a downturn in both the number and value of projects included this year, incontrast to previous years. Global economic headwinds, low growth and lower commodityprices have all contributed to this.
The ‘Africa rising’ story has been under pressure and the result is an uneven focus on infrastructure and capital project development. The benefits of infrastructure investment are well known and unpacked further in this report with an analysis of gross fixed capital formation. However, many governments and the low number of projects highlighted that the private sector is struggling to maintain their spending on infrastructure and capital projects. New pressure or factors such as drought, security concerns and rapid urbanisation coupled with falling government revenues is making it difficult to maintain the spending in infrastructure required by many countries.
In keeping with our trend of focusing on an issue which we believe is important, this year’s report looks at the water sector. Water plays an important role, which cuts across a number of sectors in an economy. An example of this is the water-food-energy nexus briefly addressed in this report. We feel this is especially relevant as the need for investment in this sector is far outstripping the actual investment in this sector and is a growing cause for concern in the light of the growth of mega cities in the continent and the political and social pressure that this will potentially place on governments.
Deloitte teams have advised on many of the world’s largest and most complex infrastructure and capital projects. Our teams advise clients across the lifecycle of an infrastructure asset and other large capital projects, so investors, project developers/sponsors and operators in both the public and private sectors can take every step with confidence. The unprecedented magnitude of current African infrastructure development plans and private sector growth initiatives require significant capital management skills. With a presence in 34 countries and service to 51 countries, Deloitte is well positioned and understands the nuances of doing business in Africa. Our pan-African infrastructure and capital projects (I&CP) team functions as an integrated team with dedicated professionals basedin South Africa, Zimbabwe, Kenya, Tanzania, Uganda, Ghana, Côte d’Ivoire, France, the United Arab Emirates and Nigeria, serving governments and private sector clients across the continent.
As a team we welcome your thoughts and considerations on this and future reports of this nature.
JP Labuschagne Deloitte Africa Infrastructure & Capital Projects Leader
Preface
04
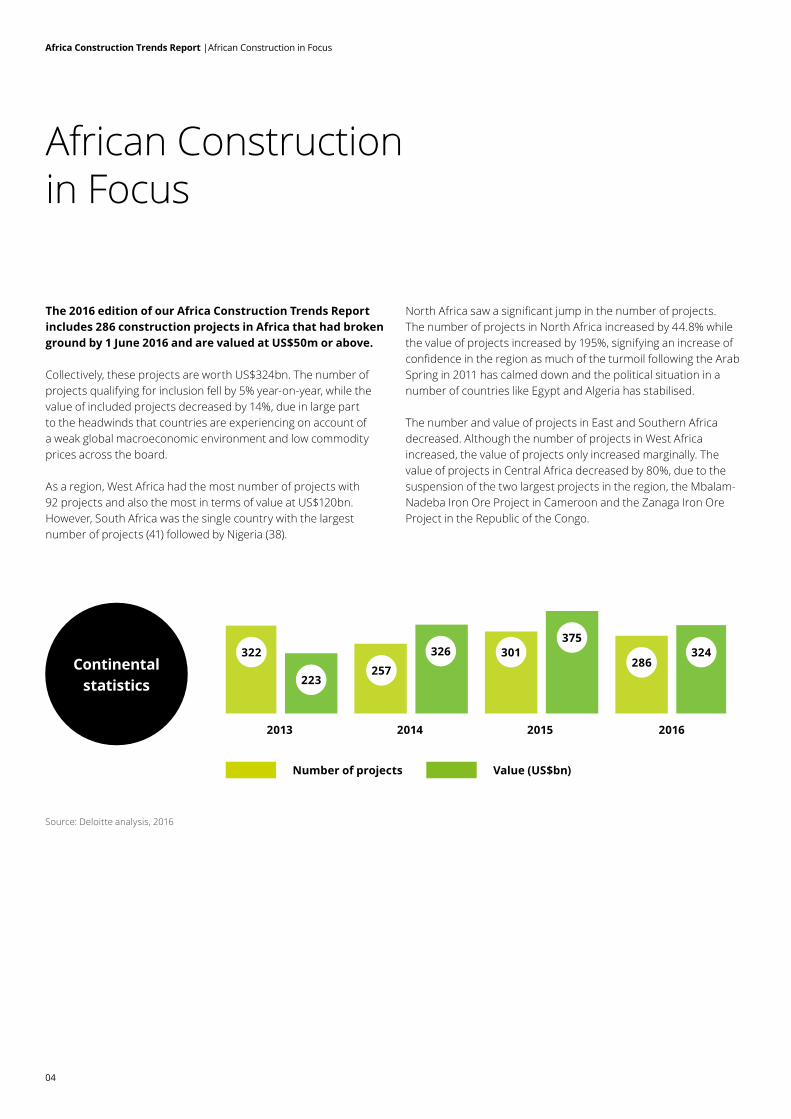
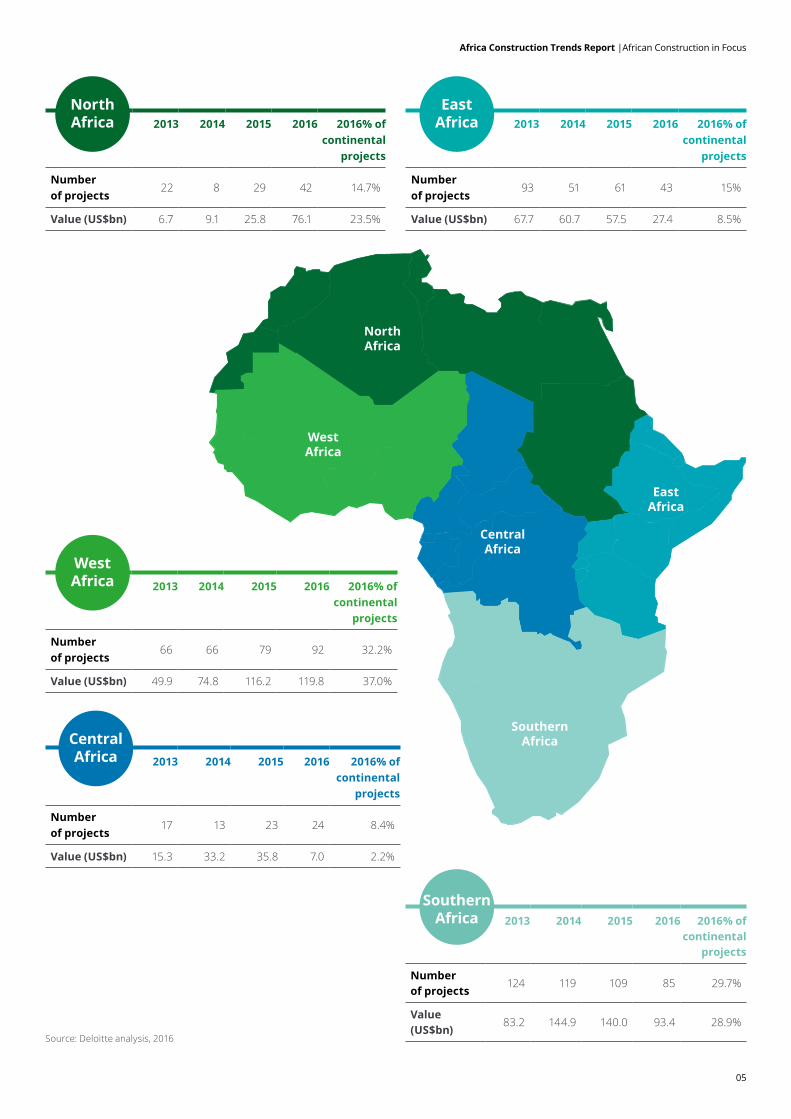
The 2016 edition of our Africa Construction Trends Report includes 286 construction projects in Africa that had broken ground by 1 June 2016 and are valued at US$50m or above.
Collectively, these projects are worth US$324bn. The number of projects qualifying for inclusion fell by 5% year-on-year, while the value of included projects decreased by 14%, due in large part to the headwinds that countries are experiencing on account of a weak global macroeconomic environment and low commodity prices across the board.
As a region, West Africa had the most number of projects with 92 projects and also the most in terms of value at US$120bn. However, South Africa was the single country with the largest number of projects (41) followed by Nigeria (38).
North Africa saw a significant jump in the number of projects. The number of projects in North Africa increased by 44.8% while the value of projects increased by 195%, signifying an increase of confidence in the region as much of the turmoil following the Arab Spring in 2011 has calmed down and the political situation in a number of countries like Egypt and Algeria has stabilised.
The number and value of projects in East and Southern Africa decreased. Although the number of projects in West Africa increased, the value of projects only increased marginally. The value of projects in Central Africa decreased by 80%, due to the suspension of the two largest projects in the region, the Mbalam-Nadeba Iron Ore Project in Cameroon and the Zanaga Iron Ore Project in the Republic of the Congo.
African Construction in Focus
322
223257
326 301375
286324
Continental statistics
2013 2014 2015 2016
Number of projects Value (US$bn)
Africa Construction Trends Report |African Construction in Focus
Source: Deloitte analysis, 2016
05
Africa Construction Trends Report |African Construction in Focus
North Africa
West Africa
Central Africa
Southern Africa
East Africa
2013 2014 2015 2016 2016% of continental
projects
Number of projects
22 8 29 42 14.7%
Value (US$bn) 6.7 9.1 25.8 76.1 23.5%
2013 2014 2015 2016 2016% of continental
projects
Number of projects
93 51 61 43 15%
Value (US$bn) 67.7 60.7 57.5 27.4 8.5%
2013 2014 2015 2016 2016% of continental
projects
Number of projects
124 119 109 85 29.7%
Value (US$bn)
83.2 144.9 140.0 93.4 28.9%
2013 2014 2015 2016 2016% of continental
projects
Number of projects
17 13 23 24 8.4%
Value (US$bn) 15.3 33.2 35.8 7.0 2.2%
2013 2014 2015 2016 2016% of continental
projects
Number of projects
66 66 79 92 32.2%
Value (US$bn) 49.9 74.8 116.2 119.8 37.0%
North Africa
West Africa
East Africa
Central Africa
Southern Africa
Source: Deloitte analysis, 2016
06
Projects by sector
Number of projects
Share of projects by number (%)
Value of projects (US$bn)
Share of projects by value (%)
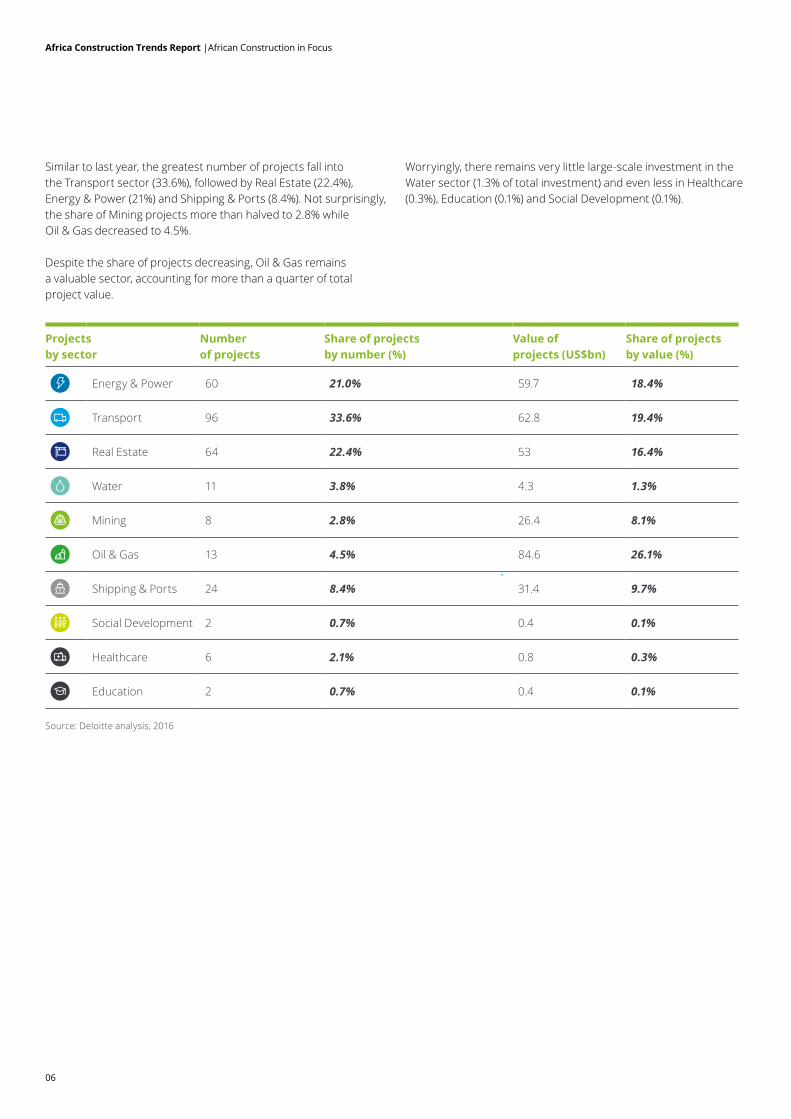
Energy & Power 60 21.0% 59.7 18.4%
Transport 96 33.6% 62.8 19.4%
Real Estate 64 22.4% 53 16.4%
Water 11 3.8% 4.3 1.3%
Mining 8 2.8% 26.4 8.1%
Oil & Gas 13 4.5% 84.6 26.1%
Shipping & Ports 24 8.4% 31.4 9.7%
Social Development 2 0.7% 0.4 0.1%
Healthcare 6 2.1% 0.8 0.3%
Education 2 0.7% 0.4 0.1%
Source: Deloitte analysis, 2016
Similar to last year, the greatest number of projects fall into the Transport sector (33.6%), followed by Real Estate (22.4%), Energy & Power (21%) and Shipping & Ports (8.4%). Not surprisingly, the share of Mining projects more than halved to 2.8% while Oil & Gas decreased to 4.5%.
Despite the share of projects decreasing, Oil & Gas remains a valuable sector, accounting for more than a quarter of total project value.
Worryingly, there remains very little large-scale investment in the Water sector (1.3% of total investment) and even less in Healthcare (0.3%), Education (0.1%) and Social Development (0.1%).
Africa Construction Trends Report |African Construction in Focus
Share of projects by sector
2013% 2014% 2015% 2016%
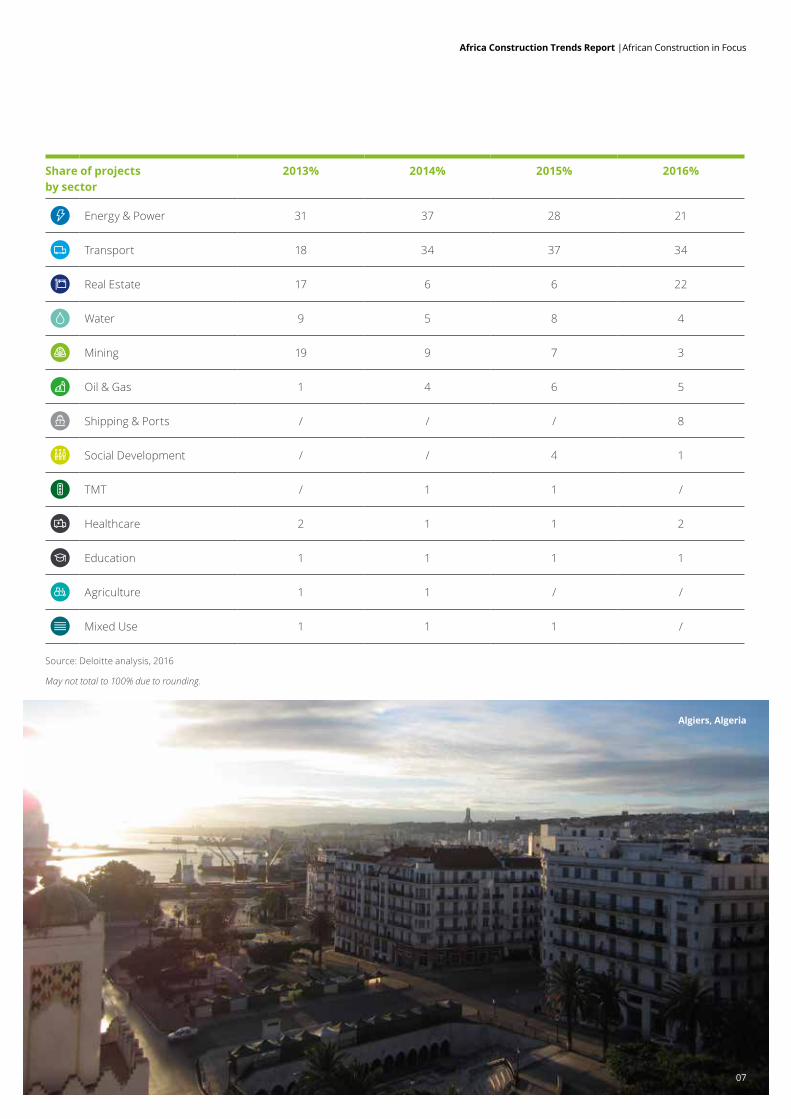
Energy & Power 31 37 28 21
Transport 18 34 37 34
Real Estate 17 6 6 22
Water 9 5 8 4
Mining 19 9 7 3
Oil & Gas 1 4 6 5
Shipping & Ports / / / 8
Social Development / / 4 1
TMT / 1 1 /
Healthcare 2 1 1 2
Education 1 1 1 1
Agriculture 1 1 / /
Mixed Use 1 1 1 /
Source: Deloitte analysis, 2016
May not total to 100% due to rounding.
Africa Construction Trends Report |African Construction in Focus
Algiers, Algeria
07
08
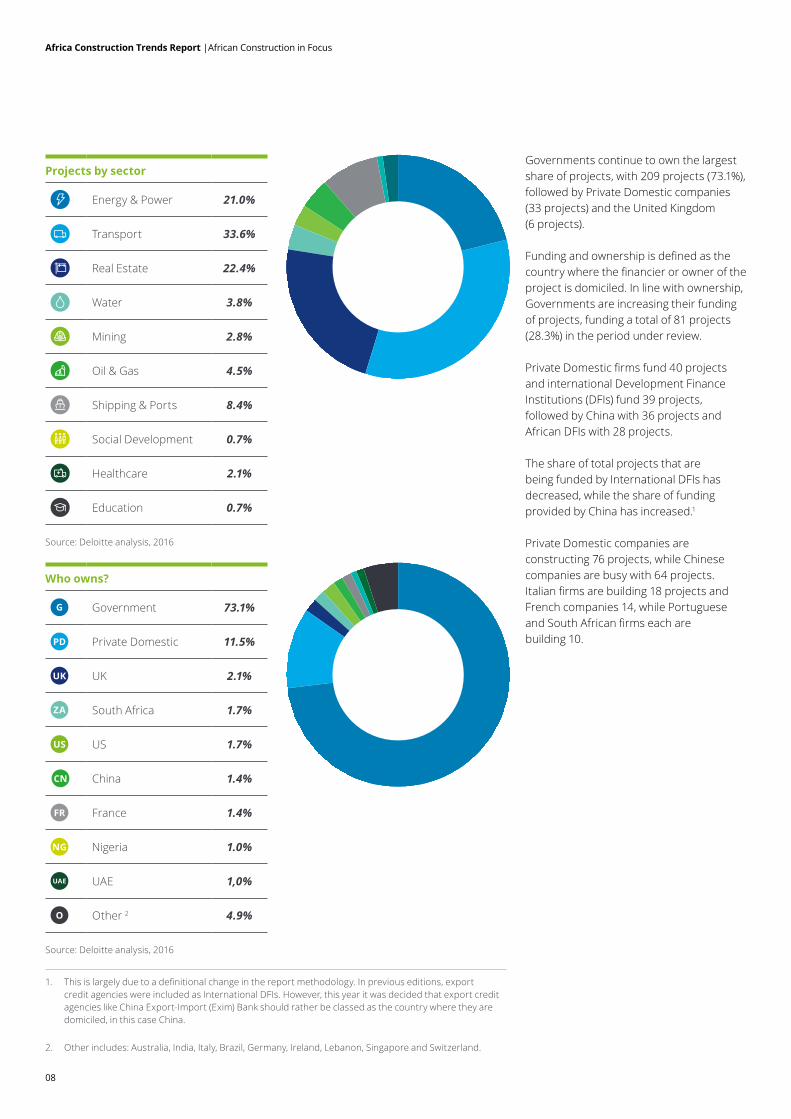
Governments continue to own the largest share of projects, with 209 projects (73.1%), followed by Private Domestic companies (33 projects) and the United Kingdom (6 projects).
Funding and ownership is defined as the country where the financier or owner of the project is domiciled. In line with ownership, Governments are increasing their funding of projects, funding a total of 81 projects (28.3%) in the period under review.
Private Domestic firms fund 40 projects and international Development Finance Institutions (DFIs) fund 39 projects, followed by China with 36 projects and African DFIs with 28 projects.
The share of total projects that are being funded by International DFIs has decreased, while the share of funding provided by China has increased.1
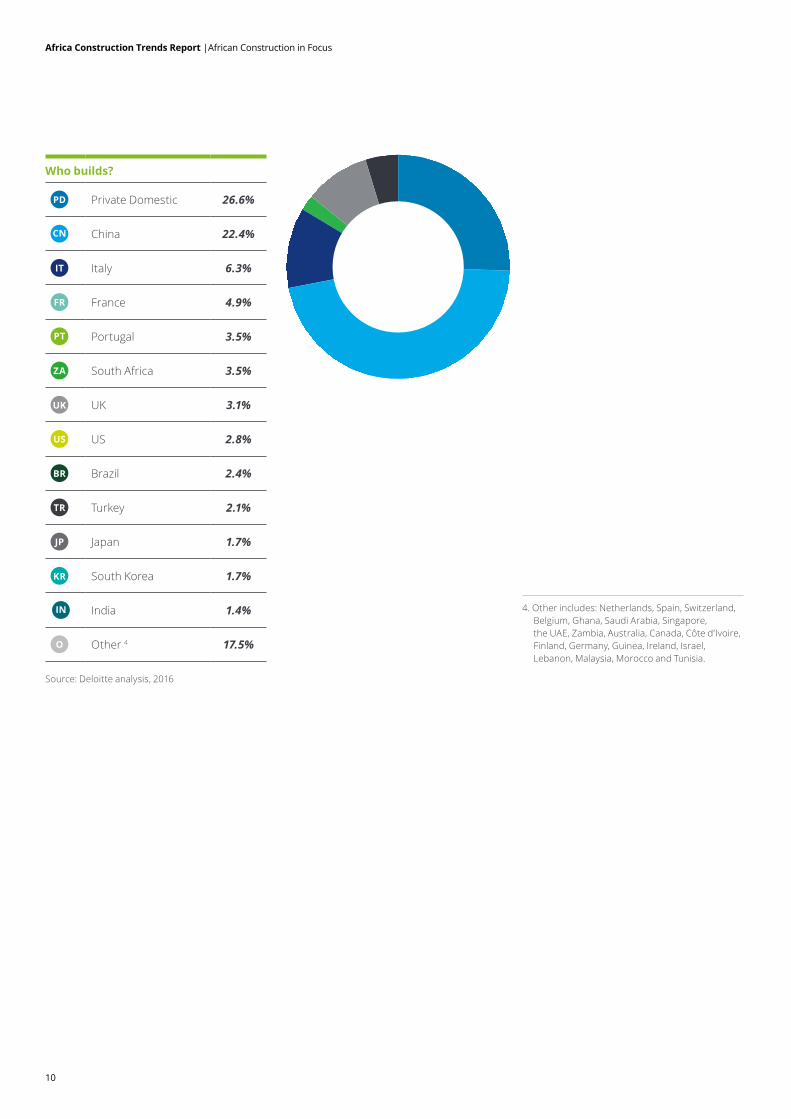
Private Domestic companies are constructing 76 projects, while Chinese companies are busy with 64 projects. Italian firms are building 18 projects and French companies 14, while Portuguese and South African firms each are building 10.
Projects by sector
Energy & Power 21.0%
Transport 33.6%
Real Estate 22.4%
Water 3.8%
Mining 2.8%
Oil & Gas 4.5%
Shipping & Ports 8.4%
Social Development 0.7%
Healthcare 2.1%
Education 0.7%
Who owns?
G Government 73.1%
PD Private Domestic 11.5%
UK UK 2.1%
ZA South Africa 1.7%
US US 1.7%
CN China 1.4%
FR France 1.4%
NG Nigeria 1.0%
UAE UAE 1,0%
O Other 2 4.9%
1. This is largely due to a definitional change in the report methodology. In previous editions, export credit agencies were included as International DFIs. However, this year it was decided that export credit agencies like China Export-Import (Exim) Bank should rather be classed as the country where they are domiciled, in this case China.
2. Other includes: Australia, India, Italy, Brazil, Germany, Ireland, Lebanon, Singapore and Switzerland.
Africa Construction Trends Report |African Construction in Focus
Source: Deloitte analysis, 2016
Source: Deloitte analysis, 2016
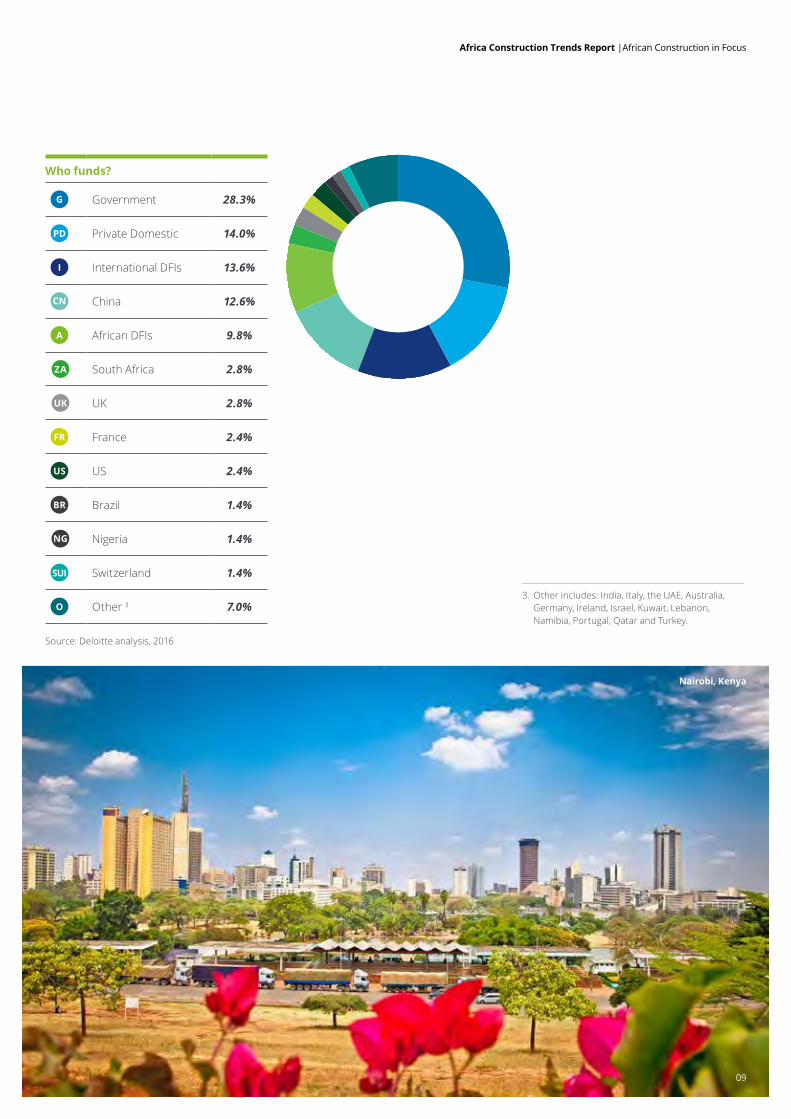
3. Other includes: India, Italy, the UAE, Australia, Germany, Ireland, Israel, Kuwait, Lebanon, Namibia, Portugal, Qatar and Turkey.
Africa Construction Trends Report |African Construction in Focus
Who funds?
G Government 28.3%
PD Private Domestic 14.0%
I International DFIs 13.6%
CN China 12.6%
A African DFIs 9.8%
ZA South Africa 2.8%
UK UK 2.8%
FR France 2.4%
US US 2.4%
BR Brazil 1.4%
NG Nigeria 1.4%
SUI Switzerland 1.4%
O Other 3 7.0%
Nairobi, Kenya
09
Source: Deloitte analysis, 2016
10
Africa Construction Trends Report |African Construction in Focus
Who builds?
PD Private Domestic 26.6%
CN China 22.4%
IT Italy 6.3%
FR France 4.9%
PT Portugal 3.5%
ZA South Africa 3.5%
UK UK 3.1%
US US 2.8%
BR Brazil 2.4%
TR Turkey 2.1%
JP Japan 1.7%
KR South Korea 1.7%
IN India 1.4%
O Other 4 17.5%
4. Other includes: Netherlands, Spain, Switzerland, Belgium, Ghana, Saudi Arabia, Singapore, the UAE, Zambia, Australia, Canada, Côte d’Ivoire, Finland, Germany, Guinea, Ireland, Israel, Lebanon, Malaysia, Morocco and Tunisia.
Source: Deloitte analysis, 2016
Proposal title goes here | Section title goes here
11
Oran, Algeria
11
12
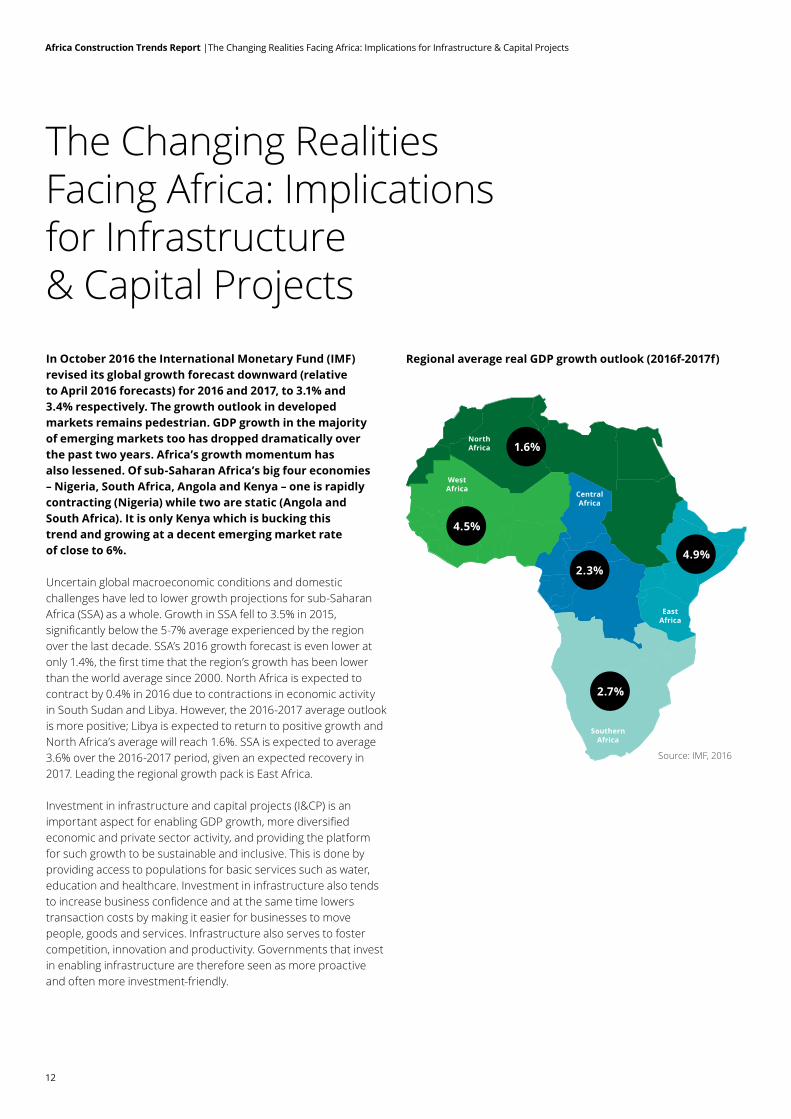
The Changing Realities Facing Africa: Implications for Infrastructure & Capital ProjectsIn October 2016 the International Monetary Fund (IMF) revised its global growth forecast downward (relative to April 2016 forecasts) for 2016 and 2017, to 3.1% and 3.4% respectively. The growth outlook in developed markets remains pedestrian. GDP growth in the majority of emerging markets too has dropped dramatically over the past two years. Africa’s growth momentum has also lessened. Of sub-Saharan Africa’s big four economies – Nigeria, South Africa, Angola and Kenya – one is rapidly contracting (Nigeria) while two are static (Angola and South Africa). It is only Kenya which is bucking this trend and growing at a decent emerging market rate of close to 6%.
Uncertain global macroeconomic conditions and domestic challenges have led to lower growth projections for sub-Saharan Africa (SSA) as a whole. Growth in SSA fell to 3.5% in 2015, significantly below the 5-7% average experienced by the region over the last decade. SSA’s 2016 growth forecast is even lower at only 1.4%, the first time that the region’s growth has been lower than the world average since 2000. North Africa is expected to contract by 0.4% in 2016 due to contractions in economic activity in South Sudan and Libya. However, the 2016-2017 average outlook is more positive; Libya is expected to return to positive growth and North Africa’s average will reach 1.6%. SSA is expected to average 3.6% over the 2016-2017 period, given an expected recovery in 2017. Leading the regional growth pack is East Africa.
Investment in infrastructure and capital projects (I&CP) is an important aspect for enabling GDP growth, more diversified economic and private sector activity, and providing the platform for such growth to be sustainable and inclusive. This is done by providing access to populations for basic services such as water, education and healthcare. Investment in infrastructure also tends to increase business confidence and at the same time lowers transaction costs by making it easier for businesses to move people, goods and services. Infrastructure also serves to foster competition, innovation and productivity. Governments that invest in enabling infrastructure are therefore seen as more proactive and often more investment-friendly.
Regional average real GDP growth outlook (2016f-2017f)
North Africa
East Africa
Southern Africa
Central Africa
West Africa
1.6%
4.5%
2.3%4.9%
2.7%
Source: IMF, 2016
Africa Construction Trends Report |The Changing Realities Facing Africa: Implications for Infrastructure & Capital Projects
13
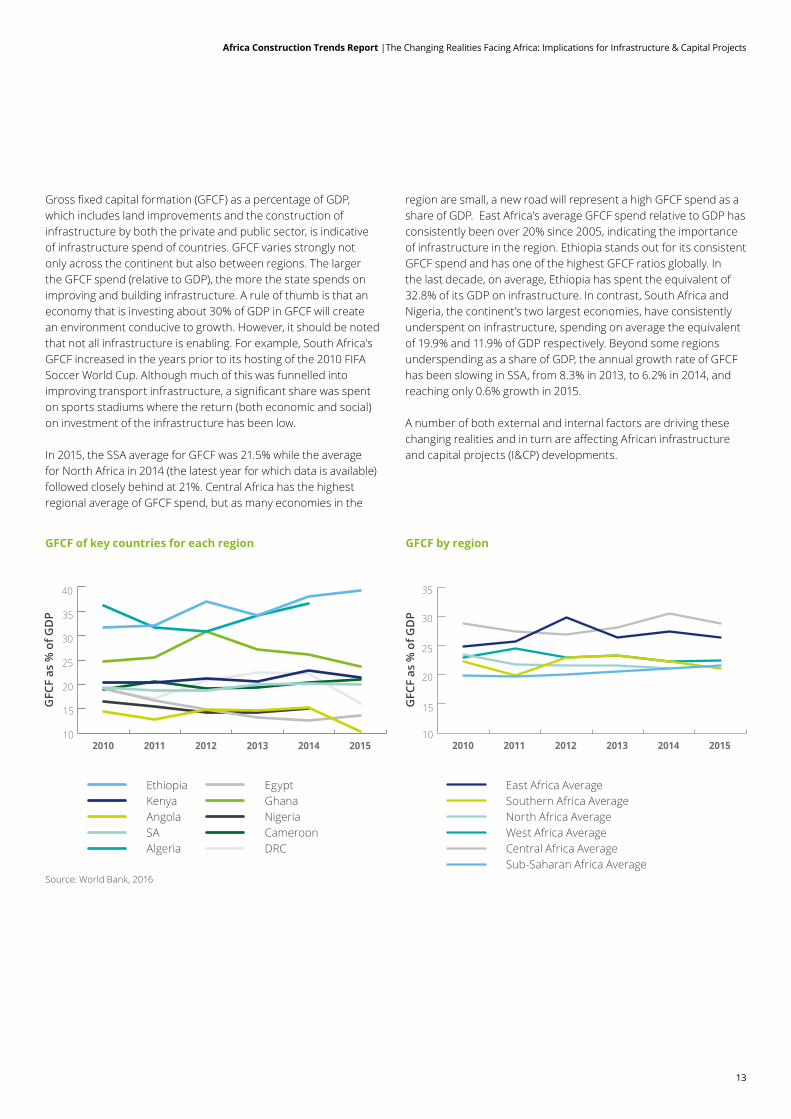
Gross fixed capital formation (GFCF) as a percentage of GDP, which includes land improvements and the construction of infrastructure by both the private and public sector, is indicative of infrastructure spend of countries. GFCF varies strongly not only across the continent but also between regions. The larger the GFCF spend (relative to GDP), the more the state spends on improving and building infrastructure. A rule of thumb is that an economy that is investing about 30% of GDP in GFCF will create an environment conducive to growth. However, it should be noted that not all infrastructure is enabling. For example, South Africa’s GFCF increased in the years prior to its hosting of the 2010 FIFA Soccer World Cup. Although much of this was funnelled into improving transport infrastructure, a significant share was spent on sports stadiums where the return (both economic and social) on investment of the infrastructure has been low.
In 2015, the SSA average for GFCF was 21.5% while the average for North Africa in 2014 (the latest year for which data is available) followed closely behind at 21%. Central Africa has the highest regional average of GFCF spend, but as many economies in the
region are small, a new road will represent a high GFCF spend as a share of GDP. East Africa’s average GFCF spend relative to GDP has consistently been over 20% since 2005, indicating the importance of infrastructure in the region. Ethiopia stands out for its consistent GFCF spend and has one of the highest GFCF ratios globally. In the last decade, on average, Ethiopia has spent the equivalent of 32.8% of its GDP on infrastructure. In contrast, South Africa and Nigeria, the continent’s two largest economies, have consistently underspent on infrastructure, spending on average the equivalent of 19.9% and 11.9% of GDP respectively. Beyond some regions underspending as a share of GDP, the annual growth rate of GFCF has been slowing in SSA, from 8.3% in 2013, to 6.2% in 2014, and reaching only 0.6% growth in 2015.
A number of both external and internal factors are driving these changing realities and in turn are affecting African infrastructure and capital projects (I&CP) developments.
GFCF by regionGFCF of key countries for each region
Ethiopia East Africa AverageEgyptKenya Southern Africa AverageGhanaAngola North Africa AverageNigeriaSA West Africa AverageCameroonAlgeria Central Africa AverageDRC
Source: World Bank, 2016
Africa Construction Trends Report |The Changing Realities Facing Africa: Implications for Infrastructure & Capital Projects
40
35
30
25
20
15
102010 2011 2012 2013 20152014 2010 2011 2012 2013 20152014
35
30
25
20
15
10
GFC
F as
% o
f GD
P
GFC
F as
% o
f GD
P
Sub-Saharan Africa Average
14
Lower commodity prices for longer detract activity from extractive and related infrastructure projects One of the biggest contributors to the slowdown in growth which has translated into slowing infrastructure spending is the decline in commodity prices over the past 24 months. In what could be argued to be a more ‘normalised price’ environment, commodity prices are expected to remain lower for longer, with some estimations that average prices will only return to pre-2013 levels by 2020.
Although high – some argue superficially high – commodity prices supported Africa’s strong growth since the 2000s. Now, African economies’ exposure to commodity price downswings has been detrimental to these countries’ overall macroeconomic landscape. The lower commodity price environment and outlook has seen investment in extractive industries decline sharply in the last 18 months, further adding to the continent’s revised economic outlook.
The commodity slump and subsequent decline in revenues has also led to a reduction in exploration activity. Mining exploration spend in Africa decreased from US$3bn in 2012 to only US$1.7bn in 2014. Low commodity prices also result in a lack of available financing for extractive projects. This has especially affected junior miners, who cannot survive without substantial funding.
As companies have delayed their investments in mines, African governments have not received the associated (often significant) tax payments from these companies. Simultaneous investment in roads, railways, power and water – all vital infrastructure critical for the growth of the sector – has also been delayed.
Africa’s largest mine (and associated infrastructure, including amongst others rail and port construction), the Simandou Iron Ore Project in Guinea, valued at US$20bn, was put on hold in July 2016. The project includes the development of the mine, a 650km railway and a deep-water port. The Zanaga Project, a privately-owned and funded US$4.7bn iron ore project in the Republic of the Congo has also been shelved due to low iron ore prices.
Oil exporting countries are among worst affected Oil exporting economies in particular have come under substantial strain. Following the oil price collapse in mid-2014, average growth for oil exporting countries – including the likes of some of the continent’s largest economies such as Nigeria and Angola – is expected to be flat in 2016, less than half of what it was the previous year. Oil price fluctuations have contributed to an income loss of almost 20% of GDP in some of these economies. The lower contribution to tax revenues has had a dampening effect on the fiscus, which has resulted in less money being available to invest in critical infrastructure projects.
Depressed forex revenues from the lower oil price, as well as supply-side challenges in countries like Nigeria, have also placed pressure on the pot of physical funds available to pay for infrastructure. This trend is already visible, with a number of projects put on hold. Sonangol, Angola’s oil company, announced in August 2016 that given Angola’s ‘new economic reality’, especially in relation to the low oil price, construction at the Lobito Refinery would be suspended.
Oil importing countries are not left unscathed and face other external challengesIn contrast, oil importers are typically seeing better economic conditions with average growth rates of 5%. Cameroon, Côte d’Ivoire, Ethiopia, Kenya, Senegal and Tanzania have seen significant growth, driven by private consumption and infrastructure investments. All six of these countries are in the top 15 countries in Africa, according to the number of projects recorded in this report. The Central African Republic is also likely to experience an uptick in economic growth due to the scaling down of conflict.
However, South Africa and Zambia – both non-energy-commodity exporters – have seen lacklustre growth in the last two years, largely the result of poor fiscal management, while Guinea, Liberia and Sierra Leone are still reeling from the Ebola epidemic.
+
Africa Construction Trends Report |The Changing Realities Facing Africa: Implications for Infrastructure & Capital Projects
External factors affecting Africa’s growth and I&CP outlook
15
Large parts of southern and eastern Africa have been crippled by the severe drought brought about by the El Niño weather phenomenon. Growth in Ethiopia, Malawi and Zimbabwe in particular has been severely affected. The drought has placed substantial pressure on the budgets and financial positions of these countries. The countries that have been the worst affected have had to resort to importing food and in some cases electricity (where water levels have been too low to generate hydroelectric power), diverting funds away from less strategic capital projects.
Countries need to manage the repricing of their economiesIn 2015, a number of African currencies depreciated significantly against the United States (US) dollar and may not recover for some time. Ghana, Uganda, Angola, Nigeria, South Africa and Zambia all experienced substantial currency depreciation. This results in infrastructure projects becoming more expensive in a short period of time. As a consequence, many large-scale, less essential infrastructure projects have been delayed or suspended given project cost inflation due to currency depreciation, including in Algeria and Cameroon.
Global demand outlook remains subduedWeaker global demand from some of Africa’s main trading partners, especially China and the European Union (EU), too has had a negative effect on growth in the region. China’s rebalancing towards a consumption and services-driven economy and its sharper economic slowdown has had a noteworthy impact on Africa.
Over the past one and a half decades, China has become increasingly important to Africa’s macroeconomic performance as the continent’s major trade partner and an important source of investment flows. As China’s demand for commodities has waned, African economies have seen lower export earnings, placing strain on their current and fiscal accounts.
The increase in uncertainty following the UK’s decision to leave the EU, financial and geopolitical troubles as well as anaemic growth in that monetary union will likely inhibit demand for Africa’s exports as well as the supply of capital and developmental aid to the continent further. Lower supply of capital and developmental aid could result in some infrastructure projects being delayed, as many countries depend heavily on these inflows.
Emergence of non-traditional external funding sourcesOfficial development assistance (ODA), in the form of grants and concessional loans, remains Africa’s largest source of public finance and is an important driver of infrastructure and capital projects on the continent. ODA to Africa was worth US$56bn in 2015 and is expected to increase to US$58bn by the end of 2016. Traditional Development Finance Institutions (DFIs) such as the World Bank, the African Development Bank (AfDB) and the European Investment Bank (EIB) thus remain important funders of Africa’s infrastructure.
International DFIs and Chinese lenders each funded a relatively equal proportion (13.1% and 13.4%) of projects in this edition of the report. Chinese lenders in the form of the Export-Import (Exim) Bank of China and the China Development Bank (CDB) continue to grow in importance in terms of the value of funding provided as well as the cross-sectoral nature of funding now emerging.
The New Development Bank, formed in 2014 by the BRICS nations (Brazil, Russia, India, China and South Africa), will likely also become an important source of funding for African infrastructure projects going forward.
$
$
Africa Construction Trends Report |The Changing Realities Facing Africa: Implications for Infrastructure & Capital Projects
16
Internal factors affecting Africa’s growth and I&CP outlook
Lower fiscal revenues impact infrastructure spendGiven Africa’s various and complex developmental challenges, governments have needed to implement public investment projects to meet the continent’s wide infrastructure gap, which the World Bank previously estimated will require almost US$90bn annually through to 2020. A number of internal growth drivers have impacted governments’ ability to implement such infrastructure projects.
Almost half of Africa’s economies are dependent on a single resource export for more than three quarters of their export revenues. African governments need to structurally change and diversify away
from being resource-driven and towards more value-added and services-orientated economies in order to thrive despite commodity price slumps.
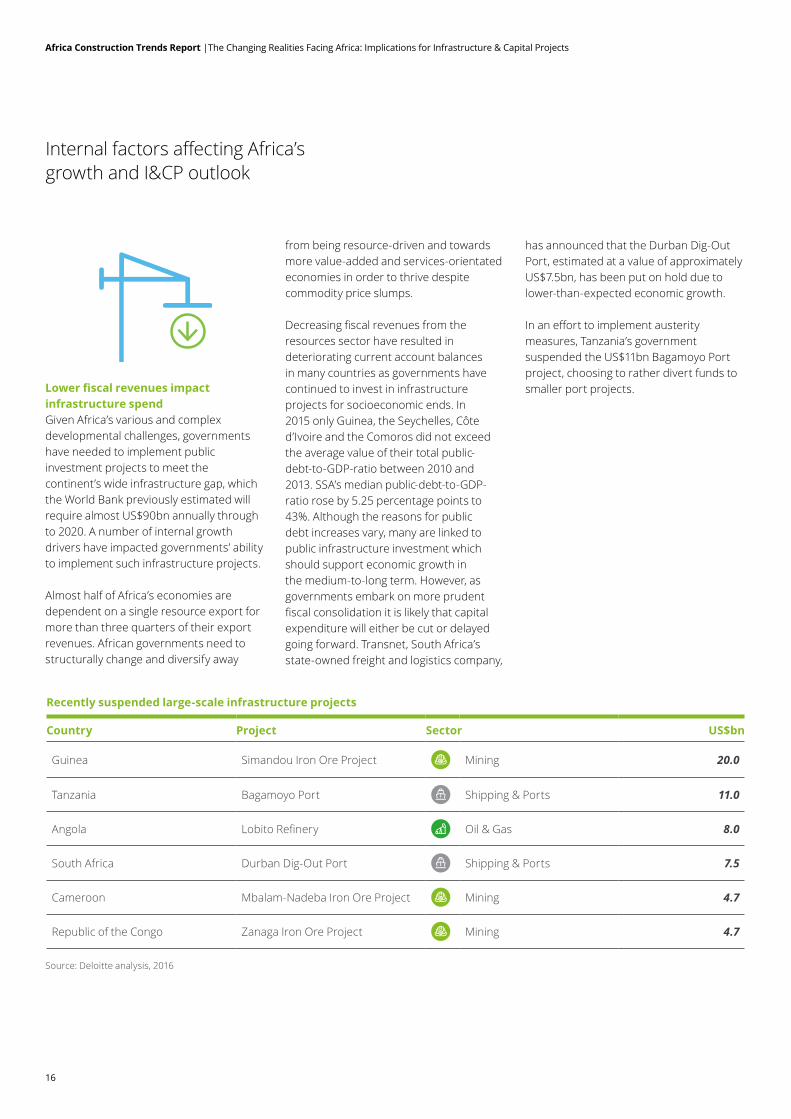
Decreasing fiscal revenues from the resources sector have resulted in deteriorating current account balances in many countries as governments have continued to invest in infrastructure projects for socioeconomic ends. In 2015 only Guinea, the Seychelles, Côte d’Ivoire and the Comoros did not exceed the average value of their total public-debt-to-GDP-ratio between 2010 and 2013. SSA’s median public-debt-to-GDP-ratio rose by 5.25 percentage points to 43%. Although the reasons for public debt increases vary, many are linked to public infrastructure investment which should support economic growth in the medium-to-long term. However, as governments embark on more prudent fiscal consolidation it is likely that capital expenditure will either be cut or delayed going forward. Transnet, South Africa’s state-owned freight and logistics company,
has announced that the Durban Dig-Out Port, estimated at a value of approximately US$7.5bn, has been put on hold due to lower-than-expected economic growth.
In an effort to implement austerity measures, Tanzania’s government suspended the US$11bn Bagamoyo Port project, choosing to rather divert funds to smaller port projects.
Recently suspended large-scale infrastructure projects
Country Project Sector US$bn
Guinea Simandou Iron Ore Project Mining 20.0
Tanzania Bagamoyo Port Shipping & Ports 11.0
Angola Lobito Refinery Oil & Gas 8.0
South Africa Durban Dig-Out Port Shipping & Ports 7.5
Cameroon Mbalam-Nadeba Iron Ore Project Mining 4.7
Republic of the Congo Zanaga Iron Ore Project Mining 4.7
Africa Construction Trends Report |The Changing Realities Facing Africa: Implications for Infrastructure & Capital Projects
Source: Deloitte analysis, 2016
17
Sovereign debt increasingly popular as a source of infrastructure financingTo continue financing infrastructure projects, a number of African countries have turned to alternative financing measures. After the global financial crisis in 2008, nearly half of all African countries issued sovereign bonds as a way of financing social and development goals after bilateral loans and grants from the EU and the US dwindled.
Eurobonds (usually denominated in US dollars) are seen as a cheaper source of alternative financing. Both Kenya and Ethiopia used funds from their Eurobond issues in 2014 (Ethiopia with US$1bn and Kenya issued US$2bn) to finance large-scale infrastructure projects, including a special economic zone (SEZ) and a railway project. The majority of Africa’s Eurobonds will reach maturity between 2021 and 2025. As a continent, Africa holds approximately US$35bn in Eurobond debt.
As African currencies have depreciated against the US dollar, the debt servicing costs of the bonds have risen rapidly in local currency terms. In addition, many African economies such as Nigeria, Mozambique and Ethiopia are suffering foreign currency shortages. If Eurobonds are invested in non-income-generating infrastructure, such as social infrastructure, sustainability of the bonds becomes threatened.
Gabon, Ghana and Rwanda have all used a portion of the proceeds from their debt issues to re-finance existing public debt. If the cost of debt rises too rapidly, many African countries may find themselves defaulting on their debts, putting future infrastructure spend at risk.
Terrorism deters investment in infrastructureThe threat of terrorist attacks has been steadily increasing in parts of Central Africa, West Africa and the Sahel. This has deterred investment in infrastructure, as these are often the target of such attacks. Furthermore, the instability caused by the threat of conflict has also scared off potential investors in some parts. Since 2014, civilians and security staff have often been the target of attacks in Burkina Faso, Côte d’Ivoire, Kenya, Mali and Nigeria.
Boko Haram has become increasingly violent in Northern Nigeria, Cameroon, Chad and Niger while the Niger Delta Avengers have attacked oil infrastructure in southern Nigeria. In Kenya and Somalia, Al-Shabaab have become more lethal, focusing on highly visible targets and as a result, intensifying both the economic and political impacts of the attacks. Uganda has decided to divert its oil pipeline through Tanzania rather than through Kenya, partly due to the threat posed by Al-Shabaab in Kenya.
In order to combat the terrorist threat, numerous governments have had to reallocate state budgets toward security and humanitarian assistance. Political instability in countries such as Ethiopia, Burundi, the DRC and Mozambique has also deterred investments across sectors.
Changing demographics will lead to a structural shift in infrastructureThese internal challenges continue to co-exist with the changing demographic profile of the continent. Investment in infrastructure will become even more important as people flock from rural areas to cities, in search of employment, education and services. Africa is already home to three megacities (defined as cities with populations of more than 10 million people): Lagos, Cairo and Kinshasa. Abidjan, Dar es Salaam, Johannesburg, Khartoum, Luanda and Nairobi are expected to become mega cities within the next ten years.
After Asia, Africa is the world’s second fastest-urbanising continent. Rapid and uncontrolled urbanisation gives rise to several challenges; governments have often not been able to provide the requisite infrastructure quickly enough. Approximately 40% of Africans live in urban centres, compared to only 14% in 1950. In only two decades, the continent’s urban population has doubled, from 240 million people in 1995 to 470 million in 2015. It is estimated that by the mid-2030s, half of the continent’s people will be living in cities, or their associated slums. Urbanisation will require significant investments in transport networks, housing, electricity supply, technological connectivity and especially the provision of water, sewerage and sanitation if these cities are to be sustainable. The provision of infrastructure to cities may be complex as it often involves multiple levels of government.
Governments have already begun investing in transport corridors both within single countries and across borders (such as the Ibadan-Lagos-Accra corridor, the Northern Corridor between Central and East Africa, and the Maputo Development Corridor) in order to connect urban centres. This structural shift in infrastructure will also contribute to the increasing importance of sectors such as real estate, which can already be seen in countries like South Africa, Egypt, Morocco and Nigeria.
$
Africa Construction Trends Report |The Changing Realities Facing Africa: Implications for Infrastructure & Capital Projects
DEBT
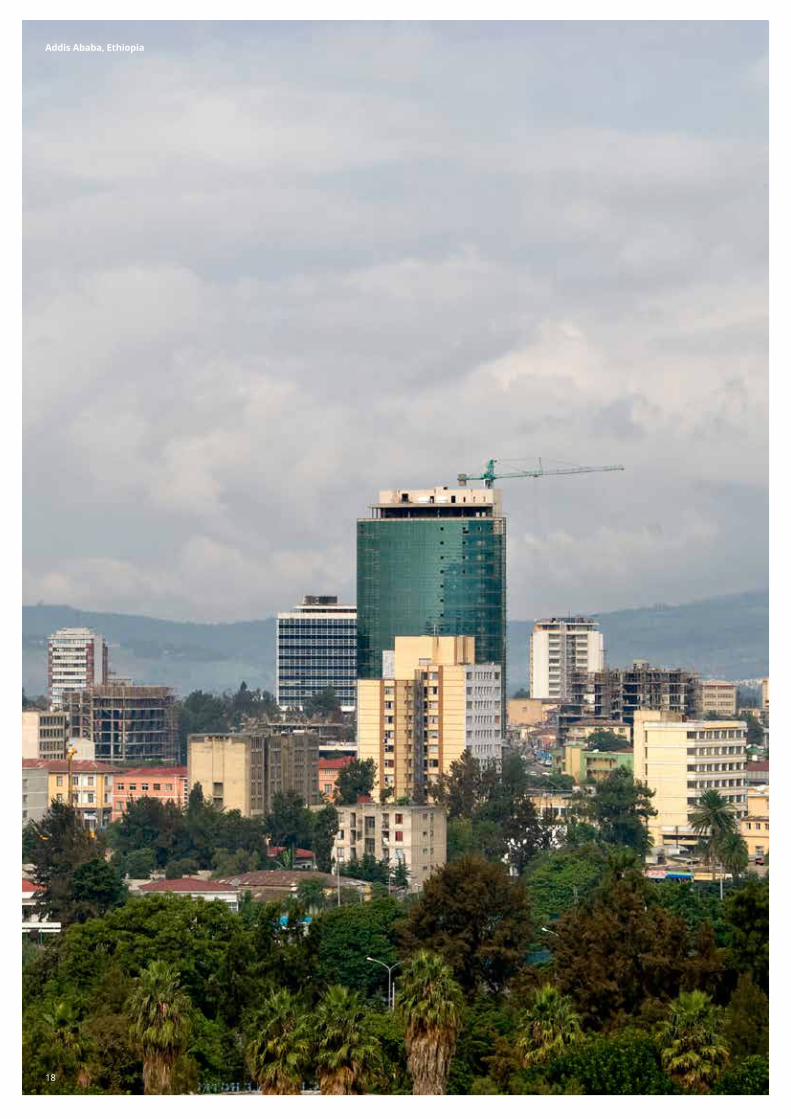
Proposal title goes here | Section title goes here Addis Ababa, Ethiopia
1818
19
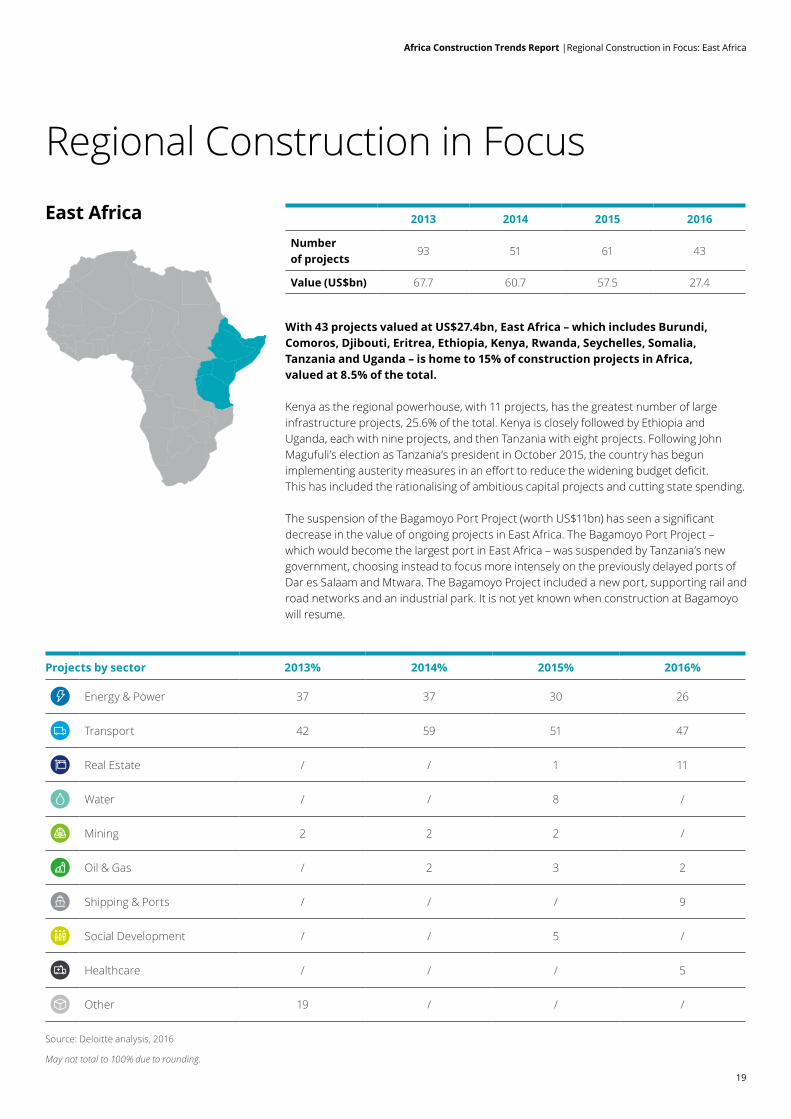
With 43 projects valued at US$27.4bn, East Africa – which includes Burundi, Comoros, Djibouti, Eritrea, Ethiopia, Kenya, Rwanda, Seychelles, Somalia, Tanzania and Uganda – is home to 15% of construction projects in Africa, valued at 8.5% of the total.
Kenya as the regional powerhouse, with 11 projects, has the greatest number of large infrastructure projects, 25.6% of the total. Kenya is closely followed by Ethiopia and Uganda, each with nine projects, and then Tanzania with eight projects. Following John Magufuli’s election as Tanzania’s president in October 2015, the country has begun implementing austerity measures in an effort to reduce the widening budget deficit. This has included the rationalising of ambitious capital projects and cutting state spending.
The suspension of the Bagamoyo Port Project (worth US$11bn) has seen a significant decrease in the value of ongoing projects in East Africa. The Bagamoyo Port Project – which would become the largest port in East Africa – was suspended by Tanzania’s new government, choosing instead to focus more intensely on the previously delayed ports of Dar es Salaam and Mtwara. The Bagamoyo Project included a new port, supporting rail and road networks and an industrial park. It is not yet known when construction at Bagamoyo will resume.
Regional Construction in FocusEast Africa
Projects by sector 2013% 2014% 2015% 2016%
Energy & Power 37 37 30 26
Transport 42 59 51 47
Real Estate / / 1 11
Water / / 8 /
Mining 2 2 2 /
Oil & Gas / 2 3 2
Shipping & Ports / / / 9
Social Development / / 5 /
Healthcare / / / 5
Other 19 / / /
Source: Deloitte analysis, 2016
May not total to 100% due to rounding.
Africa Construction Trends Report |Regional Construction in Focus: East Africa
2013 2014 2015 2016
Number of projects
93 51 61 43
Value (US$bn) 67.7 60.7 57.5 27.4
20
Who owns?
G Government 86.0%
LB Lebanon 2.3%
PD Private Domestic 2.3%
SG Singapore 2.3%
ZA South Africa 2.3%
O Other 5 4.7%
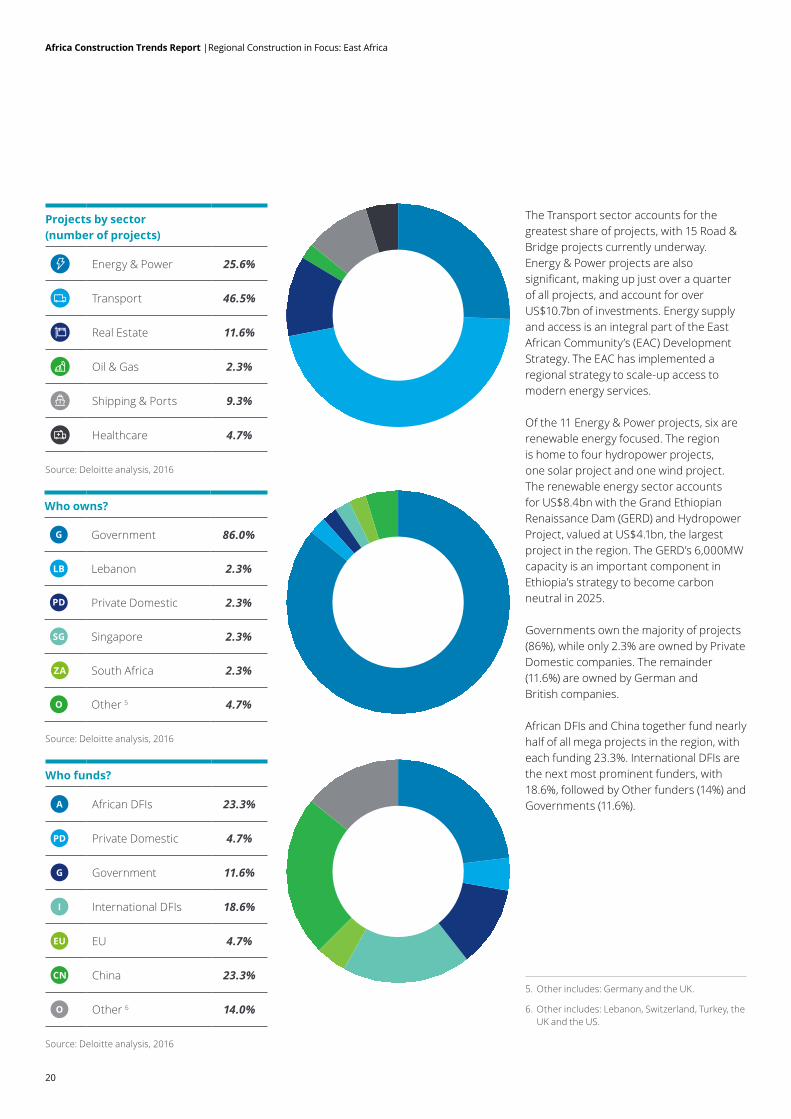
The Transport sector accounts for the greatest share of projects, with 15 Road & Bridge projects currently underway. Energy & Power projects are also significant, making up just over a quarter of all projects, and account for over US$10.7bn of investments. Energy supply and access is an integral part of the East African Community’s (EAC) Development Strategy. The EAC has implemented a regional strategy to scale-up access to modern energy services.
Of the 11 Energy & Power projects, six are renewable energy focused. The region is home to four hydropower projects, one solar project and one wind project. The renewable energy sector accounts for US$8.4bn with the Grand Ethiopian Renaissance Dam (GERD) and Hydropower Project, valued at US$4.1bn, the largest project in the region. The GERD’s 6,000MW capacity is an important component in Ethiopia’s strategy to become carbon neutral in 2025.
Governments own the majority of projects (86%), while only 2.3% are owned by Private Domestic companies. The remainder (11.6%) are owned by German and British companies.
African DFIs and China together fund nearly half of all mega projects in the region, with each funding 23.3%. International DFIs are the next most prominent funders, with 18.6%, followed by Other funders (14%) and Governments (11.6%).
Projects by sector (number of projects)
Energy & Power 25.6%
Transport 46.5%
Real Estate 11.6%
Oil & Gas 2.3%
Shipping & Ports 9.3%
Healthcare 4.7%
Africa Construction Trends Report |Regional Construction in Focus: East Africa
Who funds?
A African DFIs 23.3%
PD Private Domestic 4.7%
G Government 11.6%
I International DFIs 18.6%
EU EU 4.7%
CN China 23.3%
O Other 6 14.0%
5. Other includes: Germany and the UK.
6. Other includes: Lebanon, Switzerland, Turkey, the UK and the US.
Source: Deloitte analysis, 2016
Source: Deloitte analysis, 2016
Source: Deloitte analysis, 2016
21
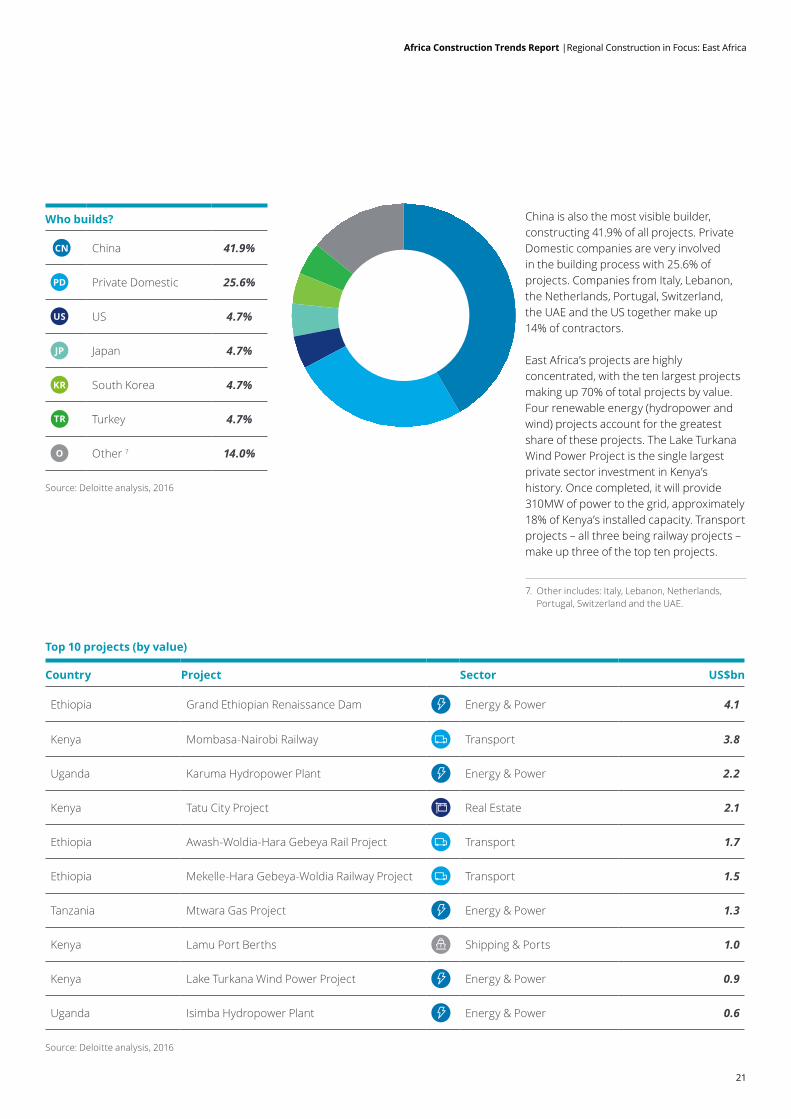
China is also the most visible builder, constructing 41.9% of all projects. Private Domestic companies are very involved in the building process with 25.6% of projects. Companies from Italy, Lebanon, the Netherlands, Portugal, Switzerland, the UAE and the US together make up 14% of contractors.
East Africa’s projects are highly concentrated, with the ten largest projects making up 70% of total projects by value. Four renewable energy (hydropower and wind) projects account for the greatest share of these projects. The Lake Turkana Wind Power Project is the single largest private sector investment in Kenya’s history. Once completed, it will provide 310MW of power to the grid, approximately 18% of Kenya’s installed capacity. Transport projects – all three being railway projects – make up three of the top ten projects.
Who builds?
CN China 41.9%
PD Private Domestic 25.6%
US US 4.7%
JP Japan 4.7%
KR South Korea 4.7%
TR Turkey 4.7%
O Other 7 14.0%
Africa Construction Trends Report |Regional Construction in Focus: East Africa
Top 10 projects (by value)
Country Project Sector US$bn
Ethiopia Grand Ethiopian Renaissance Dam Energy & Power 4.1
Kenya Mombasa-Nairobi Railway Transport 3.8
Uganda Karuma Hydropower Plant Energy & Power 2.2
Kenya Tatu City Project Real Estate 2.1
Ethiopia Awash-Woldia-Hara Gebeya Rail Project Transport 1.7
Ethiopia Mekelle-Hara Gebeya-Woldia Railway Project Transport 1.5
Tanzania Mtwara Gas Project Energy & Power 1.3
Kenya Lamu Port Berths Shipping & Ports 1.0
Kenya Lake Turkana Wind Power Project Energy & Power 0.9
Uganda Isimba Hydropower Plant Energy & Power 0.6
7. Other includes: Italy, Lebanon, Netherlands, Portugal, Switzerland and the UAE.
Source: Deloitte analysis, 2016
Source: Deloitte analysis, 2016
22
Luanda, Angola
22
23
Africa Construction Trends Report |Regional Construction in Focus: Southern Africa
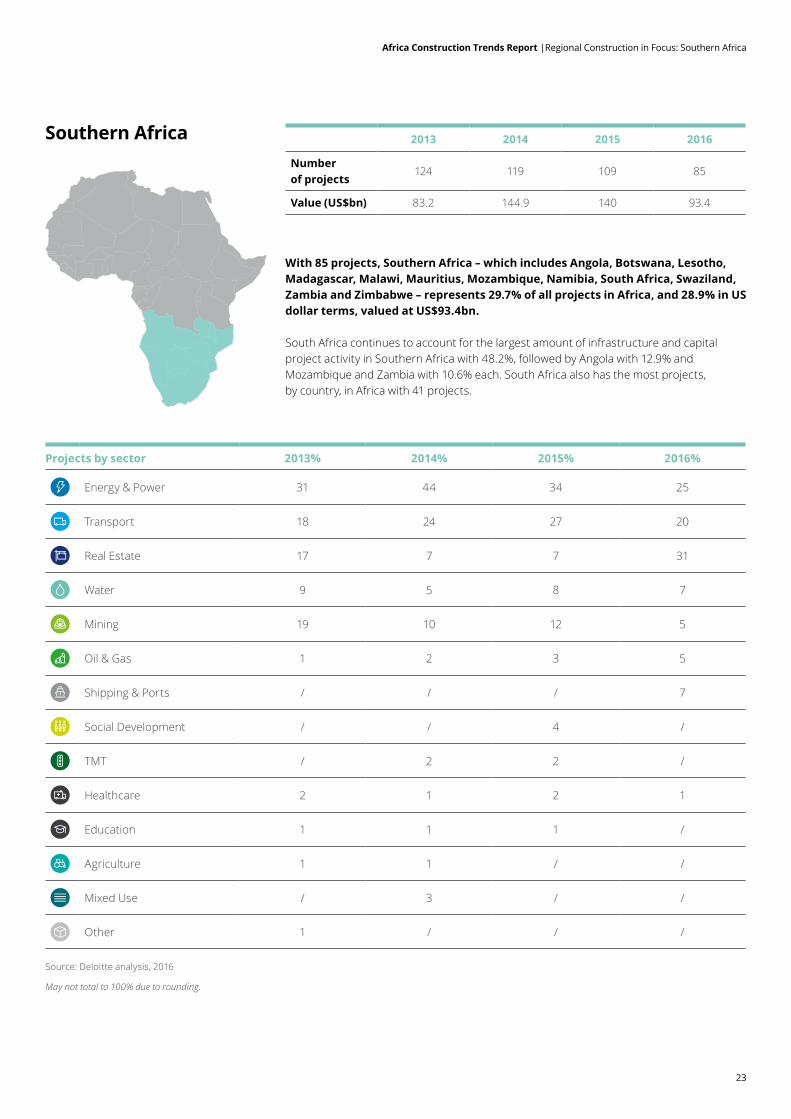
With 85 projects, Southern Africa – which includes Angola, Botswana, Lesotho, Madagascar, Malawi, Mauritius, Mozambique, Namibia, South Africa, Swaziland, Zambia and Zimbabwe – represents 29.7% of all projects in Africa, and 28.9% in US dollar terms, valued at US$93.4bn.
South Africa continues to account for the largest amount of infrastructure and capital project activity in Southern Africa with 48.2%, followed by Angola with 12.9% and Mozambique and Zambia with 10.6% each. South Africa also has the most projects, by country, in Africa with 41 projects.
Southern Africa
Projects by sector 2013% 2014% 2015% 2016%
Energy & Power 31 44 34 25
Transport 18 24 27 20
Real Estate 17 7 7 31
Water 9 5 8 7
Mining 19 10 12 5
Oil & Gas 1 2 3 5
Shipping & Ports / / / 7
Social Development / / 4 /
TMT / 2 2 /
Healthcare 2 1 2 1
Education 1 1 1 /
Agriculture 1 1 / /
Mixed Use / 3 / /
Other 1 / / /
Source: Deloitte analysis, 2016
May not total to 100% due to rounding.
2013 2014 2015 2016
Number of projects
124 119 109 85
Value (US$bn) 83.2 144.9 140 93.4
24
Africa Construction Trends Report |Regional Construction in Focus: Southern Africa
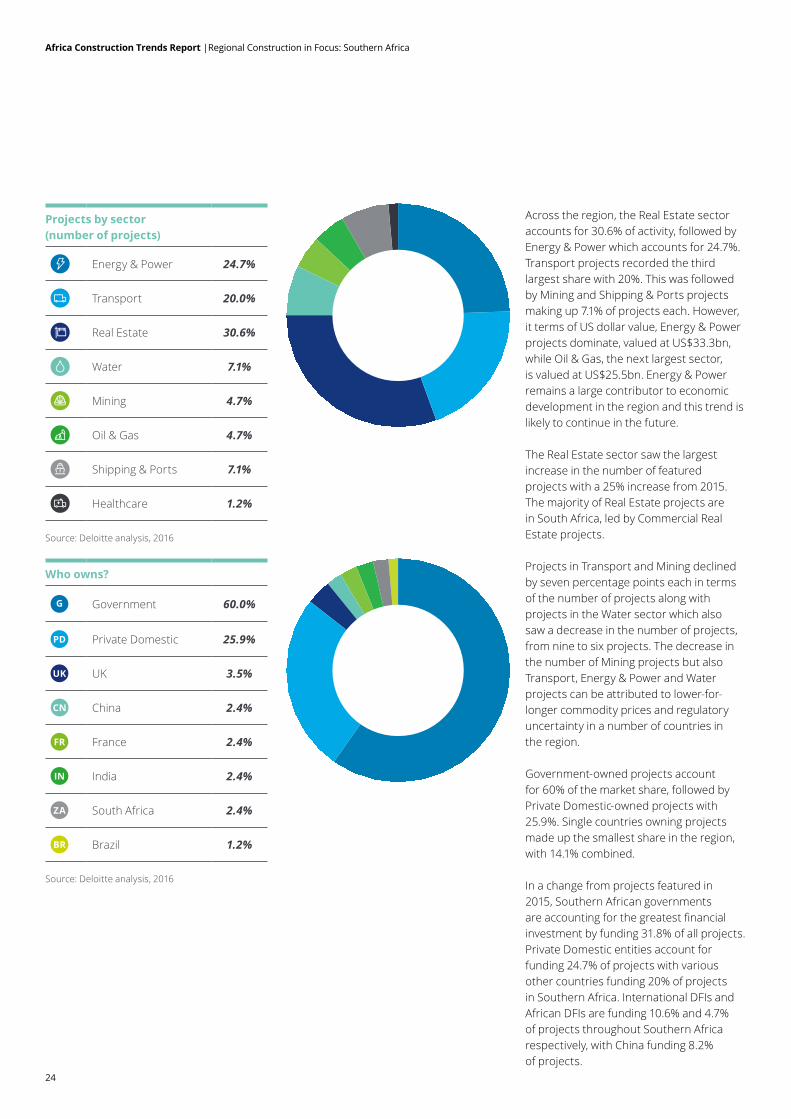
Across the region, the Real Estate sector accounts for 30.6% of activity, followed by Energy & Power which accounts for 24.7%. Transport projects recorded the third largest share with 20%. This was followed by Mining and Shipping & Ports projects making up 7.1% of projects each. However, it terms of US dollar value, Energy & Power projects dominate, valued at US$33.3bn, while Oil & Gas, the next largest sector, is valued at US$25.5bn. Energy & Power remains a large contributor to economic development in the region and this trend is likely to continue in the future.
The Real Estate sector saw the largest increase in the number of featured projects with a 25% increase from 2015. The majority of Real Estate projects are in South Africa, led by Commercial Real Estate projects.
Projects in Transport and Mining declined by seven percentage points each in terms of the number of projects along with projects in the Water sector which also saw a decrease in the number of projects, from nine to six projects. The decrease in the number of Mining projects but also Transport, Energy & Power and Water projects can be attributed to lower-for-longer commodity prices and regulatory uncertainty in a number of countries in the region.
Government-owned projects account for 60% of the market share, followed by Private Domestic-owned projects with 25.9%. Single countries owning projects made up the smallest share in the region, with 14.1% combined.
In a change from projects featured in 2015, Southern African governments are accounting for the greatest financial investment by funding 31.8% of all projects. Private Domestic entities account for funding 24.7% of projects with various other countries funding 20% of projects in Southern Africa. International DFIs and African DFIs are funding 10.6% and 4.7% of projects throughout Southern Africa respectively, with China funding 8.2% of projects.
Projects by sector (number of projects)
Energy & Power 24.7%
Transport 20.0%
Real Estate 30.6%
Water 7.1%
Mining 4.7%
Oil & Gas 4.7%
Shipping & Ports 7.1%
Healthcare 1.2%
Who owns?
G Government 60.0%
PD Private Domestic 25.9%
UK UK 3.5%
CN China 2.4%
FR France 2.4%
IN India 2.4%
ZA South Africa 2.4%
BR Brazil 1.2%
Source: Deloitte analysis, 2016
Source: Deloitte analysis, 2016
25
Africa Construction Trends Report |Regional Construction in Focus: Southern Africa
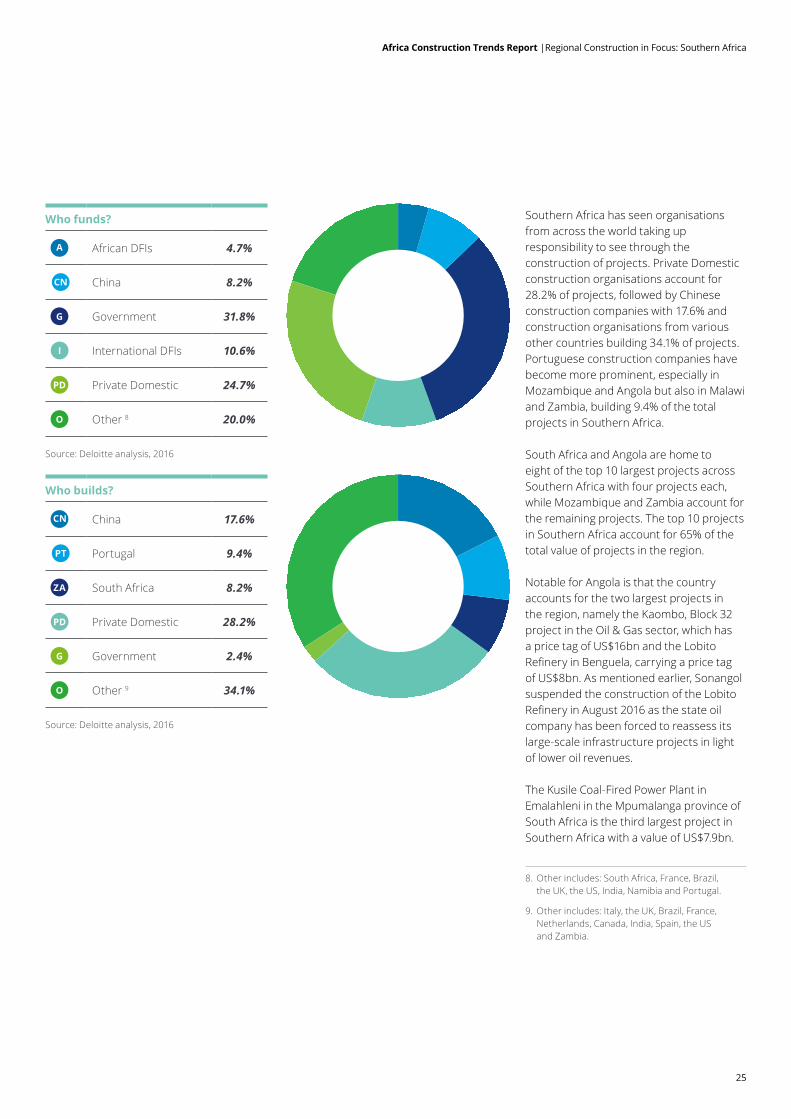
Who funds?
A African DFIs 4.7%
CN China 8.2%
G Government 31.8%
I International DFIs 10.6%
PD Private Domestic 24.7%
O Other 8 20.0%
Southern Africa has seen organisations from across the world taking up responsibility to see through the construction of projects. Private Domestic construction organisations account for 28.2% of projects, followed by Chinese construction companies with 17.6% and construction organisations from various other countries building 34.1% of projects. Portuguese construction companies have become more prominent, especially in Mozambique and Angola but also in Malawi and Zambia, building 9.4% of the total projects in Southern Africa.
South Africa and Angola are home to eight of the top 10 largest projects across Southern Africa with four projects each, while Mozambique and Zambia account for the remaining projects. The top 10 projects in Southern Africa account for 65% of the total value of projects in the region.
Notable for Angola is that the country accounts for the two largest projects in the region, namely the Kaombo, Block 32 project in the Oil & Gas sector, which has a price tag of US$16bn and the Lobito Refinery in Benguela, carrying a price tag of US$8bn. As mentioned earlier, Sonangol suspended the construction of the Lobito Refinery in August 2016 as the state oil company has been forced to reassess its large-scale infrastructure projects in light of lower oil revenues.
The Kusile Coal-Fired Power Plant in Emalahleni in the Mpumalanga province of South Africa is the third largest project in Southern Africa with a value of US$7.9bn.
Who builds?
CN China 17.6%
PT Portugal 9.4%
ZA South Africa 8.2%
PD Private Domestic 28.2%
G Government 2.4%
O Other 9 34.1%
8. Other includes: South Africa, France, Brazil, the UK, the US, India, Namibia and Portugal.
9. Other includes: Italy, the UK, Brazil, France, Netherlands, Canada, India, Spain, the US and Zambia.
Source: Deloitte analysis, 2016
Source: Deloitte analysis, 2016
26
Africa Construction Trends Report |Regional Construction in Focus: Southern Africa
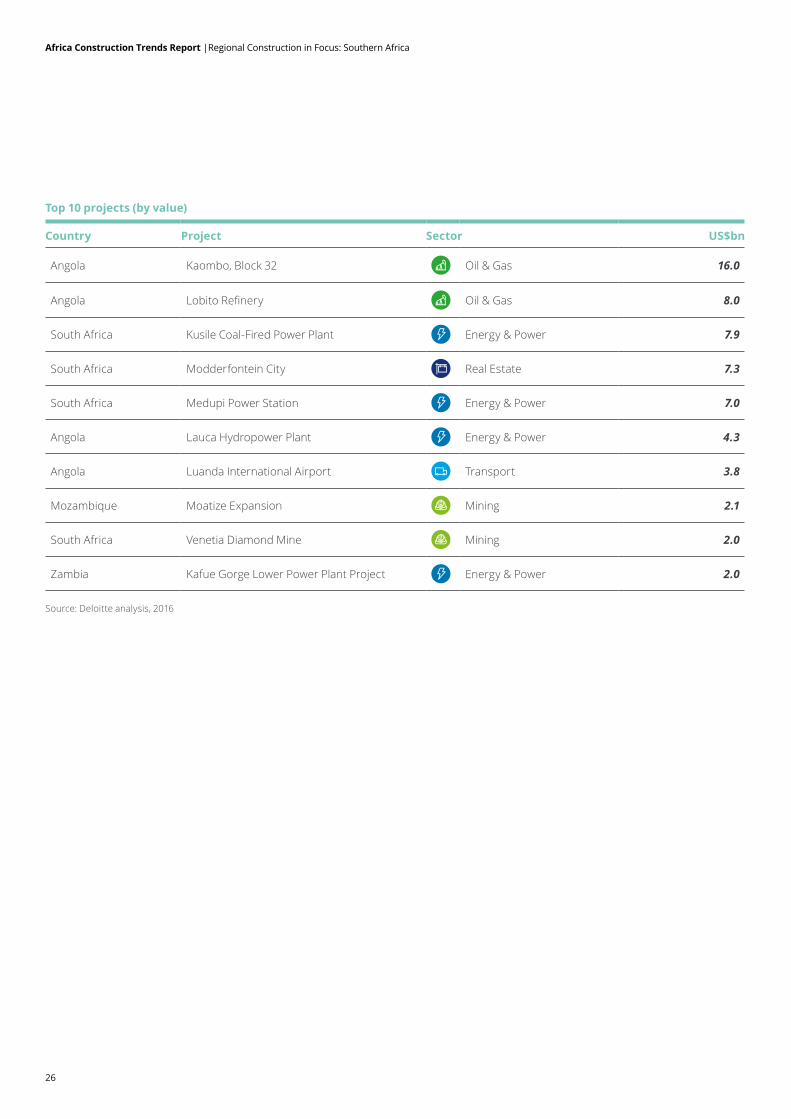
Top 10 projects (by value)
Country Project Sector US$bn
Angola Kaombo, Block 32 Oil & Gas 16.0
Angola Lobito Refinery Oil & Gas 8.0
South Africa Kusile Coal-Fired Power Plant Energy & Power 7.9
South Africa Modderfontein City Real Estate 7.3
South Africa Medupi Power Station Energy & Power 7.0
Angola Lauca Hydropower Plant Energy & Power 4.3
Angola Luanda International Airport Transport 3.8
Mozambique Moatize Expansion Mining 2.1
South Africa Venetia Diamond Mine Mining 2.0
Zambia Kafue Gorge Lower Power Plant Project Energy & Power 2.0
Source: Deloitte analysis, 2016
Proposal title goes here | Section title goes here Kinshasa, DRC
27
28
Africa Construction Trends Report |Regional Construction in Focus: Central Africa
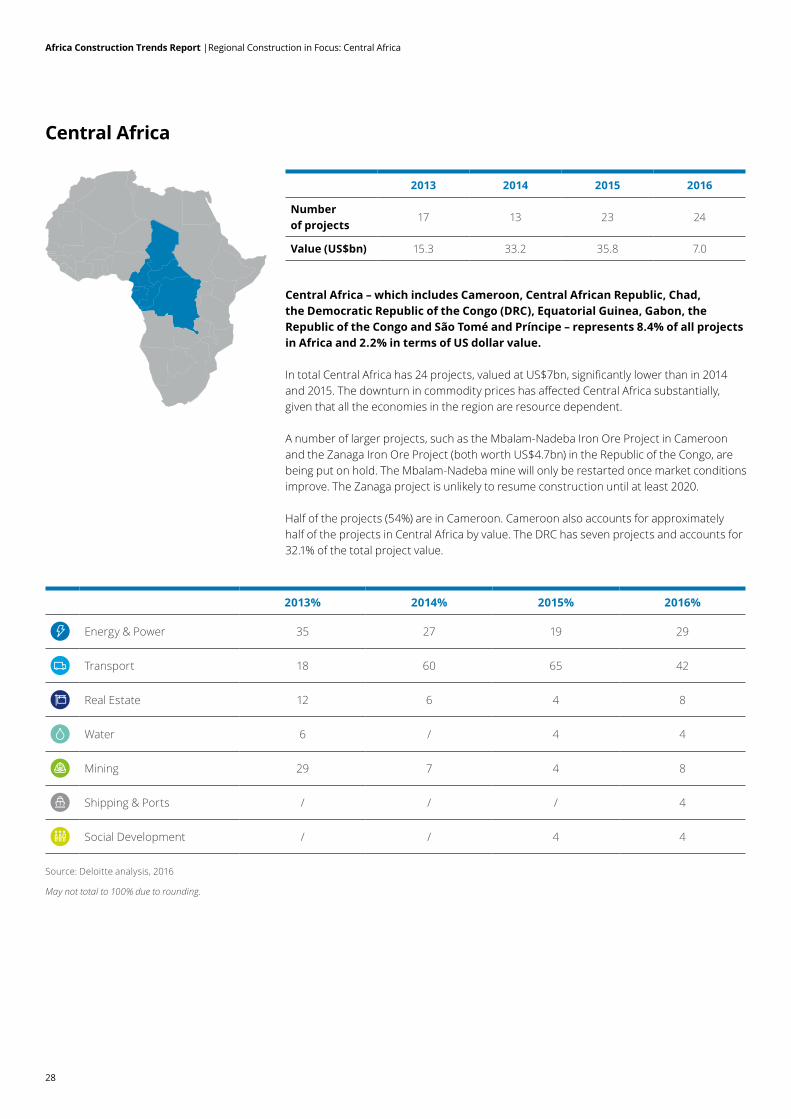
Central Africa – which includes Cameroon, Central African Republic, Chad, the Democratic Republic of the Congo (DRC), Equatorial Guinea, Gabon, the Republic of the Congo and São Tomé and Príncipe – represents 8.4% of all projects in Africa and 2.2% in terms of US dollar value.
In total Central Africa has 24 projects, valued at US$7bn, significantly lower than in 2014 and 2015. The downturn in commodity prices has affected Central Africa substantially, given that all the economies in the region are resource dependent.
A number of larger projects, such as the Mbalam-Nadeba Iron Ore Project in Cameroon and the Zanaga Iron Ore Project (both worth US$4.7bn) in the Republic of the Congo, are being put on hold. The Mbalam-Nadeba mine will only be restarted once market conditions improve. The Zanaga project is unlikely to resume construction until at least 2020.
Half of the projects (54%) are in Cameroon. Cameroon also accounts for approximately half of the projects in Central Africa by value. The DRC has seven projects and accounts for 32.1% of the total project value.
Central Africa
2013% 2014% 2015% 2016%
Energy & Power 35 27 19 29
Transport 18 60 65 42
Real Estate 12 6 4 8
Water 6 / 4 4
Mining 29 7 4 8
Shipping & Ports / / / 4
Social Development / / 4 4
Source: Deloitte analysis, 2016
May not total to 100% due to rounding.
2013 2014 2015 2016
Number of projects
17 13 23 24
Value (US$bn) 15.3 33.2 35.8 7.0
29
Africa Construction Trends Report |Regional Construction in Focus: Central Africa
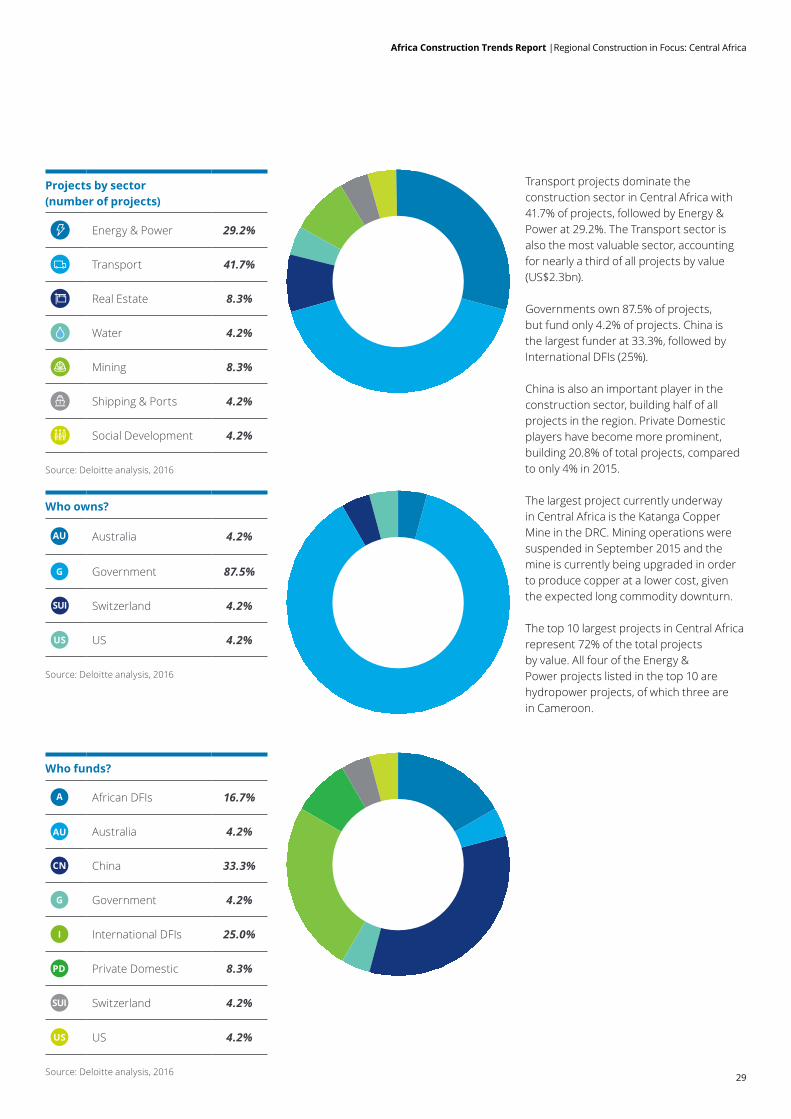
Who funds?
A African DFIs 16.7%
AU Australia 4.2%
CN China 33.3%
G Government 4.2%
I International DFIs 25.0%
PD Private Domestic 8.3%
SUI Switzerland 4.2%
US US 4.2%
Transport projects dominate the construction sector in Central Africa with 41.7% of projects, followed by Energy & Power at 29.2%. The Transport sector is also the most valuable sector, accounting for nearly a third of all projects by value (US$2.3bn).
Governments own 87.5% of projects, but fund only 4.2% of projects. China is the largest funder at 33.3%, followed by International DFIs (25%).
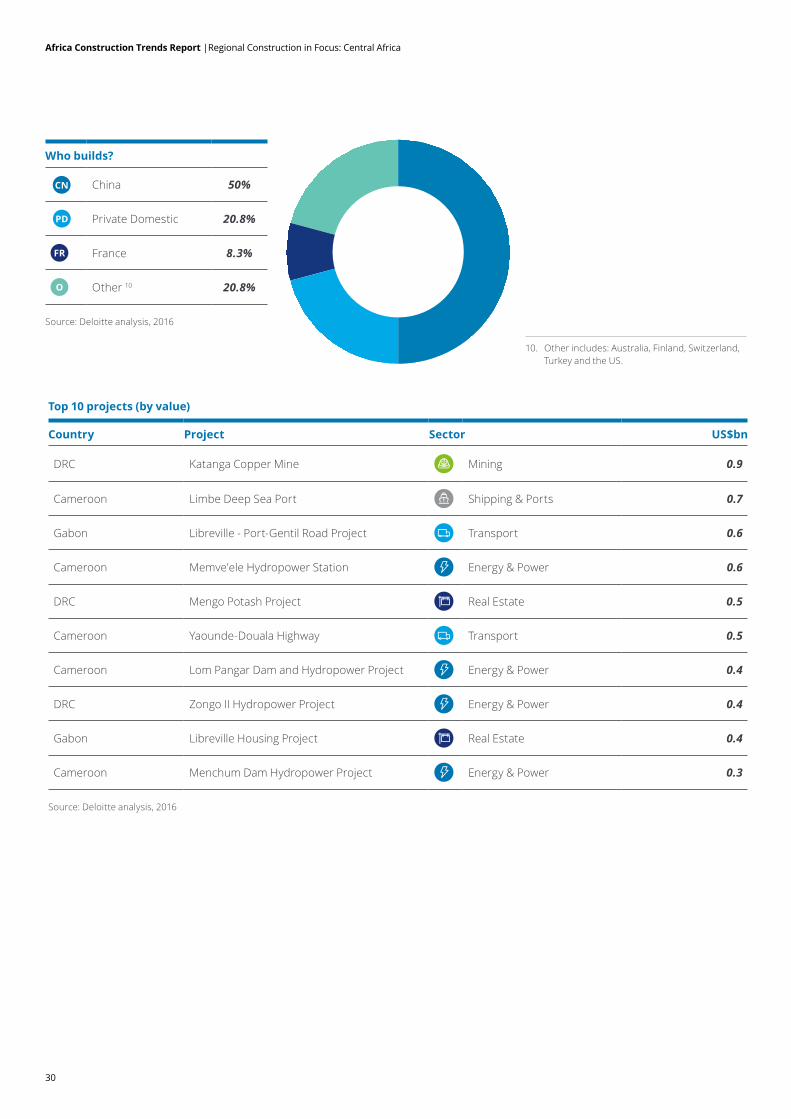
China is also an important player in the construction sector, building half of all projects in the region. Private Domestic players have become more prominent, building 20.8% of total projects, compared to only 4% in 2015.
The largest project currently underway in Central Africa is the Katanga Copper Mine in the DRC. Mining operations were suspended in September 2015 and the mine is currently being upgraded in order to produce copper at a lower cost, given the expected long commodity downturn.
The top 10 largest projects in Central Africa represent 72% of the total projects by value. All four of the Energy & Power projects listed in the top 10 are hydropower projects, of which three are in Cameroon.
Projects by sector (number of projects)
Energy & Power 29.2%
Transport 41.7%
Real Estate 8.3%
Water 4.2%
Mining 8.3%
Shipping & Ports 4.2%
Social Development 4.2%
Who owns?
AU Australia 4.2%
G Government 87.5%
SUI Switzerland 4.2%
US US 4.2%
Source: Deloitte analysis, 2016
Source: Deloitte analysis, 2016
Source: Deloitte analysis, 2016
30
Top 10 projects (by value)
Country Project Sector US$bn
DRC Katanga Copper Mine Mining 0.9
Cameroon Limbe Deep Sea Port Shipping & Ports 0.7
Gabon Libreville - Port-Gentil Road Project Transport 0.6
Cameroon Memve'ele Hydropower Station Energy & Power 0.6
DRC Mengo Potash Project Real Estate 0.5
Cameroon Yaounde-Douala Highway Transport 0.5
Cameroon Lom Pangar Dam and Hydropower Project Energy & Power 0.4
DRC Zongo II Hydropower Project Energy & Power 0.4
Gabon Libreville Housing Project Real Estate 0.4
Cameroon Menchum Dam Hydropower Project Energy & Power 0.3
Who builds?
CN China 50%
PD Private Domestic 20.8%
FR France 8.3%
O Other 10 20.8%
Africa Construction Trends Report |Regional Construction in Focus: Central Africa
10. Other includes: Australia, Finland, Switzerland, Turkey and the US.
Source: Deloitte analysis, 2016
Source: Deloitte analysis, 2016
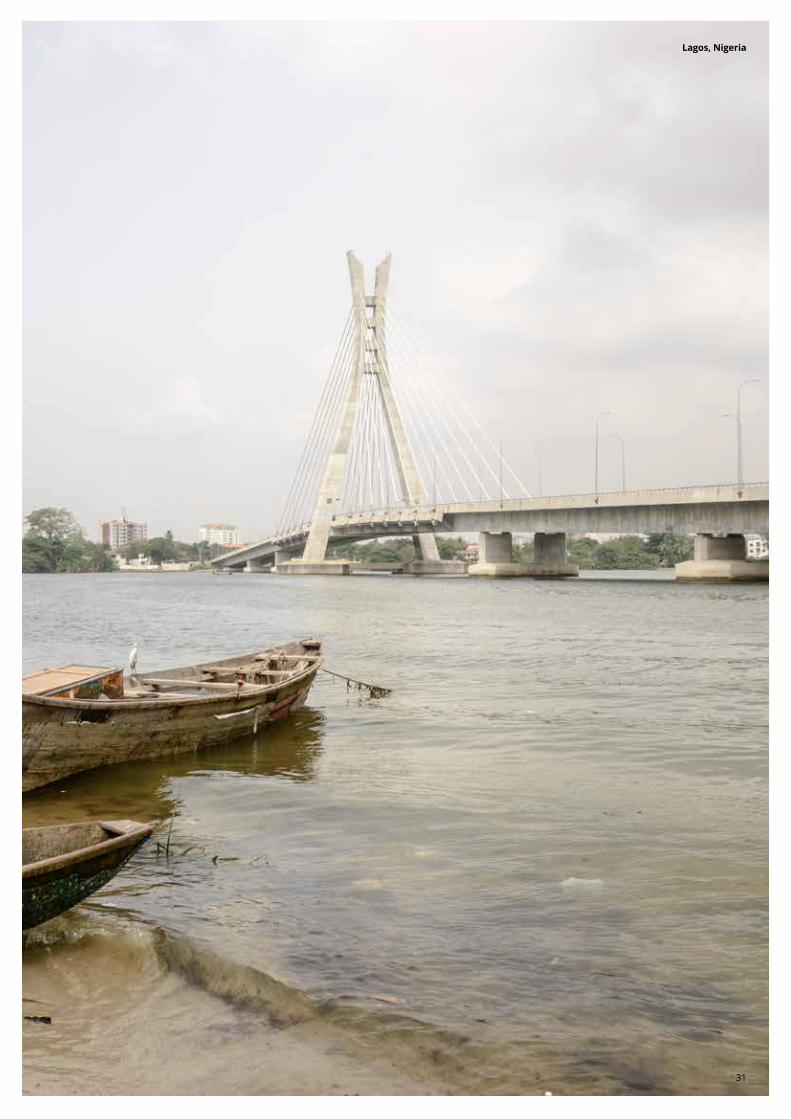
Proposal title goes here | Section title goes here Lagos, Nigeria
31
32
West Africa
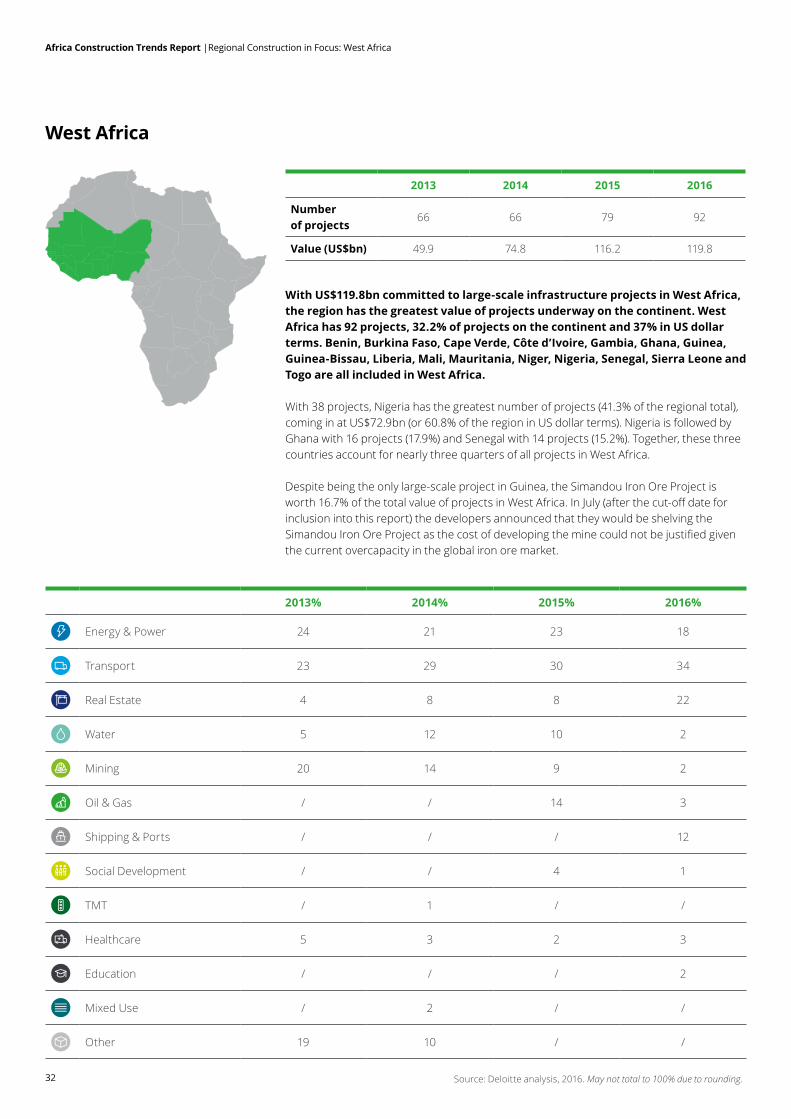
2013% 2014% 2015% 2016%
Energy & Power 24 21 23 18
Transport 23 29 30 34
Real Estate 4 8 8 22
Water 5 12 10 2
Mining 20 14 9 2
Oil & Gas / / 14 3
Shipping & Ports / / / 12
Social Development / / 4 1
TMT / 1 / /
Healthcare 5 3 2 3
Education / / / 2
Mixed Use / 2 / /
Other 19 10 / /
With US$119.8bn committed to large-scale infrastructure projects in West Africa, the region has the greatest value of projects underway on the continent. West Africa has 92 projects, 32.2% of projects on the continent and 37% in US dollar terms. Benin, Burkina Faso, Cape Verde, Côte d’Ivoire, Gambia, Ghana, Guinea, Guinea-Bissau, Liberia, Mali, Mauritania, Niger, Nigeria, Senegal, Sierra Leone and Togo are all included in West Africa.
With 38 projects, Nigeria has the greatest number of projects (41.3% of the regional total), coming in at US$72.9bn (or 60.8% of the region in US dollar terms). Nigeria is followed by Ghana with 16 projects (17.9%) and Senegal with 14 projects (15.2%). Together, these three countries account for nearly three quarters of all projects in West Africa.
Despite being the only large-scale project in Guinea, the Simandou Iron Ore Project is worth 16.7% of the total value of projects in West Africa. In July (after the cut-off date for inclusion into this report) the developers announced that they would be shelving the Simandou Iron Ore Project as the cost of developing the mine could not be justified given the current overcapacity in the global iron ore market.
2013 2014 2015 2016
Number of projects
66 66 79 92
Value (US$bn) 49.9 74.8 116.2 119.8
Africa Construction Trends Report |Regional Construction in Focus: West Africa
Source: Deloitte analysis, 2016. May not total to 100% due to rounding.
33
Africa Construction Trends Report |Regional Construction in Focus: West Africa
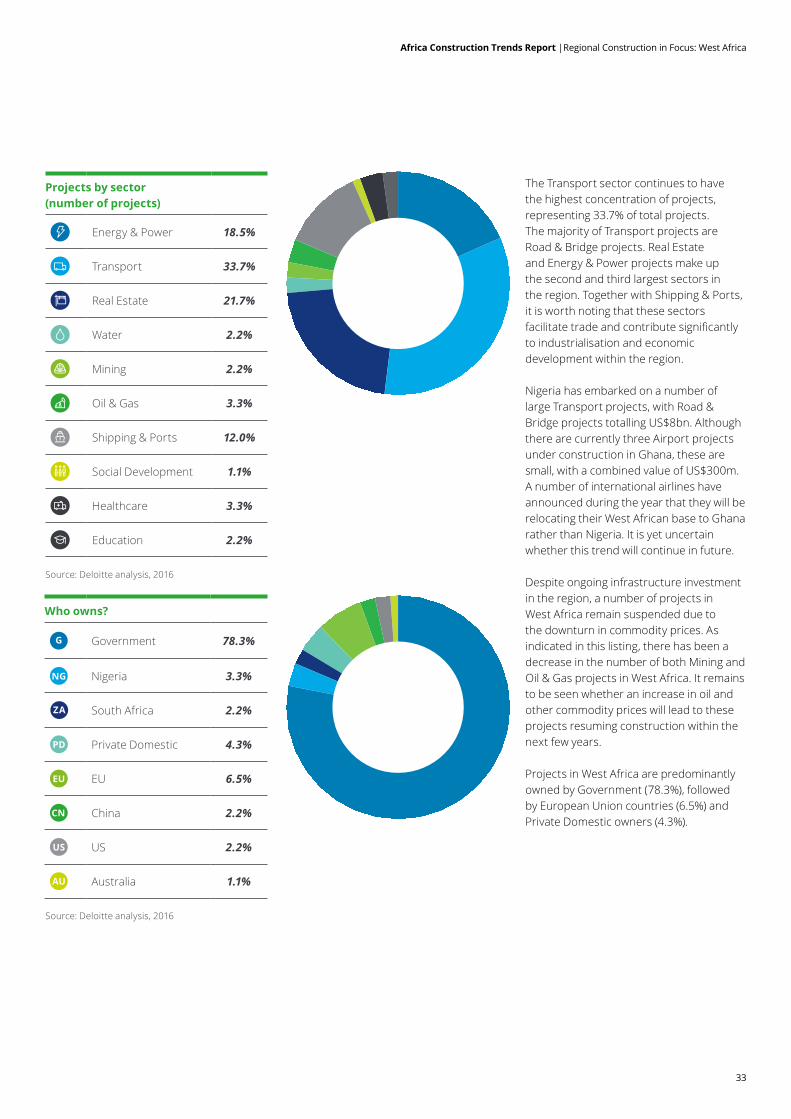
The Transport sector continues to have the highest concentration of projects, representing 33.7% of total projects. The majority of Transport projects are Road & Bridge projects. Real Estate and Energy & Power projects make up the second and third largest sectors in the region. Together with Shipping & Ports, it is worth noting that these sectors facilitate trade and contribute significantly to industrialisation and economic development within the region.
Nigeria has embarked on a number of large Transport projects, with Road & Bridge projects totalling US$8bn. Although there are currently three Airport projects under construction in Ghana, these are small, with a combined value of US$300m. A number of international airlines have announced during the year that they will be relocating their West African base to Ghana rather than Nigeria. It is yet uncertain whether this trend will continue in future.
Despite ongoing infrastructure investment in the region, a number of projects in West Africa remain suspended due to the downturn in commodity prices. As indicated in this listing, there has been a decrease in the number of both Mining and Oil & Gas projects in West Africa. It remains to be seen whether an increase in oil and other commodity prices will lead to these projects resuming construction within the next few years.
Projects in West Africa are predominantly owned by Government (78.3%), followed by European Union countries (6.5%) and Private Domestic owners (4.3%).
Projects by sector (number of projects)
Energy & Power 18.5%
Transport 33.7%
Real Estate 21.7%
Water 2.2%
Mining 2.2%
Oil & Gas 3.3%
Shipping & Ports 12.0%
Social Development 1.1%
Healthcare 3.3%
Education 2.2%
Who owns?
G Government 78.3%
NG Nigeria 3.3%
ZA South Africa 2.2%
PD Private Domestic 4.3%
EU EU 6.5%
CN China 2.2%
US US 2.2%
AU Australia 1.1%
Source: Deloitte analysis, 2016
Source: Deloitte analysis, 2016
34
Africa Construction Trends Report |Regional Construction in Focus: West Africa
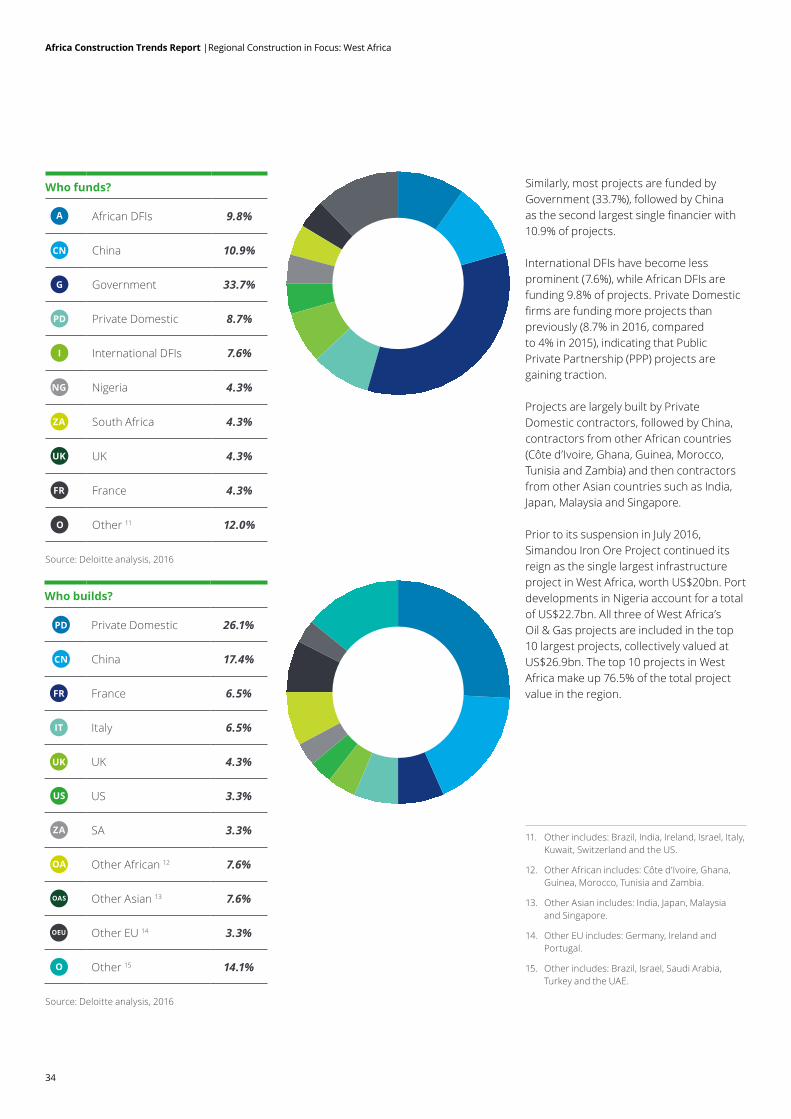
Who funds?
A African DFIs 9.8%
CN China 10.9%
G Government 33.7%
PD Private Domestic 8.7%
I International DFIs 7.6%
NG Nigeria 4.3%
ZA South Africa 4.3%
UK UK 4.3%
FR France 4.3%
O Other 11 12.0%
Similarly, most projects are funded by Government (33.7%), followed by China as the second largest single financier with 10.9% of projects.
International DFIs have become less prominent (7.6%), while African DFIs are funding 9.8% of projects. Private Domestic firms are funding more projects than previously (8.7% in 2016, compared to 4% in 2015), indicating that Public Private Partnership (PPP) projects are gaining traction.
Projects are largely built by Private Domestic contractors, followed by China, contractors from other African countries (Côte d’Ivoire, Ghana, Guinea, Morocco, Tunisia and Zambia) and then contractors from other Asian countries such as India, Japan, Malaysia and Singapore.
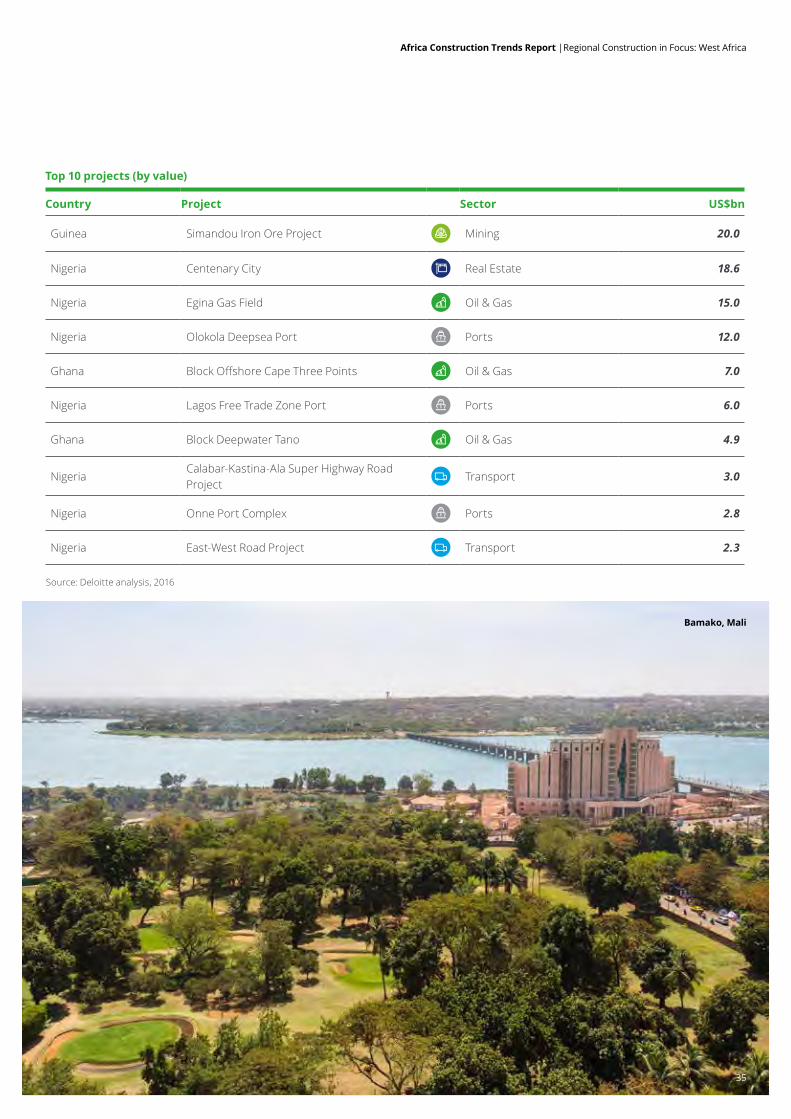
Prior to its suspension in July 2016, Simandou Iron Ore Project continued its reign as the single largest infrastructure project in West Africa, worth US$20bn. Port developments in Nigeria account for a total of US$22.7bn. All three of West Africa’s Oil & Gas projects are included in the top 10 largest projects, collectively valued at US$26.9bn. The top 10 projects in West Africa make up 76.5% of the total project value in the region.
Who builds?
PD Private Domestic 26.1%
CN China 17.4%
FR France 6.5%
IT Italy 6.5%
UK UK 4.3%
US US 3.3%
ZA SA 3.3%
OA Other African 12 7.6%
OAS Other Asian 13 7.6%
OEU Other EU 14 3.3%
O Other 15 14.1%
11. Other includes: Brazil, India, Ireland, Israel, Italy, Kuwait, Switzerland and the US.
12. Other African includes: Côte d’Ivoire, Ghana, Guinea, Morocco, Tunisia and Zambia.
13. Other Asian includes: India, Japan, Malaysia and Singapore.
14. Other EU includes: Germany, Ireland and Portugal.
15. Other includes: Brazil, Israel, Saudi Arabia, Turkey and the UAE.
Source: Deloitte analysis, 2016
Source: Deloitte analysis, 2016
Africa Construction Trends Report |Regional Construction in Focus: West Africa
Top 10 projects (by value)
Country Project Sector US$bn
Guinea Simandou Iron Ore Project Mining 20.0
Nigeria Centenary City Real Estate 18.6
Nigeria Egina Gas Field Oil & Gas 15.0
Nigeria Olokola Deepsea Port Ports 12.0
Ghana Block Offshore Cape Three Points Oil & Gas 7.0
Nigeria Lagos Free Trade Zone Port Ports 6.0
Ghana Block Deepwater Tano Oil & Gas 4.9
NigeriaCalabar-Kastina-Ala Super Highway Road Project
Transport 3.0
Nigeria Onne Port Complex Ports 2.8
Nigeria East-West Road Project Transport 2.3
Bamako, Mali
35
Source: Deloitte analysis, 2016
36
Aswan, Egypt
36
37
North Africa
2013% 2014% 2015% 2016%
Energy & Power 59 75 28 10
Transport 14 25 41 43
Real Estate 14 / 7 26
Water / / 7 5
Oil & Gas / / 8 12
Shipping & Ports / / 3 5
Social Development / / 3 /
Other 13 / 3 /
Source: Deloitte analysis, 2016
May not total to 100% due to rounding.
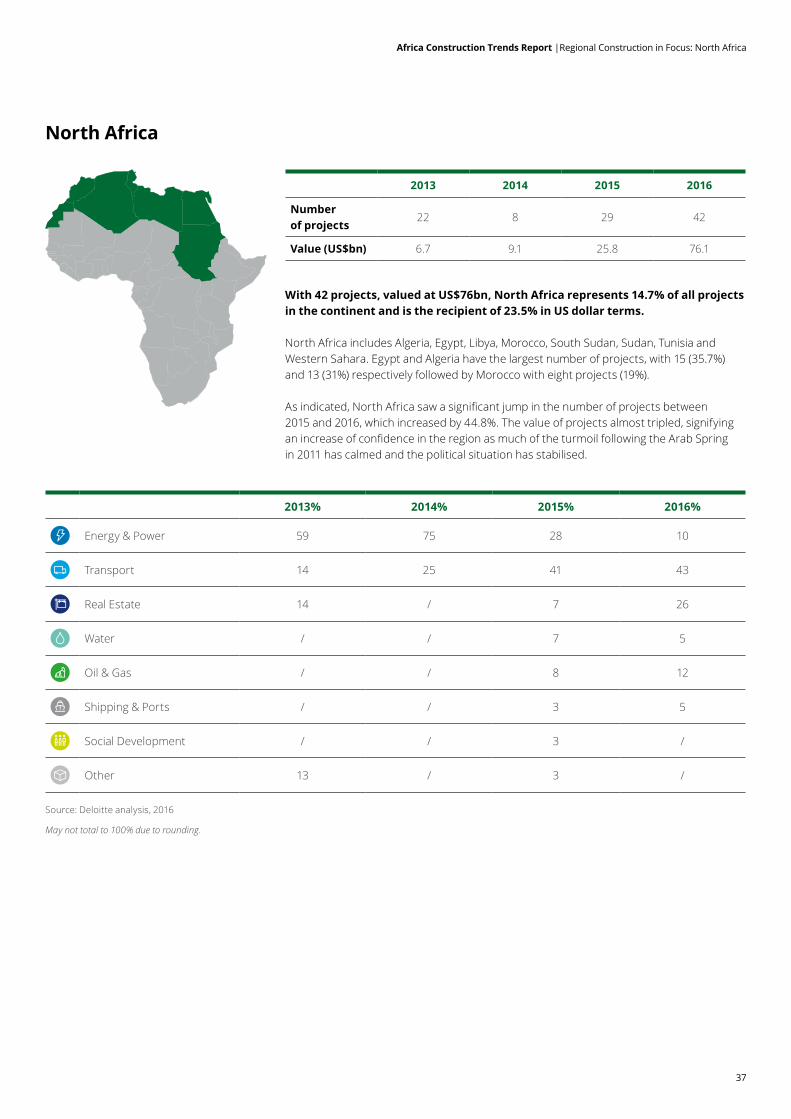
With 42 projects, valued at US$76bn, North Africa represents 14.7% of all projects in the continent and is the recipient of 23.5% in US dollar terms.
North Africa includes Algeria, Egypt, Libya, Morocco, South Sudan, Sudan, Tunisia and Western Sahara. Egypt and Algeria have the largest number of projects, with 15 (35.7%) and 13 (31%) respectively followed by Morocco with eight projects (19%).
As indicated, North Africa saw a significant jump in the number of projects between 2015 and 2016, which increased by 44.8%. The value of projects almost tripled, signifying an increase of confidence in the region as much of the turmoil following the Arab Spring in 2011 has calmed and the political situation has stabilised.
2013 2014 2015 2016
Number of projects
22 8 29 42
Value (US$bn) 6.7 9.1 25.8 76.1
Africa Construction Trends Report |Regional Construction in Focus: North Africa
38
Africa Construction Trends Report |Regional Construction in Focus: North Africa
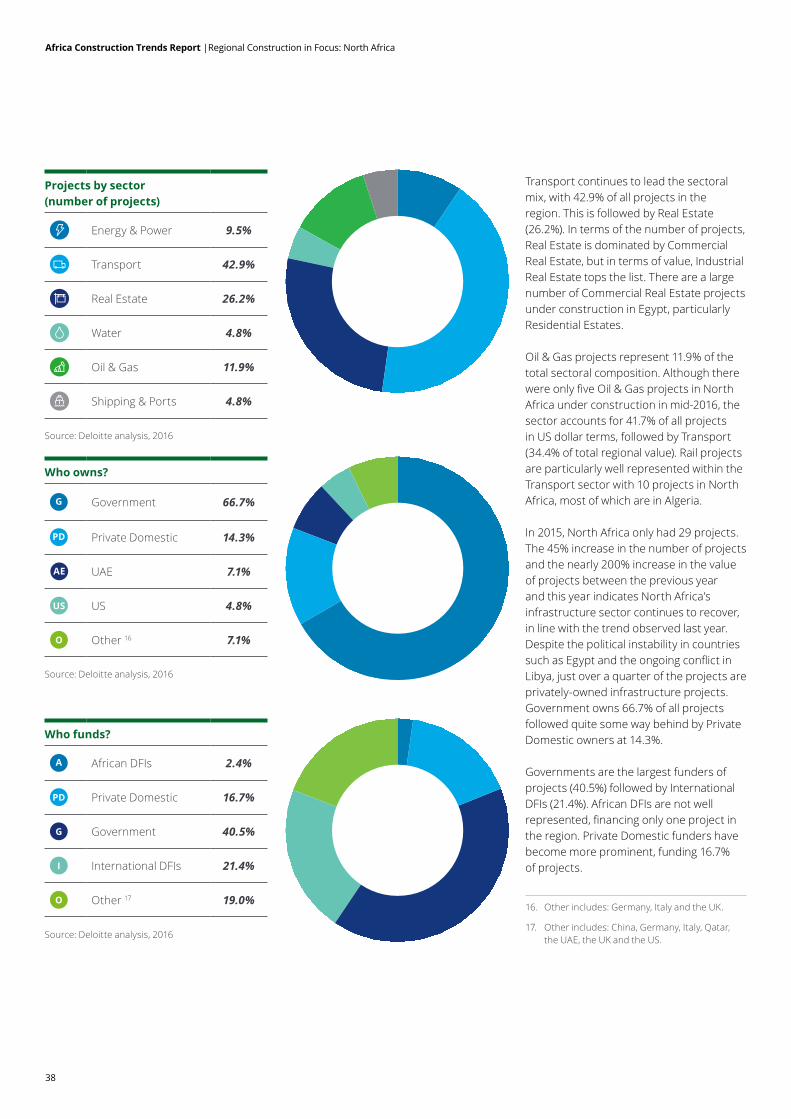
Transport continues to lead the sectoral mix, with 42.9% of all projects in the region. This is followed by Real Estate (26.2%). In terms of the number of projects, Real Estate is dominated by Commercial Real Estate, but in terms of value, Industrial Real Estate tops the list. There are a large number of Commercial Real Estate projects under construction in Egypt, particularly Residential Estates.
Oil & Gas projects represent 11.9% of the total sectoral composition. Although there were only five Oil & Gas projects in North Africa under construction in mid-2016, the sector accounts for 41.7% of all projects in US dollar terms, followed by Transport (34.4% of total regional value). Rail projects are particularly well represented within the Transport sector with 10 projects in North Africa, most of which are in Algeria.
In 2015, North Africa only had 29 projects. The 45% increase in the number of projects and the nearly 200% increase in the value of projects between the previous year and this year indicates North Africa’s infrastructure sector continues to recover, in line with the trend observed last year. Despite the political instability in countries such as Egypt and the ongoing conflict in Libya, just over a quarter of the projects are privately-owned infrastructure projects. Government owns 66.7% of all projects followed quite some way behind by Private Domestic owners at 14.3%.
Governments are the largest funders of projects (40.5%) followed by International DFIs (21.4%). African DFIs are not well represented, financing only one project in the region. Private Domestic funders have become more prominent, funding 16.7% of projects.
Projects by sector (number of projects)
Energy & Power 9.5%
Transport 42.9%
Real Estate 26.2%
Water 4.8%
Oil & Gas 11.9%
Shipping & Ports 4.8%
Who owns?
G Government 66.7%
PD Private Domestic 14.3%
AE UAE 7.1%
US US 4.8%
O Other 16 7.1%
Who funds?
A African DFIs 2.4%
PD Private Domestic 16.7%
G Government 40.5%
I International DFIs 21.4%
O Other 17 19.0%16. Other includes: Germany, Italy and the UK.
17. Other includes: China, Germany, Italy, Qatar, the UAE, the UK and the US.
Source: Deloitte analysis, 2016
Source: Deloitte analysis, 2016
Source: Deloitte analysis, 2016
39
Africa Construction Trends Report |Regional Construction in Focus: North Africa
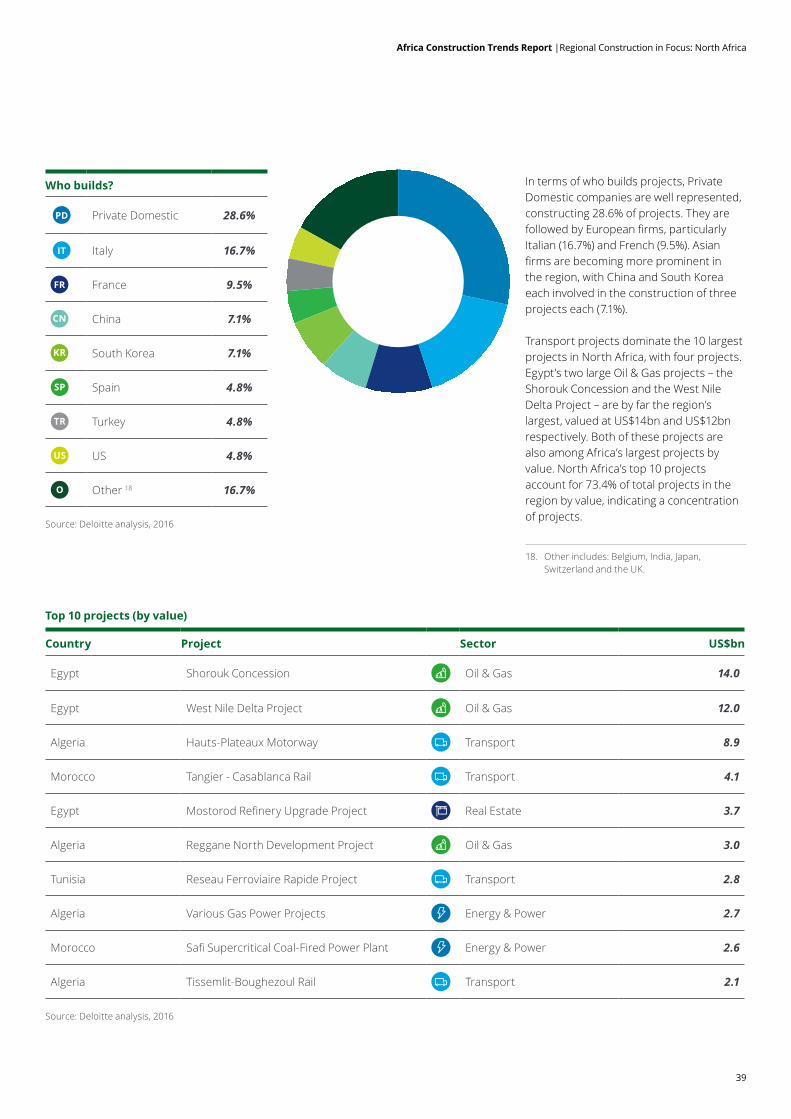
In terms of who builds projects, Private Domestic companies are well represented, constructing 28.6% of projects. They are followed by European firms, particularly Italian (16.7%) and French (9.5%). Asian firms are becoming more prominent in the region, with China and South Korea each involved in the construction of three projects each (7.1%).
Transport projects dominate the 10 largest projects in North Africa, with four projects. Egypt’s two large Oil & Gas projects – the Shorouk Concession and the West Nile Delta Project – are by far the region’s largest, valued at US$14bn and US$12bn respectively. Both of these projects are also among Africa’s largest projects by value. North Africa’s top 10 projects account for 73.4% of total projects in the region by value, indicating a concentration of projects.
Who builds?
PD Private Domestic 28.6%
IT Italy 16.7%
FR France 9.5%
CN China 7.1%
KR South Korea 7.1%
SP Spain 4.8%
TR Turkey 4.8%
US US 4.8%
O Other 18 16.7%
Top 10 projects (by value)
Country Project Sector US$bn
Egypt Shorouk Concession Oil & Gas 14.0
Egypt West Nile Delta Project Oil & Gas 12.0
Algeria Hauts-Plateaux Motorway Transport 8.9
Morocco Tangier - Casablanca Rail Transport 4.1
Egypt Mostorod Refinery Upgrade Project Real Estate 3.7
Algeria Reggane North Development Project Oil & Gas 3.0
Tunisia Reseau Ferroviaire Rapide Project Transport 2.8
Algeria Various Gas Power Projects Energy & Power 2.7
Morocco Safi Supercritical Coal-Fired Power Plant Energy & Power 2.6
Algeria Tissemlit-Boughezoul Rail Transport 2.1
18. Other includes: Belgium, India, Japan, Switzerland and the UK.
Source: Deloitte analysis, 2016
Source: Deloitte analysis, 2016
Proposal title goes here | Section title goes here
40
41
In 2015 the World Economic Forum’s (WEF) Global Risks Report identified water as the greatest societal and economic challenge worldwide. Again, in 2016, the global risk of water crises featured in the top three by impact. Issues such as overuse, inadequate water infrastructure and poor water management are major contributing factors to water shortages around the globe.
The potential of water crises is acute as demand for clean water could potentially outstrip supply by as much as 40% as early as 2030 if competition between water users continues at its current pace. Despite covering over 70% of the earth’s surface, less than 0.5% of the world’s water is available for use in the form of fresh surface and ground water.
The costs of such crises may be sizeable. The World Bank predicts that water scarcity, exacerbated by climate change, may spur migration, ignite conflict and cost some global regions up to the equivalent of 6% of their GDP.
Given Africa’s relatively lower level of economic development compared to other regions, the continent is likely to be the worst affected by a lack of accessible water in the coming years. The lack of storage, treatment and irrigation infrastructure even with abundant natural water resources results in these resources not being utilised neither effectively nor efficiently across countries.
Water access forms an integral part to sustainable developmentReliable access to safe and readily available water is a human right that is linked to health and food security, while also contributing to poverty reduction, environmental stability, education and economic growth. Water is also a key enabler for various important economic and developmental activities such as power generation and agriculture.
Agriculture requires water and energy to produce food on a large-scale and ensure food security. Energy generation requires water; the more energy we use, the more water is required in the generation of energy. As demand for food and energy increases, the demand for water to produce the food and generate the energy will also increase.
The futures of food, water and energy are therefore intrinsically linked and there are significant overlap and feedback mechanisms between the supply of water, production of food and generation of energy. Effective water use therefore needs to include an integrated approach that addresses this food-water-energy nexus.
However, according to Afrobarometer in 2015 almost 200 million people in Africa did not have enough clean water to fulfil household tasks. More than half the population needed to leave their compounds in order to access water and over 670 million people lacked sewerage infrastructure.
Goal seven of the Millennium Development Goals (MDGs), implemented in 2000, was to halve the number of people without sustainable access to safe drinking water and improved sanitation by 2015. The target for drinking water on a global basis was met ahead of schedule by 2010. Five developing regions met the target, but sub-Saharan Africa and North Africa were among the regions that did not.
As a continent, and worryingly so, Africa has made little progress in terms of access to water in the last decade. Governments have not been able to match the speed of increased water access with the rate of population growth. Although countries like Cape Verde, Kenya, Malawi, Namibia, Uganda and Zambia have improved citizens’ access to water, in Botswana, Madagascar, Mozambique and Senegal the proportion of people without regular access to clean water has increased.
Lack of access to water disproportionally affects women and children, who often spend more than two hours per day collecting water. The social cost of a lack of adequate water is therefore far reaching, as these children are often not able to attend school. This impacts on a country’s economic potential in the long run.
Economically, water is an essential component in various industries, critical to agro-processing and vital for the generation of energy, as mentioned above. If African governments hope to diversify their economies and move up the global value chain, large-scale investments in water access and related infrastructure projects are required. Greater investment in water and sanitation infrastructures will be required to bridge these gaps, especially with targets such as goal six of the new Sustainable Development Goals (SDGs), which came into effect post-2015. This goal aims to ensure access to water and sanitation for all by 2030.
Drying Up? A Focus on Africa’s Water Projects
Africa Construction Trends Report |Drying Up? A Focus on Africa’s Water Projects
42
Africa Construction Trends Report |Drying Up? A Focus on Africa’s Water Projects
Demographic and structural changes drive water demand and management requirementsIn addition to supplying improved drinking water to the global population, public and private sectors around the world need to find ways to sustain economic growth in the face of increasing demand for water. The mounting demand for water, fuelled by global population growth and industrial expansion, is placing constraints on water access and use, even in some regions where water was historically abundant.
Water scarcity or a lack of access is ultimately a result of water management. At least in an economic sense, water scarcity is often the result of the poor management of water catchment areas.
Africa has about 64 transboundary river basins. This in itself creates numerous challenges and requires political will and cooperation between states.
In Central Africa, which has a physical abundance of water, more than half of the population does not have regular access to clean water. Much of Central, East and West Africa is susceptible to economic water scarcity. Whereas North Africa is a region that experiences physical water scarcity, it has the lowest percentage of citizens (33%) in Africa without regular water access.
Population growth, urbanisation, water-intensive industry and climate change increase the pressure on existing water resources. For example, Africa’s population has increased rapidly in recent years.
Since 1990 sub-Saharan Africa’s population has almost doubled and the urban population increased by 169% between 1990 and 2015. In 2025, Africa is expected to account for 20% of the global population, reaching 1.7 billion people by 2050. In 2025, the two cities of Kinshasa and Lagos alone will be home to at least 16.8 million and 15.8 million people respectively (with some estimates already placing Lagos’ population above 18 million people to date).
To meet the increased demand for water, African governments will need to better manage existing water institutions and utilities, invest in and build new water infrastructure, maintain existing infrastructure and protect water basins and ecosystems.
On a continent that already cannot meet many of its basic infrastructure demands, this is a significant challenge that will only grow in stature if not addressed.
The challenges to funding water infrastructure projectsAfrica lacks a stakeholder that champions or owns developments needed in the water sector. The supply of water is often politically charged. As water is a human right, neither government nor the private sector want to be seen to be profiting from water. As the costs of building new water infrastructure increase, together with the higher cost of operating and maintaining existing water infrastructure, funding for required investments in the sector become more difficult.
The private sector is less willing to invest in projects without tangible offtakers while donors indicate that bankable projects are not readily available, and governments protest that funding for the sector is difficult to find. This has put both governments and utilities globally under pressure to incentivise customers to better manage their water resources.
In many parts of Africa water is either free or very cheap. Non-revenue water (physical water that is lost through leaks and other inefficiencies) accounts for between 40% and 50% of total water supplied. As a result, nearly half the water supplied is lost before it even reaches the consumer. The World Bank has argued that the price of water should be increased to address scarcity-related issues and to better account for non-revenue water.
Funding organisations largely view water infrastructure projects as unattractive, given its political nature and lack of offtakers. This is evident in this report, where water accounted for 3.8% of total projects and only 1.3% of projects by value. This trend has been relatively stable over the four previous editions of the report but has also been exacerbated by the global economic headwinds facing infrastructure and capital projects on the continent.
Although the sector offers social and economic returns, financial returns are the lowest of all the infrastructure asset classes and are sometimes even negative as per research conducted. The water sector is subject to high initial capital costs, significant maintenance and often only a gradual scaling up of capacity. The result is that the water sector is often neglected by government and funders alike.
+
43
The AfDB estimated in 2011 that the continent requires US$10bn per year to finance water resources such as large storage, hydropower and urban infrastructure. The funding gap is projected to amount to almost 50% of this amount. It is suggested that private water financing only accounts for 10% of total financing in the sector. Governments fund 70% of projects, while 20% are funded by donor aid.
This is in line with the current trends and the project data collected and analysed for this report. The 70% investment by government is often equal to less than 3% of GDP, suggesting that the water sector tends to be a low priority when compared to other sectors such as Transport or Energy & Power.
Governments cannot bear the water burden alone. Water scarcity and quality are societal challenges that need to be shared between governments, non-governmental organisations, the private sector and society as a whole.
Successful water financing is dependent on operational corporatisation and the creation and implementation of appropriate financing mechanisms. For example, it can make more sense to sell water services, or the right to access the water than the water itself. The trading of water abstraction licenses is one way to establish an efficient water market.
Rather than trading water, licence holders are allowed to trade their licences, encouraging efficiency in the market and the amount of water allowed to be abstracted is capped. The caps can therefore be increased or decreased subject to the availability of water and the price of licences adjusted accordingly. Licence trading is used in parts of the US, China and South Africa. The creation of more liberalised water markets is one way to ensure that water utilities, especially in developing countries, have access to sufficient funding to invest in and maintain existing water infrastructure.
Africa Construction Trends Report |Drying Up? A Focus on Africa’s Water Projects
44
Africa Construction Trends Report |Drying Up? A Focus on Africa’s Water Projects
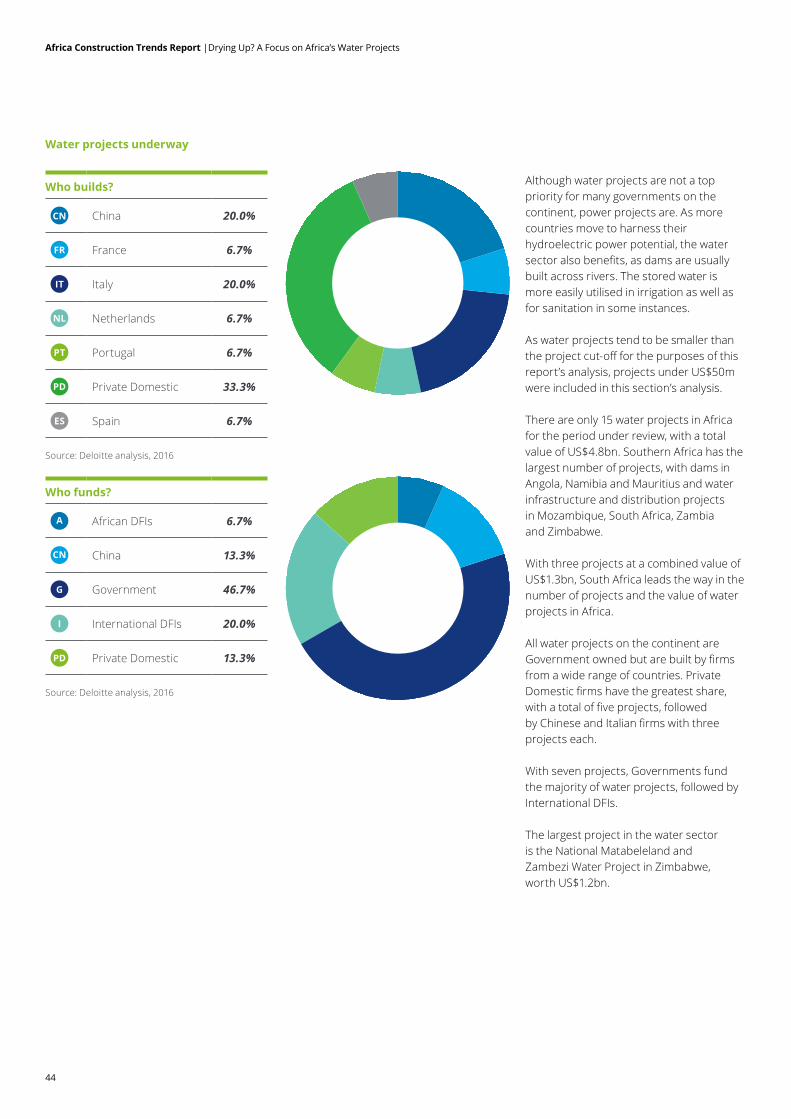
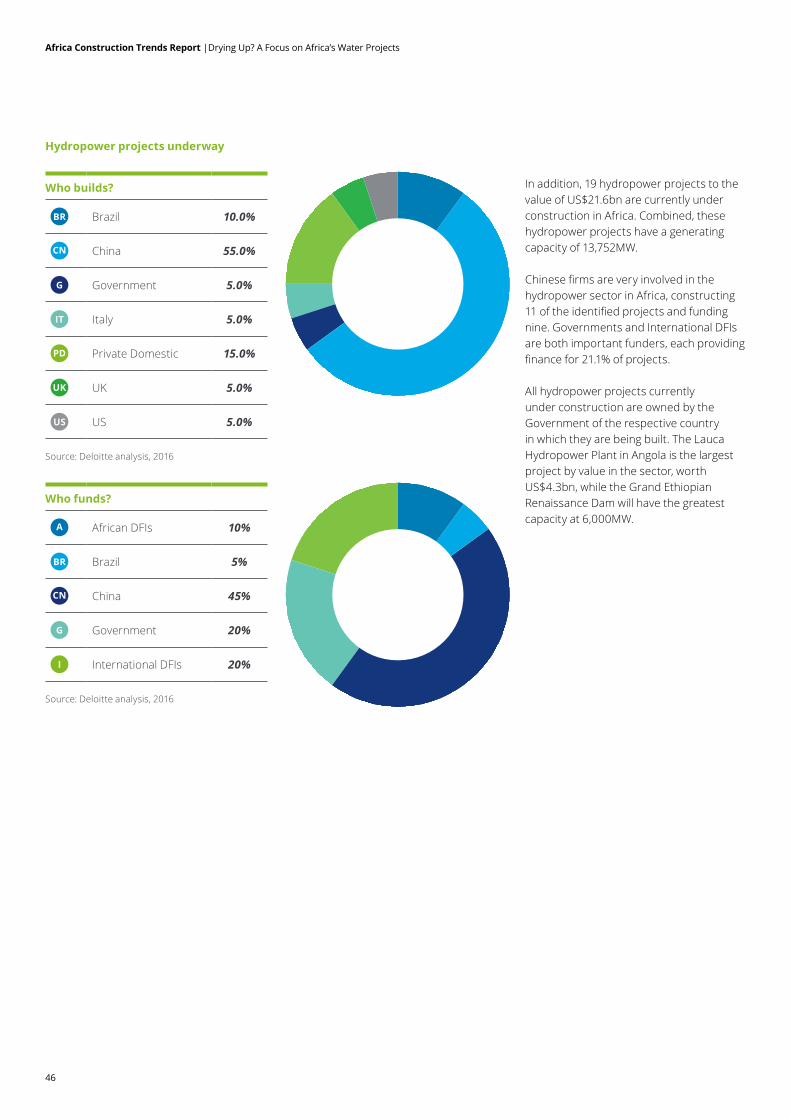
Who builds?
CN China 20.0%
FR France 6.7%
IT Italy 20.0%
NL Netherlands 6.7%
PT Portugal 6.7%
PD Private Domestic 33.3%
ES Spain 6.7%
Who funds?
A African DFIs 6.7%
CN China 13.3%
G Government 46.7%
I International DFIs 20.0%
PD Private Domestic 13.3%
Water projects underway
Although water projects are not a top priority for many governments on the continent, power projects are. As more countries move to harness their hydroelectric power potential, the water sector also benefits, as dams are usually built across rivers. The stored water is more easily utilised in irrigation as well as for sanitation in some instances.
As water projects tend to be smaller than the project cut-off for the purposes of this report’s analysis, projects under US$50m were included in this section’s analysis.
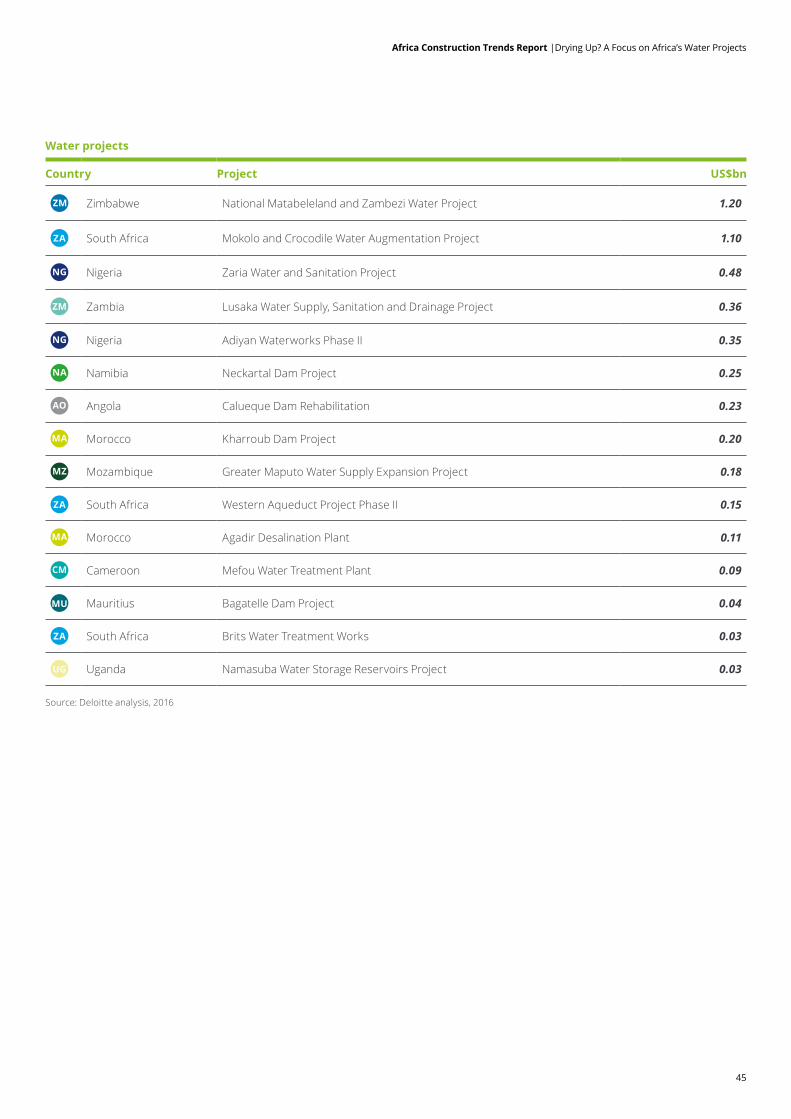
There are only 15 water projects in Africa for the period under review, with a total value of US$4.8bn. Southern Africa has the largest number of projects, with dams in Angola, Namibia and Mauritius and water infrastructure and distribution projects in Mozambique, South Africa, Zambia and Zimbabwe.
With three projects at a combined value of US$1.3bn, South Africa leads the way in the number of projects and the value of water projects in Africa.
All water projects on the continent are Government owned but are built by firms from a wide range of countries. Private Domestic firms have the greatest share, with a total of five projects, followed by Chinese and Italian firms with three projects each.
With seven projects, Governments fund the majority of water projects, followed by International DFIs. The largest project in the water sector is the National Matabeleland and Zambezi Water Project in Zimbabwe, worth US$1.2bn.
Source: Deloitte analysis, 2016
Source: Deloitte analysis, 2016
45
Water projects
Country Project US$bn
ZM Zimbabwe National Matabeleland and Zambezi Water Project 1.20
ZA South Africa Mokolo and Crocodile Water Augmentation Project 1.10
NG Nigeria Zaria Water and Sanitation Project 0.48
ZM Zambia Lusaka Water Supply, Sanitation and Drainage Project 0.36
NG Nigeria Adiyan Waterworks Phase II 0.35
NA Namibia Neckartal Dam Project 0.25
AO Angola Calueque Dam Rehabilitation 0.23
MA Morocco Kharroub Dam Project 0.20
MZ Mozambique Greater Maputo Water Supply Expansion Project 0.18
ZA South Africa Western Aqueduct Project Phase II 0.15
MA Morocco Agadir Desalination Plant 0.11
CM Cameroon Mefou Water Treatment Plant 0.09
MU Mauritius Bagatelle Dam Project 0.04
ZA South Africa Brits Water Treatment Works 0.03
UG Uganda Namasuba Water Storage Reservoirs Project 0.03
Africa Construction Trends Report |Drying Up? A Focus on Africa’s Water Projects
Source: Deloitte analysis, 2016
46
Who funds?
A African DFIs 10%
BR Brazil 5%
CN China 45%
G Government 20%
I International DFIs 20%
In addition, 19 hydropower projects to the value of US$21.6bn are currently under construction in Africa. Combined, these hydropower projects have a generating capacity of 13,752MW.
Chinese firms are very involved in the hydropower sector in Africa, constructing 11 of the identified projects and funding nine. Governments and International DFIs are both important funders, each providing finance for 21.1% of projects.
All hydropower projects currently under construction are owned by the Government of the respective country in which they are being built. The Lauca Hydropower Plant in Angola is the largest project by value in the sector, worth US$4.3bn, while the Grand Ethiopian Renaissance Dam will have the greatest capacity at 6,000MW.
Who builds?
BR Brazil 10.0%
CN China 55.0%
G Government 5.0%
IT Italy 5.0%
PD Private Domestic 15.0%
UK UK 5.0%
US US 5.0%
Hydropower projects underway
Africa Construction Trends Report |Drying Up? A Focus on Africa’s Water Projects
Source: Deloitte analysis, 2016
Source: Deloitte analysis, 2016
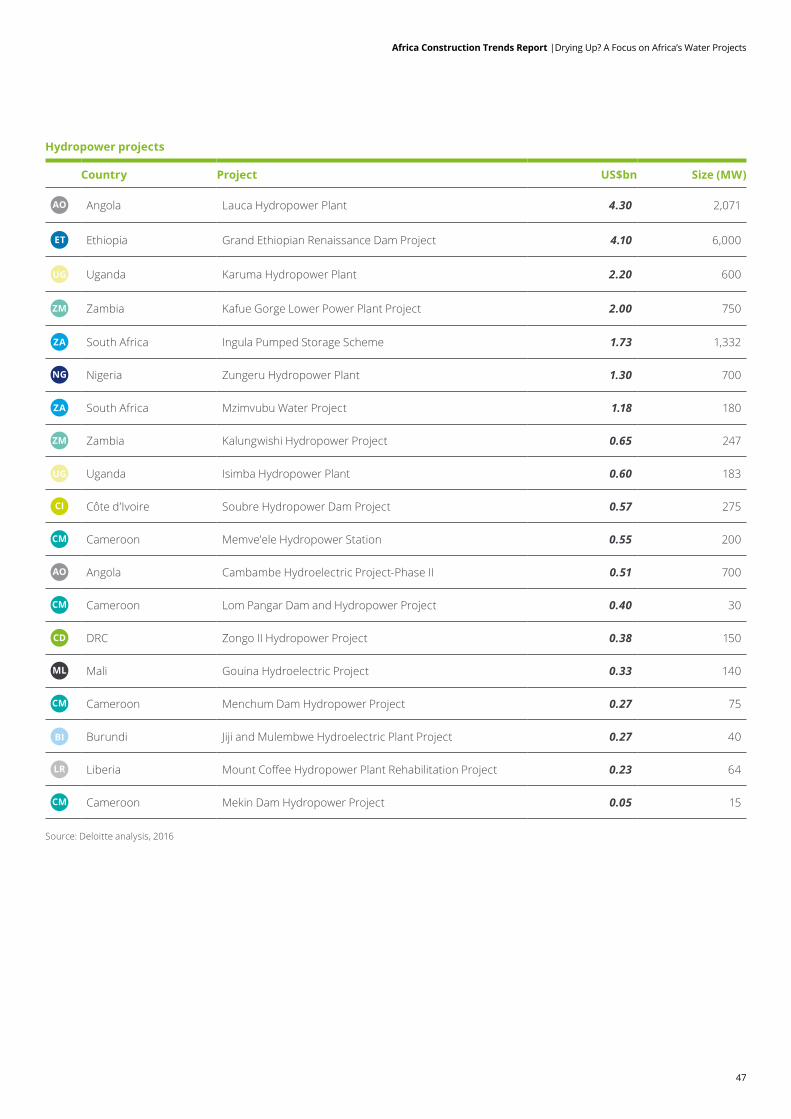
47
Hydropower projects
Country Project US$bn Size (MW)
AO Angola Lauca Hydropower Plant 4.30 2,071
ET Ethiopia Grand Ethiopian Renaissance Dam Project 4.10 6,000
UG Uganda Karuma Hydropower Plant 2.20 600
ZM Zambia Kafue Gorge Lower Power Plant Project 2.00 750
ZA South Africa Ingula Pumped Storage Scheme 1.73 1,332
NG Nigeria Zungeru Hydropower Plant 1.30 700
ZA South Africa Mzimvubu Water Project 1.18 180
ZM Zambia Kalungwishi Hydropower Project 0.65 247
UG Uganda Isimba Hydropower Plant 0.60 183
CI Côte d’Ivoire Soubre Hydropower Dam Project 0.57 275
CM Cameroon Memve'ele Hydropower Station 0.55 200
AO Angola Cambambe Hydroelectric Project-Phase II 0.51 700
CM Cameroon Lom Pangar Dam and Hydropower Project 0.40 30
CD DRC Zongo II Hydropower Project 0.38 150
ML Mali Gouina Hydroelectric Project 0.33 140
CM Cameroon Menchum Dam Hydropower Project 0.27 75
BI Burundi Jiji and Mulembwe Hydroelectric Plant Project 0.27 40
LR Liberia Mount Coffee Hydropower Plant Rehabilitation Project 0.23 64
CM Cameroon Mekin Dam Hydropower Project 0.05 15
Africa Construction Trends Report |Drying Up? A Focus on Africa’s Water Projects
Source: Deloitte analysis, 2016
48
Africa Construction Trends Report |References
ReferencesAfrican Development Bank. (2016). African Economic Outlook. AfDB. Retrieved from http://www.afdb.org/en/knowledge/publications/african-economic-outlook/
Afrobarometer. (2016). Lack of safe water, sanitation spurs growing dissatisfaction with government performance. Afrobarometer. Retrieved from http://afrobarometer.org/publications/ad76-lack-of-safe-water-and-sanitation-spurs-growing-dissatisfaction
Deloitte. (2013). Getting Ahead of the Ripple Effect. Deloitte University Press. Retrieved from http://dupress.deloitte.com/dup-us-en/deloitte-review/issue-12/getting-ahead-of-the-ripple-effect.html
Deloitte. (2015). Deflecting the scarcity trajectory: Innovation at the water, energy, and food nexus. Deloitte University Press. Retrieved from http://dupress.deloitte.com/dup-us-en/deloitte-review/issue-17/water-energy-food-nexus.html
Deloitte. (2015). State of Mining in Africa. Deloitte. Retrieved from http://www2.deloitte.com/za/en/pages/energy-and-resources/articles/state-of-mining-in-africa-2015.html
Deloitte. (2015). Water as a shared challenge. Deloitte University Press. Retrieved from http://dupress.deloitte.com/dup-us-en/deloitte-review/issue-16/water-stewardship-collective-business-action.html
Deloitte. (2016). Africa from the Inside: Spotlight on Africa’s growth. Deloitte. Retrieved from http://www2.deloitte.com/za/en/pages/deloitte-africa/articles/africa-from-inside-spotlight-on-africas-growth.html
Deloitte. (2016). Tracking the Trends. Deloitte. Retrieved from http://www2.deloitte.com/global/en/pages/energy-and-resources/articles/tracking-the-trends.html
Deloitte. (2016). Water Tight 2.0. Deloitte. Retrieved from http://www2.deloitte.com/global/en/pages/energy-and-resources/articles/water-tight.html
International Monetary Fund. (2016). Regional Economic Outlook: Middle East and Central Asia. IMF. Retrieved from https://www.imf.org/external/pubs/ft/reo/2016/mcd/mreo0416.htm
International Monetary Fund. (2016). Regional Economic Outlook: Sub-Saharan Africa. IMF. Retrieved from https://www.imf.org/external/pubs/ft/reo/2016/afr/eng/sreo0416.htm
International Monetary Fund. (2016). World Economic Outlook: Subdued Demand: Symptoms and Remedies. IMF. Retrieved from http://www.imf.org/external/pubs/ft/weo/2016/02/
United Nations. (2000). Millennium Development Goals. Retrieved from http://www.unmillenniumproject.org/goals/
United Nations. (2015). Sustainable Development Goals. Retrieved from http://www.un.org/sustainabledevelopment/sustainable-development-goals/
World Bank Group. (2016). Global Economic Prospects, June 2016: Divergences and Risks. World Bank. doi:10.1596/978-1-4648-0777-0
World Bank Group. (2016). Open Data. Retrieved from http://data.worldbank.org/
World Economic Forum. (2015). Global Risks Report. WEF. Retrieved from http://reports.weforum.org/global-risks-2015/
World Economic Forum. (2016). Global Risks Report. WEF. Retrieved from https://www.weforum.org/reports/the-global-risks-report-2016/
Proposal title goes here | Section title goes here Rabat, Morocco
49
50
Africa Construction Trends Report |Methodology
To qualify for inclusion, infrastructure construction projects are required to be valued at over US$50 million. For this year’s edition, projects must have broken ground, but not yet been commissioned as at 1 June 2016.
The analysis of construction trends focuses on projects that are physically under construction, with construction crews on-site at the annual cut-off date. The successive annual reports track the value of construction projects underway as at 1 June of each year, and the numbers should not be read as reflecting the total value of projects constructed during
a 12-month period. Projects that were suspended after 1 June 2016 were included in this report, but it has been noted that these projects have been suspended.
In previous editions, export credit agencies were included as International DFIs. However, this year it was decided that export credit agencies like China Export-Import (Exim) Bank should rather be classed as the country where they are domiciled, in this case China.
In this edition we are able to draw comparisons across four years of data, both from a continental and regional
perspective, drilling down into the sectoral, project ownership, project funder and project builder landscape.
Categorisation of regions covered in this report followed that of the African Development Bank. Data collected was limited to publicly available information and informed the Africa Construction Trends 2016 dataset. All graphics displayed in this report, unless otherwise indicated, are based on this dataset.
The annual Deloitte Africa Construction Trends Report monitors progress on capital intensive infrastructure on the continent.
Methodology
Monrovia, Liberia
51
Jean-Pierre Labuschagne Infrastructure & Capital Projects Leader Deloitte AfricaEmail: [email protected]
Dr Martyn Davies Managing Director: Emerging Markets & Africa Deloitte AfricaEmail: [email protected]
Gloria Mamba Donor Funded Infrastructure & Capital Projects Deloitte Development AfricaEmail: [email protected]
Lauren Baronet Infrastructure & Capital Projects Marketing Lead Deloitte South AfricaEmail: [email protected]
Central AfricaThomas Wushe Deloitte Central AfricaEmail: [email protected]
East AfricaRajiv Sharma Deloitte KenyaEmail: [email protected]
Francophone AfricaLaurence van Prooijen Deloitte FranceEmail: [email protected]
Southern AfricaDave van der Merwe Deloitte South AfricaEmail: [email protected]
West AfricaEllen Fayorsey Deloitte West AfricaEmail: [email protected]
Hannah Edinger Deloitte AfricaEmail: [email protected]
Kira McDonald Deloitte AfricaEmail: [email protected]
Damian Sakoor Deloitte South AfricaEmail: [email protected]
Contacts
52
Research TeamIndustry Contacts
Africa Construction Trends Report |Contacts

Deloitte provides audit, consulting, financial advisory, risk management, tax and related services to public and private clients spanning multiple industries. With a globally connected network of member firms in more than 150 countries and territories, Deloitte brings world class capabilities and high-quality service to clients, delivering the insights they need to address their most complex business challenges.
This publication has been written in general terms and therefore cannot be relied on to cover specific situations; application of the principles set out will depend upon the particular circumstances involved and we recommend that you obtain professional advice before acting or refraining from acting on any of the contents of this publication. This publication and the information contained herein is provided “as is,” and Deloitte University EMEA CVBA makes no express or implied representations or warranties in this respect and does not warrant that the publication or information will be error-free or will meet any particular criteria of performance or quality. Deloitte University EMEA CVBA accepts no duty of care or liability for any loss occasioned to any person acting or refraining from action as a result of any material in this publication.
© 2016 Deloitte University EMEA CVBA,Responsible publisher: Deloitte University EMEA CVBA, with registered office at B-1831 Diegem, Berkenlaan 8b