Deloitte 07 08 june 2012 - presentation material
83
© 2012 PT Deloitte Konsultan Indonesia Financial Modelling for Corporate Budgeting, Sensitivity & Scenario Analysis Using Excel & VBA 7 - 8 June 2012 Grand Hyatt, Jakarta Financial Modelling for Corporate Budgeting, Sensitivity & Scenario Analysis Using Excel & VBA © 2012 PT Deloitte Konsultan Indonesia Financial Modelling for Corporate Budgeting, Sensitivity & Scenario Analysis Using Excel & VBA 2 Sessions Day 1 - 1 Day 1 - 2 Day 1 - 3 Day 1 - 4 Day 2 - 1 Day 2 - 2 Day 2 - 3 Day 2 - 4 Cash Flows, Financial Ratios Income Statement, Cash Budget, Balance Sheet Operating Expenses, Capital Budget Assumptions, Sales, Collection, COGS, Inventory, Purchases Model Overview, Design Principles, Model Flow Charts Contribution Margin, Variance Analysis Automatic Number Formatting, Dynamic Chart Sensitivity & Scenario Analysis Dashboard
-
Upload
ayu-intani -
Category
Business
-
view
311 -
download
6
Transcript of Deloitte 07 08 june 2012 - presentation material

© 2012 PT Deloitte Konsultan IndonesiaFinancial Modelling for Corporate Budgeting, Sensitivity & Scenario Analysis Using Excel & VBA
7 - 8 June 2012
Grand Hyatt, Jakarta
Financial Modellingfor Corporate Budgeting,Sensitivity & Scenario Analysis
Using Excel & VBA
© 2012 PT Deloitte Konsultan IndonesiaFinancial Modelling for Corporate Budgeting, Sensitivity & Scenario Analysis Using Excel & VBA2
Sessions
Day 1 - 1
Day 1 - 2
Day 1 - 3
Day 1 - 4
Day 2 - 1
Day 2 - 2
Day 2 - 3
Day 2 - 4
Cash Flows, Financial Ratios
Income Statement, Cash Budget, Balance Sheet
Operating Expenses, Capital Budget
Assumptions, Sales, Collection, COGS, Inventory, Purchases
Model Overview, Design Principles, Model Flow Charts
Contribution Margin, Variance Analysis
Automatic Number Formatting, Dynamic Chart
Sensitivity & Scenario Analysis Dashboard
© 2012 PT Deloitte Konsultan IndonesiaFinancial Modelling for Corporate Budgeting, Sensitivity & Scenario Analysis Using Excel & VBA
© 2012 PT Deloitte Konsultan IndonesiaFinancial Modelling for Corporate Budgeting, Sensitivity & Scenario Analysis Using Excel & VBA3
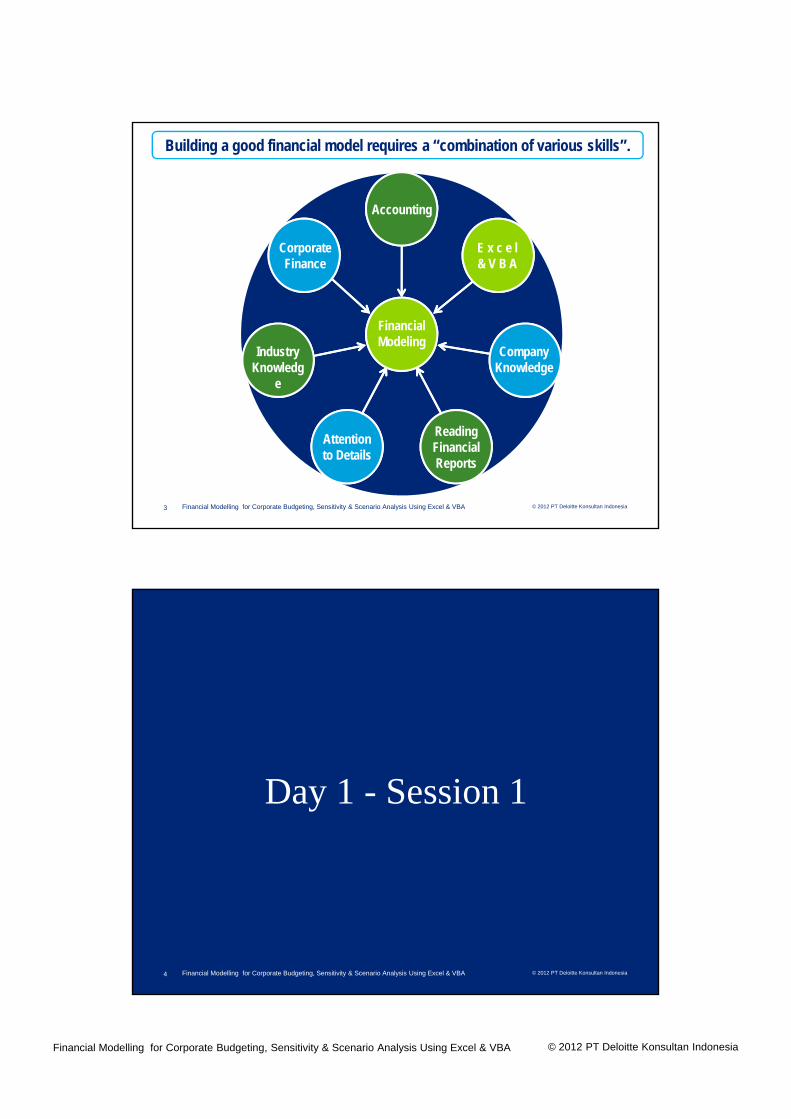
Financial Modeling
Company Knowledge
Accounting
Attention to Details
Reading Financial Reports
E x c e l& V B A
Corporate Finance
Industry Knowledg
e
Building a good financial model requires a “combination of various skills”.
Day 1 - Session 1
© 2012 PT Deloitte Konsultan IndonesiaFinancial Modelling for Corporate Budgeting, Sensitivity & Scenario Analysis Using Excel & VBA4
© 2012 PT Deloitte Konsultan IndonesiaFinancial Modelling for Corporate Budgeting, Sensitivity & Scenario Analysis Using Excel & VBA
© 2012 PT Deloitte Konsultan IndonesiaFinancial Modelling for Corporate Budgeting, Sensitivity & Scenario Analysis Using Excel & VBA5
Financial Modeling for Corporate Budgeting,Sensitivity & Scenario Analysis
Day 1 Session 1a:Overview of the Corporate Budget Model
© 2012 PT Deloitte Konsultan IndonesiaFinancial Modelling for Corporate Budgeting, Sensitivity & Scenario Analysis Using Excel & VBA6
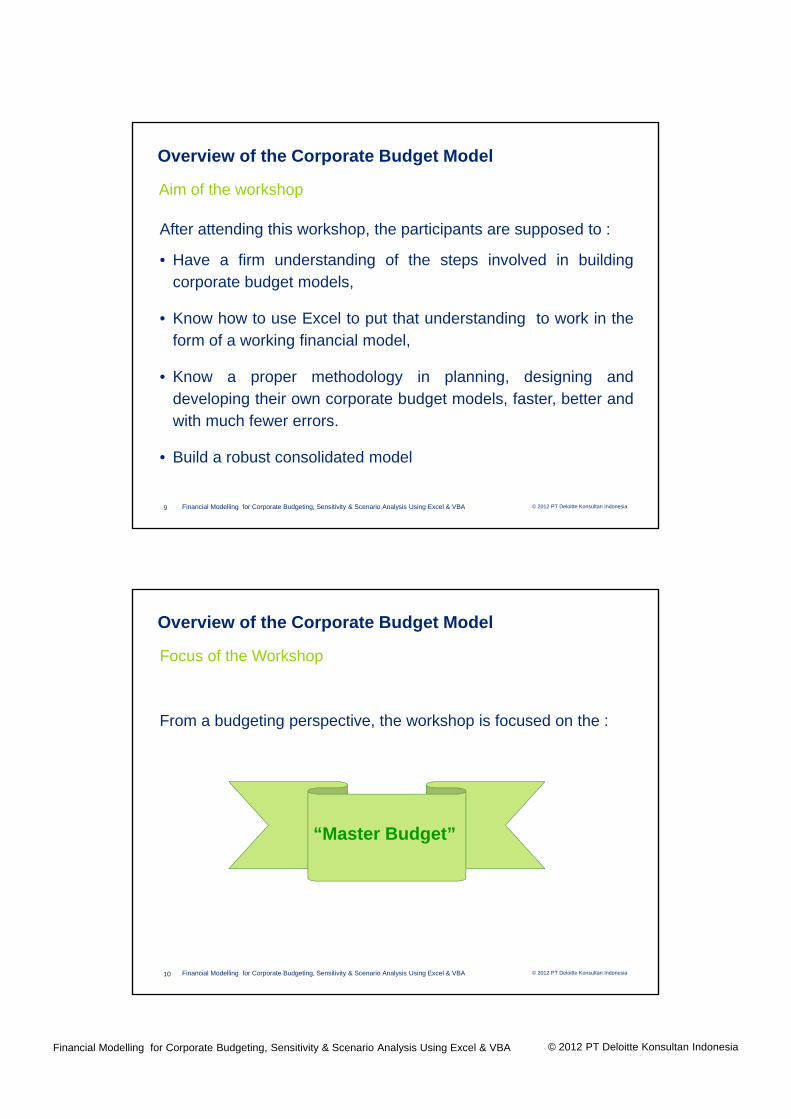
Overview of the Corporate Budget Model
Definition of Budget
Cambridge Dictionary
Budget : a plan to show how much money a person or organization will earn and how much they will need or be able to spend.
Fact in the Business World
• Business use several different types of budgets to manage their operations.
• Whatever form various budgets may take, the primary goal of all budgets is to provide a tangible and quantifiable estimate of the receipt and allocation of resources.

© 2012 PT Deloitte Konsultan IndonesiaFinancial Modelling for Corporate Budgeting, Sensitivity & Scenario Analysis Using Excel & VBA
© 2012 PT Deloitte Konsultan IndonesiaFinancial Modelling for Corporate Budgeting, Sensitivity & Scenario Analysis Using Excel & VBA7
Overview of the Corporate Budget Model
Definition of Corporate Budget Model
Corporate Budget Model is a quantitative representation of a company’s plan to achieve its short-term goals and objectives.
• Goals may be long term (5 to 10 years), but to meet long-term goals, it is necessary to develop short-term strategies that are incorporated into annual budgets.
• A budget should not be seen simply as means of limiting expenditure or checking staff performance, but as a tool for planning, coordinating and controlling the effective and efficient use of resources so that the organization's daily operations are directed towards its long-term goals.
© 2012 PT Deloitte Konsultan IndonesiaFinancial Modelling for Corporate Budgeting, Sensitivity & Scenario Analysis Using Excel & VBA8
What some experts said about spreadsheet models
John Sterman (professor of management at the MIT)
“as a result of the spreadsheet errors the average quality offinancial models has plummeted (crashed down) and many modelsare not only useless but downright harmful to decision-makers”.
European Spreadsheet Risk Interest Group (EuSpRIG)
“in 2004 a large financial institution inaccurately presented itsfinancial report with US$ 1 billion discrepancy”.
Trans-Alta Corp
Trans-Alta Corp reported a loss of US$ 24 million due tospreadsheet errors when executing a hedging contract.
Overview of the Corporate Budget Model
© 2012 PT Deloitte Konsultan IndonesiaFinancial Modelling for Corporate Budgeting, Sensitivity & Scenario Analysis Using Excel & VBA
© 2012 PT Deloitte Konsultan IndonesiaFinancial Modelling for Corporate Budgeting, Sensitivity & Scenario Analysis Using Excel & VBA9
Aim of the workshop
• Have a firm understanding of the steps involved in buildingcorporate budget models,
• Know how to use Excel to put that understanding to work in theform of a working financial model,
• Know a proper methodology in planning, designing anddeveloping their own corporate budget models, faster, better andwith much fewer errors.
• Build a robust consolidated model
After attending this workshop, the participants are supposed to :
Overview of the Corporate Budget Model
© 2012 PT Deloitte Konsultan IndonesiaFinancial Modelling for Corporate Budgeting, Sensitivity & Scenario Analysis Using Excel & VBA10
Focus of the Workshop
From a budgeting perspective, the workshop is focused on the :
“Master Budget”
Overview of the Corporate Budget Model

© 2012 PT Deloitte Konsultan IndonesiaFinancial Modelling for Corporate Budgeting, Sensitivity & Scenario Analysis Using Excel & VBA
© 2012 PT Deloitte Konsultan IndonesiaFinancial Modelling for Corporate Budgeting, Sensitivity & Scenario Analysis Using Excel & VBA11
Components of the Master Budget
Capital Budget Cash Budget Budgeted Balance Sheet
Budgeted Statement of Income
Cost-of-Goods Sold Budget
Sales and Collections Budget
Operating Expenses Budget
Inventory and Purchases Budget
Operating Budget
Financial Budget
Overview of the Corporate Budget Model
© 2012 PT Deloitte Konsultan IndonesiaFinancial Modelling for Corporate Budgeting, Sensitivity & Scenario Analysis Using Excel & VBA12
Corporate Budget Model
[Display the excel format of corporate budget model]
Overview of the Corporate Budget Model
© 2012 PT Deloitte Konsultan IndonesiaFinancial Modelling for Corporate Budgeting, Sensitivity & Scenario Analysis Using Excel & VBA
© 2012 PT Deloitte Konsultan IndonesiaFinancial Modelling for Corporate Budgeting, Sensitivity & Scenario Analysis Using Excel & VBA13
Financial Modellingfor Corporate Budgeting,Sensitivity & Scenario Analysis
Day 1 Session 1b:Financial Modelling Design Principles
© 2012 PT Deloitte Konsultan IndonesiaFinancial Modelling for Corporate Budgeting, Sensitivity & Scenario Analysis Using Excel & VBA14
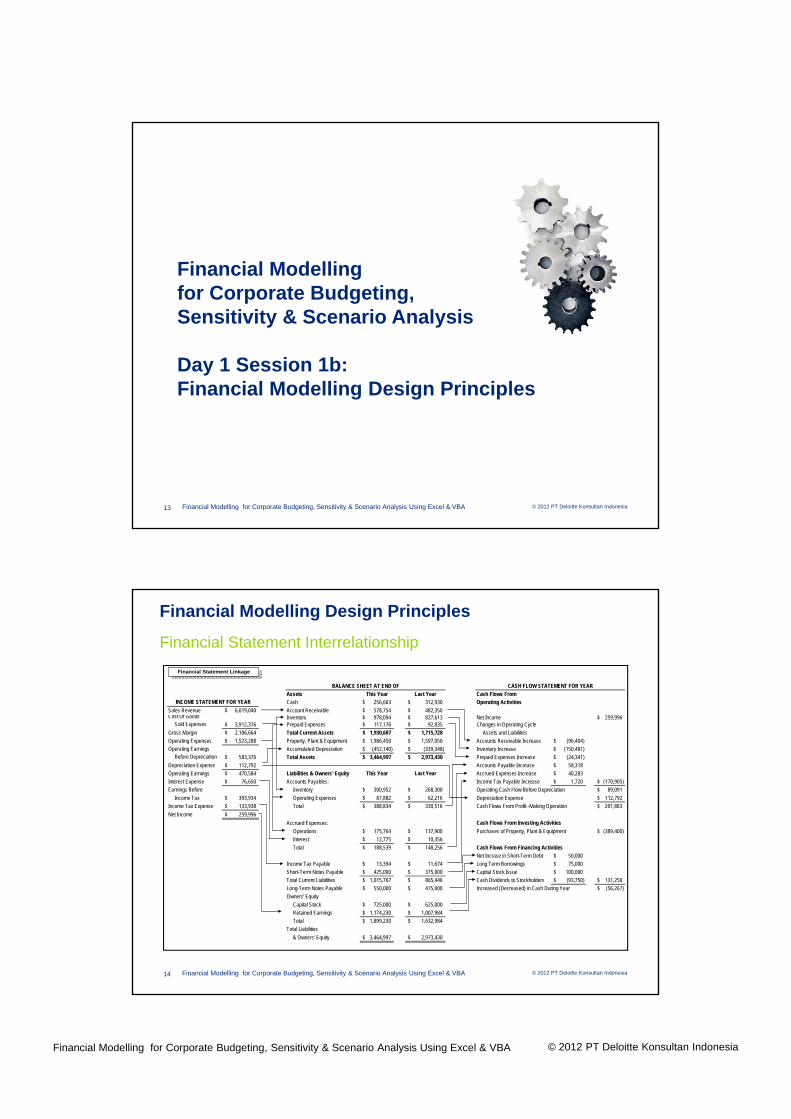
Financial Modelling Design Principles
Assets This Year Last Year Cash Flows From
Cash 256,663$ 312,930$ Operating Activities
Sales Revenue 6,019,040$ Account Receivable 578,754$ 482,350$ Cost Of Goods Inventory 978,094$ 827,613$ Net Income 259,996$ Sold Expenses 3,912,376$ Prepaid Expenses 117,176$ 92,835$ Changes in Operating Cycle
Gross Margin 2,106,664$ Total Current Assets 1,930,687$ 1,715,728$ Assets and Liabilities
Operating Expenses 1,523,288$ Property, Plant & Equipment 1,986,450$ 1,597,050$ Accounts Receivable Increase (96,404)$ Operating Earnings Accumulated Depreciation (452,140)$ (339,348)$ Inventory Increase (150,481)$ Before Depreciation 583,376$ Total Assets 3,464,997$ 2,973,430$ Prepaid Expenses Increase (24,341)$
Depreciation Expense 112,792$ Accounts Payable Increase 58,318$
Operating Earnings 470,584$ Liabilities & Owners' Equity This Year Last Year Accrued Expenses Increase 40,283$
Interest Expense 76,650$ Accounts Payables: Income Tax Payable Increase 1,720$ (170,905)$
Earnings Before Inventory 300,952$ 268,300$ Operating Cash Flow Before Depreciation 89,091$
Income Tax 393,934$ Operating Expenses 87,882$ 62,216$ Depreciation Expense 112,792$
Income Tax Expense 133,938$ Total 388,834$ 330,516$ Cash Flows From Profit -Making Operation 201,883$
Net Income 259,996$
Accrued Expenses: Cash Flows From Investing Activities
Operations 175,764$ 137,900$ Purchases of Property, Plant & Equipment (389,400)$
Interest 12,775$ 10,356$
Total 188,539$ 148,256$ Cash Flows From Financing Activities
Net Incrase in Short-Term Debt 50,000$
Income Tax Payable 13,394$ 11,674$ Long Term Borrowings 75,000$
Short-Term Notes Payable 425,000$ 375,000$ Capital Stock Issue 100,000$
Total Current Liabilities 1,015,767$ 865,446$ Cash Dividends to Stockholders (93,750)$ 131,250$
Long-Term Notes Payable 550,000$ 475,000$ Increased (Decreased) in Cash During Year (56,267)$
Owners' Equity
Capital Stock 725,000$ 625,000$
Retained Earnings 1,174,230$ 1,007,984$
Total 1,899,230$ 1,632,984$
Total Liabilities
& Owners' Equity 3,464,997$ 2,973,430$
INCOME STATEMENT FOR YEAR
BALANCE SHEET AT END OF CASH FLOW STATEMENT FOR YEAR
Financial Statement Linkage
Financial Statement Interrelationship
© 2012 PT Deloitte Konsultan IndonesiaFinancial Modelling for Corporate Budgeting, Sensitivity & Scenario Analysis Using Excel & VBA
© 2012 PT Deloitte Konsultan IndonesiaFinancial Modelling for Corporate Budgeting, Sensitivity & Scenario Analysis Using Excel & VBA15
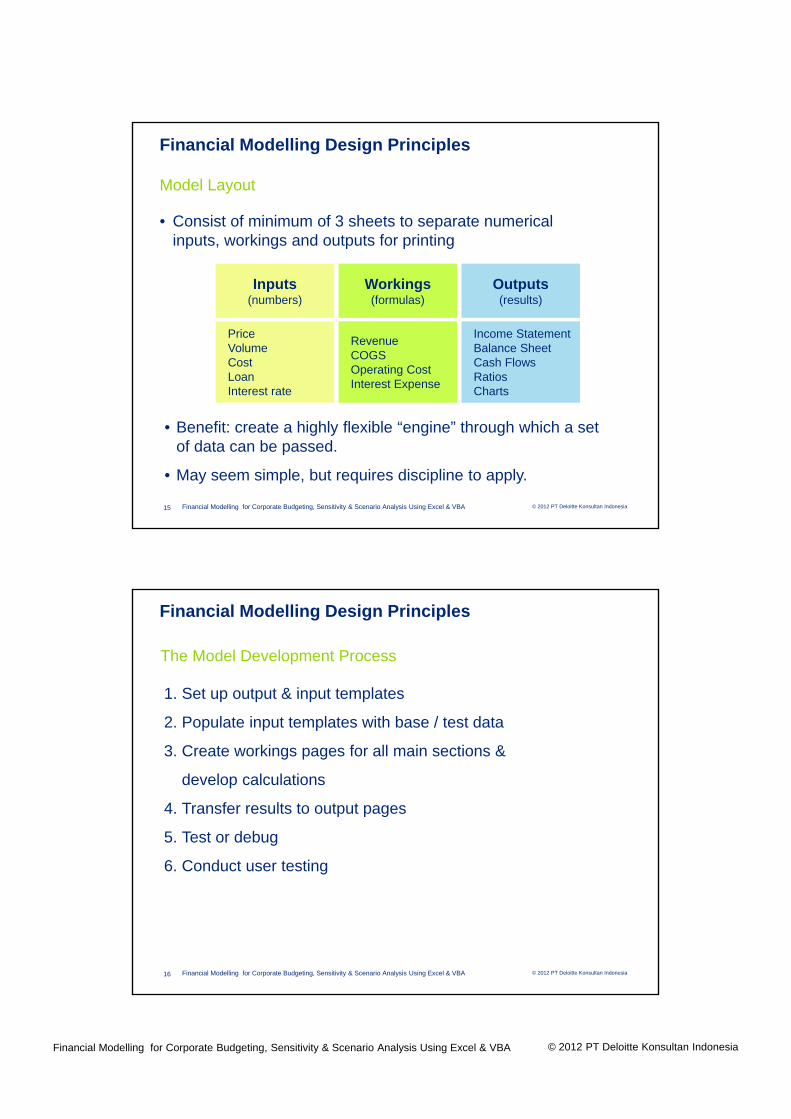
Model Layout
• Benefit: create a highly flexible “engine” through which a set of data can be passed.
• May seem simple, but requires discipline to apply.
• Consist of minimum of 3 sheets to separate numerical inputs, workings and outputs for printing
Inputs(numbers)
Workings(formulas)
Outputs(results)
PriceVolumeCostLoanInterest rate
RevenueCOGSOperating CostInterest Expense
Income StatementBalance SheetCash FlowsRatiosCharts
Financial Modelling Design Principles
© 2012 PT Deloitte Konsultan IndonesiaFinancial Modelling for Corporate Budgeting, Sensitivity & Scenario Analysis Using Excel & VBA16
The Model Development Process
1. Set up output & input templates
2. Populate input templates with base / test data
3. Create workings pages for all main sections &
develop calculations
4. Transfer results to output pages
5. Test or debug
6. Conduct user testing
Financial Modelling Design Principles
© 2012 PT Deloitte Konsultan IndonesiaFinancial Modelling for Corporate Budgeting, Sensitivity & Scenario Analysis Using Excel & VBA
© 2012 PT Deloitte Konsultan IndonesiaFinancial Modelling for Corporate Budgeting, Sensitivity & Scenario Analysis Using Excel & VBA17
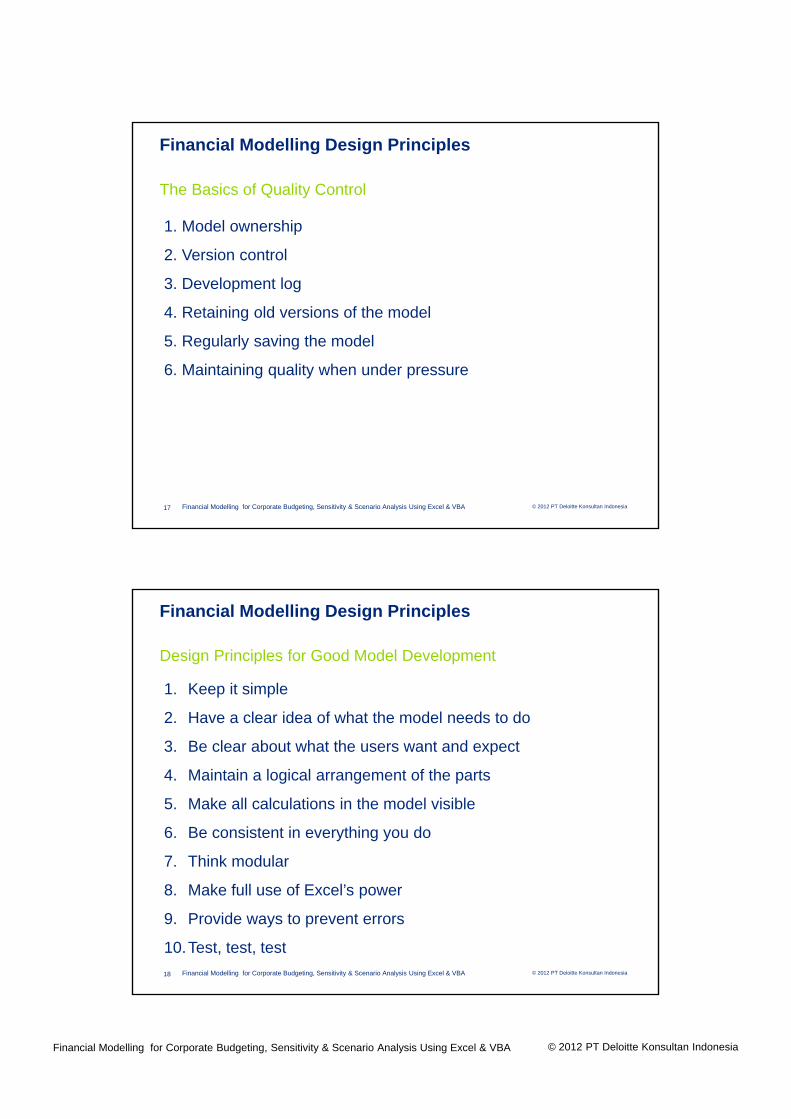
1. Model ownership
2. Version control
3. Development log
4. Retaining old versions of the model
5. Regularly saving the model
6. Maintaining quality when under pressure
The Basics of Quality Control
Financial Modelling Design Principles
© 2012 PT Deloitte Konsultan IndonesiaFinancial Modelling for Corporate Budgeting, Sensitivity & Scenario Analysis Using Excel & VBA18
1. Keep it simple
2. Have a clear idea of what the model needs to do
3. Be clear about what the users want and expect
4. Maintain a logical arrangement of the parts
5. Make all calculations in the model visible
6. Be consistent in everything you do
7. Think modular
8. Make full use of Excel’s power
9. Provide ways to prevent errors
10.Test, test, test
Design Principles for Good Model Development
Financial Modelling Design Principles
© 2012 PT Deloitte Konsultan IndonesiaFinancial Modelling for Corporate Budgeting, Sensitivity & Scenario Analysis Using Excel & VBA
© 2012 PT Deloitte Konsultan IndonesiaFinancial Modelling for Corporate Budgeting, Sensitivity & Scenario Analysis Using Excel & VBA19
Financial Modellingfor Corporate Budgeting,Sensitivity & Scenario Analysis
Day 1 Session 1c:Corporate Budget Model Flow Chart
© 2012 PT Deloitte Konsultan IndonesiaFinancial Modelling for Corporate Budgeting, Sensitivity & Scenario Analysis Using Excel & VBA20
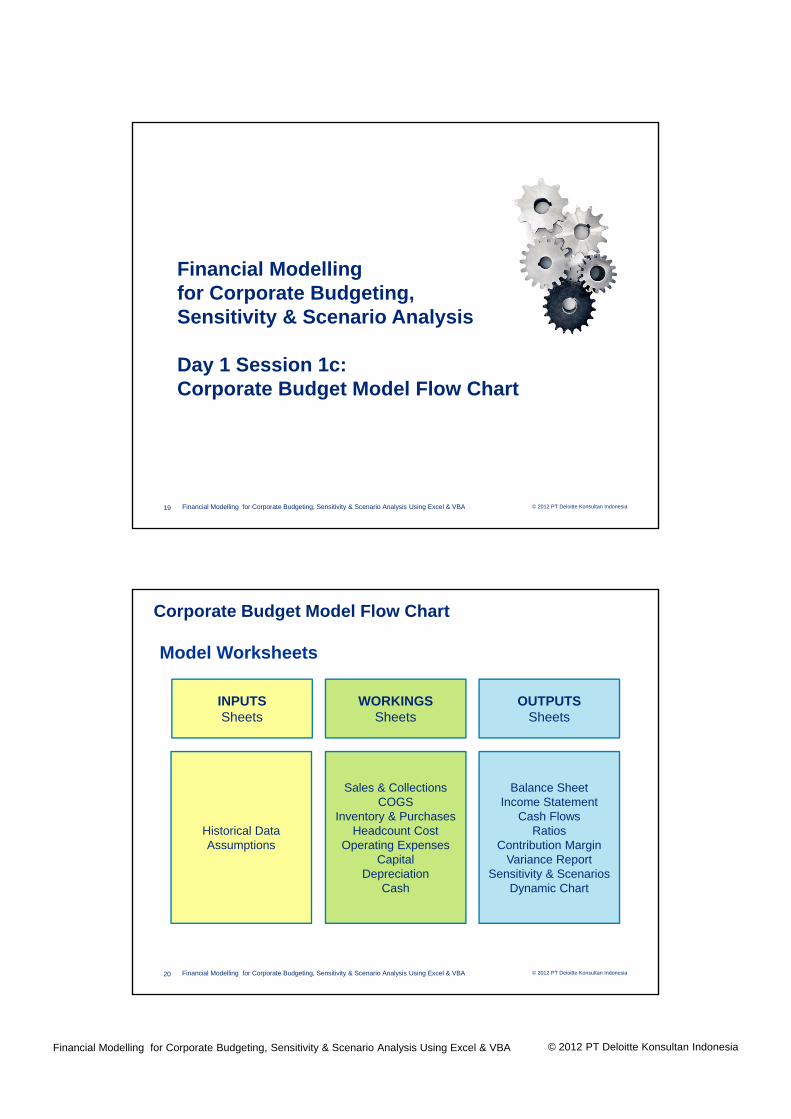
Corporate Budget Model Flow Chart
Model Worksheets
INPUTSSheets
WORKINGSSheets
Sales & CollectionsCOGS
Inventory & PurchasesHeadcount Cost
Operating ExpensesCapital
DepreciationCash
Historical DataAssumptions
Balance SheetIncome Statement
Cash FlowsRatios
Contribution MarginVariance Report
Sensitivity & ScenariosDynamic Chart
OUTPUTSSheets

© 2012 PT Deloitte Konsultan IndonesiaFinancial Modelling for Corporate Budgeting, Sensitivity & Scenario Analysis Using Excel & VBA
© 2012 PT Deloitte Konsultan IndonesiaFinancial Modelling for Corporate Budgeting, Sensitivity & Scenario Analysis Using Excel & VBA21
Step 7: Capital Budget
Step 8: Cash Budget
Step 9: Budgeted Balance Sheet
Step 6: Budgeted Statement of Income
Step 3: Cost-of-Goods Sold Budget
Step 2: Sales and Collections Budget
Step 5: Operating Expenses Budget
Step 4: Inventory and Purchases Budget
Operating Budget
Financial Budget
STEP 1: Assumptions
Corporate Budget Model Flow Chart
© 2012 PT Deloitte Konsultan IndonesiaFinancial Modelling for Corporate Budgeting, Sensitivity & Scenario Analysis Using Excel & VBA22
STEP 2: Sales and Collections Budget
2A: Unit Sales and Price Budget
2B: Sales Composition Budget
2C: Cash Collections from Customers Budget
2D: Accounts Receivable Budget
Corporate Budget Model Flow Chart

© 2012 PT Deloitte Konsultan IndonesiaFinancial Modelling for Corporate Budgeting, Sensitivity & Scenario Analysis Using Excel & VBA
© 2012 PT Deloitte Konsultan IndonesiaFinancial Modelling for Corporate Budgeting, Sensitivity & Scenario Analysis Using Excel & VBA23
STEP 4: Inventory and Purchases Budget
4A: Inventory Budget
4B: Purchases Budget
4C: Disbursement for Purchases Budget
4D: Accounts Payable Budget
STEP 3: Cost-of-Goods-Sold Budget
Corporate Budget Model Flow Chart
© 2012 PT Deloitte Konsultan IndonesiaFinancial Modelling for Corporate Budgeting, Sensitivity & Scenario Analysis Using Excel & VBA24
STEP 5: Operating Expenses Budget
5A: Headcount Budget
5B: Operating Expenses Budget
5C: Disbursement for Operating Expenses Budget
Corporate Budget Model Flow Chart
© 2012 PT Deloitte Konsultan IndonesiaFinancial Modelling for Corporate Budgeting, Sensitivity & Scenario Analysis Using Excel & VBA
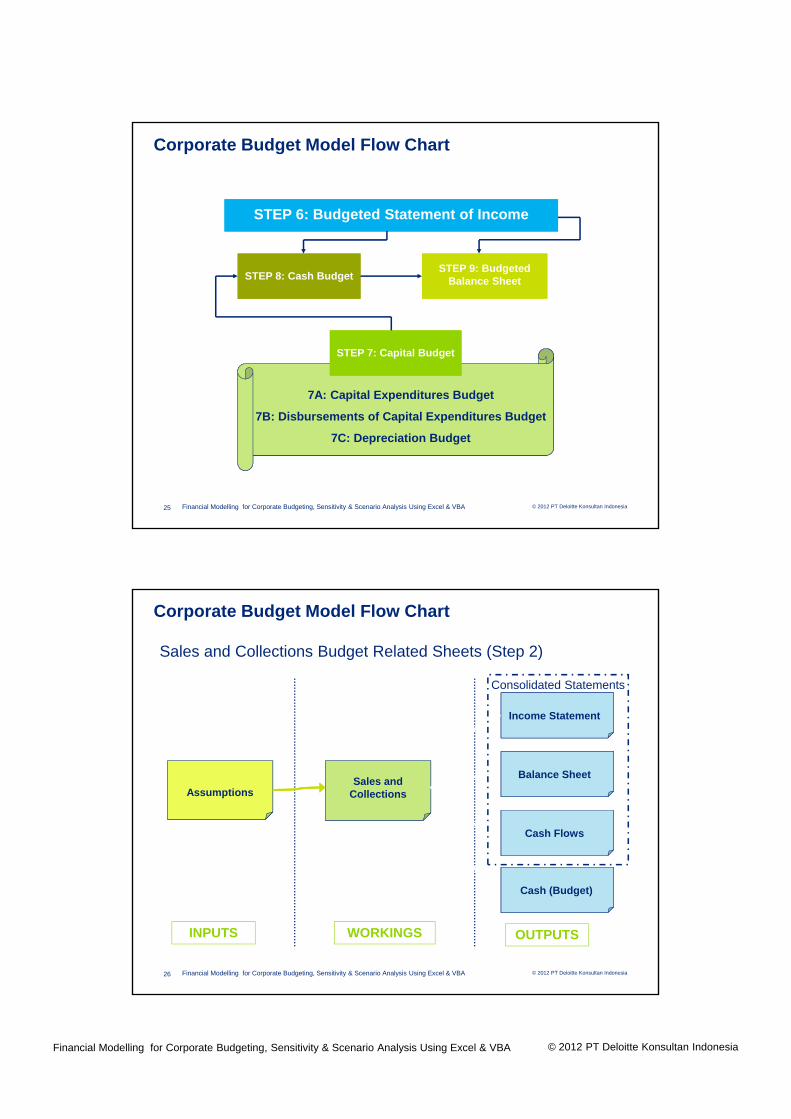
© 2012 PT Deloitte Konsultan IndonesiaFinancial Modelling for Corporate Budgeting, Sensitivity & Scenario Analysis Using Excel & VBA25
STEP 7: Capital Budget
STEP 8: Cash BudgetSTEP 9: Budgeted
Balance Sheet
STEP 6: Budgeted Statement of Income
7A: Capital Expenditures Budget
7B: Disbursements of Capital Expenditures Budget
7C: Depreciation Budget
Corporate Budget Model Flow Chart
© 2012 PT Deloitte Konsultan IndonesiaFinancial Modelling for Corporate Budgeting, Sensitivity & Scenario Analysis Using Excel & VBA26
Sales and Collections Budget Related Sheets (Step 2)
INPUTS WORKINGS OUTPUTS
AssumptionsSales and
Collections
Income Statement
Balance Sheet
Cash Flows
Cash (Budget)
Consolidated Statements
Corporate Budget Model Flow Chart
© 2012 PT Deloitte Konsultan IndonesiaFinancial Modelling for Corporate Budgeting, Sensitivity & Scenario Analysis Using Excel & VBA
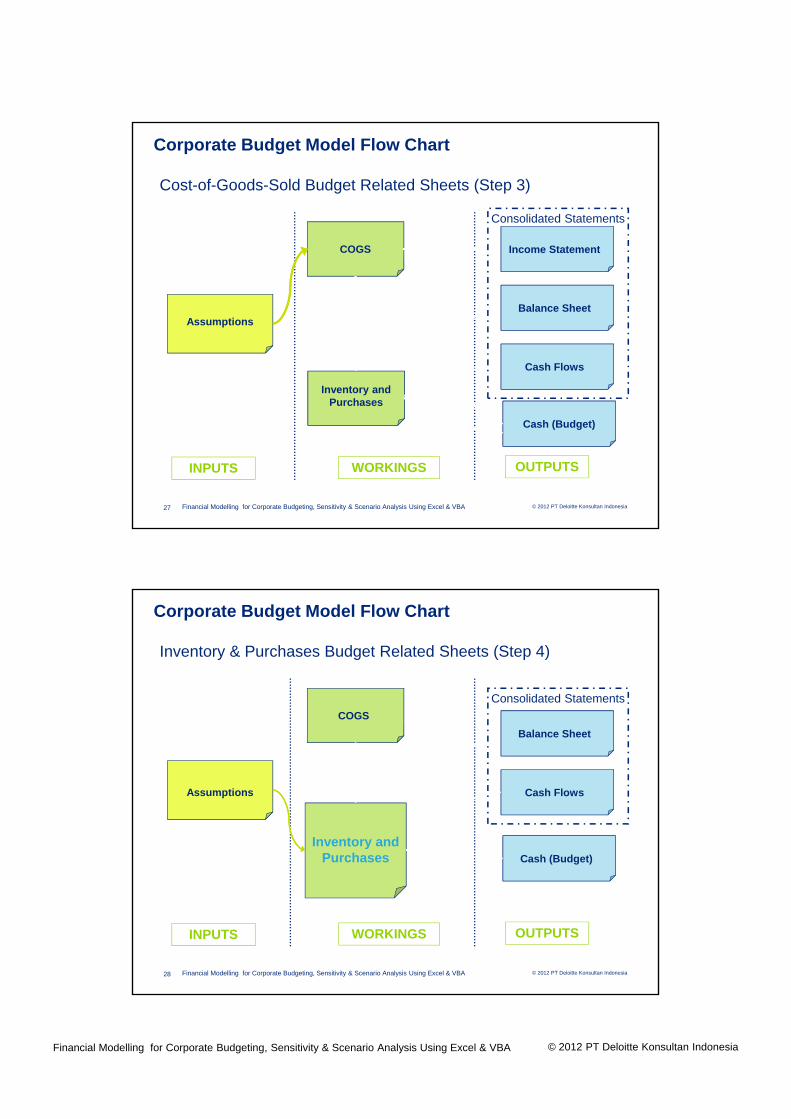
© 2012 PT Deloitte Konsultan IndonesiaFinancial Modelling for Corporate Budgeting, Sensitivity & Scenario Analysis Using Excel & VBA27
Cost-of-Goods-Sold Budget Related Sheets (Step 3)
INPUTS WORKINGS OUTPUTS
Assumptions
Inventory and Purchases
COGS Income Statement
Balance Sheet
Cash Flows
Cash (Budget)
Consolidated Statements
Corporate Budget Model Flow Chart
© 2012 PT Deloitte Konsultan IndonesiaFinancial Modelling for Corporate Budgeting, Sensitivity & Scenario Analysis Using Excel & VBA28
Inventory & Purchases Budget Related Sheets (Step 4)
Assumptions
COGS
Inventory and Purchases
Balance Sheet
Cash Flows
Cash (Budget)
Consolidated Statements
Corporate Budget Model Flow Chart
INPUTS WORKINGS OUTPUTS
© 2012 PT Deloitte Konsultan IndonesiaFinancial Modelling for Corporate Budgeting, Sensitivity & Scenario Analysis Using Excel & VBA
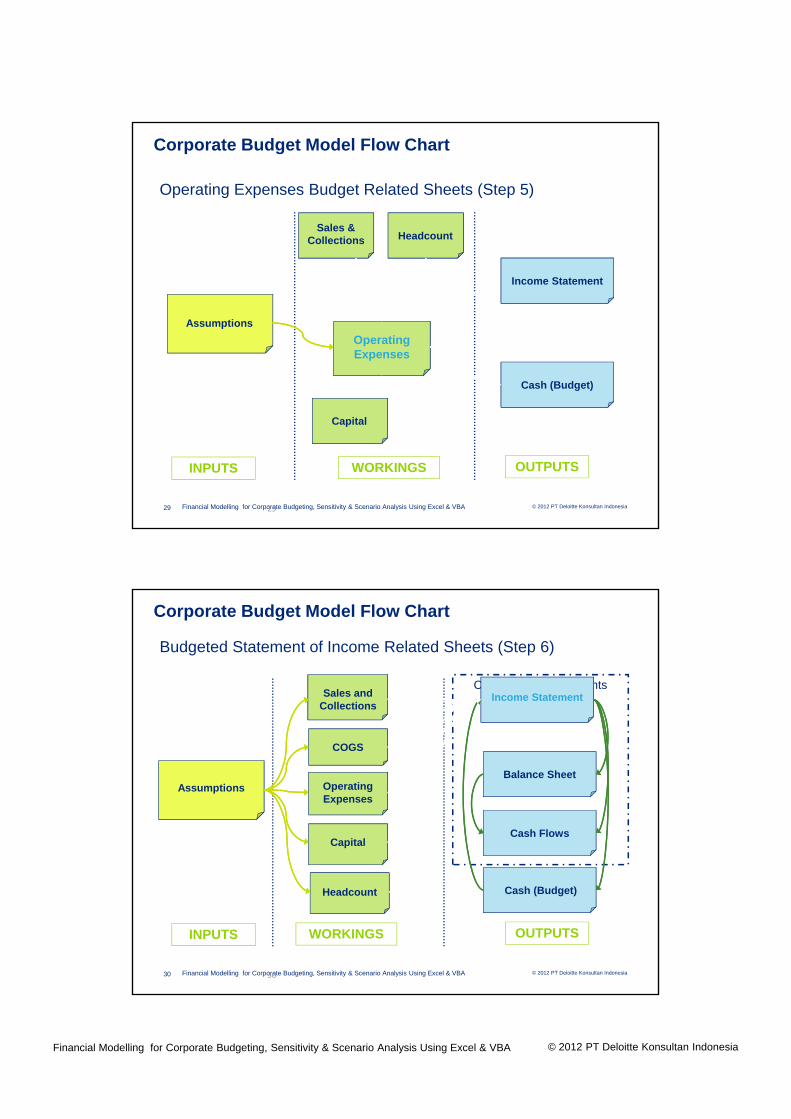
© 2012 PT Deloitte Konsultan IndonesiaFinancial Modelling for Corporate Budgeting, Sensitivity & Scenario Analysis Using Excel & VBA29
Operating Expenses Budget Related Sheets (Step 5)
Assumptions
Operating Expenses
Sales & Collections Headcount
Capital
Income Statement
Cash (Budget)
29
Corporate Budget Model Flow Chart
INPUTS WORKINGS OUTPUTS
© 2012 PT Deloitte Konsultan IndonesiaFinancial Modelling for Corporate Budgeting, Sensitivity & Scenario Analysis Using Excel & VBA30
Consolidated Statements
Budgeted Statement of Income Related Sheets (Step 6)
Assumptions
Capital
Sales and Collections
COGS
Operating Expenses
Income Statement
Balance Sheet
Cash Flows
Cash (Budget)Headcount
30
Corporate Budget Model Flow Chart
INPUTS WORKINGS OUTPUTS
© 2012 PT Deloitte Konsultan IndonesiaFinancial Modelling for Corporate Budgeting, Sensitivity & Scenario Analysis Using Excel & VBA
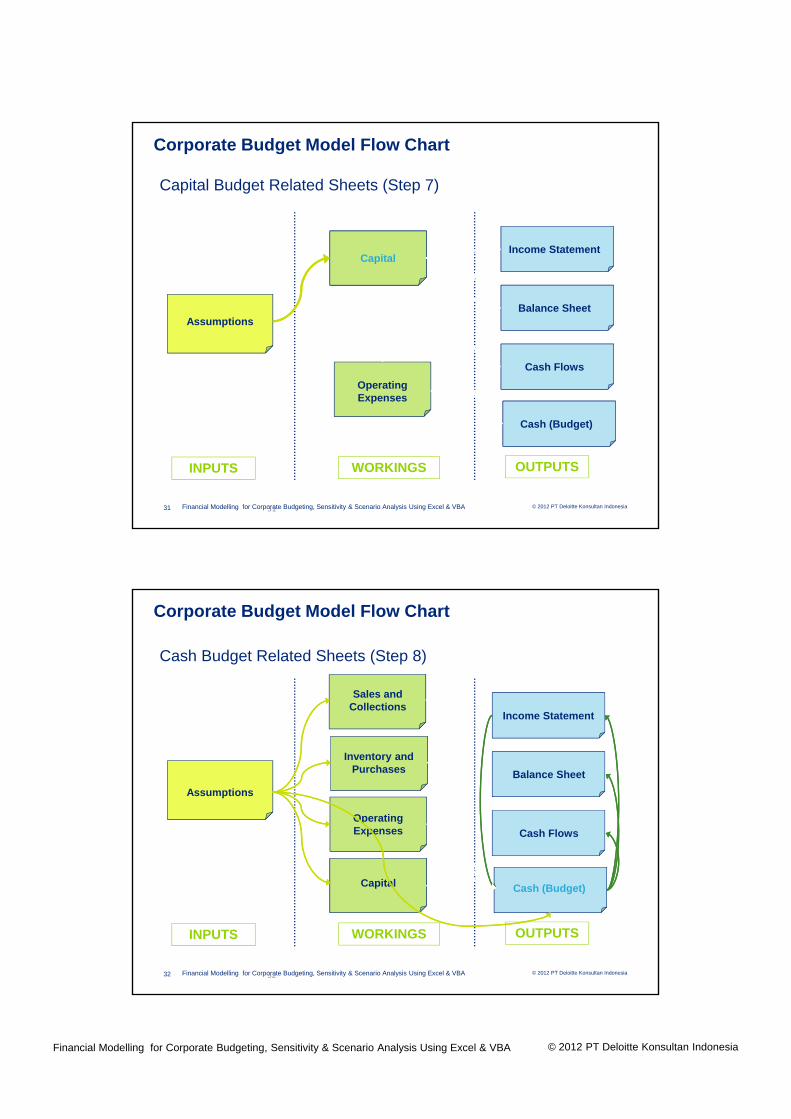
© 2012 PT Deloitte Konsultan IndonesiaFinancial Modelling for Corporate Budgeting, Sensitivity & Scenario Analysis Using Excel & VBA31
Capital Budget Related Sheets (Step 7)
Assumptions
Operating Expenses
CapitalIncome Statement
Balance Sheet
Cash Flows
Cash (Budget)
31
Corporate Budget Model Flow Chart
INPUTS WORKINGS OUTPUTS
© 2012 PT Deloitte Konsultan IndonesiaFinancial Modelling for Corporate Budgeting, Sensitivity & Scenario Analysis Using Excel & VBA32
Cash Budget Related Sheets (Step 8)
Assumptions
Income Statement
Balance Sheet
Cash Flows
Cash (Budget)Capital
Sales and Collections
Inventory and Purchases
Operating Expenses
32
Corporate Budget Model Flow Chart
INPUTS WORKINGS OUTPUTS
© 2012 PT Deloitte Konsultan IndonesiaFinancial Modelling for Corporate Budgeting, Sensitivity & Scenario Analysis Using Excel & VBA
© 2012 PT Deloitte Konsultan IndonesiaFinancial Modelling for Corporate Budgeting, Sensitivity & Scenario Analysis Using Excel & VBA33
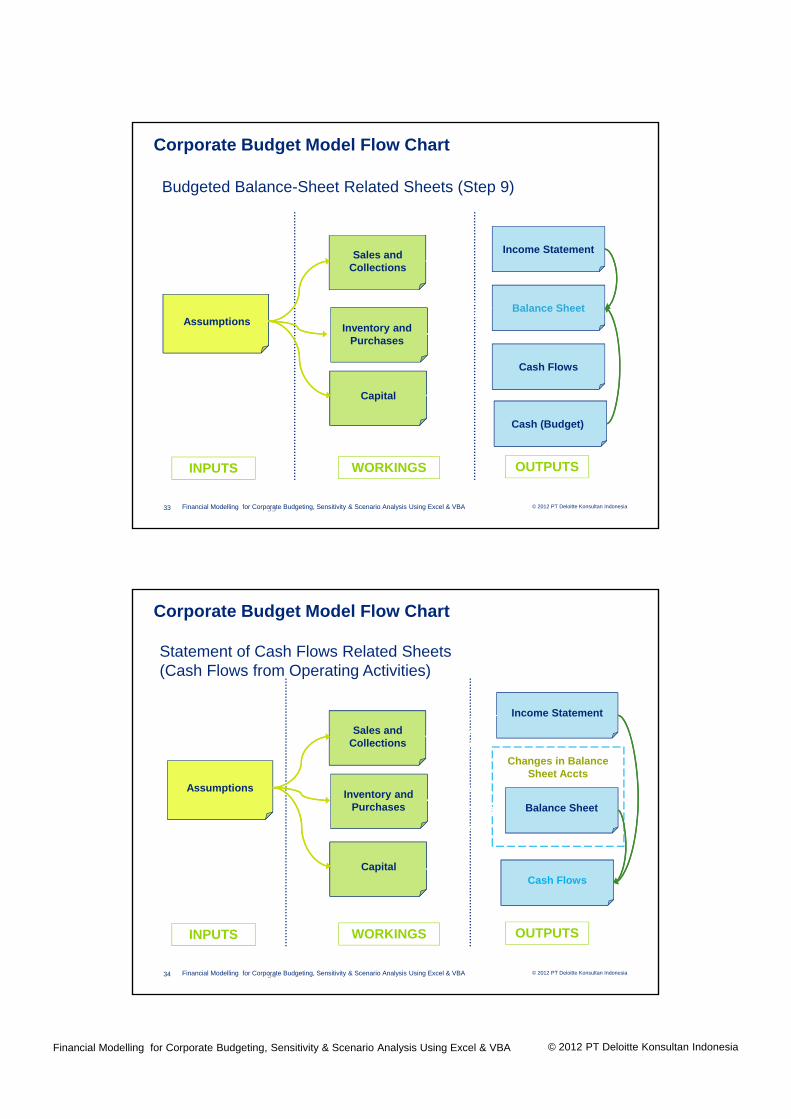
Budgeted Balance-Sheet Related Sheets (Step 9)
Assumptions
Income Statement
Balance Sheet
Cash Flows
Cash (Budget)
Capital
Sales and Collections
Inventory and Purchases
33
Corporate Budget Model Flow Chart
INPUTS WORKINGS OUTPUTS
© 2012 PT Deloitte Konsultan IndonesiaFinancial Modelling for Corporate Budgeting, Sensitivity & Scenario Analysis Using Excel & VBA34
Statement of Cash Flows Related Sheets(Cash Flows from Operating Activities)
Assumptions
Income Statement
Cash FlowsCapital
Sales and Collections
Inventory and Purchases
Changes in Balance Sheet Accts
Balance Sheet
34
Corporate Budget Model Flow Chart
INPUTS WORKINGS OUTPUTS

© 2012 PT Deloitte Konsultan IndonesiaFinancial Modelling for Corporate Budgeting, Sensitivity & Scenario Analysis Using Excel & VBA
© 2012 PT Deloitte Konsultan IndonesiaFinancial Modelling for Corporate Budgeting, Sensitivity & Scenario Analysis Using Excel & VBA35
Statement of Cash Flows Related Sheets (continued) (Cash Flows from Investing Activities)
Assumptions
Capital
Cash Flows
Balance Sheet
Income Statement
35
Corporate Budget Model Flow Chart
INPUTS WORKINGS OUTPUTS
© 2012 PT Deloitte Konsultan IndonesiaFinancial Modelling for Corporate Budgeting, Sensitivity & Scenario Analysis Using Excel & VBA36
Statement of Cash Flows Related Sheets (continued) (Cash Flows from Financing Activities)
Cash Flows
Equity
Balance Sheet
Income Statement
Debt
Assumptions
36
Corporate Budget Model Flow Chart
INPUTS WORKINGS OUTPUTS

© 2012 PT Deloitte Konsultan IndonesiaFinancial Modelling for Corporate Budgeting, Sensitivity & Scenario Analysis Using Excel & VBA
Day 1 - Session 2
© 2012 PT Deloitte Konsultan IndonesiaFinancial Modelling for Corporate Budgeting, Sensitivity & Scenario Analysis Using Excel & VBA38
Financial Modellingfor Corporate Budgeting,Sensitivity & Scenario Analysis
Day 1 Session 2:Modelling Operating Budget:Assumptions, Sales & Collection

© 2012 PT Deloitte Konsultan IndonesiaFinancial Modelling for Corporate Budgeting, Sensitivity & Scenario Analysis Using Excel & VBA
© 2012 PT Deloitte Konsultan IndonesiaFinancial Modelling for Corporate Budgeting, Sensitivity & Scenario Analysis Using Excel & VBA39
Assumptions, Sales & Collection Budget
Capital Budget Cash Budget Budgeted Balance Sheet
Budgeted Statement of Income
Cost-of-Goods Sold Budget
Operating Expenses Budget
Inventory and Purchases Budget
STEP 1: Assumptions
Operating Budget
Financial Budget
Sales and Collections Budget
39
© 2012 PT Deloitte Konsultan IndonesiaFinancial Modelling for Corporate Budgeting, Sensitivity & Scenario Analysis Using Excel & VBA40
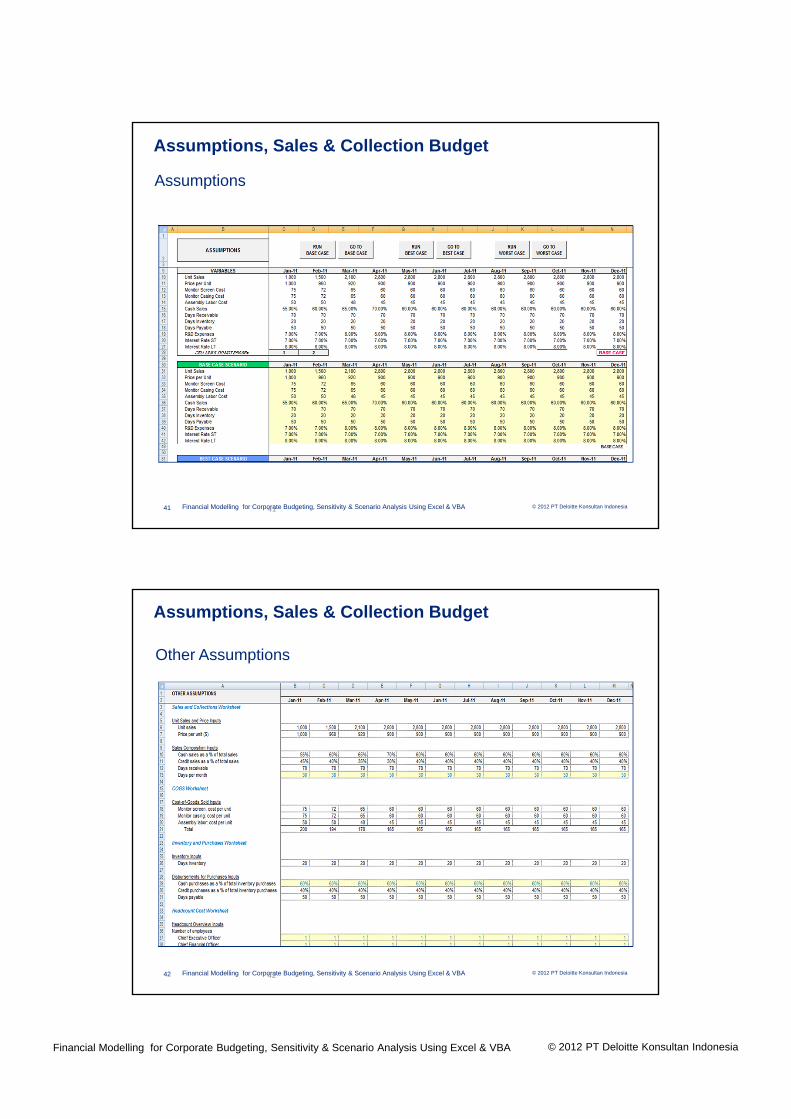
Assumptions
Why is separating Assumption worksheet so important?
• By centralizing all of the input variables into one singlelocation, users can easily test and evaluate the implicationsof changes in the values of input variables across allelements of a financial model.
• To avoid “hard coding” or entering specific input variablesdirectly into a worksheet.
Why is “hard coding” forbidden (“taboo”) in building a financial model?
The resulting calculation or simulation will most probablybe wrong, because the hard codes are hiddensomewhere in many worksheets that we cannot control.
40
Assumptions, Sales & Collection Budget
© 2012 PT Deloitte Konsultan IndonesiaFinancial Modelling for Corporate Budgeting, Sensitivity & Scenario Analysis Using Excel & VBA
© 2012 PT Deloitte Konsultan IndonesiaFinancial Modelling for Corporate Budgeting, Sensitivity & Scenario Analysis Using Excel & VBA41
Assumptions
41
Assumptions, Sales & Collection Budget
© 2012 PT Deloitte Konsultan IndonesiaFinancial Modelling for Corporate Budgeting, Sensitivity & Scenario Analysis Using Excel & VBA42
Other Assumptions
42
Assumptions, Sales & Collection Budget
© 2012 PT Deloitte Konsultan IndonesiaFinancial Modelling for Corporate Budgeting, Sensitivity & Scenario Analysis Using Excel & VBA
© 2012 PT Deloitte Konsultan IndonesiaFinancial Modelling for Corporate Budgeting, Sensitivity & Scenario Analysis Using Excel & VBA43
Capital Budget Cash Budget Budgeted Balance Sheet
Budgeted Statement of Income
Cost-of-Goods Sold Budget
Operating Expenses Budget
Inventory and Purchases Budget
Sales and Collections Budget
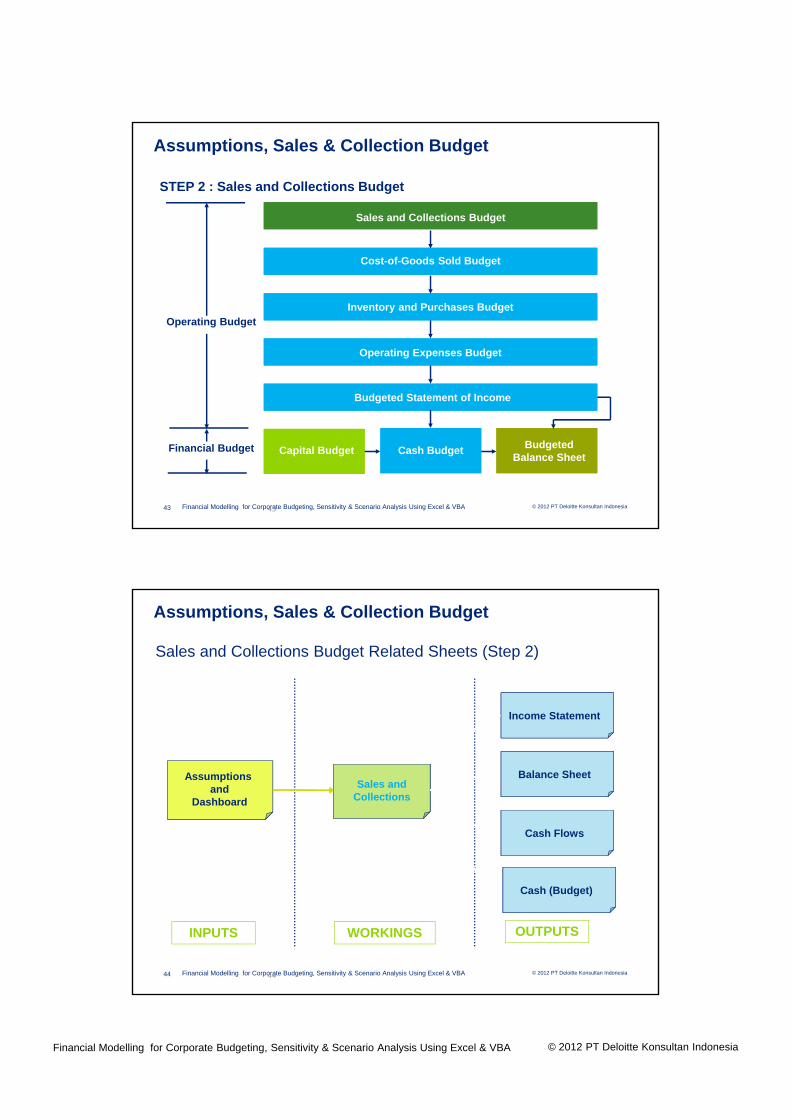
STEP 2 : Sales and Collections Budget
Operating Budget
Financial Budget
43
Assumptions, Sales & Collection Budget
© 2012 PT Deloitte Konsultan IndonesiaFinancial Modelling for Corporate Budgeting, Sensitivity & Scenario Analysis Using Excel & VBA44
Sales and Collections Budget Related Sheets (Step 2)
INPUTS WORKINGS OUTPUTS
Assumptionsand
Dashboard
Sales and Collections
Income Statement
Balance Sheet
Cash Flows
Cash (Budget)
44
Assumptions, Sales & Collection Budget
© 2012 PT Deloitte Konsultan IndonesiaFinancial Modelling for Corporate Budgeting, Sensitivity & Scenario Analysis Using Excel & VBA
© 2012 PT Deloitte Konsultan IndonesiaFinancial Modelling for Corporate Budgeting, Sensitivity & Scenario Analysis Using Excel & VBA45
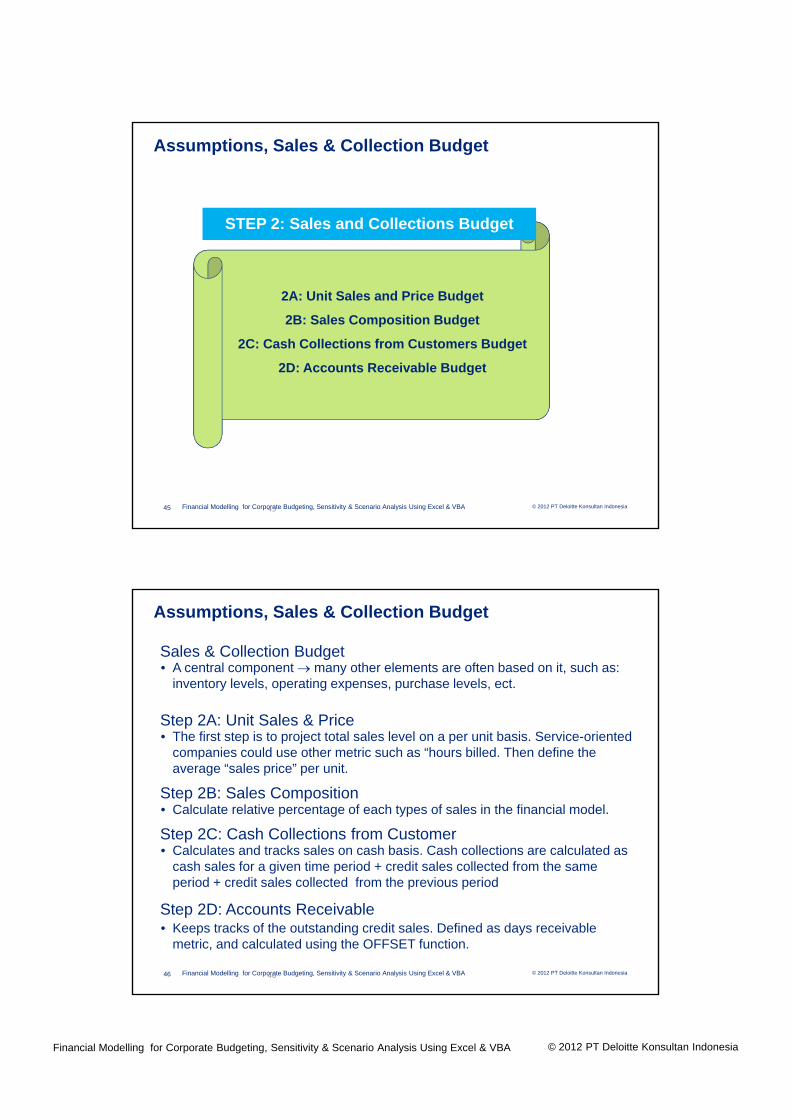
STEP 2: Sales and Collections Budget
2A: Unit Sales and Price Budget
2B: Sales Composition Budget
2C: Cash Collections from Customers Budget
2D: Accounts Receivable Budget
45
Assumptions, Sales & Collection Budget
© 2012 PT Deloitte Konsultan IndonesiaFinancial Modelling for Corporate Budgeting, Sensitivity & Scenario Analysis Using Excel & VBA46
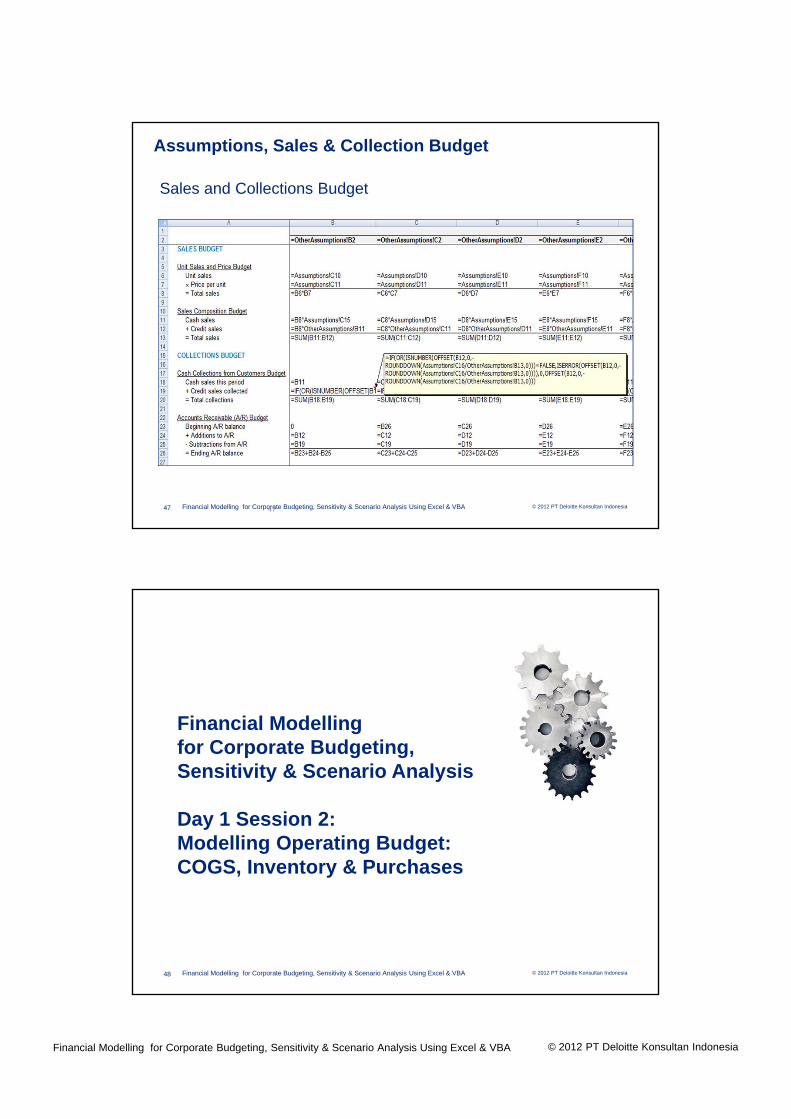
Step 2A: Unit Sales & Price • The first step is to project total sales level on a per unit basis. Service-oriented
companies could use other metric such as “hours billed. Then define the average “sales price” per unit.
Sales & Collection Budget
Step 2B: Sales Composition • Calculate relative percentage of each types of sales in the financial model.
• A central component many other elements are often based on it, such as: inventory levels, operating expenses, purchase levels, ect.
Step 2C: Cash Collections from Customer• Calculates and tracks sales on cash basis. Cash collections are calculated as
cash sales for a given time period + credit sales collected from the same period + credit sales collected from the previous period
Step 2D: Accounts Receivable• Keeps tracks of the outstanding credit sales. Defined as days receivable
metric, and calculated using the OFFSET function.
46
Assumptions, Sales & Collection Budget
© 2012 PT Deloitte Konsultan IndonesiaFinancial Modelling for Corporate Budgeting, Sensitivity & Scenario Analysis Using Excel & VBA
© 2012 PT Deloitte Konsultan IndonesiaFinancial Modelling for Corporate Budgeting, Sensitivity & Scenario Analysis Using Excel & VBA47
Sales and Collections Budget
47
Assumptions, Sales & Collection Budget
© 2012 PT Deloitte Konsultan IndonesiaFinancial Modelling for Corporate Budgeting, Sensitivity & Scenario Analysis Using Excel & VBA48
Financial Modellingfor Corporate Budgeting,Sensitivity & Scenario Analysis
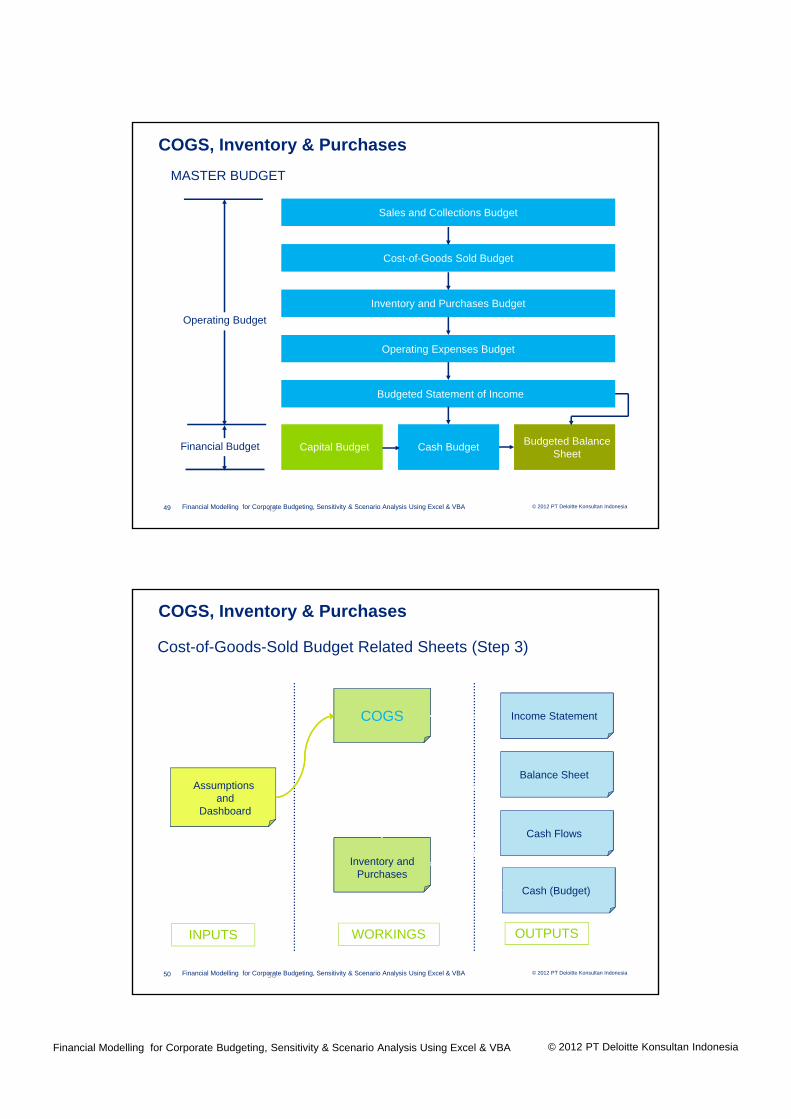
Day 1 Session 2:Modelling Operating Budget:COGS, Inventory & Purchases
© 2012 PT Deloitte Konsultan IndonesiaFinancial Modelling for Corporate Budgeting, Sensitivity & Scenario Analysis Using Excel & VBA
© 2012 PT Deloitte Konsultan IndonesiaFinancial Modelling for Corporate Budgeting, Sensitivity & Scenario Analysis Using Excel & VBA49
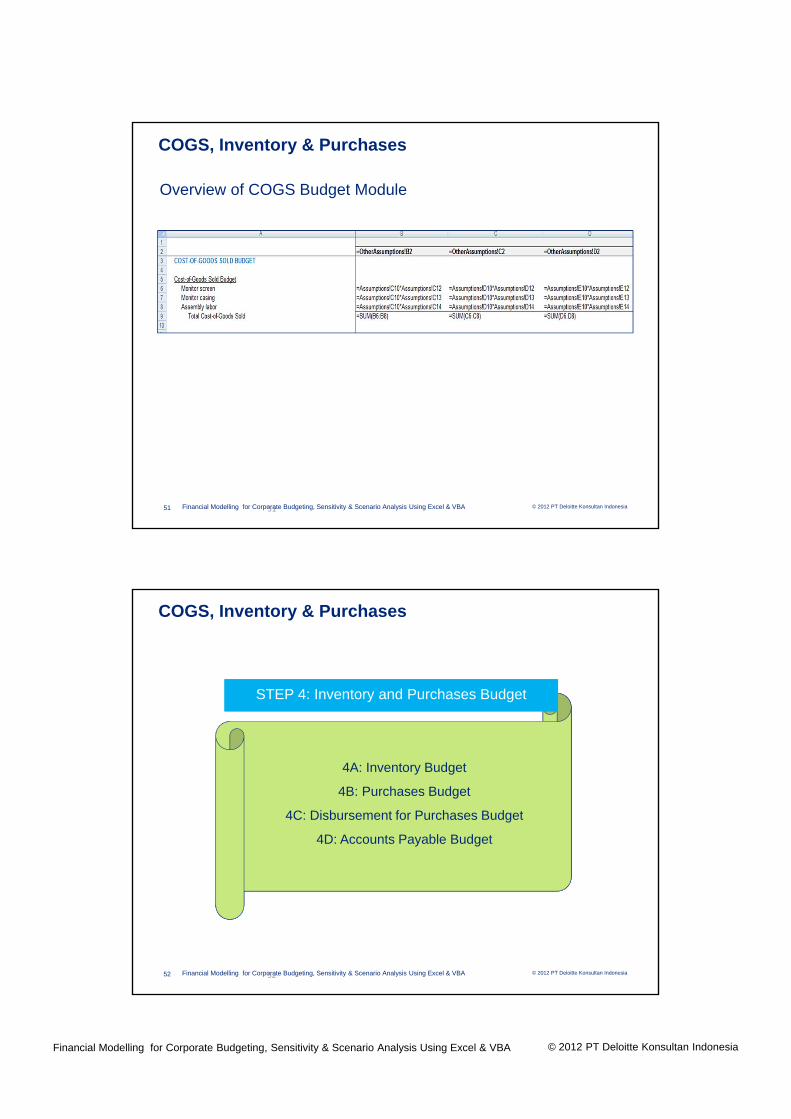
COGS, Inventory & Purchases
Capital Budget Cash Budget Budgeted Balance Sheet
Budgeted Statement of Income
Cost-of-Goods Sold Budget
Sales and Collections Budget
Operating Expenses Budget
Inventory and Purchases Budget
Operating Budget
Financial Budget
MASTER BUDGET
49
© 2012 PT Deloitte Konsultan IndonesiaFinancial Modelling for Corporate Budgeting, Sensitivity & Scenario Analysis Using Excel & VBA50
Cost-of-Goods-Sold Budget Related Sheets (Step 3)
INPUTS WORKINGS OUTPUTS
Assumptionsand
Dashboard
Inventory and Purchases
COGS Income Statement
Balance Sheet
Cash Flows
Cash (Budget)
50
COGS, Inventory & Purchases
© 2012 PT Deloitte Konsultan IndonesiaFinancial Modelling for Corporate Budgeting, Sensitivity & Scenario Analysis Using Excel & VBA
© 2012 PT Deloitte Konsultan IndonesiaFinancial Modelling for Corporate Budgeting, Sensitivity & Scenario Analysis Using Excel & VBA51
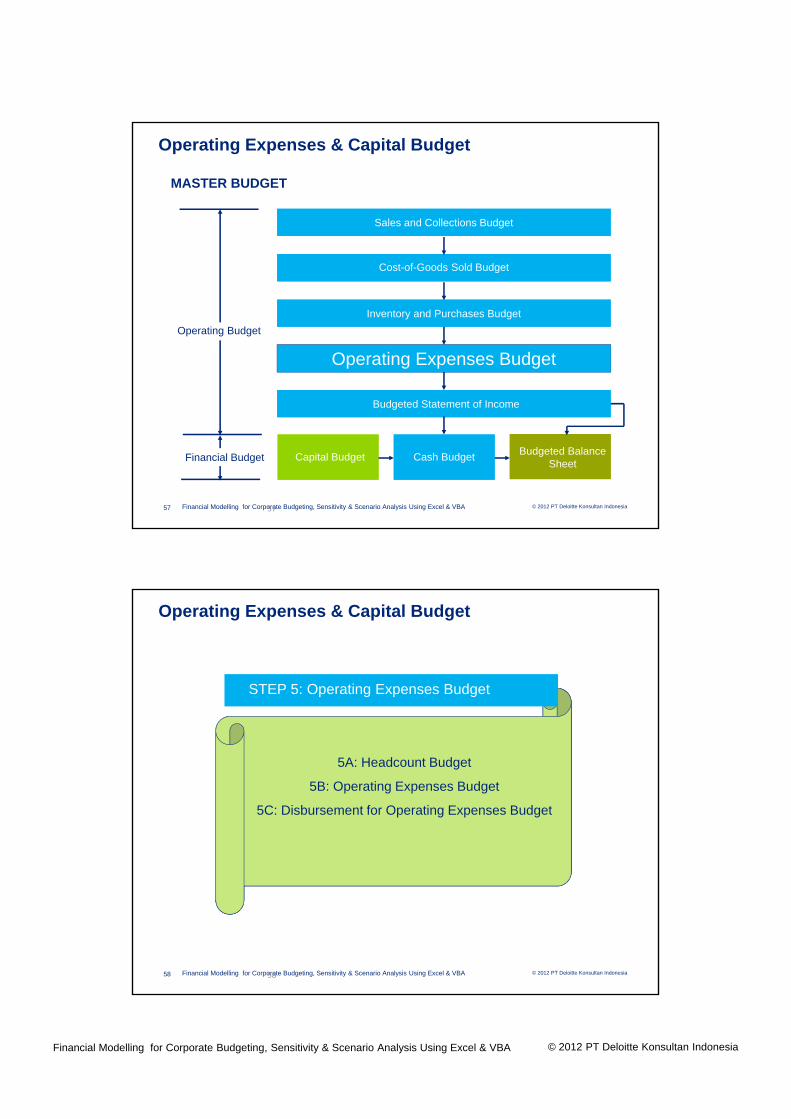
Overview of COGS Budget Module
51
COGS, Inventory & Purchases
© 2012 PT Deloitte Konsultan IndonesiaFinancial Modelling for Corporate Budgeting, Sensitivity & Scenario Analysis Using Excel & VBA52
STEP 4: Inventory and Purchases Budget
4A: Inventory Budget
4B: Purchases Budget
4C: Disbursement for Purchases Budget
4D: Accounts Payable Budget
52
COGS, Inventory & Purchases

© 2012 PT Deloitte Konsultan IndonesiaFinancial Modelling for Corporate Budgeting, Sensitivity & Scenario Analysis Using Excel & VBA
© 2012 PT Deloitte Konsultan IndonesiaFinancial Modelling for Corporate Budgeting, Sensitivity & Scenario Analysis Using Excel & VBA53
Inventory & Purchases Budget Related Sheets (Step 4)
INPUTS WORKINGS OUTPUTS
Assumptionsand
Dashboard
COGS
Inventory and Purchases
Balance Sheet
Cash Flows
Cash (Budget)
53
COGS, Inventory & Purchases
© 2012 PT Deloitte Konsultan IndonesiaFinancial Modelling for Corporate Budgeting, Sensitivity & Scenario Analysis Using Excel & VBA54
Inventory & Purchases Budget Module
54
COGS, Inventory & Purchases

© 2012 PT Deloitte Konsultan IndonesiaFinancial Modelling for Corporate Budgeting, Sensitivity & Scenario Analysis Using Excel & VBA
Day 1 - Session 3
© 2012 PT Deloitte Konsultan IndonesiaFinancial Modelling for Corporate Budgeting, Sensitivity & Scenario Analysis Using Excel & VBA56
Financial Modellingfor Corporate Budgeting,Sensitivity & Scenario Analysis
Day 1 Session 3:Modelling Operating Expenses& Capital Budget
© 2012 PT Deloitte Konsultan IndonesiaFinancial Modelling for Corporate Budgeting, Sensitivity & Scenario Analysis Using Excel & VBA
© 2012 PT Deloitte Konsultan IndonesiaFinancial Modelling for Corporate Budgeting, Sensitivity & Scenario Analysis Using Excel & VBA57
Operating Expenses & Capital Budget
Capital Budget Cash Budget Budgeted Balance Sheet
Budgeted Statement of Income
Cost-of-Goods Sold Budget
Sales and Collections Budget
Operating Expenses Budget
Inventory and Purchases Budget
Operating Budget
Financial Budget
MASTER BUDGET
57
© 2012 PT Deloitte Konsultan IndonesiaFinancial Modelling for Corporate Budgeting, Sensitivity & Scenario Analysis Using Excel & VBA58
STEP 5: Operating Expenses Budget
5A: Headcount Budget
5B: Operating Expenses Budget
5C: Disbursement for Operating Expenses Budget
58
Operating Expenses & Capital Budget
© 2012 PT Deloitte Konsultan IndonesiaFinancial Modelling for Corporate Budgeting, Sensitivity & Scenario Analysis Using Excel & VBA
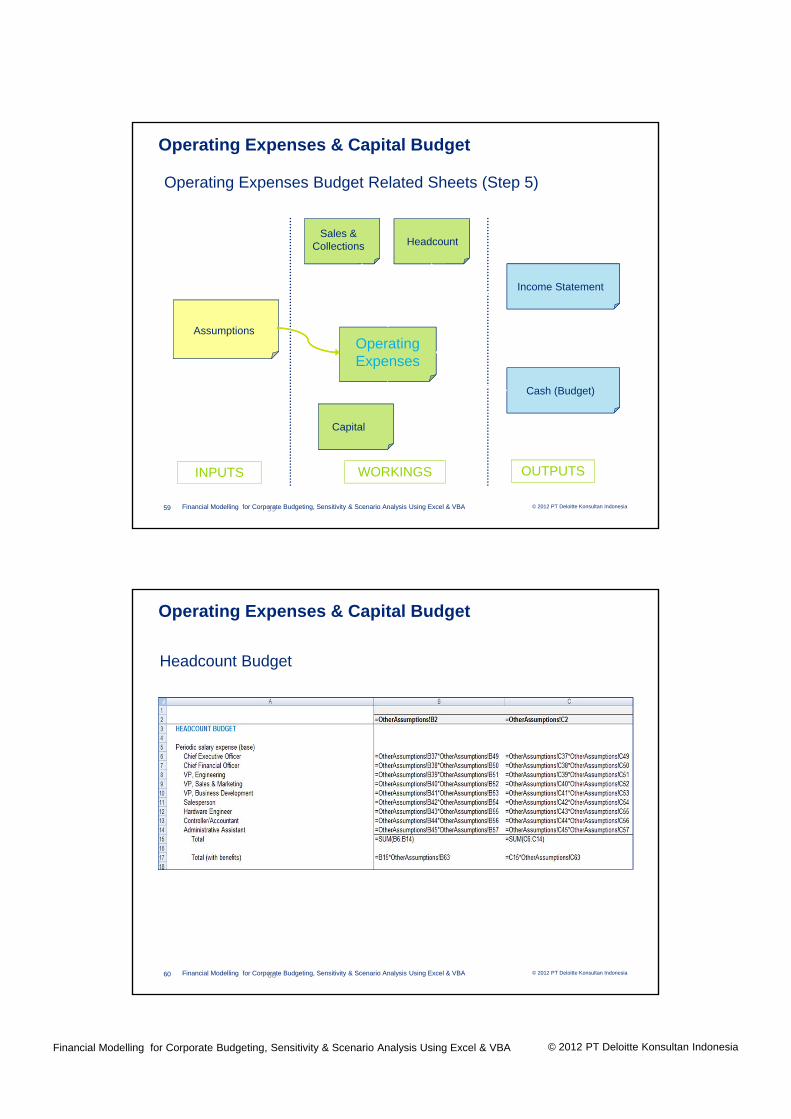
© 2012 PT Deloitte Konsultan IndonesiaFinancial Modelling for Corporate Budgeting, Sensitivity & Scenario Analysis Using Excel & VBA59
Operating Expenses Budget Related Sheets (Step 5)
INPUTS WORKINGS OUTPUTS
AssumptionsOperating Expenses
Sales & Collections Headcount
Capital
Income Statement
Cash (Budget)
59
Operating Expenses & Capital Budget
© 2012 PT Deloitte Konsultan IndonesiaFinancial Modelling for Corporate Budgeting, Sensitivity & Scenario Analysis Using Excel & VBA60
Headcount Budget
60
Operating Expenses & Capital Budget
© 2012 PT Deloitte Konsultan IndonesiaFinancial Modelling for Corporate Budgeting, Sensitivity & Scenario Analysis Using Excel & VBA
© 2012 PT Deloitte Konsultan IndonesiaFinancial Modelling for Corporate Budgeting, Sensitivity & Scenario Analysis Using Excel & VBA61
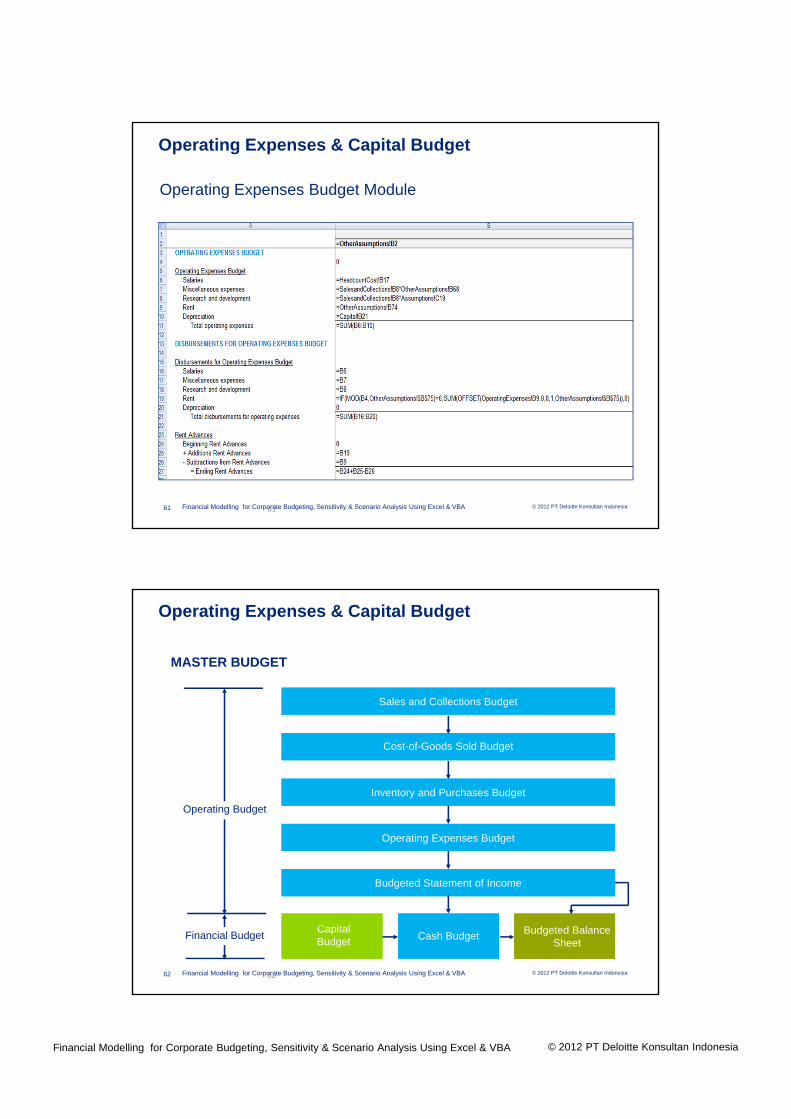
Operating Expenses Budget Module
61
Operating Expenses & Capital Budget
© 2012 PT Deloitte Konsultan IndonesiaFinancial Modelling for Corporate Budgeting, Sensitivity & Scenario Analysis Using Excel & VBA62
Capital Budget Cash Budget Budgeted Balance
Sheet
Budgeted Statement of Income
Cost-of-Goods Sold Budget
Sales and Collections Budget
Operating Expenses Budget
Inventory and Purchases Budget
Operating Budget
Financial Budget
MASTER BUDGET
62
Operating Expenses & Capital Budget
© 2012 PT Deloitte Konsultan IndonesiaFinancial Modelling for Corporate Budgeting, Sensitivity & Scenario Analysis Using Excel & VBA
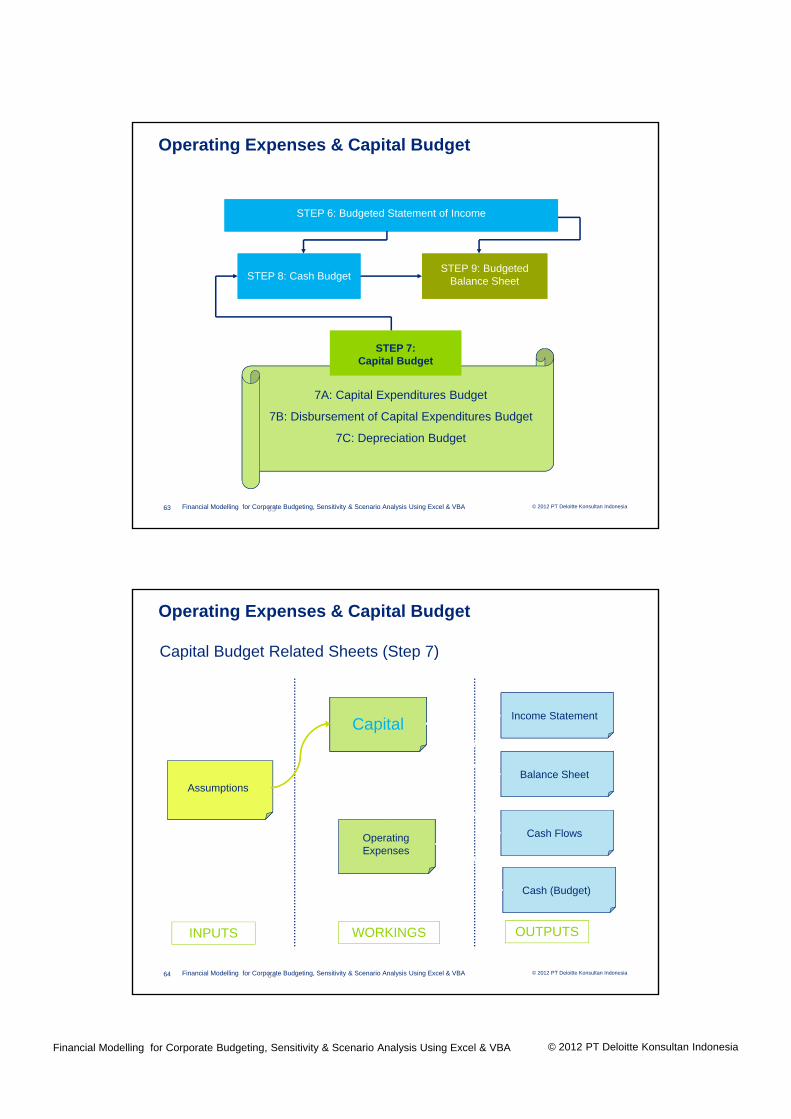
© 2012 PT Deloitte Konsultan IndonesiaFinancial Modelling for Corporate Budgeting, Sensitivity & Scenario Analysis Using Excel & VBA63
STEP 7: Capital Budget
STEP 8: Cash BudgetSTEP 9: Budgeted
Balance Sheet
STEP 6: Budgeted Statement of Income
7A: Capital Expenditures Budget
7B: Disbursement of Capital Expenditures Budget
7C: Depreciation Budget
63
Operating Expenses & Capital Budget
© 2012 PT Deloitte Konsultan IndonesiaFinancial Modelling for Corporate Budgeting, Sensitivity & Scenario Analysis Using Excel & VBA64
Capital Budget Related Sheets (Step 7)
INPUTS WORKINGS OUTPUTS
Assumptions
Operating Expenses
CapitalIncome Statement
Balance Sheet
Cash Flows
Cash (Budget)
64
Operating Expenses & Capital Budget

© 2012 PT Deloitte Konsultan IndonesiaFinancial Modelling for Corporate Budgeting, Sensitivity & Scenario Analysis Using Excel & VBA
© 2012 PT Deloitte Konsultan IndonesiaFinancial Modelling for Corporate Budgeting, Sensitivity & Scenario Analysis Using Excel & VBA65
Depreciation Sheet
65
Operating Expenses & Capital Budget
© 2012 PT Deloitte Konsultan IndonesiaFinancial Modelling for Corporate Budgeting, Sensitivity & Scenario Analysis Using Excel & VBA66
Capital Budget Module
66
Operating Expenses & Capital Budget
© 2012 PT Deloitte Konsultan IndonesiaFinancial Modelling for Corporate Budgeting, Sensitivity & Scenario Analysis Using Excel & VBA
Day 1 - Session 4
© 2012 PT Deloitte Konsultan IndonesiaFinancial Modelling for Corporate Budgeting, Sensitivity & Scenario Analysis Using Excel & VBA68
Financial Modellingfor Corporate Budgeting,Sensitivity & Scenario Analysis
Day 1 Session 4:Modelling Cash Budget, Income Statement& Balance Sheet
© 2012 PT Deloitte Konsultan IndonesiaFinancial Modelling for Corporate Budgeting, Sensitivity & Scenario Analysis Using Excel & VBA
© 2012 PT Deloitte Konsultan IndonesiaFinancial Modelling for Corporate Budgeting, Sensitivity & Scenario Analysis Using Excel & VBA69
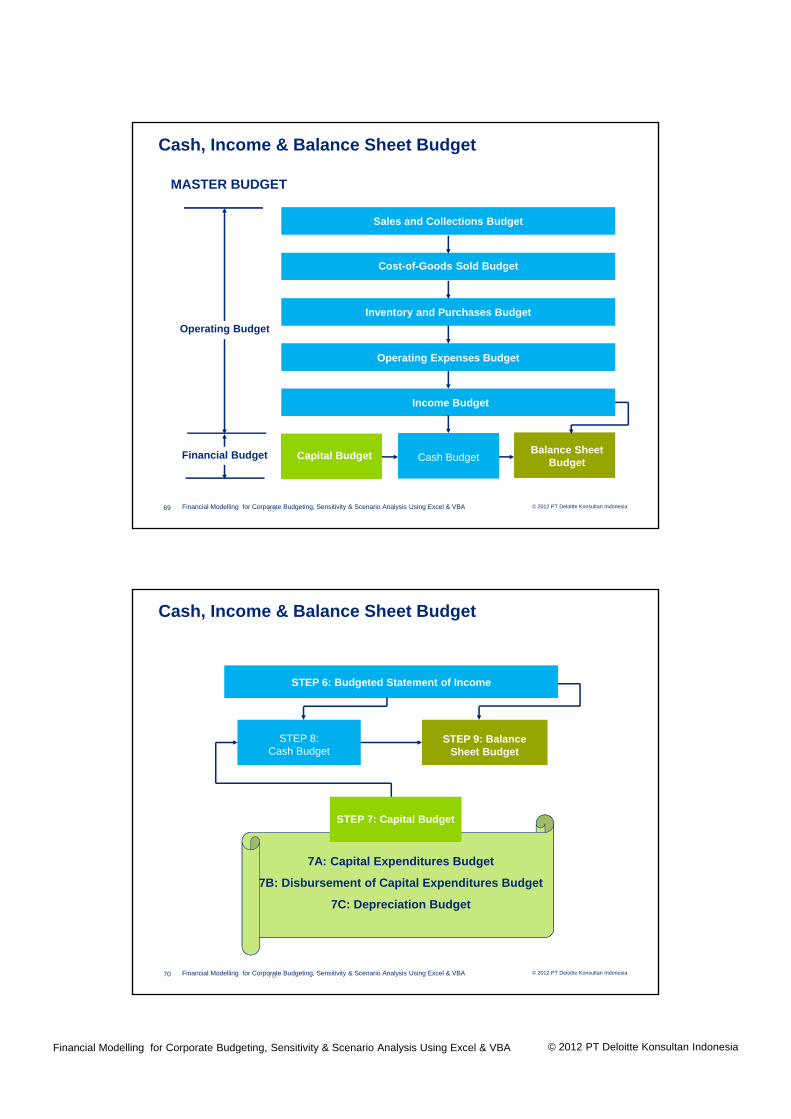
Cash, Income & Balance Sheet Budget
Capital Budget Cash BudgetBalance Sheet
Budget
Income Budget
Cost-of-Goods Sold Budget
Sales and Collections Budget
Operating Expenses Budget
Inventory and Purchases Budget
Operating Budget
Financial Budget
MASTER BUDGET
69
© 2012 PT Deloitte Konsultan IndonesiaFinancial Modelling for Corporate Budgeting, Sensitivity & Scenario Analysis Using Excel & VBA70
STEP 7: Capital Budget
STEP 8:Cash Budget
STEP 9: Balance Sheet Budget
STEP 6: Budgeted Statement of Income
7A: Capital Expenditures Budget
7B: Disbursement of Capital Expenditures Budget
7C: Depreciation Budget
70
Cash, Income & Balance Sheet Budget

© 2012 PT Deloitte Konsultan IndonesiaFinancial Modelling for Corporate Budgeting, Sensitivity & Scenario Analysis Using Excel & VBA
© 2012 PT Deloitte Konsultan IndonesiaFinancial Modelling for Corporate Budgeting, Sensitivity & Scenario Analysis Using Excel & VBA71
Cash Budget Related Sheets (Step 7)
INPUTS WORKINGS OUTPUTS
Assumptions
Income Statement
Balance Sheet
Cash Flows
Cash (Budget)
Capital
Sales and Collections
Inventory and Purchases
Operating Expenses
71
Cash, Income & Balance Sheet Budget
© 2012 PT Deloitte Konsultan IndonesiaFinancial Modelling for Corporate Budgeting, Sensitivity & Scenario Analysis Using Excel & VBA72
Cash Budget Module
72
Cash, Income & Balance Sheet Budget
© 2012 PT Deloitte Konsultan IndonesiaFinancial Modelling for Corporate Budgeting, Sensitivity & Scenario Analysis Using Excel & VBA
© 2012 PT Deloitte Konsultan IndonesiaFinancial Modelling for Corporate Budgeting, Sensitivity & Scenario Analysis Using Excel & VBA73
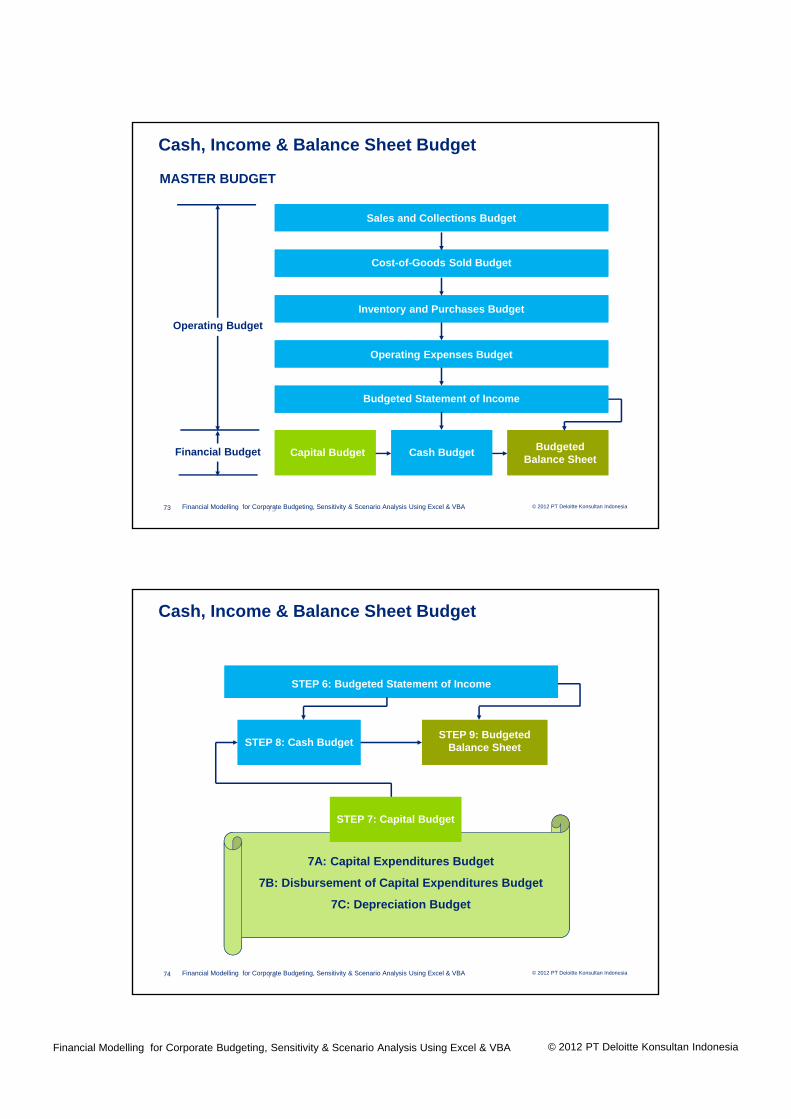
Capital Budget Cash Budget Budgeted Balance Sheet
Budgeted Statement of Income
Cost-of-Goods Sold Budget
Sales and Collections Budget
Operating Expenses Budget
Inventory and Purchases Budget
Operating Budget
Financial Budget
MASTER BUDGET
73
Cash, Income & Balance Sheet Budget
© 2012 PT Deloitte Konsultan IndonesiaFinancial Modelling for Corporate Budgeting, Sensitivity & Scenario Analysis Using Excel & VBA74
STEP 7: Capital Budget
STEP 8: Cash BudgetSTEP 9: Budgeted
Balance Sheet
STEP 6: Budgeted Statement of Income
7A: Capital Expenditures Budget
7B: Disbursement of Capital Expenditures Budget
7C: Depreciation Budget
74
Cash, Income & Balance Sheet Budget

© 2012 PT Deloitte Konsultan IndonesiaFinancial Modelling for Corporate Budgeting, Sensitivity & Scenario Analysis Using Excel & VBA
© 2012 PT Deloitte Konsultan IndonesiaFinancial Modelling for Corporate Budgeting, Sensitivity & Scenario Analysis Using Excel & VBA75
Income Statement
75
Cash, Income & Balance Sheet Budget
© 2012 PT Deloitte Konsultan IndonesiaFinancial Modelling for Corporate Budgeting, Sensitivity & Scenario Analysis Using Excel & VBA76
Capital Budget Cash Budget Budgeted Balance Sheet
Budgeted Statement of Income
Cost-of-Goods Sold Budget
Sales and Collections Budget
Operating Expenses Budget
Inventory and Purchases Budget
Operating Budget
Financial Budget
MASTER BUDGET
76
Cash, Income & Balance Sheet Budget
© 2012 PT Deloitte Konsultan IndonesiaFinancial Modelling for Corporate Budgeting, Sensitivity & Scenario Analysis Using Excel & VBA
© 2012 PT Deloitte Konsultan IndonesiaFinancial Modelling for Corporate Budgeting, Sensitivity & Scenario Analysis Using Excel & VBA77
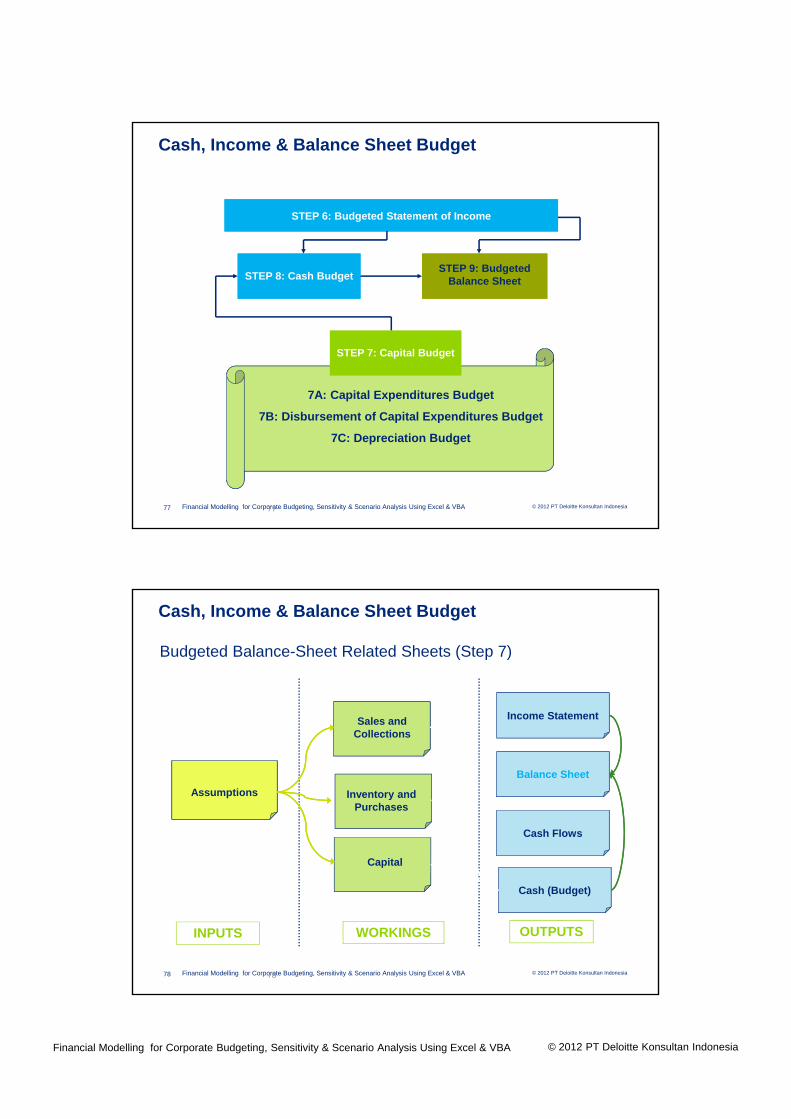
STEP 7: Capital Budget
STEP 8: Cash BudgetSTEP 9: Budgeted
Balance Sheet
STEP 6: Budgeted Statement of Income
7A: Capital Expenditures Budget
7B: Disbursement of Capital Expenditures Budget
7C: Depreciation Budget
77
Cash, Income & Balance Sheet Budget
© 2012 PT Deloitte Konsultan IndonesiaFinancial Modelling for Corporate Budgeting, Sensitivity & Scenario Analysis Using Excel & VBA78
Budgeted Balance-Sheet Related Sheets (Step 7)
INPUTS WORKINGS OUTPUTS
Assumptions
Income Statement
Balance Sheet
Cash Flows
Cash (Budget)
Capital
Sales and Collections
Inventory and Purchases
78
Cash, Income & Balance Sheet Budget

© 2012 PT Deloitte Konsultan IndonesiaFinancial Modelling for Corporate Budgeting, Sensitivity & Scenario Analysis Using Excel & VBA
© 2012 PT Deloitte Konsultan IndonesiaFinancial Modelling for Corporate Budgeting, Sensitivity & Scenario Analysis Using Excel & VBA79
Balance Sheet
79
Cash, Income & Balance Sheet Budget
Day 2 - Session 1
© 2012 PT Deloitte Konsultan IndonesiaFinancial Modelling for Corporate Budgeting, Sensitivity & Scenario Analysis Using Excel & VBA
© 2012 PT Deloitte Konsultan IndonesiaFinancial Modelling for Corporate Budgeting, Sensitivity & Scenario Analysis Using Excel & VBA81
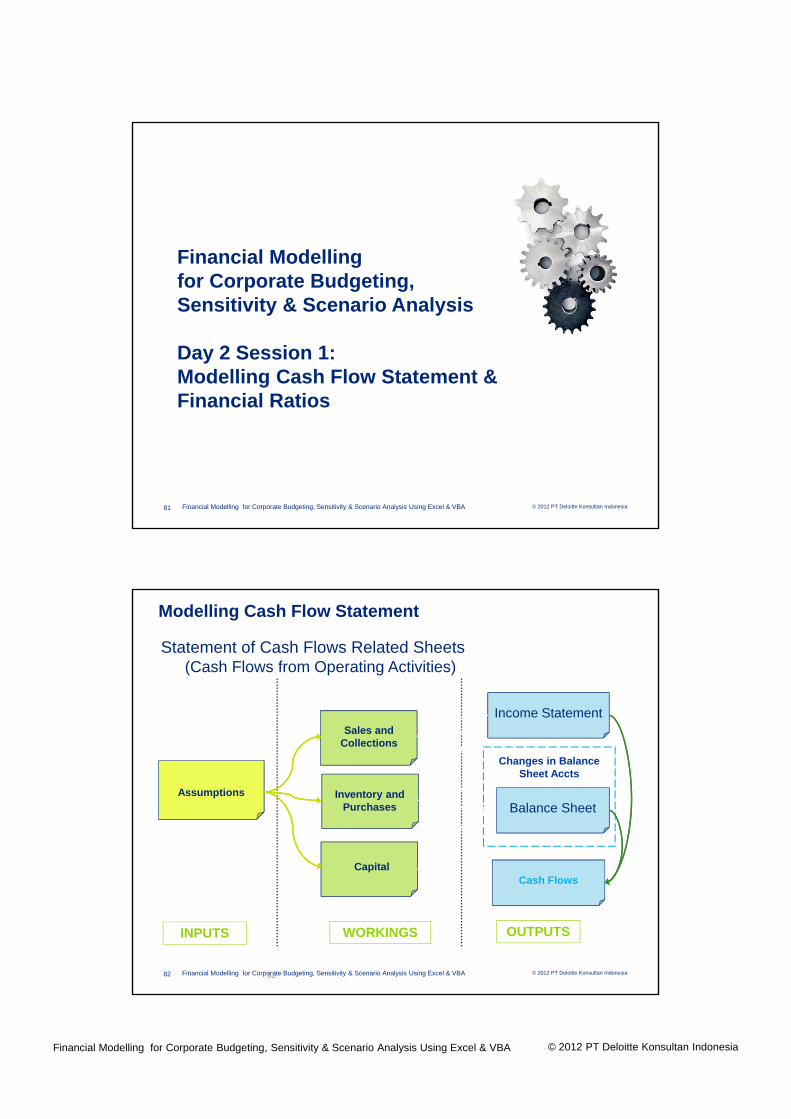
Financial Modellingfor Corporate Budgeting,Sensitivity & Scenario Analysis
Day 2 Session 1:Modelling Cash Flow Statement &Financial Ratios
© 2012 PT Deloitte Konsultan IndonesiaFinancial Modelling for Corporate Budgeting, Sensitivity & Scenario Analysis Using Excel & VBA82
Modelling Cash Flow Statement
Statement of Cash Flows Related Sheets(Cash Flows from Operating Activities)
INPUTS WORKINGS OUTPUTS
Assumptions
Income Statement
Cash FlowsCapital
Sales and Collections
Inventory and Purchases
Changes in Balance Sheet Accts
Balance Sheet
82
© 2012 PT Deloitte Konsultan IndonesiaFinancial Modelling for Corporate Budgeting, Sensitivity & Scenario Analysis Using Excel & VBA
© 2012 PT Deloitte Konsultan IndonesiaFinancial Modelling for Corporate Budgeting, Sensitivity & Scenario Analysis Using Excel & VBA83
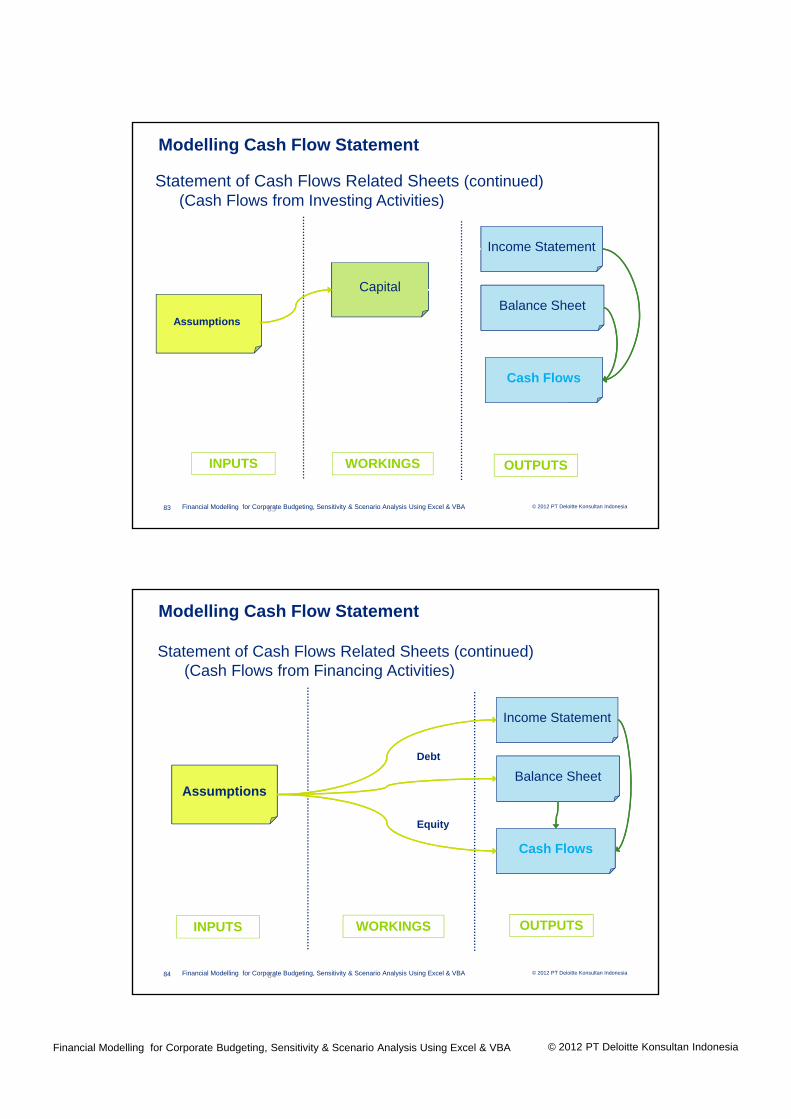
Statement of Cash Flows Related Sheets (continued) (Cash Flows from Investing Activities)
INPUTS WORKINGS OUTPUTS
Assumptions
Capital
Cash Flows
Balance Sheet
Income Statement
83
Modelling Cash Flow Statement
© 2012 PT Deloitte Konsultan IndonesiaFinancial Modelling for Corporate Budgeting, Sensitivity & Scenario Analysis Using Excel & VBA84
Statement of Cash Flows Related Sheets (continued) (Cash Flows from Financing Activities)
INPUTS WORKINGS OUTPUTS
Assumptions
Cash Flows
Equity
Balance Sheet
Income Statement
Debt
84
Modelling Cash Flow Statement
© 2012 PT Deloitte Konsultan IndonesiaFinancial Modelling for Corporate Budgeting, Sensitivity & Scenario Analysis Using Excel & VBA
© 2012 PT Deloitte Konsultan IndonesiaFinancial Modelling for Corporate Budgeting, Sensitivity & Scenario Analysis Using Excel & VBA85
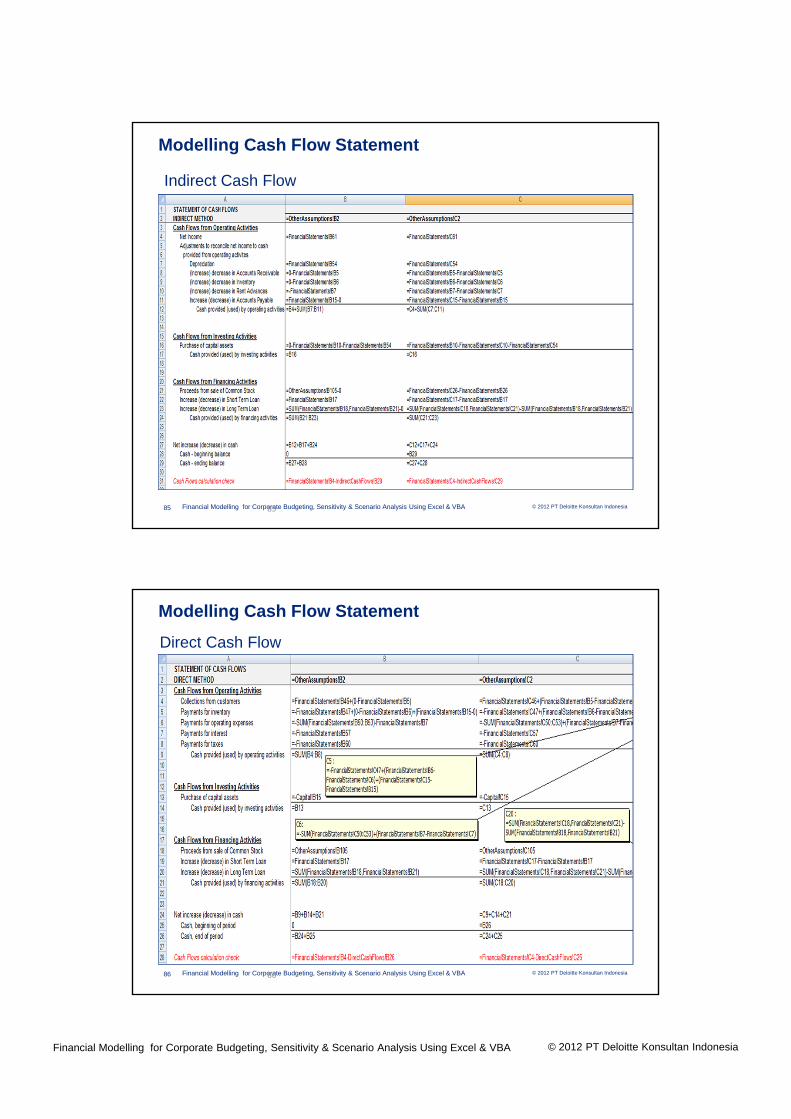
Indirect Cash Flow
85
Modelling Cash Flow Statement
© 2012 PT Deloitte Konsultan IndonesiaFinancial Modelling for Corporate Budgeting, Sensitivity & Scenario Analysis Using Excel & VBA86
Direct Cash Flow
86
Modelling Cash Flow Statement
© 2012 PT Deloitte Konsultan IndonesiaFinancial Modelling for Corporate Budgeting, Sensitivity & Scenario Analysis Using Excel & VBA
Day 2 - Session 2
© 2012 PT Deloitte Konsultan IndonesiaFinancial Modelling for Corporate Budgeting, Sensitivity & Scenario Analysis Using Excel & VBA88
Financial Modellingfor Corporate Budgeting,Sensitivity & Scenario Analysis
Day 2 Session 2:Modelling Contribution Margin &Variance Analysis
© 2012 PT Deloitte Konsultan IndonesiaFinancial Modelling for Corporate Budgeting, Sensitivity & Scenario Analysis Using Excel & VBA
© 2012 PT Deloitte Konsultan IndonesiaFinancial Modelling for Corporate Budgeting, Sensitivity & Scenario Analysis Using Excel & VBA89 89
Modelling Contribution Margin
© 2012 PT Deloitte Konsultan IndonesiaFinancial Modelling for Corporate Budgeting, Sensitivity & Scenario Analysis Using Excel & VBA90
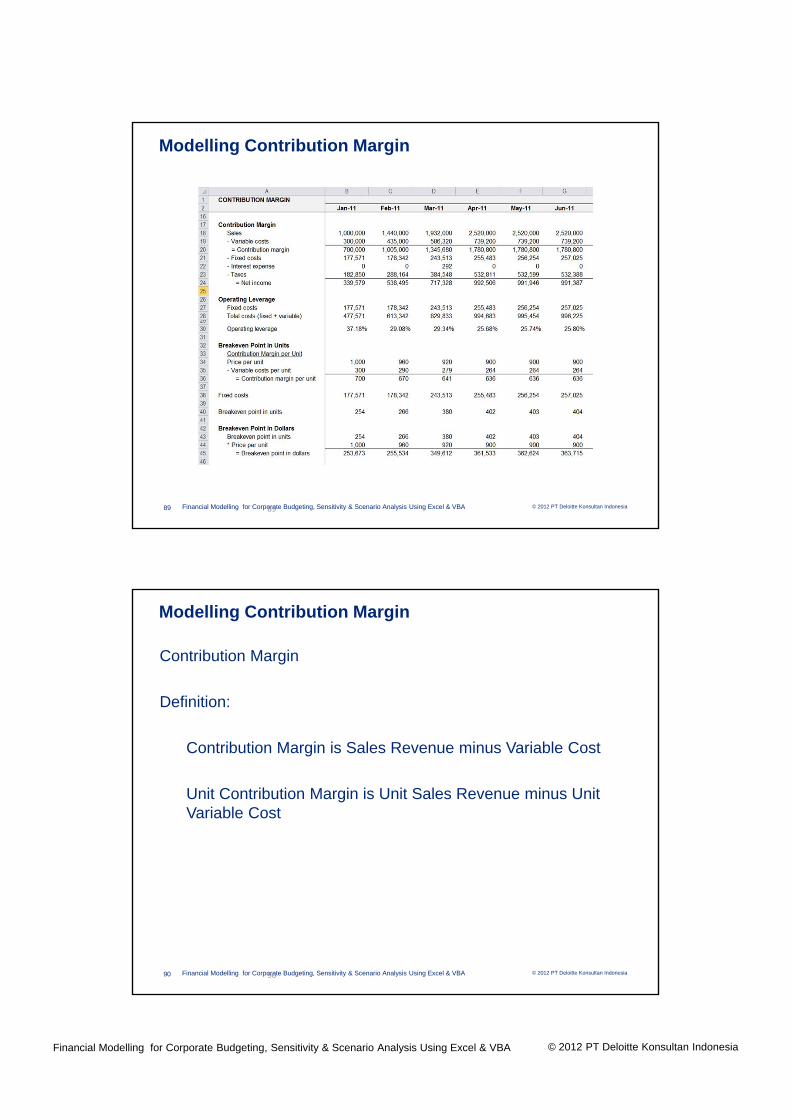
Contribution Margin
Definition:
Contribution Margin is Sales Revenue minus Variable Cost
Unit Contribution Margin is Unit Sales Revenue minus Unit Variable Cost
90
Modelling Contribution Margin

© 2012 PT Deloitte Konsultan IndonesiaFinancial Modelling for Corporate Budgeting, Sensitivity & Scenario Analysis Using Excel & VBA
© 2012 PT Deloitte Konsultan IndonesiaFinancial Modelling for Corporate Budgeting, Sensitivity & Scenario Analysis Using Excel & VBA91
Operating Leverage
Definition:
Operating Leverage is Fixed Cost divided by Total Cost (Fixed Cost + Variable Cost)
91
Modelling Contribution Margin
© 2012 PT Deloitte Konsultan IndonesiaFinancial Modelling for Corporate Budgeting, Sensitivity & Scenario Analysis Using Excel & VBA92
Breakeven Point in Units
Definition:
Breakeven Point in Units is Fixed Cost divided by Unit Contribution Margin
92
Modelling Contribution Margin

© 2012 PT Deloitte Konsultan IndonesiaFinancial Modelling for Corporate Budgeting, Sensitivity & Scenario Analysis Using Excel & VBA
© 2012 PT Deloitte Konsultan IndonesiaFinancial Modelling for Corporate Budgeting, Sensitivity & Scenario Analysis Using Excel & VBA93
Breakeven Point in Dollars
Definition:
Breakeven Point in Dollars is Breakeven Point in Units times Price per Unit.
93
Modelling Contribution Margin
© 2012 PT Deloitte Konsultan IndonesiaFinancial Modelling for Corporate Budgeting, Sensitivity & Scenario Analysis Using Excel & VBA94 94
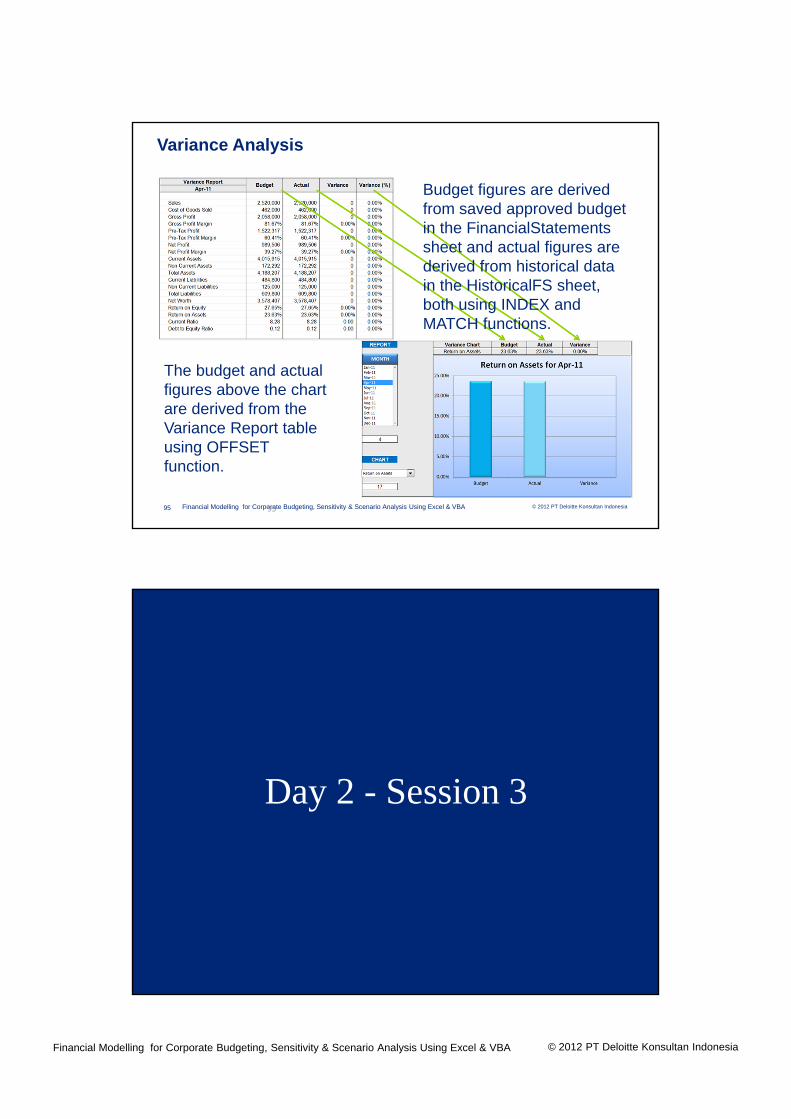
Variance Analysis
Sales - Budget: =INDEX(FinancialStatements!$A$132:$M$151,MATCH(VarianceReport!B6,FinancialStatements!$A$132:$A$151,0),VarianceReport!$H$17+1)
Sales - Actual: =INDEX(HistoricalFS!$A$66:$M$85,MATCH(VarianceReport!B6,HistoricalFS!$A$66:$A$85,0),VarianceReport!$H$17+1)
© 2012 PT Deloitte Konsultan IndonesiaFinancial Modelling for Corporate Budgeting, Sensitivity & Scenario Analysis Using Excel & VBA
© 2012 PT Deloitte Konsultan IndonesiaFinancial Modelling for Corporate Budgeting, Sensitivity & Scenario Analysis Using Excel & VBA95 95
Variance Analysis
Budget figures are derived from saved approved budget in the FinancialStatementssheet and actual figures are derived from historical data in the HistoricalFS sheet, both using INDEX and MATCH functions.
The budget and actual figures above the chart are derived from the Variance Report table using OFFSET function.
Day 2 - Session 3
© 2012 PT Deloitte Konsultan IndonesiaFinancial Modelling for Corporate Budgeting, Sensitivity & Scenario Analysis Using Excel & VBA
© 2012 PT Deloitte Konsultan IndonesiaFinancial Modelling for Corporate Budgeting, Sensitivity & Scenario Analysis Using Excel & VBA97
Financial Modellingfor Corporate Budgeting,Sensitivity & Scenario Analysis
Day 2 Session 3:Automatic Number Formatting &Dynamic Chart
© 2012 PT Deloitte Konsultan IndonesiaFinancial Modelling for Corporate Budgeting, Sensitivity & Scenario Analysis Using Excel & VBA98
Automatic Number Formatting
98
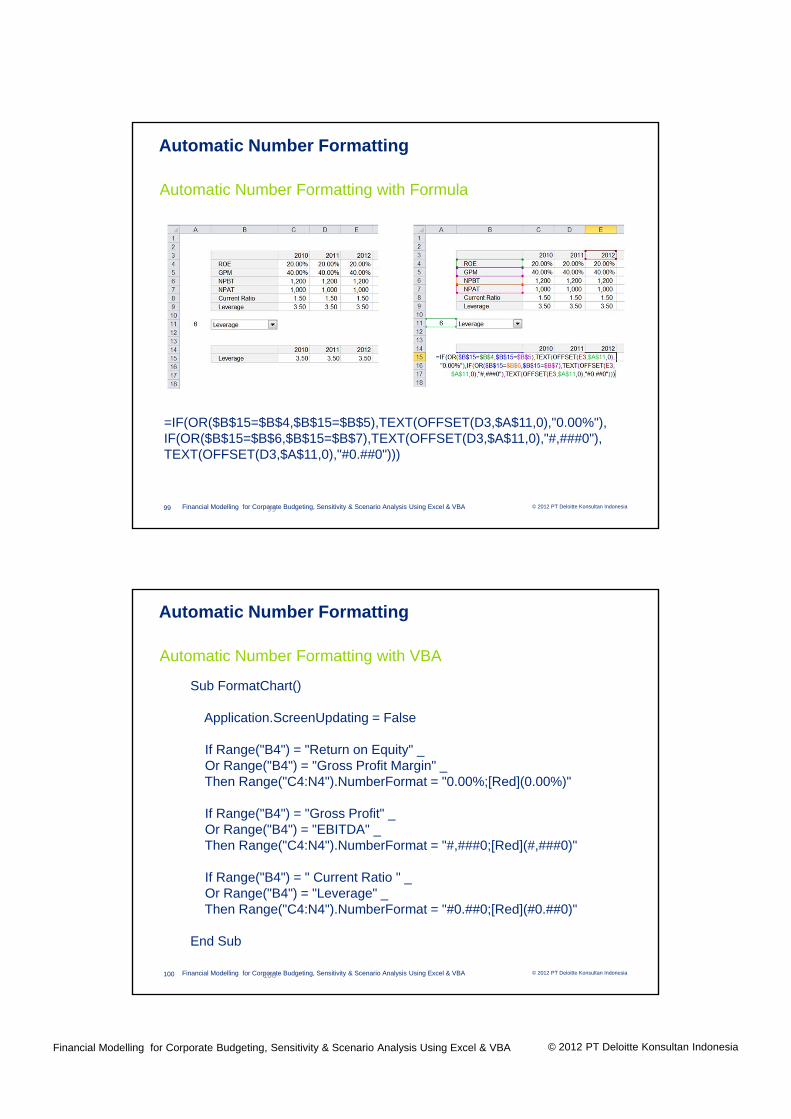
When we have a list of number series using different formats, e.g. round number, percentage, decimal, and we want to present them one by one in different cells, we will want to see that when we select, e.g. EBITDA, it should be in round number format, ROE in percentage, Current Ratio in decimal, etc. How do we automate the number formatting for the cells where those series are displayed?
There are 2 ways to do it: 1) by using formula (a combination of IF, OR, TEXT and
OFFSET functions) 2) by using VBA / macro. The 2nd way is easier.
In this training, we will learn to use both ways.
© 2012 PT Deloitte Konsultan IndonesiaFinancial Modelling for Corporate Budgeting, Sensitivity & Scenario Analysis Using Excel & VBA
© 2012 PT Deloitte Konsultan IndonesiaFinancial Modelling for Corporate Budgeting, Sensitivity & Scenario Analysis Using Excel & VBA99
Automatic Number Formatting
99
Automatic Number Formatting with Formula
=IF(OR($B$15=$B$4,$B$15=$B$5),TEXT(OFFSET(D3,$A$11,0),"0.00%"),IF(OR($B$15=$B$6,$B$15=$B$7),TEXT(OFFSET(D3,$A$11,0),"#,###0"),TEXT(OFFSET(D3,$A$11,0),"#0.##0")))
© 2012 PT Deloitte Konsultan IndonesiaFinancial Modelling for Corporate Budgeting, Sensitivity & Scenario Analysis Using Excel & VBA100
Automatic Number Formatting
100
Automatic Number Formatting with VBA
Sub FormatChart()
Application.ScreenUpdating = False
If Range("B4") = "Return on Equity" _Or Range("B4") = "Gross Profit Margin" _Then Range("C4:N4").NumberFormat = "0.00%;[Red](0.00%)"
If Range("B4") = "Gross Profit" _Or Range("B4") = "EBITDA" _Then Range("C4:N4").NumberFormat = "#,###0;[Red](#,###0)"
If Range("B4") = " Current Ratio " _Or Range("B4") = "Leverage" _Then Range("C4:N4").NumberFormat = "#0.##0;[Red](#0.##0)"
End Sub
© 2012 PT Deloitte Konsultan IndonesiaFinancial Modelling for Corporate Budgeting, Sensitivity & Scenario Analysis Using Excel & VBA
© 2012 PT Deloitte Konsultan IndonesiaFinancial Modelling for Corporate Budgeting, Sensitivity & Scenario Analysis Using Excel & VBA101
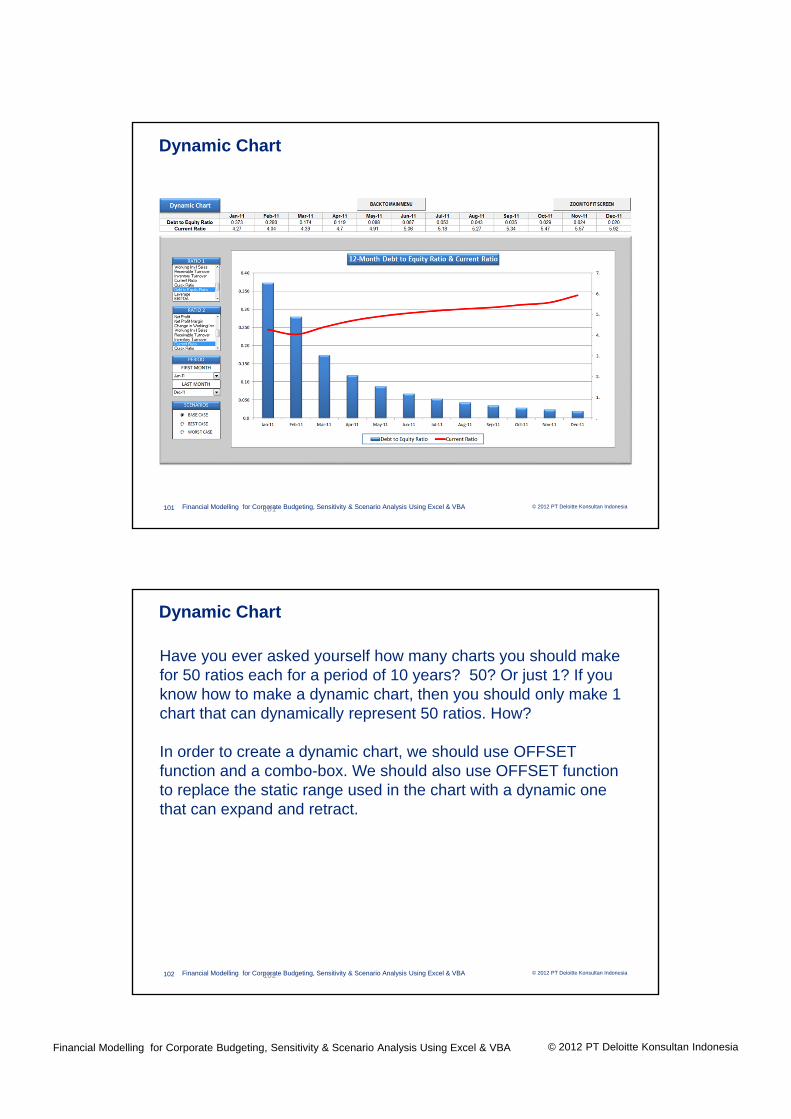
Dynamic Chart
101
© 2012 PT Deloitte Konsultan IndonesiaFinancial Modelling for Corporate Budgeting, Sensitivity & Scenario Analysis Using Excel & VBA102
Dynamic Chart
102
Have you ever asked yourself how many charts you should make for 50 ratios each for a period of 10 years? 50? Or just 1? If you know how to make a dynamic chart, then you should only make 1 chart that can dynamically represent 50 ratios. How?
In order to create a dynamic chart, we should use OFFSET function and a combo-box. We should also use OFFSET function to replace the static range used in the chart with a dynamic one that can expand and retract.
© 2012 PT Deloitte Konsultan IndonesiaFinancial Modelling for Corporate Budgeting, Sensitivity & Scenario Analysis Using Excel & VBA
© 2012 PT Deloitte Konsultan IndonesiaFinancial Modelling for Corporate Budgeting, Sensitivity & Scenario Analysis Using Excel & VBA103
Dynamic Chart
103
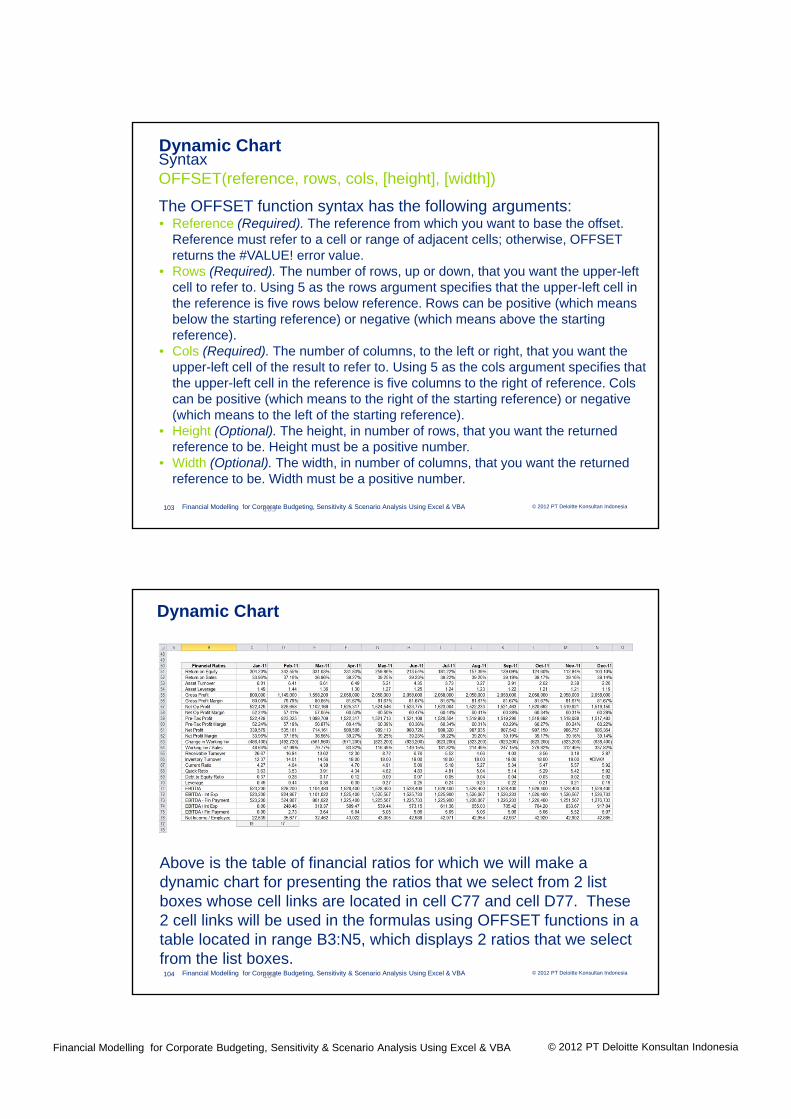
SyntaxOFFSET(reference, rows, cols, [height], [width])
The OFFSET function syntax has the following arguments:• Reference (Required). The reference from which you want to base the offset.
Reference must refer to a cell or range of adjacent cells; otherwise, OFFSET returns the #VALUE! error value.
• Rows (Required). The number of rows, up or down, that you want the upper-left cell to refer to. Using 5 as the rows argument specifies that the upper-left cell in the reference is five rows below reference. Rows can be positive (which means below the starting reference) or negative (which means above the starting reference).
• Cols (Required). The number of columns, to the left or right, that you want the upper-left cell of the result to refer to. Using 5 as the cols argument specifies that the upper-left cell in the reference is five columns to the right of reference. Cols can be positive (which means to the right of the starting reference) or negative (which means to the left of the starting reference).
• Height (Optional). The height, in number of rows, that you want the returned reference to be. Height must be a positive number.
• Width (Optional). The width, in number of columns, that you want the returned reference to be. Width must be a positive number.
© 2012 PT Deloitte Konsultan IndonesiaFinancial Modelling for Corporate Budgeting, Sensitivity & Scenario Analysis Using Excel & VBA104
Dynamic Chart
104
Above is the table of financial ratios for which we will make a dynamic chart for presenting the ratios that we select from 2 list boxes whose cell links are located in cell C77 and cell D77. These 2 cell links will be used in the formulas using OFFSET functions in a table located in range B3:N5, which displays 2 ratios that we select from the list boxes.

© 2012 PT Deloitte Konsultan IndonesiaFinancial Modelling for Corporate Budgeting, Sensitivity & Scenario Analysis Using Excel & VBA
© 2012 PT Deloitte Konsultan IndonesiaFinancial Modelling for Corporate Budgeting, Sensitivity & Scenario Analysis Using Excel & VBA105
Dynamic Chart
105
Step 1 : Highlight the range B3:N5, select Insert, Column, and 2-D Column.
© 2012 PT Deloitte Konsultan IndonesiaFinancial Modelling for Corporate Budgeting, Sensitivity & Scenario Analysis Using Excel & VBA106
Dynamic Chart
106
Step 2 : Select the legend, and then select Layout, Legend, and Show Legend at Bottom.

© 2012 PT Deloitte Konsultan IndonesiaFinancial Modelling for Corporate Budgeting, Sensitivity & Scenario Analysis Using Excel & VBA
© 2012 PT Deloitte Konsultan IndonesiaFinancial Modelling for Corporate Budgeting, Sensitivity & Scenario Analysis Using Excel & VBA107
Dynamic Chart
107
Step 3 : Right click on the red Column chart and change it into a Line chart.
© 2012 PT Deloitte Konsultan IndonesiaFinancial Modelling for Corporate Budgeting, Sensitivity & Scenario Analysis Using Excel & VBA108
Dynamic Chart
108
Now we have a Column chart and a Line chart.
© 2012 PT Deloitte Konsultan IndonesiaFinancial Modelling for Corporate Budgeting, Sensitivity & Scenario Analysis Using Excel & VBA
© 2012 PT Deloitte Konsultan IndonesiaFinancial Modelling for Corporate Budgeting, Sensitivity & Scenario Analysis Using Excel & VBA109
Dynamic Chart
109
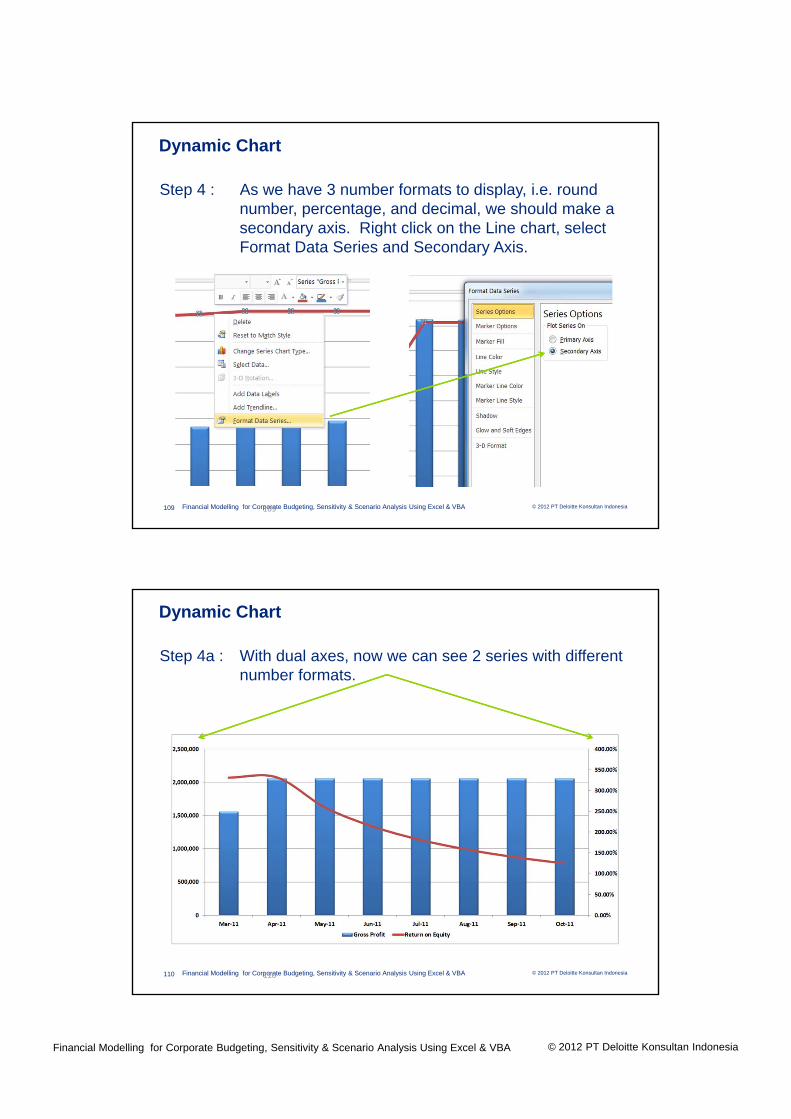
Step 4 : As we have 3 number formats to display, i.e. round number, percentage, and decimal, we should make a secondary axis. Right click on the Line chart, select Format Data Series and Secondary Axis.
© 2012 PT Deloitte Konsultan IndonesiaFinancial Modelling for Corporate Budgeting, Sensitivity & Scenario Analysis Using Excel & VBA110
Dynamic Chart
110
Step 4a : With dual axes, now we can see 2 series with different number formats.
© 2012 PT Deloitte Konsultan IndonesiaFinancial Modelling for Corporate Budgeting, Sensitivity & Scenario Analysis Using Excel & VBA
© 2012 PT Deloitte Konsultan IndonesiaFinancial Modelling for Corporate Budgeting, Sensitivity & Scenario Analysis Using Excel & VBA111
Dynamic Chart
111
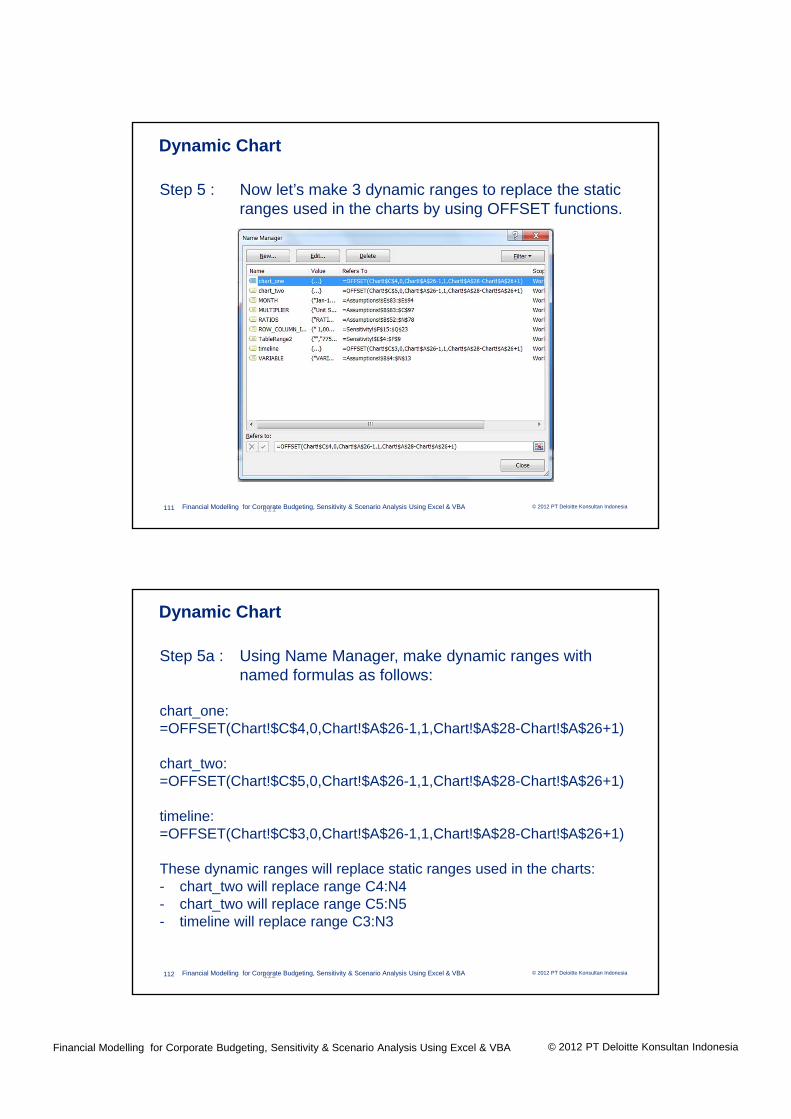
Step 5 : Now let’s make 3 dynamic ranges to replace the static ranges used in the charts by using OFFSET functions.
© 2012 PT Deloitte Konsultan IndonesiaFinancial Modelling for Corporate Budgeting, Sensitivity & Scenario Analysis Using Excel & VBA112
Dynamic Chart
112
Step 5a : Using Name Manager, make dynamic ranges with named formulas as follows:
chart_one: =OFFSET(Chart!$C$4,0,Chart!$A$26-1,1,Chart!$A$28-Chart!$A$26+1)
chart_two:=OFFSET(Chart!$C$5,0,Chart!$A$26-1,1,Chart!$A$28-Chart!$A$26+1)
timeline:=OFFSET(Chart!$C$3,0,Chart!$A$26-1,1,Chart!$A$28-Chart!$A$26+1)
These dynamic ranges will replace static ranges used in the charts:- chart_two will replace range C4:N4- chart_two will replace range C5:N5- timeline will replace range C3:N3

© 2012 PT Deloitte Konsultan IndonesiaFinancial Modelling for Corporate Budgeting, Sensitivity & Scenario Analysis Using Excel & VBA
© 2012 PT Deloitte Konsultan IndonesiaFinancial Modelling for Corporate Budgeting, Sensitivity & Scenario Analysis Using Excel & VBA113
Dynamic Chart
113
Step 6 : Right click on the Column chart and select SelectData. From the dialog box that appears, select the series representing the Column chart, and click the Edit button.
© 2012 PT Deloitte Konsultan IndonesiaFinancial Modelling for Corporate Budgeting, Sensitivity & Scenario Analysis Using Excel & VBA114
Dynamic Chart
114
Step 7 : Erase the static range $C$4:$N$4, press F3, select chart_one, and click OK to replace it. Repeat Step 6 and 7 on the Line chart.
© 2012 PT Deloitte Konsultan IndonesiaFinancial Modelling for Corporate Budgeting, Sensitivity & Scenario Analysis Using Excel & VBA
© 2012 PT Deloitte Konsultan IndonesiaFinancial Modelling for Corporate Budgeting, Sensitivity & Scenario Analysis Using Excel & VBA115
Dynamic Chart
115
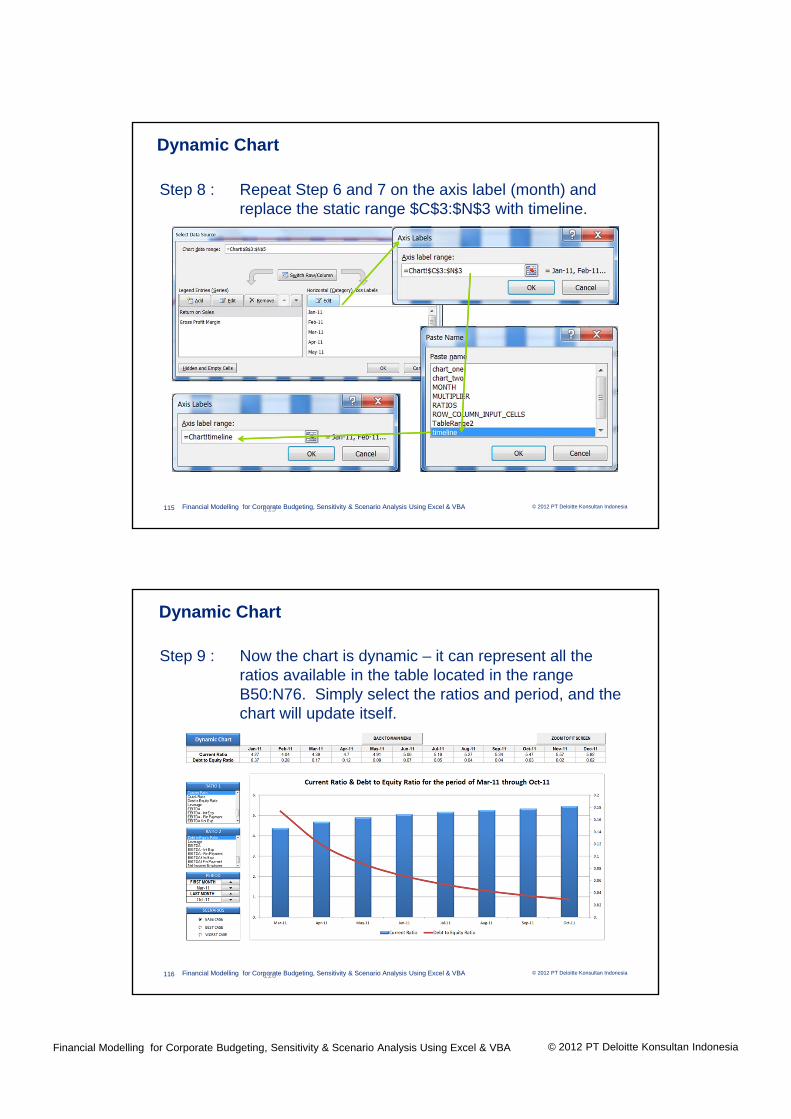
Step 8 : Repeat Step 6 and 7 on the axis label (month) and replace the static range $C$3:$N$3 with timeline.
© 2012 PT Deloitte Konsultan IndonesiaFinancial Modelling for Corporate Budgeting, Sensitivity & Scenario Analysis Using Excel & VBA116
Dynamic Chart
116
Step 9 : Now the chart is dynamic – it can represent all the ratios available in the table located in the range B50:N76. Simply select the ratios and period, and the chart will update itself.

© 2012 PT Deloitte Konsultan IndonesiaFinancial Modelling for Corporate Budgeting, Sensitivity & Scenario Analysis Using Excel & VBA
© 2012 PT Deloitte Konsultan IndonesiaFinancial Modelling for Corporate Budgeting, Sensitivity & Scenario Analysis Using Excel & VBA117
Dynamic Chart
117
Step 10 : Now we need to add a chart title, a dynamic one, that represent the ratios and period that we select. Click on the chart, select Layout, Chart Title, Above Chart, and we will see a chart title above the chart.
Make the following formula somewhere below the ratio table:=B4&" & "&B5&" for the period of "&TEXT(B26,"mmm-yy")&" through "&TEXT(B28,"mmm-yy")which will display, e.g. “Current Ratio & Debt to Equity Ratio for the period of Mar-2011 through Oct-2011”.
Now click on the chart title, type “=“, and put the cursor on the cell where we the formula for the title. Now the dynamic chart has a dynamic chart title! As we change the ratios and period, the chart title will update itself.
© 2012 PT Deloitte Konsultan IndonesiaFinancial Modelling for Corporate Budgeting, Sensitivity & Scenario Analysis Using Excel & VBA118
Dynamic Chart
118
© 2012 PT Deloitte Konsultan IndonesiaFinancial Modelling for Corporate Budgeting, Sensitivity & Scenario Analysis Using Excel & VBA
Day 2 - Session 4
© 2012 PT Deloitte Konsultan IndonesiaFinancial Modelling for Corporate Budgeting, Sensitivity & Scenario Analysis Using Excel & VBA120
Financial Modellingfor Corporate Budgeting,Sensitivity & Scenario Analysis
Day 2 Session 4:Sensitivity & Scenario Analysis Dashboard

© 2012 PT Deloitte Konsultan IndonesiaFinancial Modelling for Corporate Budgeting, Sensitivity & Scenario Analysis Using Excel & VBA
© 2012 PT Deloitte Konsultan IndonesiaFinancial Modelling for Corporate Budgeting, Sensitivity & Scenario Analysis Using Excel & VBA121
Sensitivity & Scenario Analysis Dashboard
Sensitivity Analysis:Analysis of the impact of change of “one variable” on one of its outputs.
121
Scenario Analysis:Analysis of the impact of change of “a set of variables” on one or more of its outputs.
Sensitivity & Scenario Analysis Dashboard:Dashboard for performing sensitivity & scenario analysis.
© 2012 PT Deloitte Konsultan IndonesiaFinancial Modelling for Corporate Budgeting, Sensitivity & Scenario Analysis Using Excel & VBA122
Sensitivity & Scenario Analysis Dashboard
2-Way SSA Dashboard : 2 variables (inputs) & 1 output
122
© 2012 PT Deloitte Konsultan IndonesiaFinancial Modelling for Corporate Budgeting, Sensitivity & Scenario Analysis Using Excel & VBA
© 2012 PT Deloitte Konsultan IndonesiaFinancial Modelling for Corporate Budgeting, Sensitivity & Scenario Analysis Using Excel & VBA123
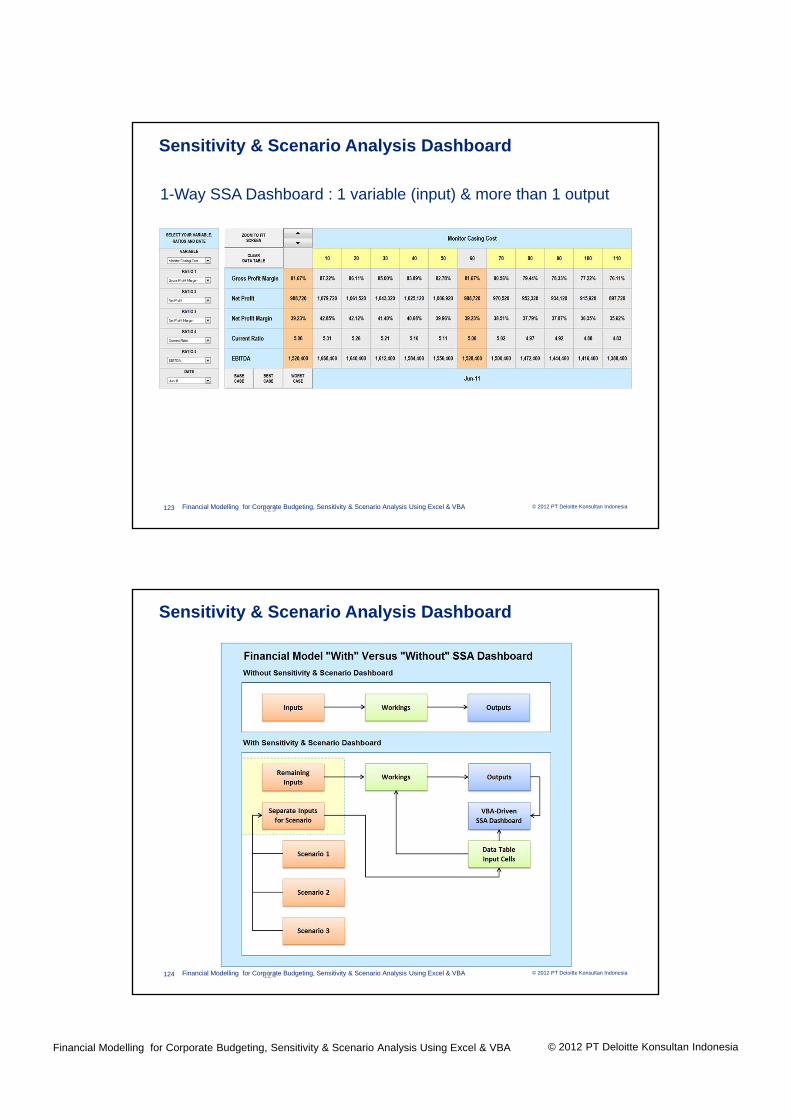
Sensitivity & Scenario Analysis Dashboard
1-Way SSA Dashboard : 1 variable (input) & more than 1 output
123
© 2012 PT Deloitte Konsultan IndonesiaFinancial Modelling for Corporate Budgeting, Sensitivity & Scenario Analysis Using Excel & VBA124
Sensitivity & Scenario Analysis Dashboard
124
© 2012 PT Deloitte Konsultan IndonesiaFinancial Modelling for Corporate Budgeting, Sensitivity & Scenario Analysis Using Excel & VBA
© 2012 PT Deloitte Konsultan IndonesiaFinancial Modelling for Corporate Budgeting, Sensitivity & Scenario Analysis Using Excel & VBA125
Sensitivity & Scenario Analysis Dashboard
125
In order for a data table to function, its input cells must be on the same sheet. As the inputs / assumptions and dashboard are located on different sheets, those assumptions that will be used for scenarios (presumably those of which changes generates the largest impacts on their outputs) must be cut and pasted below the dashboard. As a result, all formulas that contain their cell references will refer to the sheet where the dashboard is located.
As we will not type in these assumptions for scenarios in the dashboard sheet, we need to have a separate sheet in which we have the same list of assumptions and link those input cells in the dashboard sheet to their corresponding cells in this new separate sheet. We will have the assumptions filled in this new assumption sheet.
For scenario analysis, we need to make 3 copies of the list of assumptions for scenarios and pasted them below it. Name these 3 lists as Base Case, Best Case and Worst Case. Use macros to automate the copy and paste of each of these 3 lists to the original location of the list.
© 2012 PT Deloitte Konsultan IndonesiaFinancial Modelling for Corporate Budgeting, Sensitivity & Scenario Analysis Using Excel & VBA126
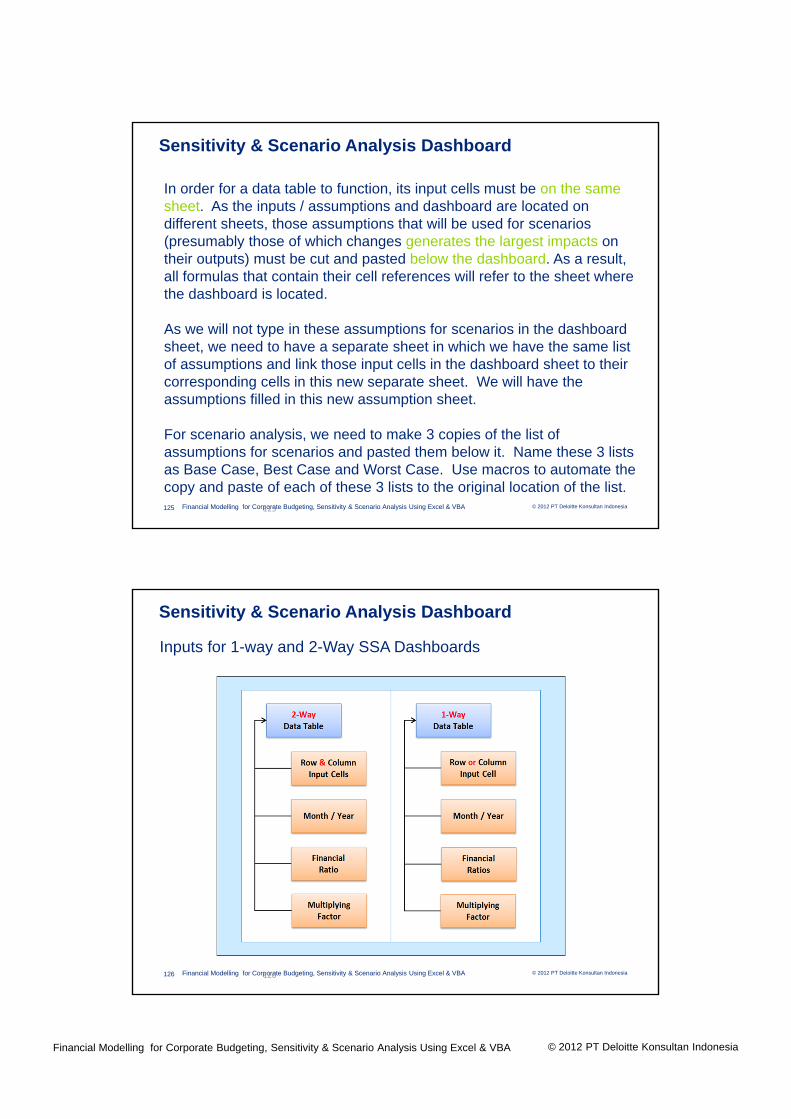
Sensitivity & Scenario Analysis Dashboard
Inputs for 1-way and 2-Way SSA Dashboards
126
© 2012 PT Deloitte Konsultan IndonesiaFinancial Modelling for Corporate Budgeting, Sensitivity & Scenario Analysis Using Excel & VBA
© 2012 PT Deloitte Konsultan IndonesiaFinancial Modelling for Corporate Budgeting, Sensitivity & Scenario Analysis Using Excel & VBA127
Sensitivity & Scenario Analysis Dashboard
127
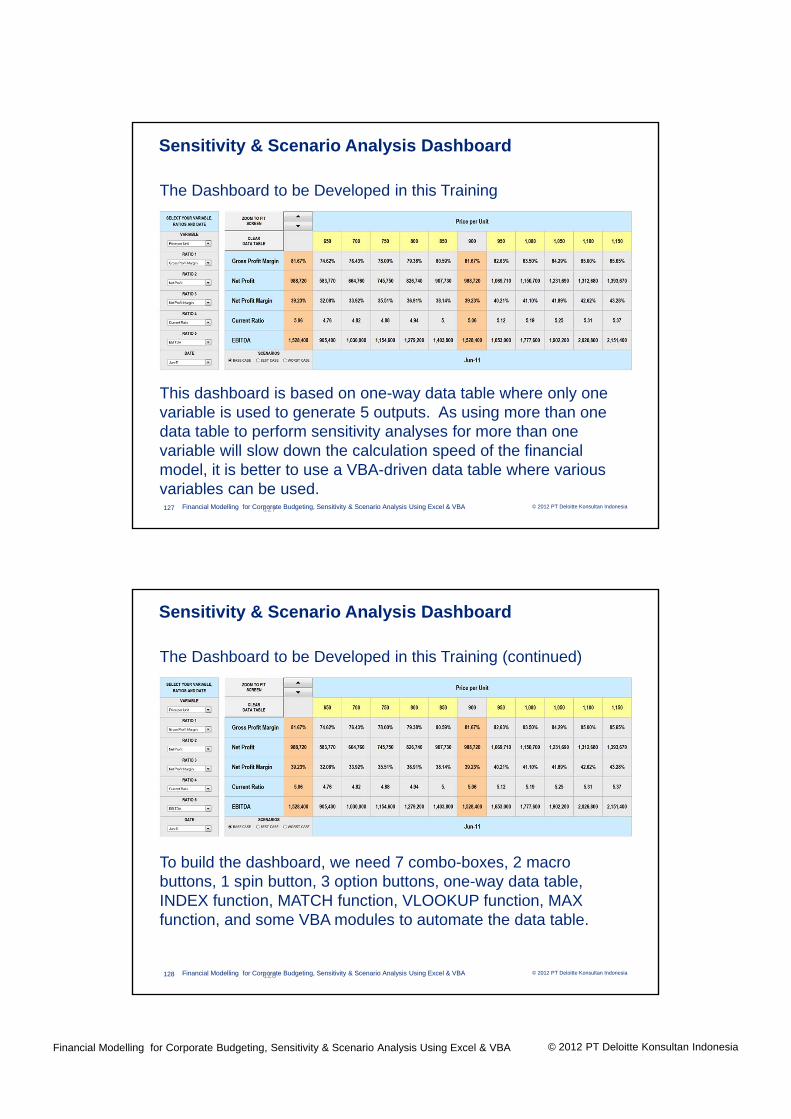
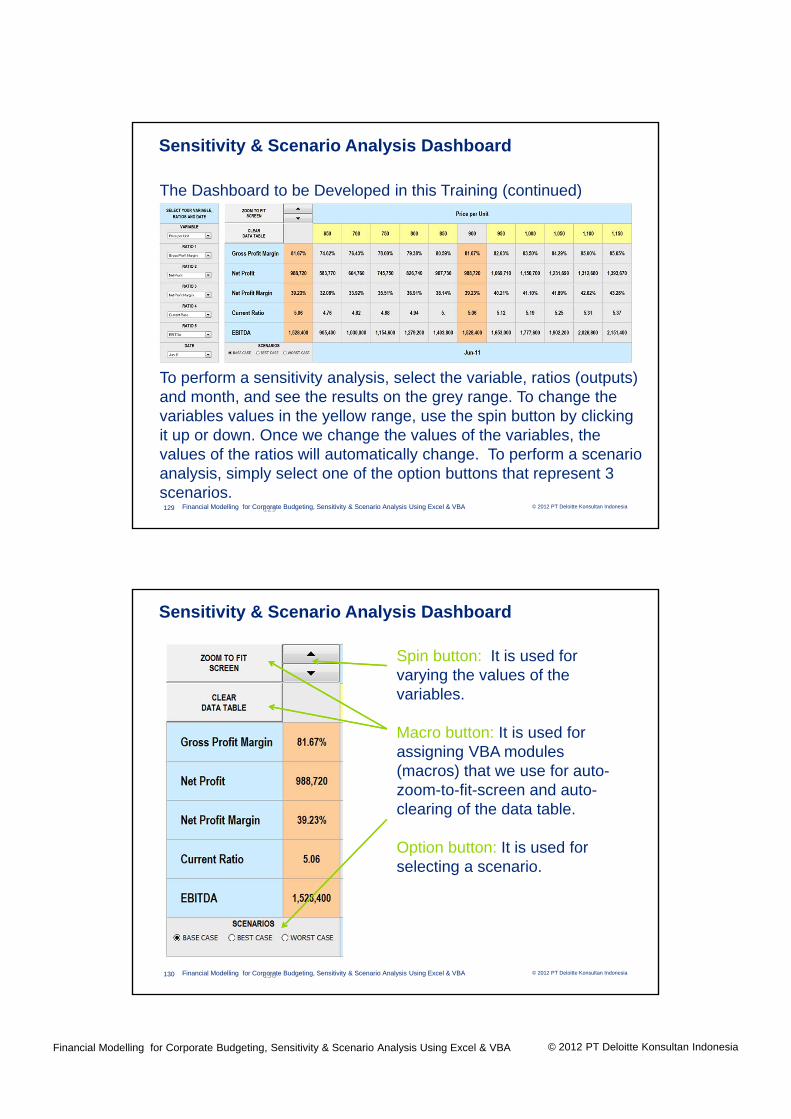
The Dashboard to be Developed in this Training
This dashboard is based on one-way data table where only one variable is used to generate 5 outputs. As using more than one data table to perform sensitivity analyses for more than one variable will slow down the calculation speed of the financial model, it is better to use a VBA-driven data table where various variables can be used.
© 2012 PT Deloitte Konsultan IndonesiaFinancial Modelling for Corporate Budgeting, Sensitivity & Scenario Analysis Using Excel & VBA128
Sensitivity & Scenario Analysis Dashboard
128
The Dashboard to be Developed in this Training (continued)
To build the dashboard, we need 7 combo-boxes, 2 macro buttons, 1 spin button, 3 option buttons, one-way data table, INDEX function, MATCH function, VLOOKUP function, MAX function, and some VBA modules to automate the data table.
© 2012 PT Deloitte Konsultan IndonesiaFinancial Modelling for Corporate Budgeting, Sensitivity & Scenario Analysis Using Excel & VBA
© 2012 PT Deloitte Konsultan IndonesiaFinancial Modelling for Corporate Budgeting, Sensitivity & Scenario Analysis Using Excel & VBA129
Sensitivity & Scenario Analysis Dashboard
129
The Dashboard to be Developed in this Training (continued)
To perform a sensitivity analysis, select the variable, ratios (outputs) and month, and see the results on the grey range. To change the variables values in the yellow range, use the spin button by clicking it up or down. Once we change the values of the variables, the values of the ratios will automatically change. To perform a scenario analysis, simply select one of the option buttons that represent 3 scenarios.
© 2012 PT Deloitte Konsultan IndonesiaFinancial Modelling for Corporate Budgeting, Sensitivity & Scenario Analysis Using Excel & VBA130
Sensitivity & Scenario Analysis Dashboard
130
Spin button: It is used for varying the values of the variables.
Macro button: It is used for assigning VBA modules (macros) that we use for auto-zoom-to-fit-screen and auto-clearing of the data table.
Option button: It is used for selecting a scenario.
© 2012 PT Deloitte Konsultan IndonesiaFinancial Modelling for Corporate Budgeting, Sensitivity & Scenario Analysis Using Excel & VBA
© 2012 PT Deloitte Konsultan IndonesiaFinancial Modelling for Corporate Budgeting, Sensitivity & Scenario Analysis Using Excel & VBA131
Sensitivity & Scenario Analysis Dashboard
131
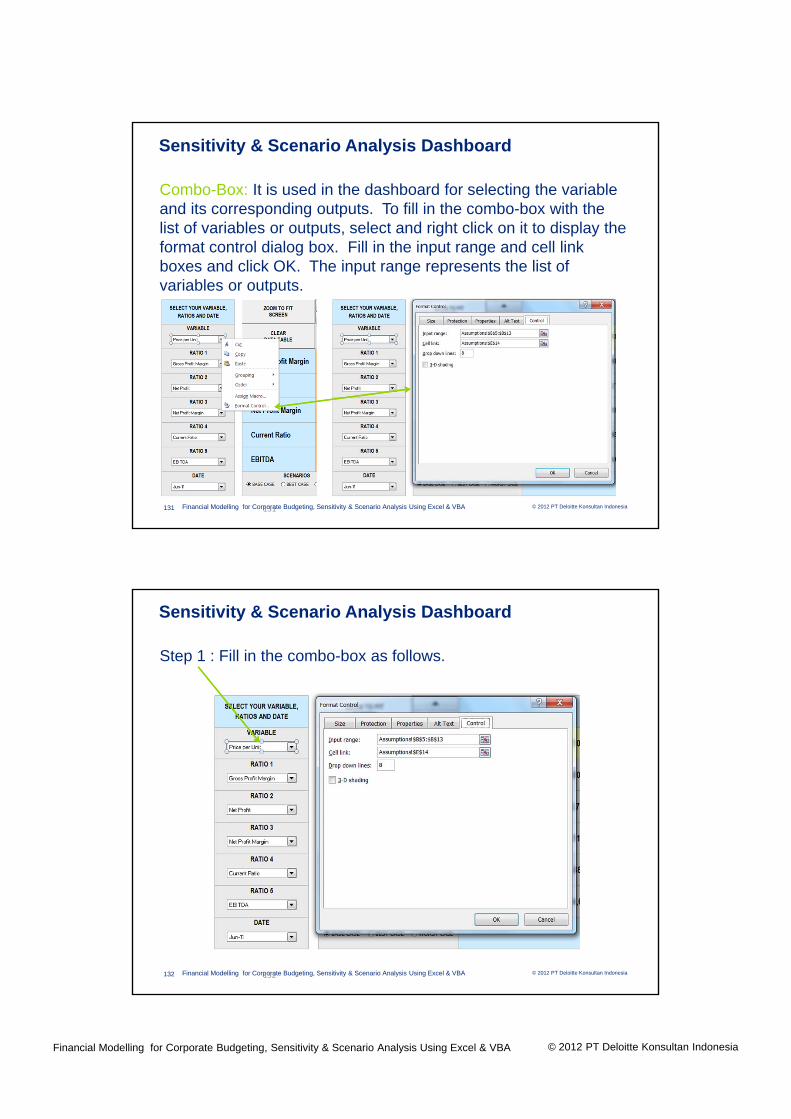
Combo-Box: It is used in the dashboard for selecting the variable and its corresponding outputs. To fill in the combo-box with the list of variables or outputs, select and right click on it to display the format control dialog box. Fill in the input range and cell link boxes and click OK. The input range represents the list of variables or outputs.
© 2012 PT Deloitte Konsultan IndonesiaFinancial Modelling for Corporate Budgeting, Sensitivity & Scenario Analysis Using Excel & VBA132
Sensitivity & Scenario Analysis Dashboard
132
Step 1 : Fill in the combo-box as follows.
© 2012 PT Deloitte Konsultan IndonesiaFinancial Modelling for Corporate Budgeting, Sensitivity & Scenario Analysis Using Excel & VBA
© 2012 PT Deloitte Konsultan IndonesiaFinancial Modelling for Corporate Budgeting, Sensitivity & Scenario Analysis Using Excel & VBA133
Sensitivity & Scenario Analysis Dashboard
133
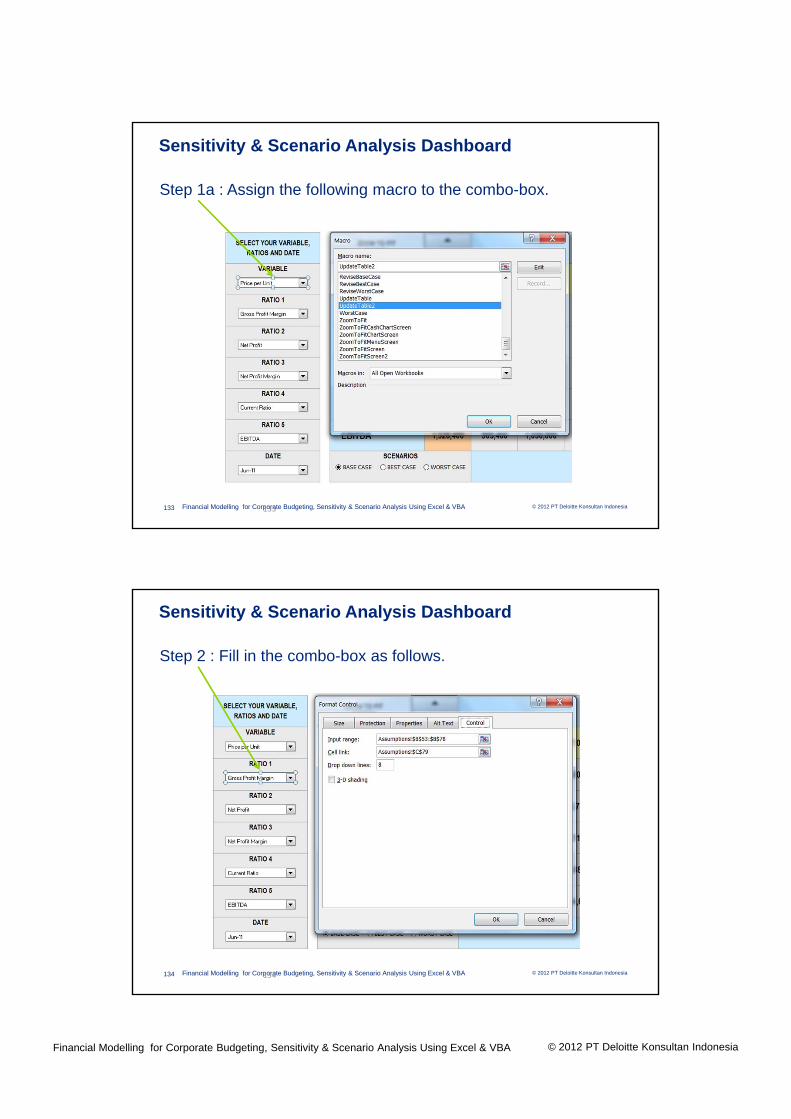
Step 1a : Assign the following macro to the combo-box.
© 2012 PT Deloitte Konsultan IndonesiaFinancial Modelling for Corporate Budgeting, Sensitivity & Scenario Analysis Using Excel & VBA134
Sensitivity & Scenario Analysis Dashboard
134
Step 2 : Fill in the combo-box as follows.

© 2012 PT Deloitte Konsultan IndonesiaFinancial Modelling for Corporate Budgeting, Sensitivity & Scenario Analysis Using Excel & VBA
© 2012 PT Deloitte Konsultan IndonesiaFinancial Modelling for Corporate Budgeting, Sensitivity & Scenario Analysis Using Excel & VBA135
Sensitivity & Scenario Analysis Dashboard
135
Step 2a : Assign the following macro to the combo-box.
© 2012 PT Deloitte Konsultan IndonesiaFinancial Modelling for Corporate Budgeting, Sensitivity & Scenario Analysis Using Excel & VBA136
Sensitivity & Scenario Analysis Dashboard
136
Step 3 : Fill in the combo-box as follows.

© 2012 PT Deloitte Konsultan IndonesiaFinancial Modelling for Corporate Budgeting, Sensitivity & Scenario Analysis Using Excel & VBA
© 2012 PT Deloitte Konsultan IndonesiaFinancial Modelling for Corporate Budgeting, Sensitivity & Scenario Analysis Using Excel & VBA137
Sensitivity & Scenario Analysis Dashboard
137
Step 3a : Assign the following macro to the combo-box.
© 2012 PT Deloitte Konsultan IndonesiaFinancial Modelling for Corporate Budgeting, Sensitivity & Scenario Analysis Using Excel & VBA138
Sensitivity & Scenario Analysis Dashboard
138
Step 4 : Fill in the combo-box as follows.
© 2012 PT Deloitte Konsultan IndonesiaFinancial Modelling for Corporate Budgeting, Sensitivity & Scenario Analysis Using Excel & VBA
© 2012 PT Deloitte Konsultan IndonesiaFinancial Modelling for Corporate Budgeting, Sensitivity & Scenario Analysis Using Excel & VBA139
Sensitivity & Scenario Analysis Dashboard
139
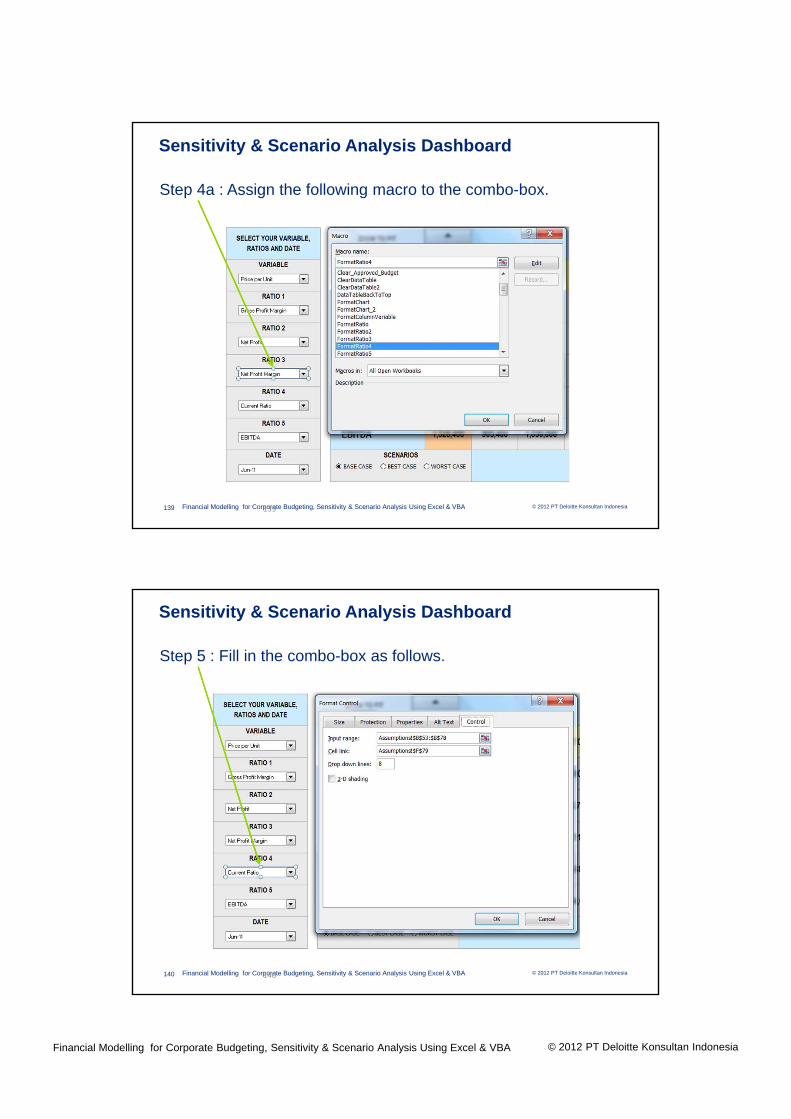
Step 4a : Assign the following macro to the combo-box.
© 2012 PT Deloitte Konsultan IndonesiaFinancial Modelling for Corporate Budgeting, Sensitivity & Scenario Analysis Using Excel & VBA140
Sensitivity & Scenario Analysis Dashboard
140
Step 5 : Fill in the combo-box as follows.
© 2012 PT Deloitte Konsultan IndonesiaFinancial Modelling for Corporate Budgeting, Sensitivity & Scenario Analysis Using Excel & VBA
© 2012 PT Deloitte Konsultan IndonesiaFinancial Modelling for Corporate Budgeting, Sensitivity & Scenario Analysis Using Excel & VBA141
Sensitivity & Scenario Analysis Dashboard
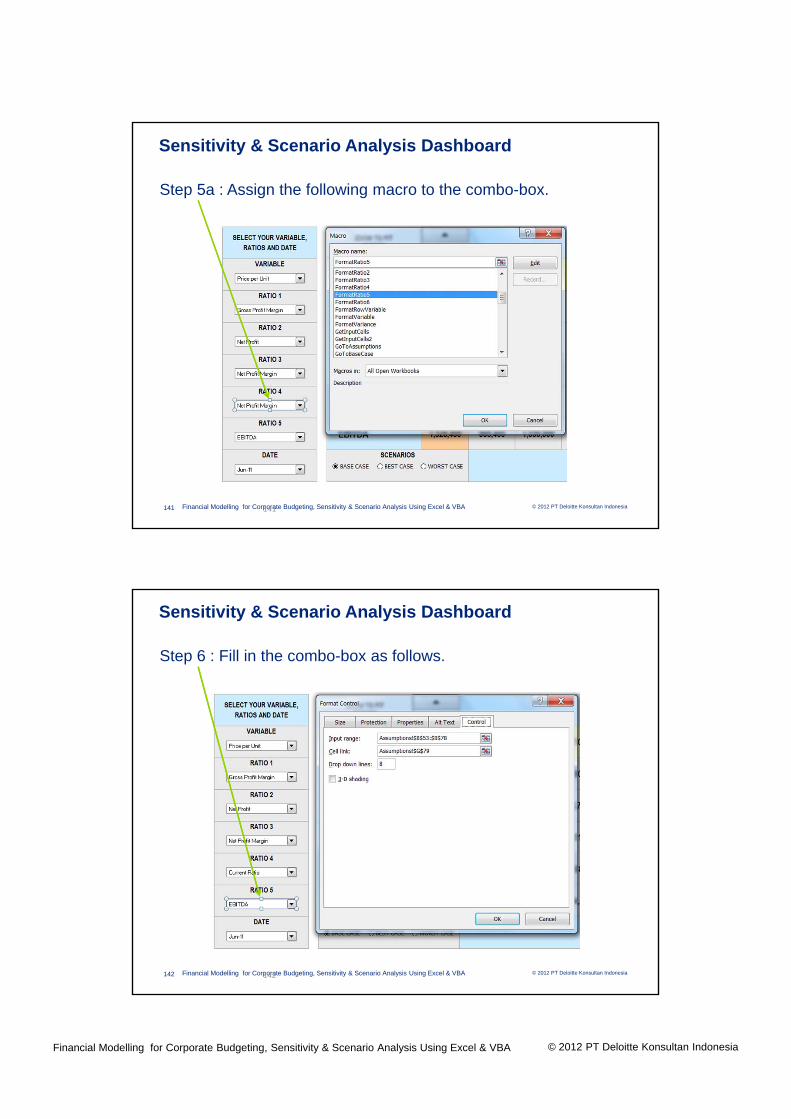
141
Step 5a : Assign the following macro to the combo-box.
© 2012 PT Deloitte Konsultan IndonesiaFinancial Modelling for Corporate Budgeting, Sensitivity & Scenario Analysis Using Excel & VBA142
Sensitivity & Scenario Analysis Dashboard
142
Step 6 : Fill in the combo-box as follows.
© 2012 PT Deloitte Konsultan IndonesiaFinancial Modelling for Corporate Budgeting, Sensitivity & Scenario Analysis Using Excel & VBA
© 2012 PT Deloitte Konsultan IndonesiaFinancial Modelling for Corporate Budgeting, Sensitivity & Scenario Analysis Using Excel & VBA143
Sensitivity & Scenario Analysis Dashboard
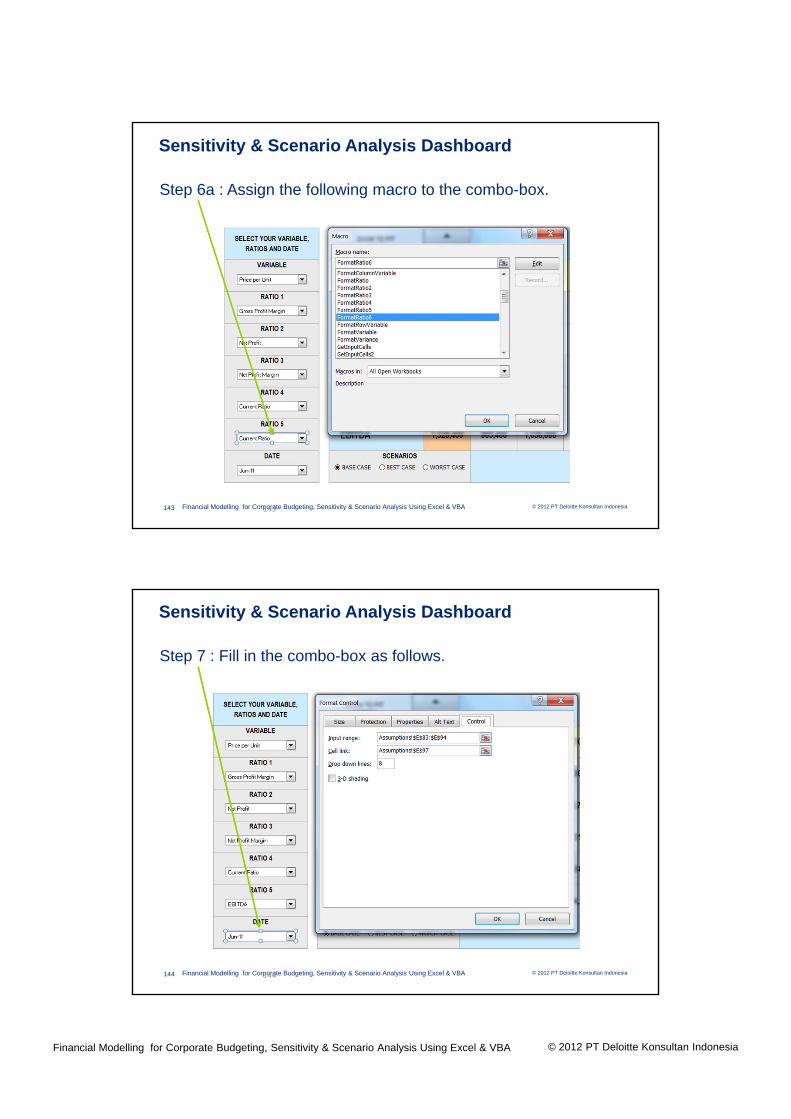
143
Step 6a : Assign the following macro to the combo-box.
© 2012 PT Deloitte Konsultan IndonesiaFinancial Modelling for Corporate Budgeting, Sensitivity & Scenario Analysis Using Excel & VBA144
Sensitivity & Scenario Analysis Dashboard
144
Step 7 : Fill in the combo-box as follows.
© 2012 PT Deloitte Konsultan IndonesiaFinancial Modelling for Corporate Budgeting, Sensitivity & Scenario Analysis Using Excel & VBA
© 2012 PT Deloitte Konsultan IndonesiaFinancial Modelling for Corporate Budgeting, Sensitivity & Scenario Analysis Using Excel & VBA145
Sensitivity & Scenario Analysis Dashboard
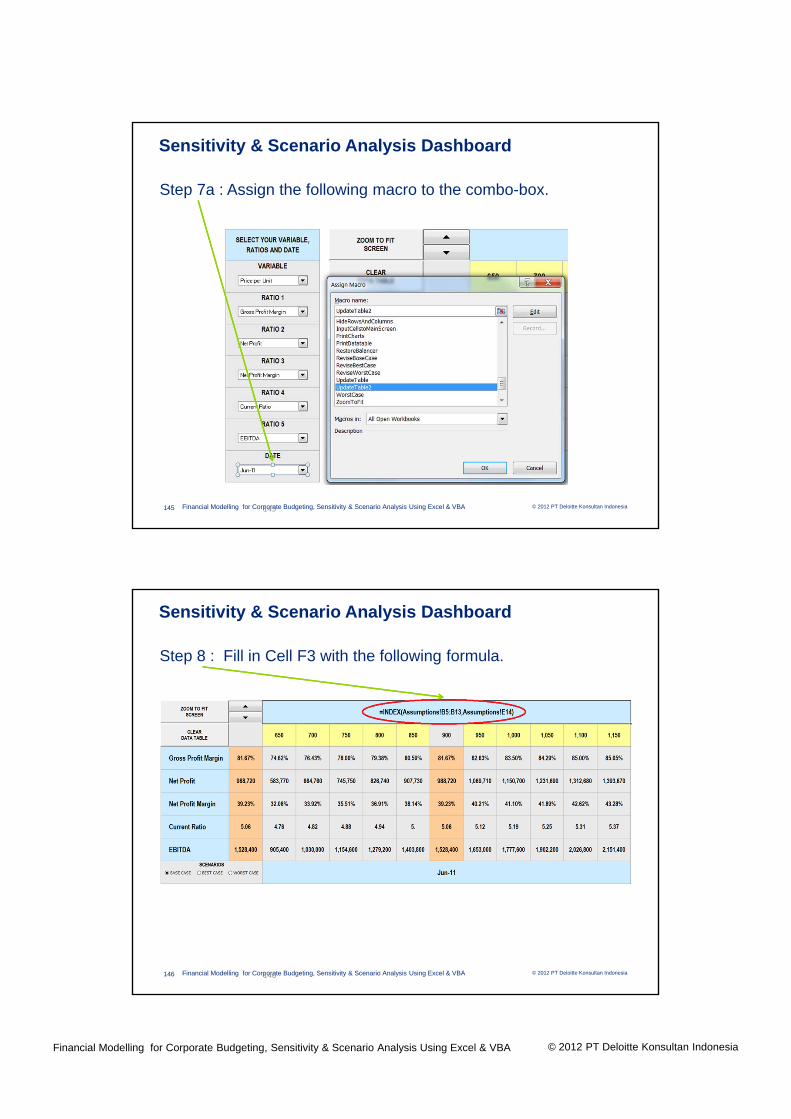
145
Step 7a : Assign the following macro to the combo-box.
© 2012 PT Deloitte Konsultan IndonesiaFinancial Modelling for Corporate Budgeting, Sensitivity & Scenario Analysis Using Excel & VBA146
Sensitivity & Scenario Analysis Dashboard
146
Step 8 : Fill in Cell F3 with the following formula.
© 2012 PT Deloitte Konsultan IndonesiaFinancial Modelling for Corporate Budgeting, Sensitivity & Scenario Analysis Using Excel & VBA
© 2012 PT Deloitte Konsultan IndonesiaFinancial Modelling for Corporate Budgeting, Sensitivity & Scenario Analysis Using Excel & VBA147
Sensitivity & Scenario Analysis Dashboard
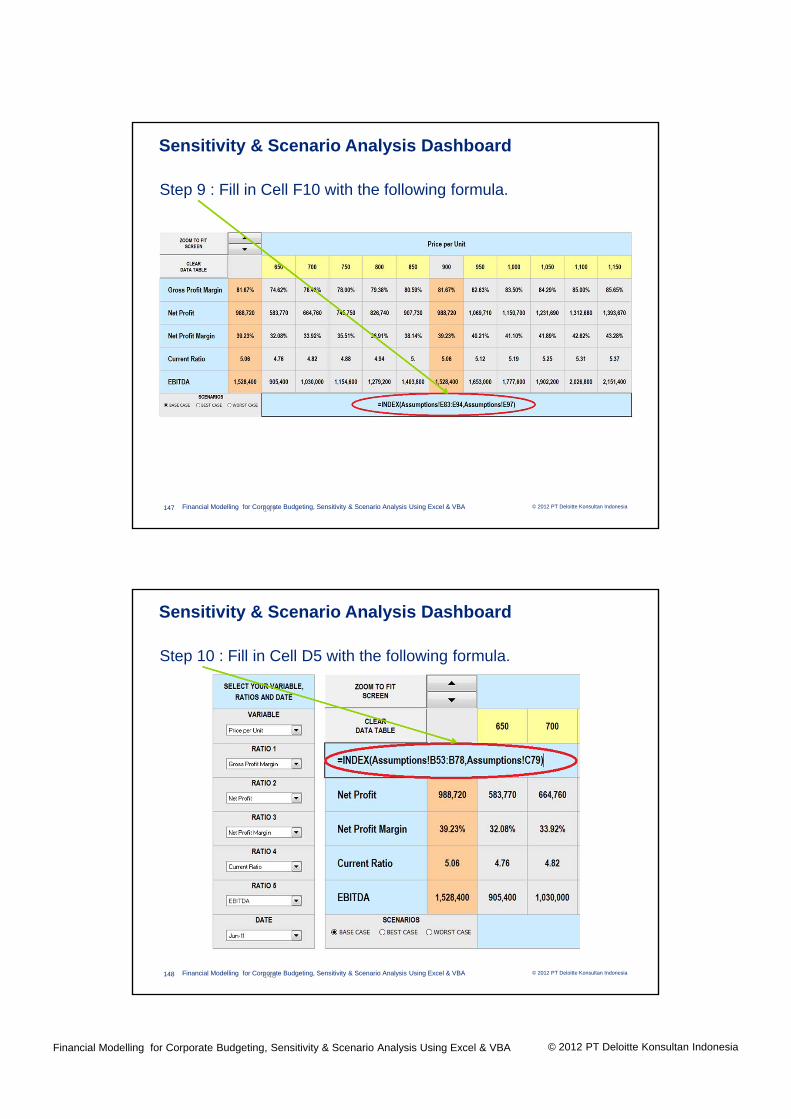
147
Step 9 : Fill in Cell F10 with the following formula.
© 2012 PT Deloitte Konsultan IndonesiaFinancial Modelling for Corporate Budgeting, Sensitivity & Scenario Analysis Using Excel & VBA148
Sensitivity & Scenario Analysis Dashboard
148
Step 10 : Fill in Cell D5 with the following formula.
© 2012 PT Deloitte Konsultan IndonesiaFinancial Modelling for Corporate Budgeting, Sensitivity & Scenario Analysis Using Excel & VBA
© 2012 PT Deloitte Konsultan IndonesiaFinancial Modelling for Corporate Budgeting, Sensitivity & Scenario Analysis Using Excel & VBA149
Sensitivity & Scenario Analysis Dashboard
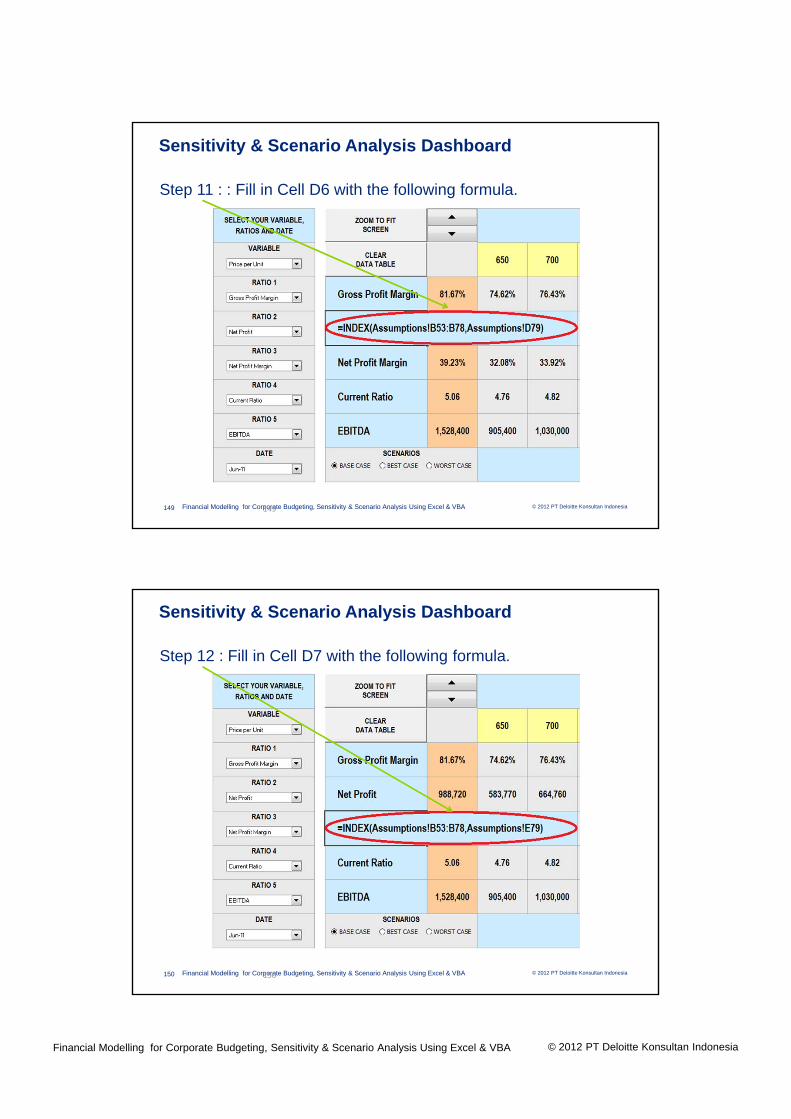
149
Step 11 : : Fill in Cell D6 with the following formula.
© 2012 PT Deloitte Konsultan IndonesiaFinancial Modelling for Corporate Budgeting, Sensitivity & Scenario Analysis Using Excel & VBA150
Sensitivity & Scenario Analysis Dashboard
150
Step 12 : Fill in Cell D7 with the following formula.

© 2012 PT Deloitte Konsultan IndonesiaFinancial Modelling for Corporate Budgeting, Sensitivity & Scenario Analysis Using Excel & VBA
© 2012 PT Deloitte Konsultan IndonesiaFinancial Modelling for Corporate Budgeting, Sensitivity & Scenario Analysis Using Excel & VBA151
Sensitivity & Scenario Analysis Dashboard
151
Step 13 : Fill in Cell D8 with the following formula.
© 2012 PT Deloitte Konsultan IndonesiaFinancial Modelling for Corporate Budgeting, Sensitivity & Scenario Analysis Using Excel & VBA152
Sensitivity & Scenario Analysis Dashboard
152
Step 14 : Fill in Cell D9 with the following formula.
© 2012 PT Deloitte Konsultan IndonesiaFinancial Modelling for Corporate Budgeting, Sensitivity & Scenario Analysis Using Excel & VBA
© 2012 PT Deloitte Konsultan IndonesiaFinancial Modelling for Corporate Budgeting, Sensitivity & Scenario Analysis Using Excel & VBA153
Sensitivity & Scenario Analysis Dashboard
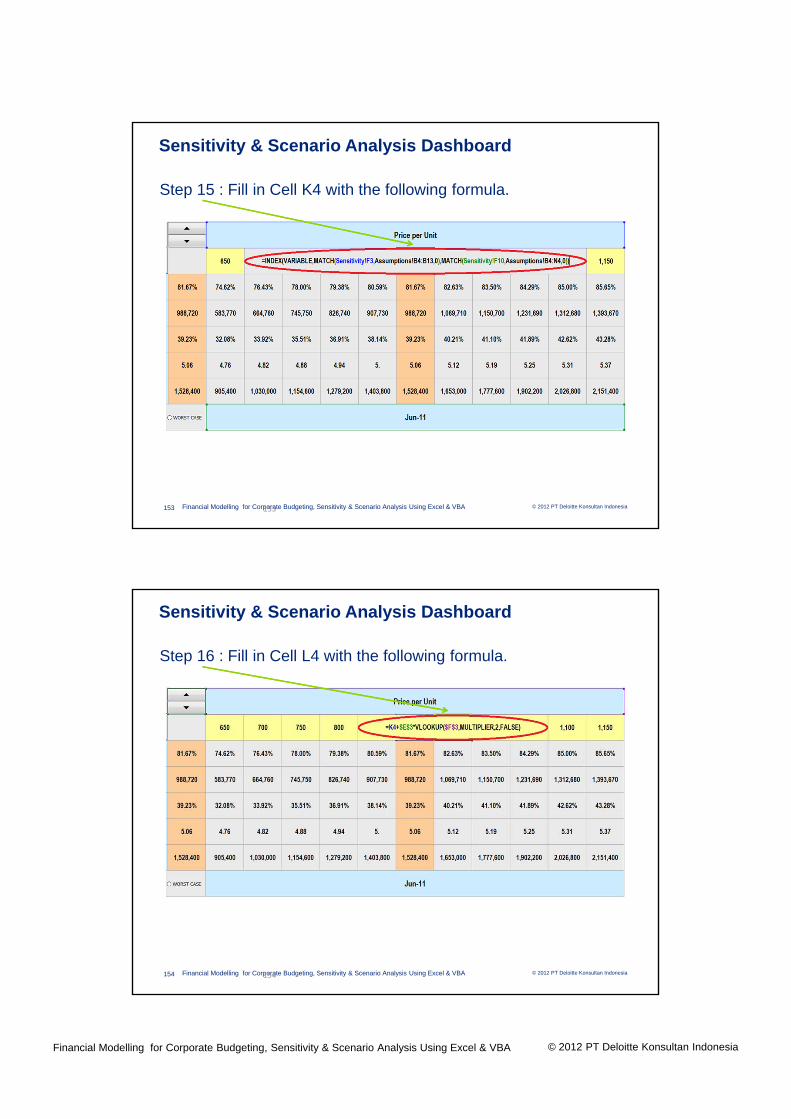
153
Step 15 : Fill in Cell K4 with the following formula.
© 2012 PT Deloitte Konsultan IndonesiaFinancial Modelling for Corporate Budgeting, Sensitivity & Scenario Analysis Using Excel & VBA154
Sensitivity & Scenario Analysis Dashboard
154
Step 16 : Fill in Cell L4 with the following formula.
© 2012 PT Deloitte Konsultan IndonesiaFinancial Modelling for Corporate Budgeting, Sensitivity & Scenario Analysis Using Excel & VBA
© 2012 PT Deloitte Konsultan IndonesiaFinancial Modelling for Corporate Budgeting, Sensitivity & Scenario Analysis Using Excel & VBA155
Sensitivity & Scenario Analysis Dashboard
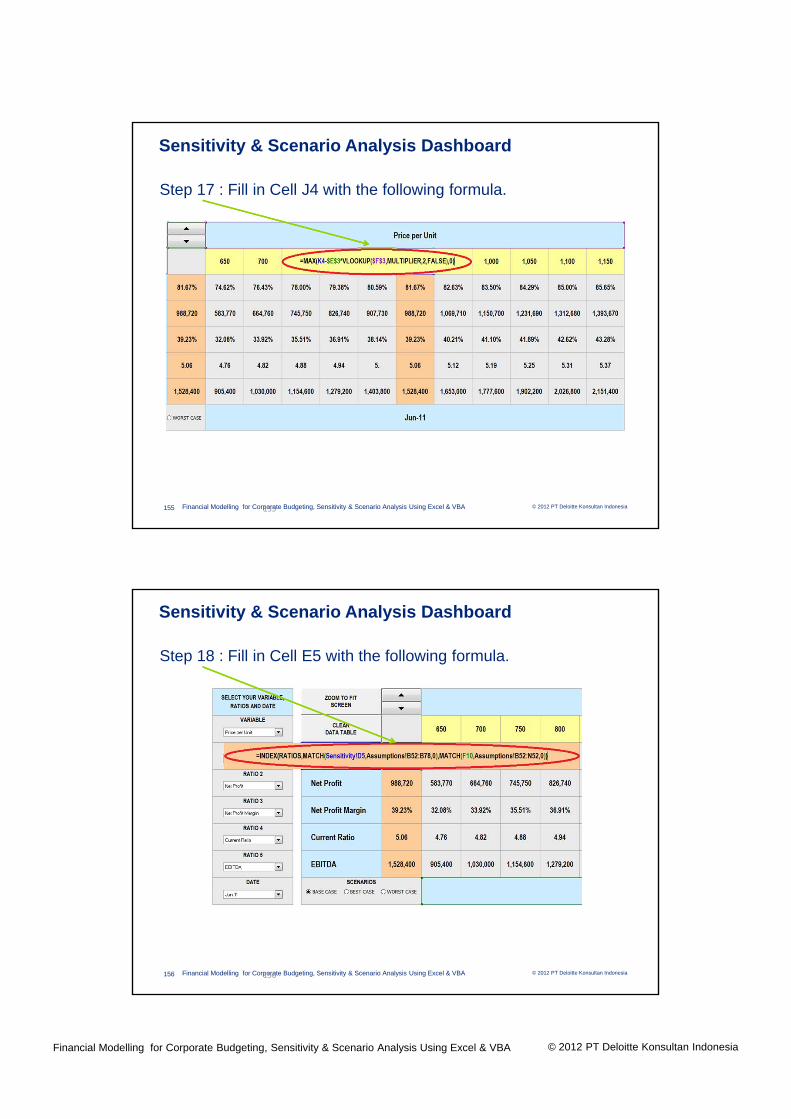
155
Step 17 : Fill in Cell J4 with the following formula.
© 2012 PT Deloitte Konsultan IndonesiaFinancial Modelling for Corporate Budgeting, Sensitivity & Scenario Analysis Using Excel & VBA156
Sensitivity & Scenario Analysis Dashboard
156
Step 18 : Fill in Cell E5 with the following formula.

© 2012 PT Deloitte Konsultan IndonesiaFinancial Modelling for Corporate Budgeting, Sensitivity & Scenario Analysis Using Excel & VBA
© 2012 PT Deloitte Konsultan IndonesiaFinancial Modelling for Corporate Budgeting, Sensitivity & Scenario Analysis Using Excel & VBA157
Sensitivity & Scenario Analysis Dashboard
157
Step 19 : Fill in Cell E6 with the following formula.
© 2012 PT Deloitte Konsultan IndonesiaFinancial Modelling for Corporate Budgeting, Sensitivity & Scenario Analysis Using Excel & VBA158
Sensitivity & Scenario Analysis Dashboard
158
Step 20 : Fill in Cell E7 with the following formula.
© 2012 PT Deloitte Konsultan IndonesiaFinancial Modelling for Corporate Budgeting, Sensitivity & Scenario Analysis Using Excel & VBA
© 2012 PT Deloitte Konsultan IndonesiaFinancial Modelling for Corporate Budgeting, Sensitivity & Scenario Analysis Using Excel & VBA159
Sensitivity & Scenario Analysis Dashboard
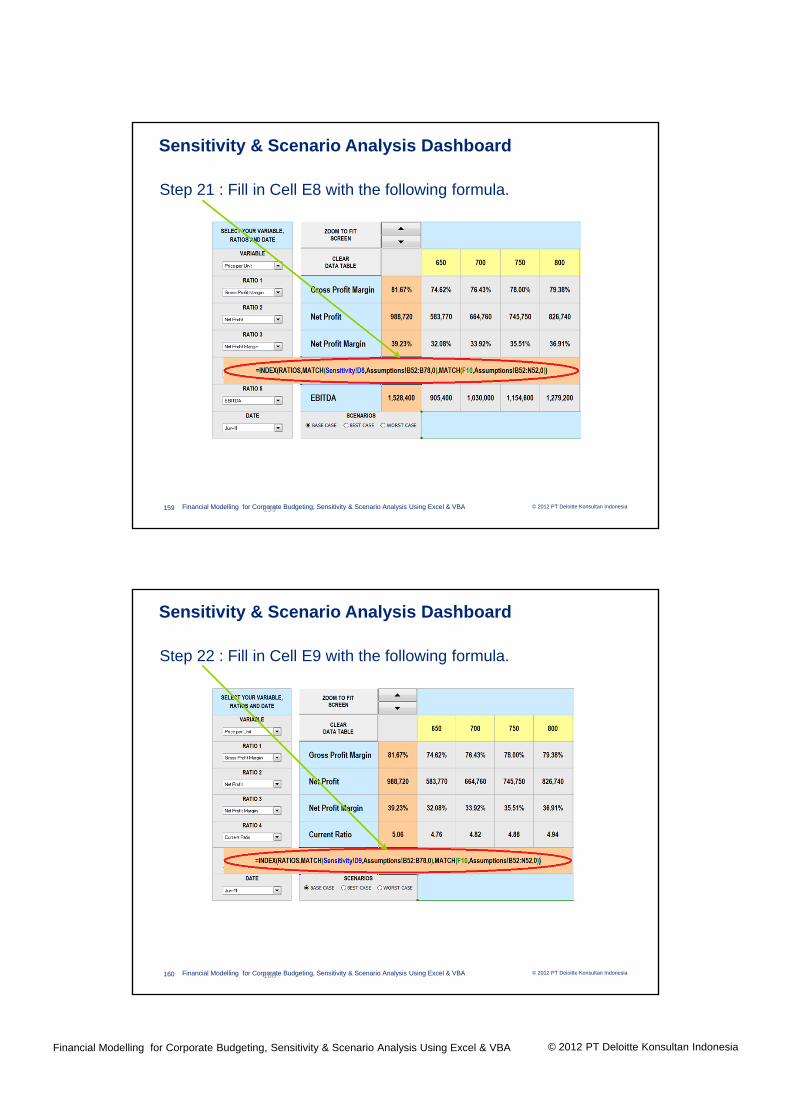
159
Step 21 : Fill in Cell E8 with the following formula.
© 2012 PT Deloitte Konsultan IndonesiaFinancial Modelling for Corporate Budgeting, Sensitivity & Scenario Analysis Using Excel & VBA160
Sensitivity & Scenario Analysis Dashboard
160
Step 22 : Fill in Cell E9 with the following formula.

© 2012 PT Deloitte Konsultan IndonesiaFinancial Modelling for Corporate Budgeting, Sensitivity & Scenario Analysis Using Excel & VBA
© 2012 PT Deloitte Konsultan IndonesiaFinancial Modelling for Corporate Budgeting, Sensitivity & Scenario Analysis Using Excel & VBA161
Sensitivity & Scenario Analysis Dashboard
161
Step 23 : Right click on the spin button, select Format Control, and set the maximum value at 10.
© 2012 PT Deloitte Konsultan IndonesiaFinancial Modelling for Corporate Budgeting, Sensitivity & Scenario Analysis Using Excel & VBA162
Sensitivity & Scenario Analysis Dashboard
162
Step 24 : Right click on the macro button, select Assign Macro and select ZoomToFitScreen2.

© 2012 PT Deloitte Konsultan IndonesiaFinancial Modelling for Corporate Budgeting, Sensitivity & Scenario Analysis Using Excel & VBA
© 2012 PT Deloitte Konsultan IndonesiaFinancial Modelling for Corporate Budgeting, Sensitivity & Scenario Analysis Using Excel & VBA163
Sensitivity & Scenario Analysis Dashboard
163
Step 25 : Right click on the macro button, select Assign Macro and select ClearDataTable2.
© 2012 PT Deloitte Konsultan IndonesiaFinancial Modelling for Corporate Budgeting, Sensitivity & Scenario Analysis Using Excel & VBA164
Sensitivity & Scenario Analysis Dashboard
164
Step 26 : Right click on the option button for Base Case, select Assign Macro and select BaseCase. Do the same step for the other 2 option buttons (Best Case and Worst Case).

© 2012 PT Deloitte Konsultan IndonesiaFinancial Modelling for Corporate Budgeting, Sensitivity & Scenario Analysis Using Excel & VBA
© 2012 PT Deloitte Konsultan IndonesiaFinancial Modelling for Corporate Budgeting, Sensitivity & Scenario Analysis Using Excel & VBA165
Sensitivity & Scenario Analysis Dashboard
165
Now our dashboard is ready to be used for performing a sensitivity and scenario analysis.
Sensitivity:• Select the variable• Select the outputs (Ratio 1 thru 5)• Select the date• And see the results!
Scenario:• Select any one of the 3 scenarios and see the results.
Any questions?
Deloitte refers to one or more of Deloitte Touche Tohmatsu Limited, a UK private company limited by guarantee, and its network of member firms, each of which is a legally separate and independent entity. Please see www.deloitte.com/about for a detailed description of the legal structure of Deloitte Touche Tohmatsu Limited and its member firms.
Member of Deloitte Touche Tohmatsu Limited