Delivery Program - Eurobodalla Shire
49
Delivery Program 2013–17 Operational Plan & Budget 2016–17
Transcript of Delivery Program - Eurobodalla Shire
Eurobodalla ShirE CounCil dP/oP 2013 ?????
Delivery Program
2013–17
Operational Plan & Budget
2016–17

iiiAchieving the PlAn
How to contact us
In person Eurobodalla Shire Council Corner Vulcan & Campbell Streets, Moruya Monday to Friday, 8.30am to 4.30pm
Phone 02 4474 1000 For after–hours emergencies call 1800 755 760
Fax 02 4474 1234
Mail PO Box 99, Moruya NSW 2537
DX DX 4871
Email [email protected]
Web www.esc.nsw.gov.au and click “Your Say”
Delivery Program 2013–17 Operational Plan & Budget 2016–17
How will we stay in touch with youEurobodalla Shire Council will send Living in Eurobodalla out to 25,000 households and businesses three to four times a year so we can keep you up-to-date with our news and events. Other ways we will stay in touch include inviting you to have a say about plans and strategies, and providing information at our libraries and on our Noticeboard page in the local papers.
Our website and e-newsletter, Council News, along with our social media tools will also keep you informed. If you have any questions, your Councillors are always available and you can meet them and Council staff at events and activities throughout the year.
Community information is also made freely available at the Dr Mackay and Batemans Bay community centres. There are also links to networks, people and groups in Council’s Community Services Directory, an online directory of sporting, cultural and other interest groups available on Council’s website.

vxxxxxxx
ContentsA message from our Mayor and General Manager vi
Fit for the future 2Our action plan 4Our infrastructure 6Your rates for 2016–17 8What do your rates pay for? 10
Delivery Program 2013–17 and Operational Plan 2016–17 page 13
Delivery Program 14
Operational Plan 16
How we will report on progress 19
Liveable communities 20
Sustainable communities 34
Productive communities 46
Collaborative communities 58
Support services 66
Budget 2016–17 page 74
Revenue policy page 82

A message from our Mayor and General Manager
of our Integrated Economic Growth and Development Strategy, new international tourism opportunities, a comprehensive program of business development workshops and the extension of our popular streetscaping works in Batemans Bay.
The long term environmental sustainability of both our infrastructure and associated processes is a key consideration for council and this is reflected in our 2016-17 works program. We will work with Essential Energy to undertake a bulk street light lamp replacement, moving to more energy efficient LED bulbs, resulting in significant savings. We will provide a new waste cell and specialty waste centre at Surf Beach as well as emission reduction measures at both Surf Beach and Brou landfill sites. Internally we will investigate and move towards paperless processes in our development application system and also across the organisation as a whole.
Our Operational Plan shows that we will deliver over $59 million of capital and renewal works in 2016-17. These works will provide a significant boost to the local economy through provision of materials and services, support growth and local employment through improved transport and infrastructure, strengthening our community.
We have successfully sourced grant funding for many of the significant infrastructure projects planned for this year including Runnyford, Cadgee and Tyrone bridges, the new roundabout at Hanging Rock, South Batemans Bay Link road and the Moruya Arts Facility.
We will also implement the second year of our Community and Transport Infrastructure program which has a focus on improving the accessibility of infrastructure in our community, including public toilets, playgrounds and the Batemans Bay CBD streetscaping.
We look forward to an exciting and busy year ahead implementing our Fit for the Future actions, a significant capital works program, and an array of special projects to work towards a stronger Council and community that is a destination of choice to live, visit, work and invest both now, and in the future.
Councillor Lindsay Brown Mayor
Dr Catherine Dale General Manager
1EurobodaLLa ShirE CounCiL dELiVErY ProGraM 2013–2017 oPEraTionaL PLan & budGET 2016–17
vi
The news in October that the Independent Pricing and Regulatory Tribunal (IPART) assessed Eurobodalla Shire Council as being a stand-alone council and ‘fit for the future’ was a very pleasing result. It signaled the beginning of a challenging and rewarding time for Council as we work towards implementing the strategies outlined in our improvement proposal.
We will need to undertake a continuous process of monitoring and review to ensure we meet our commitments in relation to the seven Fit for the Future benchmarks as well as identified community needs. The Fit for the Future reform package also provides support and financial incentives such as subsidised loans and prioritised funding access for councils, and we look forward to taking advantage
of these as we move towards a more sustainable future.
This Operational Plan presents the final one year budget and program of works for our current four year Delivery Program and council term. While we are proud of what we have achieved together over the last three years, we still have some great initiatives planned for the coming twelve months.
Local government elections will be held later this calendar year and we are currently preparing for the review of our suite of Integrated Planning and Reporting documents which will include the new Delivery Program, aligned with the new council term. To do this we will run a comprehensive and innovative community driven engagement process.
In preparing for this review we
will complete the State of Shire report to define the state of play for Eurobodalla and inform future planning. We will also prepare the End of Term report which will show what we have done to work towards our community vision and goals over the past four years.
We look forward to working with the new Joint Organisation for our area and building on our relationship with our neighbour Bega Valley Shire Council. These strong strategic partnerships will help us to improve performance efficiencies and service delivery, as well as continuing to participate in the streamlining of legislation.
We will continue to focus on building our economy through sustainable economic and business growth. It will be exciting times for Eurobodalla with the development
Welcome
About this planThis document combines Council’s Delivery Program, Operational Plan and Budget. Together they show how Council will contribute to delivering on community goals and objectives outlined in the Community Strategic Plan – One Community. To better link these documents, we have used the four focus areas of the Community Strategic Plan - Liveable, Sustainable, Productive, and Collaborative communities to structure the Delivery Program.
The Delivery Program sets out the activities that Council will complete in a four year period which is aligned to a Council term, along with measures we will use to track our progress in achieving the activities. The Operational Plan shows services, key projects and capital works that Council will deliver in the coming year. The Budget shows our income, expenditure and capital programs for the year ahead.
This document also includes information on rates in the Revenue Policy. Please visit Council’s website, www.esc.nsw.gov.au for our fees and charges.

Eurobodalla Shire Council was one of only 52 councils to be declared ‘fit’ under the NSW Governments Fit for the Future reform program. We achieved this by demonstrating a process of continuous improvement in relation to our financial sustainability and performance against the seven fit for the future ratios.
To maintain our financial health and ‘fit’ status Council will continually review its performance and adjust our actions accordingly to ensure we continue to meet the benchmarks within the required timeframes and maintain ongoing financial sustainability.
The key financial strategy in the past year and going forward is to redirect funds towards meeting our longer term infrastructure renewal needs. Asset condition data, particularly for our road pavements is telling us that many will be due for renewal in the medium to long term.
Renewal expenditure requirements need to be financed. The strategy is to target small to moderate operating surpluses through implementation of our fit for the future strategies. We will reduce expenditure and increase income, redirect dividends and finance the remaining requirements from external borrowings. This strategy will meet our short to medium infrastructure renewal needs.
However, in the very long term, there are some indications that successive borrowings to fund renewals may have an impact on the operating result and hence the operating statement ratio. While this is a long way off annual revision of renewal needs through asset management plans will provide more accurate and reliable information to ensure the impact is minimised.
In preparing our Operational Plan 2016-17 we have completed the annual revision of our budgets and updated our actual and forecast performance against the benchmarks based on our latest estimates. The revised budget position indicates that while there is some variance from the original forecast position, we are still on track to meet the benchmarks to be deemed fit, both in the five and ten year timeframe.
Variance between our original forecast position and the revised position is shown in the table on page 2 and outlined in summary below.
• Operating performance ratio: The revised 2016-17 ratio is less than the forecast predominantly due to the receipt of significant grant funding in 2015-16 with the majority of spending to occur in this financial year. This is offset by increased Roads to Recovery grant funds, the review of borrowings and the implementation of the Treasury Management Strategy.
• Own source revenue ratio: The revised 2016-17 ratio has decreased from the forecast largely due to the acceptance of additional grant funding opportunities.
• Building and infrastructure asset renewal ratio: The revised 2016-17 ratio has improved from the forecast as more renewal work is scheduled including additional bridge replacements, waste cell works, and upgrading street lights.
• infrastructure backlog ratio: The revised ratio for 2016-17 has improved due to improved asset information, significant increase in the written down value of General Fund assets following the revaluation of assets and our increased targeted works program.
• Debt service ratio: The revised 2016-17 ratio has decreased from the forecast due to the review of borrowings and the implementation of the Treasury Management Strategy.
• Real operating expenditure per capita: The revised 2016-17 ratio has increased due to the acceptance of grants which results in greater expenditure in our programs.
Fit for the Future
32 EurobodaLLa ShirE CounCiL dELiVErY ProGraM 2013–2017 oPEraTionaL PLan & budGET 2016–17
Fit for the Future ratios 2016–17 Original *
2016–17 Revised
2019–20 Year 5
2024–25 Year 10
Financial sustainability
Operating Performance Ratio (greater than or equal to break-even average over 3 years)
-0.02 -0.005
Own Source Revenue Ratio(greater than 60% average over 3 years)
69.51% 65.16%
Building and Infrastructure Renewal Ratio(greater than 100% average over 3 years)
108.50% 122.78%
infrastructure service management
Infrastructure Backlog Ratio (less than 2%) 13.15% 7.92%
Asset Maintenance Ratio (greater than 100% average over 3 years)
100.00% 100.00%
Debt Service Ratio (greater than 0% and less than or equal to 20% average over 3 years)
8.14% 6.57%
Efficiency
Real operating expenditure per capita (decrease over time)
1.37 1.48
* Original – as adopted in Fit for the Future Improvement Proposal

4 EurobodaLLa ShirE CounCiL dELiVErY ProGraM 2013–2017 oPEraTionaL PLan & budGET 2016–17
aChiEVinG ThE PLan
Our action plan
5
To ensure we maintain financial sustainability and continue to meet our forecast performance against fit for the future ratios, Council has developed a realistic, achievable and quantifiable action plan. Ongoing implementation of the action plan, which is now in year two, will meet all benchmarks within a 10 year timeframe and achieve the core objectives of:
• ConsistentimprovedperformanceagainsttheBuildingandInfrastructureAssetRenewalandInfrastructureBacklogRatiostomeetthe benchmark within 10 years
• ImprovedOperatingPerformanceRatiotoachievemodestsurpluseseachyearsothatfundscanbedirectedtoinfrastructurerenewalworks
• SustainedperformanceagainsttheremainingfourFitfortheFutureBenchmarks
• Ongoingcommunitybenefit
The actions we will implement in 2016-17 are listed in the tables below.
Action Resp.*
Balance the cost of service delivery with income levelsImplement Community Engagement Strategy for Integrated Planning & Reporting suite review
CARS
Prepare and publish End of Term Report. CARS
Prepare, exhibit and adopt revised Community Strategic Plan.
CARS
Prepare, exhibit and adopt Delivery Program 2017-21 and Operational Plan 2017-18 informed by community engagement outcomes.
CARS
Develop implementation plan for property strategy. FBD
Undertake audit of Council operational land. FBD
Continued implementation of Moruya Airport Master Plan.
FBD
Ongoing review of commercial lease agreements. FBD
Ongoing benchmarking and review of Council fees and charges.
FBD
Develop, exhibit and adopt policy for donations and discounts.
FBD
Implement actions from audit of Council community facilities.
CARS
Continued pursuit of grant opportunities for ongoing service delivery, infrastructure renewals program and new capital works.
All
Undertake annual audit of compliance with best practice for Council Water and Sewer businesses.
IS
Optimise infrastructure financing
Revise, document and implement a detailed financial strategy. FBD
Review Council’s borrowing policy, capacity and program in conjunction with development on financial strategy.
FBD
Ongoing targeted use of debt to meet infrastructure requirements in line with financial strategy.
FBD
Action Resp.*
increase capacity and focus on long term planning and sustainabilityImplement endorsed community engagement framework.
All
Develop and implement education program on Integrated Planning & Reporting and Fit for the Future for councillors and new employees.
CARS
Ongoing detailed reporting on Fit for the Future performance.
CARS/ FBD
Develop revised Long Term Financial Plan that reflects engagement outcomes and financial strategy.
FBD
Identify and explore options for more effective enhanced financial and budgeting software.
FBD
Review budget methodology and systems and adopt preferred budgeting approach.
FBD
Revise Council's fiscal responsibility policy and code of practice.
FBD
Develop and implement finance training program for staff.
PSS/FBD
Develop Integrated Economic Growth and Development Strategy.
GM
Exhibit and adopt revised Development Contributions Plan for Section 94 and 94a contributions.
PSS
Prepare, exhibit and adopt revised Developer Servicing plans for Water and Sewer section 64 contributions.
IS
Actively participate as an effective member of the South East Joint Organisation.
GM
Promote accessible tourism products and experiences. CT
Improve and expand digital tourism marketing activities, and tourism partnerships and marketing programs with the Canberra region.
CT
Promote Eurobodalla as the place to invest and do business.
FBD
Financial sustainability Financial sustainability is measured by the Operating Performance Ratio, Own Source Revenue Ratio and Building and Infrastructure Asset Renewal Ratio
Action Resp.*
Optimise infrastructure to meet community needUndertake independent assessment of Council asset management practices.
IS
Undertake revaluations of ‘other structures’ asset class. IS
Implement asset management strategy improvement plan. IS
Review, exhibit and adopt the Recreation and Open Space Strategy.
CARS
Revise Asset Management Strategy and Improvement Plan based on independent assessment and agreed levels of service.
IS
Recreation, community and operational facilities assets component condition data, review of useful lives and renewal program.
IS
Review and update recreation facilities asset management plan incorporating Recreation and Open Space Strategy review outcomes.
IS
Implement routine maintenance programs in accordance with asset management plans.
IS
increase organisational efficiency
Develop and implement Information Technology Strategy. FBD
Ongoing installation of solar and battery storage on Council facilities.
IS
Transition of streetlights to LEDs. IS
Ongoing implementation of Greenhouse Action Plan. PSS
Participate in and report on benchmarking and comparative data exercises.
GM
Review the Workforce Management Plan with consideration of Community Strategic Plan and Delivery Program review.
GM
Develop and implement internal training program on procurement code of practice.
IS
Develop and implement savings, productivity improvement and cost containment register.
FBD
Implement Internal Audit Program. GM
Infrastructure and service management Infrastructure and service management is measured by the Infrastructure backlog ratio, Asset maintenance ration and Debt service ratio.
Action Resp.*
Ensure ratepayers receive value for money in service delivery
Ongoing service review program. GM
Undertake advocacy in relation to emergency services in regional areas.
IS
Efficiency Efficiency is measured by the real operating expenditure per capita ratio
* GM - General Manager; CARS - Community, Arts & Recreation; FBD - Finance & Business Development; IS - Infrastructure Services; PSS - Planning & Sustainability Services; CT - Communications & Tourism

EurobodaLLa ShirE CounCiL dELiVErY ProGraM 2013–2017 oPEraTionaL PLan & budGET 2016–17
Our infrastructureService Budget C&TiP* Total
Transport $18.94 million $2.17 million $21.11 million
Sewer services $10.14 million - $10.14 million
Organisation support $6.43 million $250,000 $6.68 million
Waste management $6.41 million - $6.41 million
Business development & events $5.06 million $233,500 $5.29 million
Community spaces $2.35 million $2.63 million $4.98 million
Water services $3.25 million - $3.25 million
Libraries, arts & culture $1.11 million - $1.11 million
Organisation development $30,000 - $30,000
Social inclusion $25,000 - $25,000
Executive services $15,500 - $15,500
$26.5 millionnew capital works
In 2016-17 we will deliver a capital works program valued at over $59 million. While our primary focus is on addressing our infrastructure renewal and backlog to ensure we remain fit for the future, we also need to ensure we meet current and emerging community needs which may require the construction of new infrastructure.
As part of this program, we will deliver the second year of our Community and Transport Infrastructure Program. This year the program will cost $5.28 million and include $3.82 million of renewal works.
Council aims to deliver all projects planned and budgeted for in the coming year. However, there are factors outside our control which can impact the delivery of the capital program. These can include extreme weather events, pre-construction approval processes and successful grant applications for community or regional infrastructure that may result in the need to reprioritise planned works.
Full details of the proposed capital works programs for each service and how they are funded are provided in the Operational Plan section of this document from pg 27.
* Community and Transport Infrastructure Program
$32.5 millionrenewal works
Public toilets program $407,200This year we will focus on upgrading the accessibility of our public toilets in the following key locations:• DurrasLakeboatramp• LyonsPark,BatemansBay• Casey’sBeachNorth• MaluaBayforeshore• JackBuckleyPark,Tomakin• CoronationDrive,Broulee• Mainbeach,MoruyaHeads• TilbaOval
Batemans Bay street scaping $1.01 million
We will continue our efforts to build Batemans Bay as a vibrant Regional centre,. with streetscaping works programmed for North Street and Orient Street.
Designs have been prepared in consultation with the Batemans Bay Streetscaping Sunset Advisory Committee.
Playground expansions $625,960
Our focus on accessible infrastructure will extend to our playgrounds this year. Playgrounds at Gundary Oval, Moruya and Rotary Park, Narooma will have upgrades that include accessible and inclusive elements.
Roads program $1.08 millionOur roads program will receive a significant boost this year from the Community & Transport Infrastructure Program.
Additional funding has been allocated to further our gravel resheet and reseal programs, and complete reconstruction of Old South Coast Road, Narooma.
7
Capital program
Some of the major projects that will be delivered as part of the capital program this year include:
Batemans Bay Link Road $5 million
A further $5 million in grant funding will see construction commence on the next stage of the South Batemans Bay Link Road.
Construction is expected to be completed in early 2018.
Bridge renewals $3.2 millionCouncil has successfully sourced grant funding for the renewal of Cadgee bridge which washed away in a flood event last year. Runnyford bridge will be replaced and Tyrone bridge will be rebuilt over two years.
Surf Beach landfill $5.5 millionEurobodalla’s future waste needs will be able to be met in a sustainable and efficient way with the constructino of a new waste cell at Surf Beach.
The new cell will be complemented by emission reduction measures at both Surf Beach and Brou landfills sites.
Moruya arts facility $897,950Cultural opportunities will be expanded for residents and visitors with the construction of the new arts centre in Moruya.
The project, which is $700,000 grant funded, will be completed this year.
Some of the major projects that will be delivered as part of the Community and Transport Infrastructure program this year include:
6

9Eurobodalla ShirE CounCil dEliVErY ProGraM 2013–2017 oPEraTional Plan & budGET 2016–17
8
Average residential rate impact 2015-16 ($)
2016-17 ($)
Change (%)
General rate 869.05 925.65 6.5
Environmental levy 35.45 36.30 2.4
Garbage collection service 293.50 302.30 3.0
Sewer – residential 20mm 886.00 902.00 1.8
Water – residential 20mm 289.00 294.00 1.7
Average water bill* 348.00 352.00 1.1
Stormwater charge 25.00 25.00 -
Estimated total rates 2,746.00 2,837.25 3.3
Change in average annual rates and charges $ 91.25
Extra cost per week for the average household $ 1.75
* Based upon 100 kilolitres consumption pa and an average residential property value of $184,332
This year Council is proposing to increase the General Rate by 6.5% and the Environment Levy by 2.4% in accordance with the rate variation approved by the Independent Pricing and Regulatory Tribunal (IPART) in 2015.
General changes to rates in 2016-17 and the implications for our ratepayers include:
• Therewillbea6.5%increasetotheGeneralRateinallrating categories (residential, farmland and business)
• Thewaterusagechargewillincrease1.1%to$3.52per kilo litre to maintain best practice pricing
• Therewillbea3%increaseinwastefeestocovercosts of major capital infrastructure.
The tables on page 9 summarise the impact of the proposed rates and charges for 2016-17.
For further information on the rating structure please refer to the Revenue Policy section of this document, or contact Council’s Rates Hotline on 4474 1355.
Did you know?If an increase to your rates could cause you to experience financial hardship, Council has in place a Rates and Debtors hardship policy that might be able to assist.
Council can work with you to tailor an individual response and ensure appropriate assistance is provided to any ratepayer experiencing hardship.
If you would like to discuss this further please contact Council’s rates department.
Your rates for 2016-17
Average business rate impact 2015-16 ($)
2016-17 ($)
Change (%)
General rate 3,103.03 3,304.58 6.5
Environmental levy 47.36 48.50 2.4
Waste charge 48.30 49.75 3.0
Sewer – business 20mm 886.00 902.00 1.8
Sewer usage charge 231.00 234.96 1.7
Liquid trade waste base charge 94.50 96.20 1.8
Liquid trade waste usage charge 184.80 187.44 1.4
Water – business 20mm 289.00 294.00 1.7
Average water bill* 1,531.20 1,548.00 1.1
Stormwater charge 50.00 50.00 -
Estimated total rates 6,465.19 6,715.43 3.9
Change in average annual rates and charges $250.24
Extra cost per week for the average business $4.81
* Based upon 440 kilolitres consumption pa. Liquid trade waste discharge factor of 30%. Sewer Discharge factor of 30% and an average business property value of $297,178
Average farmland rate impact 2015-16 ($)
2016-17 ($)
Change (%)
General rate 1339.44 1,426.54 6.5
Environmental levy 68.31 69.94 2.4
Waste charge 48.30 49.75 3.0
Estimated total rates 1456.05 1,546.23 6.2
Change in average annual rates and charges $90.18
Extra cost per week for the average household $1.73
* Based on an average farmland property value of $509,512

10 11
In 2016–17 rates paid by our community will make up 54% of Council’s total income. The diagram below shows how $100 of your rates is distributed across the services Council delivers and some key projects that each service will deliver this year.
Water Services• Deepcreekdam
drainage
• Waterrefillstations
• Watermeterreplacement program
$21.50
Development services •Buildersanddevelopers
forum
•Pre-lodgementadvice
•Paperlessdevelopmentassessment - Stage 1
$2.70
Tourism•DestinationManagementPlan
review
•Marketingcampaigns
•Driveleadstotourismbusiness
$1.80
Waste Management•Emissionreduction
program
•SpecialtywastecentreSurfBeach
•Householdwasteandrecycling guide
$7.20
Transport• Tyronebridgerepalcement
• Runnyfordbridgereplacement
• HangingRockroundabout
$13.50
Sustainability •Coastalweedsof
national significance program
•Streetlightingupgrade
•GreyHeadedFlyingFox dispersal program
$1.00
Social Inclusion•Poolandsurflifesaving
contracts
•Communitydevelopmentaction plan
•HealthyCommunitiesandSeniors Week grants
$2.20
Community connections•Involve,Revolve,
Evolve project
•Supportedaccommodation
•DeliverCommunityTransport service
$0.30
Business development & events •Airportredevelopment
project
•Coordinateeventsassistance program
•RenewEurobodallaproject
$0.70
Libraries, arts and culture• Moruyaartsfacility
• PublicArtAdvisoryCommittee
• E-collectionexpansion
$2.40
Communication •Communityengagement
training for staff
•LivinginEurobodallamagazine
•Mobileresponsivewebproject
$0.80
Strategic planning •ResidentialLandsStrategy
•RecreationandOpenSpaceStrategy
•BatemansBayUrbanCreekFlood Study
$2.00
What do my rates pay for?In 2016-17 Council will manage an income of $106 million (excluding capital grants and contributions). Rates and annual charges make up 54% of that income.
The role of local councils has come a long way since the days of roads, rates and rubbish. Today, we actively seek additional revenue and grants, and identify innovative ways to fund and deliver many more services to meet our community’s needs and expectations.
It’s a typical Saturday – you’ve been down at the beach swimming and walking along the foreshore, and are heading home, riding along the roads and cycleway when you decide to call into your local library to use the internet and borrow some books and CDs. That afternoon you watch a game of footy at the local oval after having a BBQ with a few friends as the children play on the playground in the nearby park and walk home on footpaths under the street lights.
Most of your activities involved the use of facilities maintained or provided by Council. There are many more essential services provided by us such as stormwater drainage that you couldn’t even see.
Community spaces•Corrigansreserve
inclusive playground
•HangingRockbasketball stadium new roof
•Publictoiletimprovement program
$12.60
Sewer Services • Bodallaseweragescheme
• Bingieseweragetreatmentplant upgrade
• Manholerestorationprogram
$25.40
EurobodaLLa ShirE CounCiL dELiVErY ProGraM 2013–2017 oPEraTionaL PLan & budGET 2016–17
Public & environmental health & safety•EstuaryHealthProject
•Firemitigationworkson Council land
•OnsiteSewageManagement System inspection program
$3.30
Executive services •Developstrategic
partnerships
•2016elections
•Civicfunctionsandevents
$2.60
Integrated planning •StrategicServicesservice
review
•CommunityStrategicPlan review
$0*
Support services•Paperlessoffice
project
•CustomerService Charter review
$0*
Rates and annual charges 54%
User fees and other 24%
Grants 19%
Investment revenue 3%
* Support services and Integrated planning are $0 as they are not funded by your rates.

The Delivery Program is based upon the four focus areas from our Community Strategic Plan - One Community.
• Liveable – focussed on ensuring our community and recreation services meet the needs of our community; that a sense of identity is valued and developed in villages and towns; and celebrating events and festivals.
• Sustainable – focussed on increasing sustainable use of resources; responsible land use planning; ensuring diverse and affordable housing; enhancing our heritage; and delivery of water and sewer services.
• Productive – focussed on the provision of well–planned infrastructure; sustainable growth and development; and making our shire a great place to visit, live, work and invest.
• Collaborative – focussed on ensuring the connection of all leaders across the community; ensuring community participation in decision making; and that Council is efficient, effective and makes the best decisions for current and future generations.
Each focus area incorporates an introduction that highlights Council’s relevant services; Council’s response to community priorities; budget allocations; and also a set of measures that will be used to track progress toward achievement of Council’s four year activities.
The Operational Plan and Budget 2016-17 follows directly from the Delivery Program and details individual projects and services Council will provide in a financial year to directly address key activities in the Delivery Program.
Each service shows the responsible manager and the actions of the service, as well as a group of measures that allow us to track how the service has performed in the 2016-17 year.
Finally, the document includes Council’s Revenue Policy which includes the proposed rates, fees and charges for the next year. Council’s fees and charges for the 2016-17 period are outlined in a separate document.
13
Delivery Program 2013–17 Operational Plan & Budget 2016–17
EurobodaLLa ShirE CounCiL dELiVErY ProGraM 2013–2017 oPEraTionaL PLan & budGET 2016–17
12
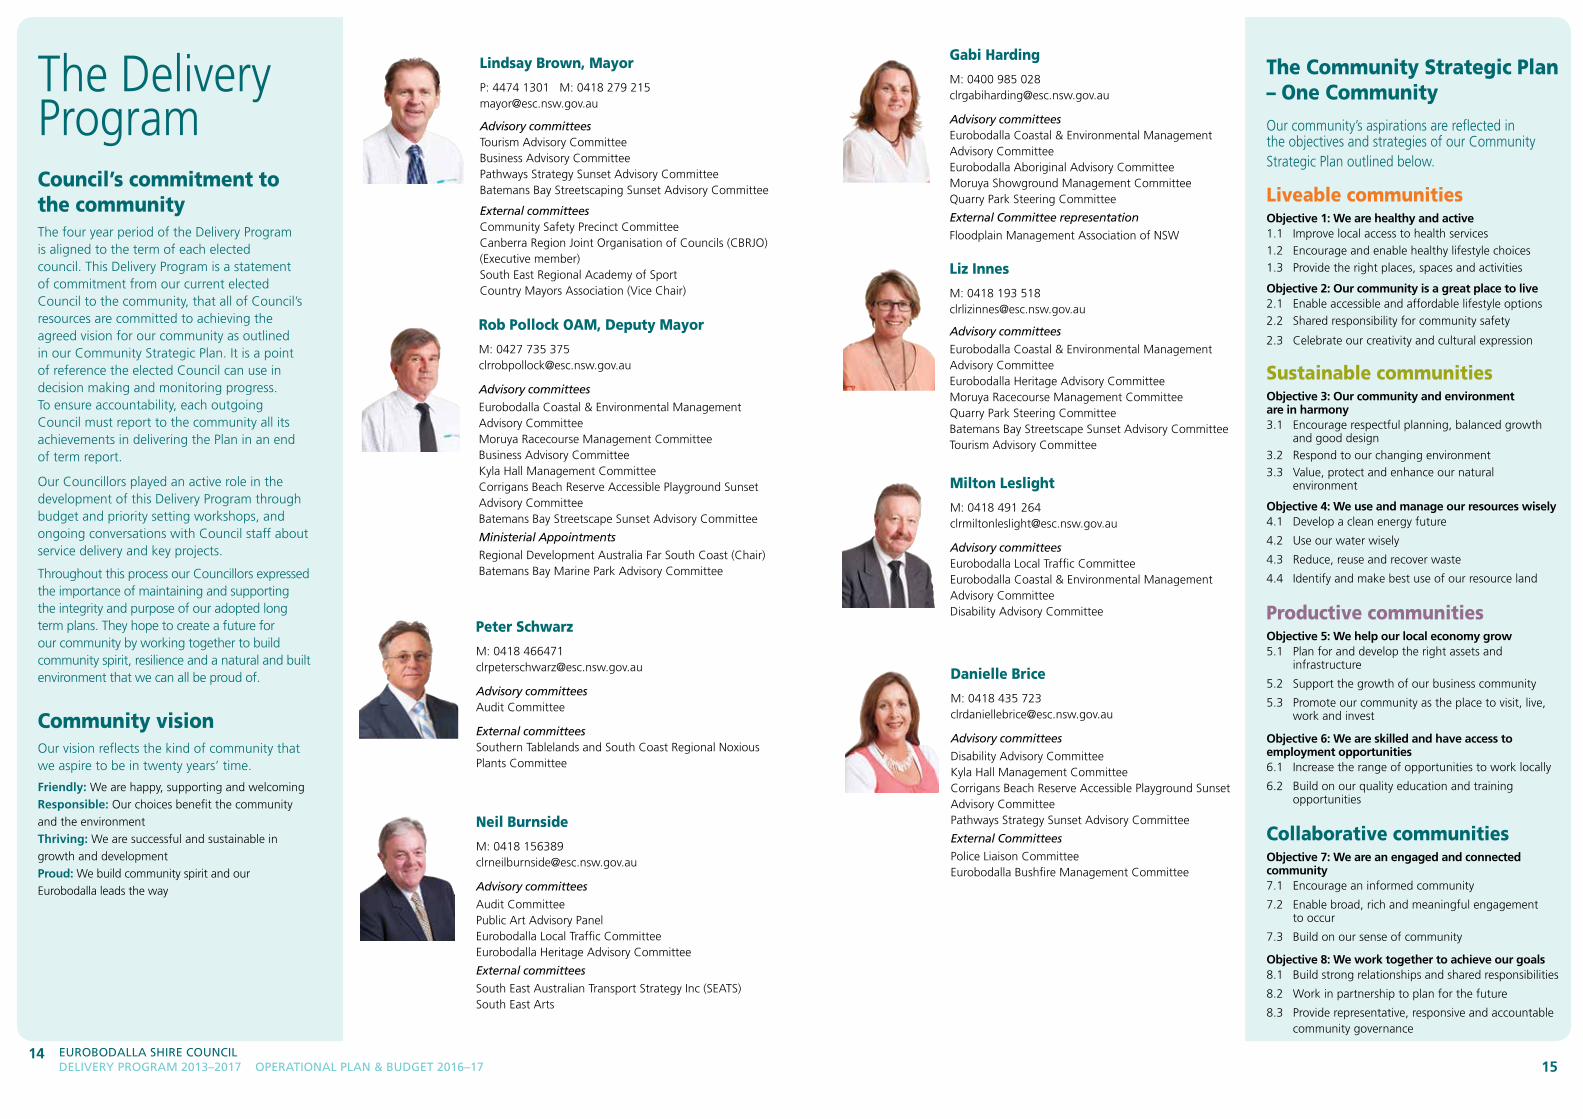
Council’s commitment to the communityThe four year period of the Delivery Program is aligned to the term of each elected council. This Delivery Program is a statement of commitment from our current elected Council to the community, that all of Council’s resources are committed to achieving the agreed vision for our community as outlined in our Community Strategic Plan. It is a point of reference the elected Council can use in decision making and monitoring progress. To ensure accountability, each outgoing Council must report to the community all its achievements in delivering the Plan in an end of term report.
Our Councillors played an active role in the development of this Delivery Program through budget and priority setting workshops, and ongoing conversations with Council staff about service delivery and key projects.
Throughout this process our Councillors expressed the importance of maintaining and supporting the integrity and purpose of our adopted long term plans. They hope to create a future for our community by working together to build community spirit, resilience and a natural and built environment that we can all be proud of.
Community vision Our vision reflects the kind of community that we aspire to be in twenty years’ time.
Friendly: We are happy, supporting and welcomingResponsible: Our choices benefit the community and the environmentThriving: We are successful and sustainable in growth and developmentProud: We build community spirit and our Eurobodalla leads the way
Lindsay Brown, Mayor
P: 4474 1301 M: 0418 279 [email protected]
Advisory committees Tourism Advisory CommitteeBusiness Advisory CommitteePathways Strategy Sunset Advisory CommitteeBatemans Bay Streetscaping Sunset Advisory Committee
External committeesCommunity Safety Precinct CommitteeCanberra Region Joint Organisation of Councils (CBRJO) (Executive member)South East Regional Academy of SportCountry Mayors Association (Vice Chair)
Peter Schwarz
M: 0418 [email protected]
Advisory committeesAudit Committee
External committeesSouthern Tablelands and South Coast Regional Noxious Plants Committee
Danielle Brice
M: 0418 435 [email protected]
Advisory committees
Disability Advisory CommitteeKyla Hall Management CommitteeCorrigans Beach Reserve Accessible Playground Sunset Advisory CommitteePathways Strategy Sunset Advisory Committee
External Committees
Police Liaison CommitteeEurobodalla Bushfire Management Committee
Neil Burnside
M: 0418 [email protected]
Advisory committees
Audit CommitteePublic Art Advisory Panel Eurobodalla Local Traffic CommitteeEurobodalla Heritage Advisory Committee
External committees
South East Australian Transport Strategy Inc (SEATS)South East Arts
Gabi Harding
M: 0400 985 [email protected]
Advisory committeesEurobodalla Coastal & Environmental Management Advisory CommitteeEurobodalla Aboriginal Advisory CommitteeMoruya Showground Management CommitteeQuarry Park Steering Committee
External Committee representation
Floodplain Management Association of NSW
Liz Innes
M: 0418 193 518 [email protected]
Advisory committees
Eurobodalla Coastal & Environmental Management Advisory CommitteeEurobodalla Heritage Advisory CommitteeMoruya Racecourse Management Committee Quarry Park Steering CommitteeBatemans Bay Streetscape Sunset Advisory CommitteeTourism Advisory Committee
Milton Leslight
M: 0418 491 [email protected]
Advisory committeesEurobodalla Local Traffic CommitteeEurobodalla Coastal & Environmental Management Advisory CommitteeDisability Advisory Committee
Rob Pollock OAM, Deputy Mayor
M: 0427 735 [email protected]
Advisory committees
Eurobodalla Coastal & Environmental Management Advisory CommitteeMoruya Racecourse Management Committee Business Advisory CommitteeKyla Hall Management CommitteeCorrigans Beach Reserve Accessible Playground Sunset Advisory CommitteeBatemans Bay Streetscape Sunset Advisory Committee
Ministerial Appointments
Regional Development Australia Far South Coast (Chair)Batemans Bay Marine Park Advisory Committee
The Delivery Program
The Community Strategic Plan – One CommunityOur community’s aspirations are reflected in the objectives and strategies of our Community Strategic Plan outlined below.
Liveable communitiesObjective 1: We are healthy and active1.1 Improve local access to health services1.2 Encourage and enable healthy lifestyle choices1.3 Provide the right places, spaces and activities
Objective 2: Our community is a great place to live2.1 Enable accessible and affordable lifestyle options2.2 Shared responsibility for community safety
2.3 Celebrate our creativity and cultural expression
Sustainable communitiesObjective 3: Our community and environment are in harmony3.1 Encourage respectful planning, balanced growth
and good design3.2 Respond to our changing environment3.3 Value, protect and enhance our natural
environment
Objective 4: We use and manage our resources wisely4.1 Develop a clean energy future
4.2 Use our water wisely
4.3 Reduce, reuse and recover waste
4.4 Identify and make best use of our resource land
Productive communitiesObjective 5: We help our local economy grow5.1 Plan for and develop the right assets and
infrastructure
5.2 Support the growth of our business community
5.3 Promote our community as the place to visit, live, work and invest
Objective 6: We are skilled and have access to employment opportunities6.1 Increase the range of opportunities to work locally
6.2 Build on our quality education and training opportunities
Collaborative communitiesObjective 7: We are an engaged and connected community7.1 Encourage an informed community
7.2 Enable broad, rich and meaningful engagement to occur
7.3 Build on our sense of community
Objective 8: We work together to achieve our goals8.1 Build strong relationships and shared responsibilities
8.2 Work in partnership to plan for the future
8.3 Provide representative, responsive and accountable community governance
1415
EurobodaLLa ShirE CounCiL dELiVErY ProGraM 2013–2017 oPEraTionaL PLan & budGET 2016–17
17EurobodaLLa ShirE CounCiL dELiVErY ProGraM 2013–2017 oPEraTionaL PLan & budGET 2016–17
16
How will we implement the Plan
Our ValuesCouncil’s values guide the way we do business and deliver all our activities and services for the benefit of the community
integrity: We do what we say we will do with honesty, provide consistent advice and behave ethically
Fairness: We work together, recognise and value the diversity of views in all that we do
Empathy: We show respect, openness and understanding in our interactions and communications with others
Excellence: We strive to be the best in what we do by fostering a culture of continuous improvement and innovation
Leadership: We set a clear direction, focus attention on what is really important, provide every opportunity to achieve success and lead by example
The Operational Plan
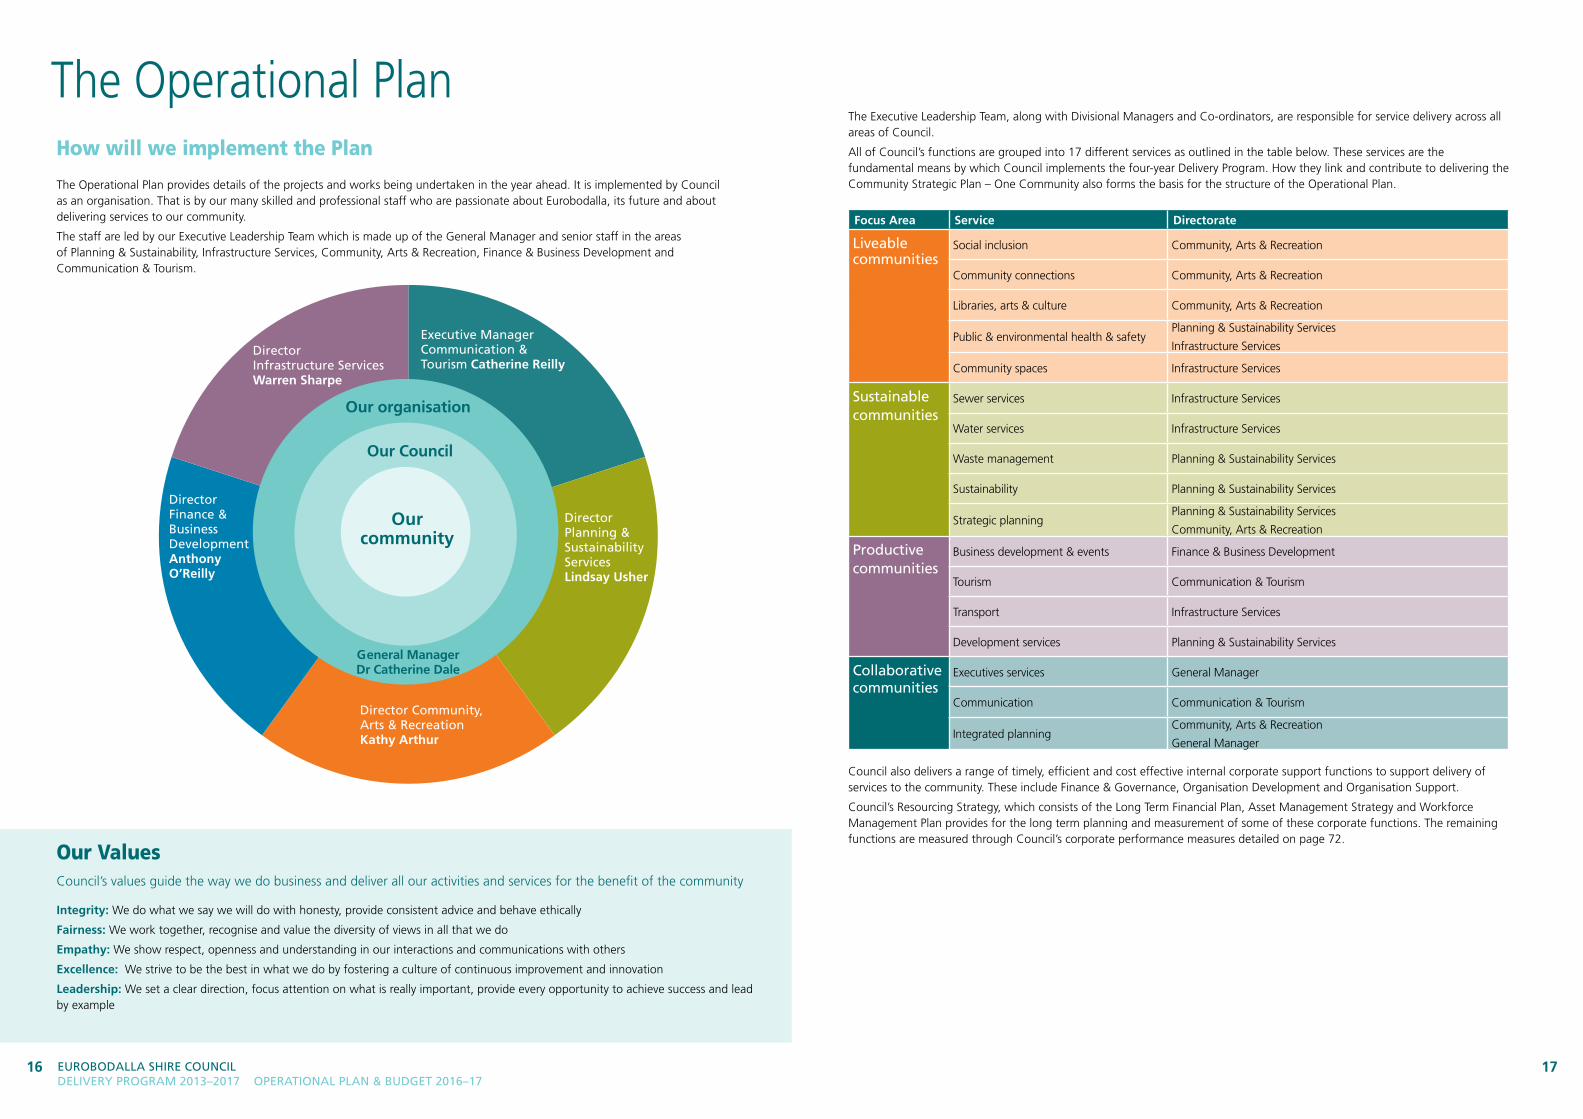
The Operational Plan provides details of the projects and works being undertaken in the year ahead. It is implemented by Council as an organisation. That is by our many skilled and professional staff who are passionate about Eurobodalla, its future and about delivering services to our community.
The staff are led by our Executive Leadership Team which is made up of the General Manager and senior staff in the areas of Planning & Sustainability, Infrastructure Services, Community, Arts & Recreation, Finance & Business Development and Communication & Tourism.
The Executive Leadership Team, along with Divisional Managers and Co-ordinators, are responsible for service delivery across all areas of Council.
All of Council’s functions are grouped into 17 different services as outlined in the table below. These services are the fundamental means by which Council implements the four-year Delivery Program. How they link and contribute to delivering the Community Strategic Plan – One Community also forms the basis for the structure of the Operational Plan.
Focus Area Service Directorate
Liveable communities
Social inclusion Community, Arts & Recreation
Community connections Community, Arts & Recreation
Libraries, arts & culture Community, Arts & Recreation
Public & environmental health & safetyPlanning & Sustainability Services
Infrastructure Services
Community spaces Infrastructure Services
Sustainable communities
Sewer services Infrastructure Services
Water services Infrastructure Services
Waste management Planning & Sustainability Services
Sustainability Planning & Sustainability Services
Strategic planningPlanning & Sustainability Services
Community, Arts & Recreation
Productive communities
Business development & events Finance & Business Development
Tourism Communication & Tourism
Transport Infrastructure Services
Development services Planning & Sustainability Services
Collaborative communities
Executives services General Manager
Communication Communication & Tourism
Integrated planning Community, Arts & Recreation
General Manager
Our community
director infrastructure Services Warren Sharpe
director Finance & business development Anthony O’Reilly
General Manager Dr Catherine Dale
Our Council
Executive Manager Communication & Tourism Catherine Reilly
director Planning & Sustainability Services Lindsay Usher
director Community, arts & recreation Kathy Arthur
Council also delivers a range of timely, efficient and cost effective internal corporate support functions to support delivery of services to the community. These include Finance & Governance, Organisation Development and Organisation Support.
Council’s Resourcing Strategy, which consists of the Long Term Financial Plan, Asset Management Strategy and Workforce Management Plan provides for the long term planning and measurement of some of these corporate functions. The remaining functions are measured through Council’s corporate performance measures detailed on page 72.
Our organisation

19Eurobodalla ShirE CounCil dEliVErY ProGraM 2013–2017 oPEraTional Plan & budGET 2016–17
18
Integrated Planning & Reporting FrameworkAll councils are required to develop short, medium, and long–term plans under the NSW Integrated Planning and Reporting (IPR) Framework.
This plan, which includes the Delivery Program 2013–17, Operational Plan and Budget for 2015-16 is a key document to meet these legislative requirements.
Community Strategic Plan – One CommunityThe community’s plan for the future. Council has a role in preparing and monitoring the Plan on behalf of the community. Many agencies, groups and partners play a role in delivering the plan, including Council.
• 20yearplan
• Overarchingvisiondevelopedbythecommunity
• Definesstrategiestoachievecommunitygoals
• SupportedbyResourcingStrategy
Resourcing StrategyA suite of plans that ensures Council has the necessary assets, people and money to deliver on the Delivery Program and Operational Plan. Includes:
• AssetManagementStrategy–10yearplan
• LongTermFinancialPlan–10yearplan
• WorkforceManagementPlan–4yearplan
Delivery ProgramCouncil’s commitment to delivering on the goals and objectives the community outlined in the Community Strategic Plan – One Community.
• Fouryearplan
• AlignedwithCouncillortermofoffice
• SetsoutactivitiesCouncilwillundertaketodeliverontheCommunityStrategicPlan
Operational PlanCouncil’s annual service delivery plan including budget and rating information. Shows the key projects and works council will undertake to achieve in the year to work towards achieving the Delivery Program.
• Oneyearplan
• ProvidesinformationandfunctionsofallCouncilservices
• IncludesCouncilbudgetandrevenuepolicy
It is important to both Council and the community that we measure and report on our progress.
The plans are all inter connected. Progress toward the Operational Plan contributes to the implementation of the Delivery Program which contributes to achieving our community’s goals and objectives as outlined in the Community Strategic Plan – One Community.
Measures are designed to inform each other and tell a story about Council’s progress towards achieving the Community Strategic Plan, both day to day and over longer periods of time.
The diagram below identifies the types of reports we will provide, what we will measure and what reporting periods will be covered.
How we will report on progress?
Perpetual monitoring and review
State of Shire Report
Four years
Community Strategic Plan
10+ years
Delivery Program
Four years
Operational Plan & Budget
Annually
Resourcing Strategy
Community Input
Integration with local and
regional plans
End of Term report
Four years
Annual Report
Annually
Performance report
Six monthly
Quarterly Budget Review
Quarterly
The different reports we will provide, what we will measure and the reporting periods are outlined below
Budget Review• Quarterly• Budgetonly
Performance Report• Sixmonthly
• Reports on progress in implementing the Operational Plan projects and works through service output measures
Annual Report
• Annually
• Reportsonprogressinimplementing the Delivery Program activities through outcome measures and operational plan projects and works
• Alsoincludesstateoftheenvironment report, audited financial reports and other statutory information
End of Term Report
• Four yearly in line with end of Council term
• Showsprogressinimplementing the goals of the Community Strategic Plan – one Community during Councillor’s term of office through high level community or population indicators

20 21EurobodaLLa ShirE CounCiL dELiVErY ProGraM 2013–2017 oPEraTionaL PLan & budGET 2016–17
LiVEabLE
liveable communitiesOur community prioritiesCommunity priorities are expressed as objectives in the Community Strategic Plan – One Community.
Objectives and strategies for a liveable community include:
1. We are healthy and active 1.1 Improve local access to health services 1.2 Encourage and enable health lifestyle choices 1.3 Provide the right places, spaces and activities2. Our community is a great place to live 2.1 Enable accessible and affordable lifestyle options 2.2 A shared responsibility for community safety 2.3 Celebrate our creativity and cultural expression
Council’s role• Advocateforbetterhealthservicesforthecommunity• Providehomeandcommunitycareservices• Promotehealthylifestylechoicestostaffandthecommunity• Supportlocalsportinggroupsandclubs• Ensurerecreationopportunitiesandfacilitiestomeetchangingneeds• Attractandassistrecreationproviders• Providesharedpathways• Advocateandplanforimprovedsocial,healthandhousing
outcomes• Deliverprogramsandservicesthatsupportourcommunityinall
stages of life• Monitorandregulateenvironmentalandfoodsafetystandards• Promoteresponsibleanimalownership• Promoteandplanforimprovedroadsafety• Supportcommunityeventsandfestivals• ConductNAIDOCWeekactivities• Providegrantprograms• Providelibraryservices• Coordinateandpromoteartsandculturalprograms• Undertakebushfirehazardreduction
• Supportlocalemergencyservices

22 23EurobodaLLa ShirE CounCiL dELiVErY ProGraM 2013–2017 oPEraTionaL PLan & budGET 2016–17
Improving accessibility of our amenitiesCouncil has an ongoing commitment to improving access and inclusion for people with a disability living in and visiting Eurobodalla.
This year we are will implement year two of our Community and Transport Infrastructure Program with a focus on improving the accessibility of our public amenities.
Six of our highly used existing public toilet buildings will be upgraded to incorporate accessible toilets. These include: Lyons Park, Batemans Bay; Caseys Beach North; Malua Bay foreshore; public reserve, Tomakin; Coronation Parade, Broulee; and Main Beach, South Head, Moruya.
This improvement program meets a key priority in our Disability Action Plan to improve access to Council owned buildings, facilities and public spaces and also ensures compliance with the Australian Building Code standards and legislation.
A healthy active EurobodallaThis year we will implement a number of support and development initiatives to assist our community to be healthy and active.
We will hold our regular Sports Forum which gives sports groups and open space users the opportunity to meet with staff, discuss issues and share information on facilities, upcoming grants and training. Our e-newsletter, Recreation Matters, will also be distributed monthly.
In an effort to ensure our community infrastructure meets both future community and sports development needs, we will focus on developing relationships with recreation peak bodies to further inform planning and delivery of key recreation infrastructure.
Other support initiatives include the return of the rego roadshow which promotes key sport registration times across Eurobodalla; volunteer training and workshops; free on-line Sports Community training webinars; and, low and no-cost healthy activities through our Live Life program.
Enriching cultural lifeMoruya Library is set to expand to include arts and exhibition facilities thanks to a $500,000 grant from the Australian Government announced in December. The funding complements a $200,000 library development grant already received from the NSW Government for the project.
Stage one of the library expansion will start in late 2016 with the construction of a professional standard exhibition space, an expanded library, and public meeting spaces for learning and business activities.
Construction is expected to take around 10 months and the new spaces will feature videoconferencing facilities, sound-rated moveable walls for flexible use of the floor space, temperature control to meet professional standards for exhibitions, and kitchen facilities.
Once stage one is underway, Council will be able to pursue further funding for stages two and three of the development, which include practical art spaces for workshops, small performances and events.
A facility of this quality will allow us to attract high quality national and travelling exhibitions to the region, enriching the cultural life of our community.
Hanging Rock road upgradeThis year Council will complete works to provide a new upgraded entrance to the Hanging Rock Regional Sporting Complex.
The roundabout will not only improve access to and from Beach Road but also improve traffic and pedestrian safety for users of the library, TAFE, university campus, tennis, sporting fields, boat ramp, sailing club, skate park, basketball courts and other recreational activities.
The works will include an upgrade to the road between the new roundabout and the car park at the AFL/cricket field, formalising car parking, speed management and tree planting.
These works build on Council’s actions over the last few years to rebuild sporting fields and progressively see Hanging Rock developed as a regional sporting complex.
Get involved at your local libraryAs well as keeping to their conventional role as the keeper of our stories, your local library is forging ahead with an exciting program of community events and activities.
The libraries’ lineup is divided into different streams, ensuring there is something for everybody.
The Exhibitions and Performance stream gives local visual artists, crafts people, musicians and performers the chance to show off their talent and showcase new material in an intimate setting.
The Creating and Learning stream will offer the opportunity to improve skills and try new things from digital photography to self-publishing and more.
Imaginactive sparks the imagination and inspires library goers to connect with their creativity.
History and heritage fosters and supports our local narratives.
All of this, along with featured events, storytelling, School holiday programs, author talks and book launches ensures our libraries continue to be a powerhouse of creativity and innovation.
Beautifying Batemans BayConstruction will commence in 2016 on streetscaping work to create a more vibrant and active town centre in Batemans Bay.
Council has worked closely with the Batemans Bay Streetscape Sunset Committee and the community to develop the design for the upgrade of North Street and Orient Street.
The style of the works, which will be similar to the Clyde Street improvements, will include new outdoor eating opportunities, new paving treatments, additional trees and parking, fairy lights, improved seating and resting areas, improved pedestrian facilities, new street furniture and opportunities for art.
The works have been designed to improve accessibility with features such as a new pedestrian crossing across Orient Street built at pathway level, a slower traffic environment in Orient Street and lifting the pathway levels to better match doorways in North Street.
The $1.26 million project will be completed in 2017 and will revitalise Batemans Bay as a regional town centre and a destination for Eurobodalla locals and visitors alike.
22 LiVEabLE

25Eurobodalla ShirE CounCil dEliVErY ProGraM 2013–2017 oPEraTional Plan & budGET 2016–17
24
Delivery Program measuresThese measures are outcome focused and when tracked over time will show Council’s contribution towards implementing the objectives and strategies of the Community Strategic Plan — One Community. They are reported each year in our Annual Report, and also in the End of Council Term report.
Measure Target
Community satisfaction with: •Libraryservice•Clean,safeandhealthyenvironment•Parks&reserves•Playgrounds•Sportsgrounds&amenities•Boatingfacilities•Publictoilets•Towncentres•Pools•Communityhalls&facilities•Cyclewaysandfootpaths•Feelingsafeandpreparedforanemergency
Maintain or improve
Customer satisfaction with management and control of companion animals Maintain or improve
Comparison with benchmarks and best practice – State Library of New South Wales Maintain or improve
Satisfaction with the range of opportunities and support Council provides to older people, people with a disability and their carers Maintain or Increase
Progress in implementing Council’s:•AssetManagementPlans•RecreationandOpenSpaceStrategy
# of works progressed/completed
Use of Council parks, reserves and community facilities Maintain or increase
Community satisfaction with and participation in cultural events and programs Maintain or increase
Community satisfaction with and participation in sport and recreation activitiesEstablish benchmarkNew measure
Lifeguard coverage Maintain or increase
LiVEabLE
Delivery Program activitiesThe Delivery Program outlines the key activities that Council will undertake over a four year period to assist in meeting community objectives and strategies outlined in the Community Strategic Plan — One Community. For the 2013–17 period these key activities include:
Activities
Social inclusion Improve sense of belonging and wellbeing through the provision of child, youth, recreation and social development initiatives and servicesL1.1 Develop and provide essential care services to children and families
L1.2 Plan for and provide opportunities services and activities for youth
L1.3 Implement recreation and community development initiatives
L1.4 Undertake advocacy activities to improve collaboration, health, service availability, development and funding
Community connectionsActively make a difference to the health and wellbeing of older people, people with a disability and their carers
L2.1 Provide access and social participation opportunities
L2.2 Provide case management and accommodation support
L2.3 Provide support and information for carers
L2.4 Undertake advocacy activities to improve collaboration, service availability, development and funding
Libraries, arts & cultureProvide opportunities, facilities, programs and events that support cultural development and lifelong learning
L3.1 Provide quality library services, programs and resources
L3.2 Support and deliver enhanced cultural experiences and programs
L3.3 Plan for and collaborate to develop increased opportunities to engage in cultural appreciation
Public & environmental health & safety Contribute to the health, safety and wellbeing of the community and the environment through a range of health protection, education and regulatory programs
L4.1 Conduct regulatory compliance and enforcement activities
L4.2 Monitor recreational waters
L4.3 Conduct food safety and public health programs
L4.4 Provide support for emergency management and response
L4.5 Assist with planning for and coordination of emergency services
L4.6 Collaborate with agencies and services to deliver coordinated management and response
Community spaces Provide & maintain a safe, sustainable and accessible range of community infrastructure that caters for a range of recreation opportunities
L5.1 Implement Council’s recreation and open space strategy and priority plans of management and master plans
L5.2 Manage and maintain a safe, sustainable and accessible range of community spaces
L5.3 Provide and develop Council’s shared pathway and cycleway network

27Eurobodalla ShirE CounCil dEliVErY ProGraM 2013–2017 oPEraTional Plan & budGET 2016–17
26 LiVEabLE
actions
Activity Action Measure (target)Resp.
officer*L1.1 develop
and provide essential care services to children and families
L1.1.1 Three Bees supported playgroup project
families provided with service (30); supported playgroups (6); funding requirements (met)
DMCARDS
L1.1.2 Provide and manage Out Of School Hours (OOSH) centres and activities
occasions of care (7,500); families provided with child care service (75); National Quality Framework for Education & Care Services (compliance)
DMCARDS
L1.1.3 Provide and manage Vacation Care centres, activities and events
occasions of care (3,400); families provided with child care support (139)
DMCARDS
L1.1.4 Coordinate, support and expand Family Day Care Educators network
occasions of care (12,000); families provided with child care service (120); new educators (2); gatherings (5); compliance training sessions (2)
DMCARDS
L1.2 Plan for and provide opportunities, services and activities for youth
L1.2.1 Provide and manage youth cafes visits (3,200); activities (98) DMCARDSL1.2.2 Coordinate Youth Committee and
associated projectsmeetings (10); major projects (3) DMCARDS
L1.2.3 Coordinate youth events and youth week
events (15); attendance (1,000); community partners (6)
DMCARDS
L1.3 implement recreation and community development initiatives
L1.3.1 Implement volunteer programs and initiatives
volunteers (150); volunteer hours (23,500) DMCARDS
L1.3.2 Coordinate the Toward a Healthier Eurobodalla group and associated projects
meetings (4); projects (4) DMCARDS
L1.3.3 Develop community development action plan
plan (complete) DMCARDS
L1.3.4 Coordinate Healthy Communities, Seniors Week and NAIDOC Week grants
complete (on time and within budget) DMCARDS
L1.3.5 Improve community awareness and usage of recreation facilities
website visits (15% increase); bookings (increase) DMCARDS
L1.3.6 Coordinate management of pools attendance (10% increase); membership (5% increase); customer satisfaction survey (complete)
DMCARDS
L1.3.7 Coordinate management of beach safety
contract conditions (met); number of rescues; Surfer Rescue training course (1)
DMCARDS
L1.3.8 Support capacity building of community and recreation groups
activities (40); peak sporting body partnerships (4); newsletter (10); sports forum (4); online training (60)
DMCARDS
L1.4 undertake advocacy activities to improve collaboration, health, service availability and funding
L1.4.1 Coordinate Aboriginal Advisory Committee, Police Liaison Committee and associated projects
meetings (4 per committee) DMCARDS
L1.4.2 Advocate for improved service delivery and increased funding
unbudgeted grant funding achieved ($); submissions (15)
DMCARDS
L1.4.3 Participate in interagency collaborations and projects
collaboration (evidence of); meetings (80) DMCARDS
*Full list of responsible officer codes detailed on page 90
budgetCost centre income Expenditure Net result Capital expenditureBeach control - 355,663 (355,663) - Childrens services 1,491,062 1,593,057 (101,995) - Community and volunteer services 46,867 599,214 (552,347) - Development contributions 10,000 - 10,000 - Recreation development - 150,536 (150,536) - Social development - 155,236 (155,236) - Youth services 3,785 329,307 (325,522) 25,000
Total 1,551,714 3,183,013 (1,631,299) 25,000
Capital programCapital item Funding source Total
C&TiF* Cash Crown reserves
Grants & cont.
inf. fund
Loans
CS0341: Youth Café, Narooma - replace carpet & repaint - - - - 25,000 - 25,000
Total for social inclusion - - - - 25,000 - 25,000 *Community and Transport Infrastructure Fund
Operational Plan & budget 2016–17SOCIAL INCLUSIONImprove sense of belonging and wellbeing through the provision of child, youth, recreation and social development initiatives and services
Delivery Program budget
Service Yearincome
($)Expenditure
($)Net result
($)
Capital expenditure
($)
Social inclusion
2013-14 1,829,319 3,005,922 (1,176,603) 46,753
2014-15 1,341,375 2,937,603 (1,596,228) 59,980
2015-16 1,469,274 3,437,472 (1,968,198) 50,000
2016-17 1,551,714 3,183,013 (1,631,299) 25,000
Total 6,191,683 12,564,010 (6,372,327) 181,734
2017-18 1,594,915 3,242,704 (1,647,789) -
Community connections
2013-14 4,068,342 4,069,842 (1,500) -
2014-15 4,735,583 4,279,351 456,231 47,585
2015-16 5,217,888 6,234,678 (1,016,790) -
2016-17 5,114,716 5,312,995 (198,279) -
Total 19,136,529 19,896,866 (760,337) 47,585
2017-18 5,125,341 5,324,298 (198,957) -
Libraries, arts & culture
2013-14 215,673 1,789,545 (1,573,872) 189,177
2014-15 233,877 1,892,030 (1,658,153) 183,391
2015-16 164,061 2,090,513 (1,926,452) 443,292
2016-17 176,561 1,988,117 (1,811,556) 1,106,730
Total 790,172 7,760,204 (6,970,032) 1,922,591
2017-18 192,464 2,122,088 (1,929,624) 212,538
Public & environmental health & safety
2013-14 1,328,764 3,201,352 (1,872,588) 1,075,236
2014-15 1,265,980 3,299,971 (2,033,990) 369,436
2015-16 1,334,713 3,558,144 (2,223,431) 488,856
2016-17 1,007,735 3,445,004 (2,437,269) -
Total 4,937,192 13,504,471 (8,567,278) 1,933,528
2017-18 1,025,874 3,487,607 (2,461,733) -
Community spaces 2013-14 2,110,562 10,913,335 (8,802,773) 3,719,595
2014-15 1,238,522 9,977,914 (8,739,392) 5,557,969
2015-16 1,122,375 10,359,879 (9,237,505) 5,503,556
2016-17 1,232,802 10,551,987 (9,319,185) 4,979,508
Total 5,704,261 41,803,115 (36,098,855) 19,760,627
2017-18 1,041,212 10,810,628 (9,769,416) 3,631,498
2013-14 Complete 2014-15 Complete 2015-16 In progress (shows revised budgets as at March Review 2016) 2016-17 Forward budget estimates only 2017-18 Final year of community & transport infrastructure program - outside current Delivery Program term 2013-17 (forward budget estimates only) Total shows total for the four year term of current Delivery Program 2013-17

29Eurobodalla ShirE CounCil dEliVErY ProGraM 2013–2017 oPEraTional Plan & budGET 2016–17
28
actions
Activity Action Measure (target)Resp.
officer*L2.1 Provide access and
social participation opportunities
L2.1.1 Provide community transport service trips (16,000) MCC
L2.1.2 Provide social support and recreation activities
involve disability hours (8,230); individual active living hours (4,909); group active living hours (11,296)
MCC
L2.1.3 Provide in-home respite care support hours (192) MCC
L2.1.4 Facilitate individualised respite and lifestyle support packages
lifestyle support packages (35); respite packages (80)
MCC
L2.1.5 Develop and implement the Involve, Revolve,Evolve social enterprise project
employees (8); jobs (25); trade revenue ($5,000); partnerships (2)
MCC
L2.2 Provide case management and accommodation support
L2.2.1 Provide case management and coordination services
participants (20) MCC
L2.2.2 Provide supported accommodation including drop in and 24 hour support
participants (10); support hours (1,340) MCC
L2.2.3 Provide Compaks hospital discharge program
packages (162) MCC
L2.3 Provide support and information for carers
L2.3.1 Provide flexible respite and carer support
support hours (6,824) MCC
L2.4 undertake advocacy activities to improve collaboration, service availability, development and funding
L2.4.1 Advocate for improved service delivery and increased levels of funding
unbudgeted grant funding achieved ($); International Day of People with a Disability and Seniors Week events (held); advocacy (evidence of)
MCC
L2.4.2 Coordinate Disability Advisory Committee and associated projects to implement Disability Action Plan
meetings (6) MCC
L2.4.3 Participate in interagency collaboration and projects
collaboration (evidence of) MCC
*Full list of responsible officer codes detailed on page 90
budgetCost centre income Expenditure Net resultAged and disability services 5,114,716 5,312,995 (198,279)Total 5,114,716 5,312,995 (198,279)
Operational Plan & budget 2016-17 COMMUNITY CONNECTIONSActively make a difference to the health and wellbeing of older people, people with a disability and their carers
LiVEabLE
actions
Activity Action Measure (target)Resp.
officer*L3.1 Provide quality
library services, programs and resources
L3.1.1 Provide lending collections, reference,information and online services
customer satisfaction (>80%); loans (230,000); membership (50% of population); new members (1,000); visits (200,000)
LC
L3.1.2 Provide access to information via a range of technologies and formats
internet/wifi bookings (20,000); e-book loans (5,000); online visits (10,000)
LC
L3.1.3 Maintain and improve library infrastructure including buildings and collections
program complete (on time and within budget )
LC
L3.1.4 Collection Development program items shelf ready (85%); e-collection (increase 20%)
LC
L3.2 Support and deliver enhanced cultural experiences and programs
L3.2.1 Deliver community programs and events through the libraries
events (60); author talks (30); children’s activities (150)
CAC
L3.2.2 Support the conduct of exhibitions, talks, seminars, workshops and other initiatives
major arts event (1); exhibitions (30); workshops (40); floor talks (20)
CAC
L3.3 Plan for and collaborate to develop increased opportunities to engage in and develop cultural appreciation
L3.3.1 Collaborate with and participate in network partnerships
internal and external partnerships (evidence of); arts exchange (52)
CAC
L3.3.2 Support capacity building the creative industry sector
support (evidence of) CAC
L3.3.3 Coordinate the Public Art Advisory Committee
meetings (2) CAC
L3.3.4 Cultural Plan review project milestones (met) CAC
*Full list of responsible officer codes detailed on page 90
budgetCost centre income Expenditure Net result Capital expenditure
Arts and culture 27,500 231,596 (204,096) 897,950
Libraries 149,061 1,756,520 (1,607,459) 208,780
Total 176,561 1,988,117 (1,811,556) 1,106,730
Capital programCapital item Funding source Total
C&TiF* Cash Crown reserves
Grants & cont.
inf. fund
Loans
Arts & culture
RC913: Moruya Arts Centre - 300,000 - 597,950 - - 897,950
Total for arts & culture - 300,000 - 597,950 - - 897,950
Libraries
RC952: Library books - 137,280 - 69,000 - - 206,280
RC964: Library audio books - 2,500 - - - - 2,500
Total for libraries - 139,780 - 69,000 - - 208,780
Total for libraries, arts & culture -
439,780 - 666,950 - - 1,106,730
*Community and Transport Infrastructure Fund
Operational Plan & budget 2016-17LIBRARIES, ARTS & CULTUREProvide opportunities, facilities, programs and events that support cultural development and lifelong learning

31Eurobodalla ShirE CounCil dEliVErY ProGraM 2013–2017 oPEraTional Plan & budGET 2016–17
30
actions
Activity Action Measure (target)Resp.
officer*L4.1 Conduct regulatory
compliance and enforcement activities
L4.1.1 Monitor, inspect, enforce and investigate complaints in relation to public safety
animals rehomed, released, returned and sold (%); customer service requests attended to within response times (>85%)
DMES
L4.1.2 Monitor, inspect, enforce and investigate complaints in relation to public and environmental health
customer service requests attended to within response times (>85%)
DMES
L4.1.3 Undertake the on-site sewage management system program
inspections (#); compliance (>90%); mean determination approval time (<40days)
DMES
L4.2 Monitor recreational waters
L4.2.1 Undertake public pool inspection program
inspections (#); compliance (>90%) DMES
L4.2.2 Undertake estuary monitoring program biannual estuary report card rating (maintain or improve)
DMES
L4.2.3 Undertake Beach Watch program beach watch ratings (maintain or improve) DMESL4.2.4 Estuary health project project milestones (met) DMES
L4.3 Conduct food safety and public health programs
L4.3.1 Undertake food inspection program inspections (#); compliance (>90%) DMES
L4.3.2 Conduct other health education and training programs
program complete (on time and within budget)
DMES
L4.4 Provide support for emergency management and response
L4.4.1 Provide and maintain Rural Fire Service and State Emergency Service buildings
program complete (on time and within budget)
SSE
L4.4.2 Provide financial contributions to Rural Fire Service, NSW Fire & Rescue and State Emergency Service
legislative requirements (met) SSE
L4.4.3 Provide funding to support local volunteer rescue services
funding (provided) SSE
L4.5 assist with planning for and coordination of emergency services
L4.5.1 Collaborate with agencies and volunteers to undertake local disaster planning
Local Disaster Plan (reviewed); Local Emergency Management Committee meetings (3); Local Rescue Committee meetings (3)
SSE
L4.5.2 Assist development,and implementation of Bushfire Risk Management plan
Bushfire Management Committee meetings (3)
SSE
L4.5.3 Local Emergency Management and Bushfire Management Committees
meetings(3) SSE
L4.6 Collaborate with agencies and services to deliver coordinated management and response
L4.6.1 Emergency Operations Centre (EOC) Management as required
EOC (established/operational upon request)
SSE
L4.6.2 Undertake fire mitigation on Council land
program complete (on time and within budget)
DMW
*Full list of responsible officer codes detailed on page 90
budget
Cost centre income Expenditure Net resultCompanion animals management 43,252 370,030 (326,778)Emergency services 360,627 1,560,366 (1,199,739)Environmental compliance 230,710 547,889 (317,179)Public health 143,182 484,702 (341,520)Regulatory services 229,964 482,017 (252,053)Total 1,007,735 3,445,004 (2,437,269)
Operational Plan & budget 2016-17PUBLIC & ENVIRONMENTAL HEALTH & SAFETYContribute to the health, safety and wellbeing of the community and the environment through a range of health protection, education and regulatory programs.
LiVEabLE
actions
Activity Action Measure (target)Resp.
officer*L5.1 implement
Council’s recreation and open space strategy, prioity plans of management and master plans
L5.1.1 Deliver capital and renewal works program
program complete (on time and within budget)
DMW
L5.1.2 Seek grant funding and partnership opportunities to develop community spaces
partnerships (evidence of); unbudgeted grant funding achieved ($)
DMTS
L5.2 Manage and maintain a safe, sustainable and accessible range of community spaces
L5.2.1 Undertake maintenance program program complete (on time and within budget)
DMTS
L5.3 Provide and develop Council’s shared pathway and cycleway network
L5.3.1 Deliver capital and renewal works program
program complete (on time and within budget)
DMW
L5.3.2 Seek grant funding and parnership opportunities to develop network
partnerships (evidence of); unbudgeted grant funding achieved ($)
DMTS
*Full list of responsible officer codes detailed on page 90
budgetCost centre income Expenditure Net result Capital expenditure
Boating facilities - 427,207 (427,207) 327,111
CBD facilities - 1,292,929 (1,292,929) 1,123,341
Cemeteries 195,211 143,619 51,592 42,934
Community centres 116,268 317,048 (200,780) 48,000
Community land management 224,641 318,510 (93,869) -
Pathways - 167,524 (167,524) 215,000
Footpaths 145,000 720,944 (575,944) 283,500
Parks & reserves 428,653 3,544,446 (3,115,793) 1,121,122
Public halls & recreation buildings 13,416 156,719 (143,303) 253,150
Public toilets - 869,770 (869,770) 338,400
Sporting & recreation 76,682 184,360 (107,678) 190,000
Sporting facilities 32,930 1,188,091 (1,155,160) 753,350
Swimming pools - 1,220,821 (1,220,821) 283,600
Total 1,232,802 10,551,987 (9,319,185) 4,979,508
Operational Plan & budget 2016-17COMMUNITY SPACESProvide & maintain a safe, sustainable and accessible range of community infrastructure that caters for a range of recreation opportunities.

33Eurobodalla ShirE CounCil dEliVErY ProGraM 2013–2017 oPEraTional Plan & budGET 2016–17
32
Capital programCapital item Funding source Total
C&TiF* Cash Crown reserves
Grants & cont.
inf. fund Loans
Boating facilities
BR953: South Durras timber fishing platform - - - 37,111 - - 37,111
BR928: Nelligen boat ramp upgrade & carpark - - - - - 160,000 160,000
BR940: Durras Lake boat ramp car park - - - - - 50,000 50,000 BR9402: Durras Lake boat ramp renew ramp/carpark - - - - 80,000 - 80,000
Total for boating facilities - - - 37,111 80,000 210,000 327,111
CBD facilitiesPA525: Batemans Bay CBD works - North St to Beach Rd 763,500 250,000 - - - - 1,013,500
PA599: Batemans Bay CBD works - 78,704 - - - - 78,704
PA630: Disablity access works - 31,137 - - - - 31,137
Total for CBD facilities 763,500 359,841 - - - - 1,123,341
Cemeteries
PA049: Cemetery improvement program - 42,934 - - - - 42,934
Total for cemeteries - 42,934 - - - - 42,934
Pathways
TR6533: George Bass (Ridge Rd-Link Rd) - 75,000 - - - - 75,000
TR6741: Beach Rd - Surf Beach South - 65,000 - - - - 65,000
TR6371: Broulee - Airport track - 50,000 - 25,000 - - 75,000
Total for pathways - 190,000 - 25,000 - - 215,000
Footpaths
TR602: Footpath renewals - - - - 69,000 - 69,000
TR6311: Peninsula Dr, Surfside (Highway East) - - - 37,000 - - 37,000
TR6731: Edward Rd, Batehaven 51,000 - - - - - 51,000 TR6732: Crag Rd, Batehaven (Corrigans - Joseph) - - - 14,500 - - 14,500
TR6821: Murray St, Moruya (Evans - Thomas St) - - - 100,000 - - 100,000
TR6923: Princes Hwy, Narooma (Southlands Plaza) - 9,000 - 3,000 - - 12,000
Total for footpaths 51,000 9,000 - 154,500 69,000 - 283,500
Parks & reserves
RC008: Litter collection contract - 10,500 - - - - 10,500
RS003: Playgrounds 61,080 - - - 75,000 - 136,080
RS0031: Sports fields - topdressing/renovation 61,080 - - - 146,000 - 207,080
RS023: Parks facilities - seats/tables 61,080 - - - 100,000 - 161,080 RS0472: Rotary Park, Narooma - playground expansion 101,800 - - - - - 101,800
RS050: Parks & reserves improvements - 35,062 - - - - 35,062 RS0905: Plantation Point, Tuross Head - upgrades 40,720 - - - - - 40,720
RS091: Carters Headland, Kianga - viewing platform 40,720 - - - - - 40,720
RS092: Gundary Oval, Moruya - playground expansion 101,800 - - - - - 101,800
RS084: Corrigans Reserve inclusive playground - 36,280 - 250,000 - - 286,280
Total for parks & reserves 468,280 81,842 - 250,000 321,000 - 1,121,122
LiVEabLE
Capital item Funding source Total
C&TiF* Cash Crown reserves
Grants & cont.
inf. fund Loans
Community buildings
RS4013: Halls renewals - - - - 50,000 - 50,000
RS4018: Tables & chairs - - - - 25,000 - 25,000 RS4153: Malua Bay Community centre - extension 122,160 - - - - - 122,160
RS4603: Dalmeny Community hall - accessible toilet 40,720 - - - - - 40,720
RS4605: Dalmeny Community hall - toilet renewal 15,270 - - - - - 15,270
RS5351: Moruya RSL hall - renewals/kitchen - - - - 18,000 - 18,000 RS5402: Moruya Mechanics hall - repaint & repair brickwork - - - - 30,000 - 30,000
Total for community buildings** 178,150 - - - 123,000 - 301,150
Public toiletsPA444: Lyons Park, Batemans Bay - accessible toilet 50,900 - - - - - 50,900
PA445: Caseys Beach North - accessbile toilet 50,900 - - - - - 50,900
PA446: Malua Bay foreshore - accessible toilet 50,900 - - - - - 50,900
PA449: Public reserve, Tomakin 50,900 - - - - - 50,900 PA450: Coronation Drive, Broulee - accessible toilet 50,900 - - - - - 50,900
PA451: Main Beach, South Head Moruya - acessible toilet 50,900 - - - - - 50,900
PA499: Public toilet renewals - - - - 33,000 - 33,000
Total for public toilets 305,400 - - - 33,000 - 338,400
Sporting facilities
RS12554: Hanging Rock amenities - renewals 20,000 - - - - - 20,000 RS14013: Gundary Oval amenities - kitchen upgrade & BBQ 25,000 - - - - - 25,000
RS1407: Gundary Oval amenities - extension 305,400 - - - - - 305,400
RS14605: Moruya Showground - shelter 101,800 - - - - - 101,800
RS15571: Bodalla tennis courts - lighting 30,000 - - - - - 30,000
RS1558: Bodalla Oval - parking 76,350 - - - - - 76,350 RS16051: Dalmeny Oval amenities - kitchen upgrade - - - - 18,000 - 18,000
RS1702: Tilba Oval - toilet extension 101,800 - - - - - 101,800
RS180: Amenities renewals - - - - 75,000 - 75,000 RS3053: Hanging Rock basketball stadium - reroof - - - - 125,000 - 125,000
RS3452: Moruya basketball stadium - kitchen, entry & roof - - - - 65,000 - 65,000
Total for sporting facilities*** 660,350 - - - 283,000 - 943,350
Swimming Pools
RS706: Swimming pools renewals - - - - 25,000 - 25,000 RS72051: Moruya clubroom - kitchen & improvements - - - - 30,000 - 30,000
RS7301: Narooma Pool - renewal 203,600 - - - - - 203,600 RS73051: Narooma clubroom - kitchen & improvements - - - - 25,000 - 25,000
Total for swimming pools 203,600 - - - 80,000 - 283,600
Total for community spaces 2,630,280 683,617 - 466,611 989,000 210,000 4,976,508
* Community and Transport Infrastructure Fund** Community buildings shows projects and expenditure for ‘community centres’ and ‘public halls & recreation buildings’ cost centres.***Sporting facilites shows projects and expenditure for ‘sporting & recreation’ and ‘sporting facilities’ cost centres.

34 EurobodaLLa ShirE CounCiL dELiVErY ProGraM 2013–2017 oPEraTionaL PLan & budGET 2016–17
35SuSTainabLE
sustainable communitiesOur community prioritiesCommunity priorities are expressed as objectives in the Community Strategic Plan – One Community.
Objectives for a sustainable community include:
3. Our community and environment are in harmony3.1 Encourage respectful planning, balanced growth and good
design3.2 Respond to our changing environment3.3 Value, protect and enhance our natural environment
4. We use and manage our resources wisely4.1 Develop a clean energy future4.2 Use our water wisely4.3 Reduce, reuse and recover waste4.4 Identify and make best use of our resource land
Council’s role• Undertakeinvasivespeciesprograms
• Managegrowthanddevelopment
• Ensureplanningisresponsivetotheenvironmentand community needs
• Encouragesustainabledevelopment
• Planfortheimpactsofclimatechange
• Undertakebushandwetlandregeneration
• Provideforconservationofendangeredecological communities and threatened species
• SupportLandcarevolunteers
• Deliverenvironmenteducationprograms
• Providewaterandsewerservices
• ImplementtheGreenhouseActionPlan
• Undertakewasteminimisationandeducationprograms
• Provideandpromoteinitiativestoreducewater,energyandwaste
• Providewasteandrecyclingservices
• Supporttheprotectionofourresourcelandthroughlongtermplanning
• Supportcommunitygardensandfarmersmarkets

Integrated Economic Growth and Development Strategy This year Council will finalise its Integrated Economic Growth and Development Strategy. The strategy will create a collective vision and action plan designed to improve economic growth and development, increase investment and expand employment and services,.
The strategy will identify drivers of economic growth and link the vision of local stakeholders with clear priorities for action and sustainable investment and development, placing emphasis on the lead role being taken by the stakeholders themselves.
To develop the strategy we will build on lessons learned from successful economic growth initiatives such as:
•Inregionalcentrescommunitydevelopment is economic development.
•Townswiththemostpositiveoutcomes are proactive and future-oriented; embracing change and assuming risk.
•Successfulstrategiesareguidedbyabroadly held local vision.
•Innovativelocalgovernance,partnerships and organisations enhance the capacity for economic development.
•Effectivecommunitiesidentifyandcelebrate short-term success to sustain support for long-term development.
•Viablecommunityeconomicdevelopment involves the use of a package of strategies and tools, rather than a piecemeal approach.
The process is expected to be completed in 2017.
Narooma coastal inlets flood management planFollowing completion of the Narooma, Kianga and Dalmeny Flood Study, Council will now complete a flood management plan which is the next stage in the flood planning process.
Using data from the flood study, the flood management plan will look at management responses that will mitigate the impacts of flooding and where possible, reduce flood levels in the area.
To develop the plan Council will consult with the community to identify the social and economic impacts of flooding; examine and review current planning instruments to determine if current planning controls are adequate; consult with emergency and incident response agencies and agencies responsible for essential infrastructure.
Using this information a series of long term management responses will be identified to look at cost effective solutions involving infrastructure improvements and planning controls. The process is expected to commence in late 2016 and take around 12-18 months to complete.
StreetlightingEssential Energy has recently approved the use of LED street lights and this year Council plans to upgrade existing, inefficient street lighting lamps.
The upgrade has many benefits including reducing energy costs by an estimated $174,000 in the first year and reducing greenhouse gas emissions from electricity by an estimated 403 tonnes of CO2e per year. The LED lamps will also provide ongoing maintenance and operational savings given they last much longer and will require less maintenance.
It will also provide other benefits associated with improved lighting including improved road safety and have also been shown to improve public safety and reduce crime in public places.
Essential Energy manage the maintenance and approvals process for Eurobodalla street lighting and their cooperation is critical to the success of the project. They conduct a bulk lamp replacements every 4 years with the next replacement due in mid-2016. This will be the optimal time to upgrade to LED luminaires as contractors will already be in cherry-pickers servicing the lights.
The project, which will cost $1.19 million, this is a one off cost and has a payback period of 6.1 years taking into account the operational savings.
37EurobodaLLa ShirE CounCiL dELiVErY ProGraM 2013–2017 oPEraTionaL PLan & budGET 2016–17
36
Bodalla sewerage schemeResidents of Bodalla will soon be connected to a brand new sewerage system. Council has recently completed the designs for the new Sewerage System and Sewage Treatment Plant to service the Bodalla village.
The plant, which will be located near Potato Point Road, has been designed to accommodate growth of the Bodalla village and potential future servicing of the Potato Point village
Sewage will be able to be treated to meet two discharge categories at the new plant. During normal dry years, the effluent will be treated primarily for reuse on adjoining agricultural land. During prolonged wet periods, which is estimated to be once every ten years, the effluent will be further treated to remove nutrients and meet stringent environmental criteria for discharge into Borang creek.
Work will commence on the project towards the end of 2016. Individual pods will be dug into each backyard and connected to a pump which will transport sewage to a new main in the street. This main will transport the sewage through to the plant for treatment and use.
Construction is expected to take around 18 months with completion in 2018.
Surf Beach specialty waste centreWith the help of a grant from the New South Wales Environment Protection Authority Council will expand its offering of household waste and community recycling options.
The specialty waste centre will be built at Surf Beach Waste Management Facility, and will allow residents to drop off high volume low toxicity wastes such as oil and water based paints, gas bottles, fluorescent globes and tubes, household batteries, vehicle batteries, motor and cooking oil, free of charge, all year round.
This additional service will mean that residents do not have to wait for the household chemical cleanout to dispose of these wastes.
This will reduce the likelihood of this material being dumped, entering the sewer or storm water systems and being disposed of inappropriately in the general waste bins.
The specialty waste centre will be completed and operational by the end of 2016 calendar year.
Local Landcare Coordinator iniativeA new Landcare Officer has commenced work in the Eurobodalla Shire as part of the NSW Governments Local Landcare Coordinators Initiative.
The position will work with new and existing Eurobodalla Landcare groups to renew the government-community relationship and unlock the full potential of the hundreds of volunteers.
The project will build the capacity of community groups and landholders to effectively participate in high priority natural resource management activities that improve the sustainability of our land and build resilient communities.
The Local Landcare Coordinators Initiative is funded by the NSW Government, and is supported through the partnership of Local Land Services and Landcare NSW.
SuSTainabLE
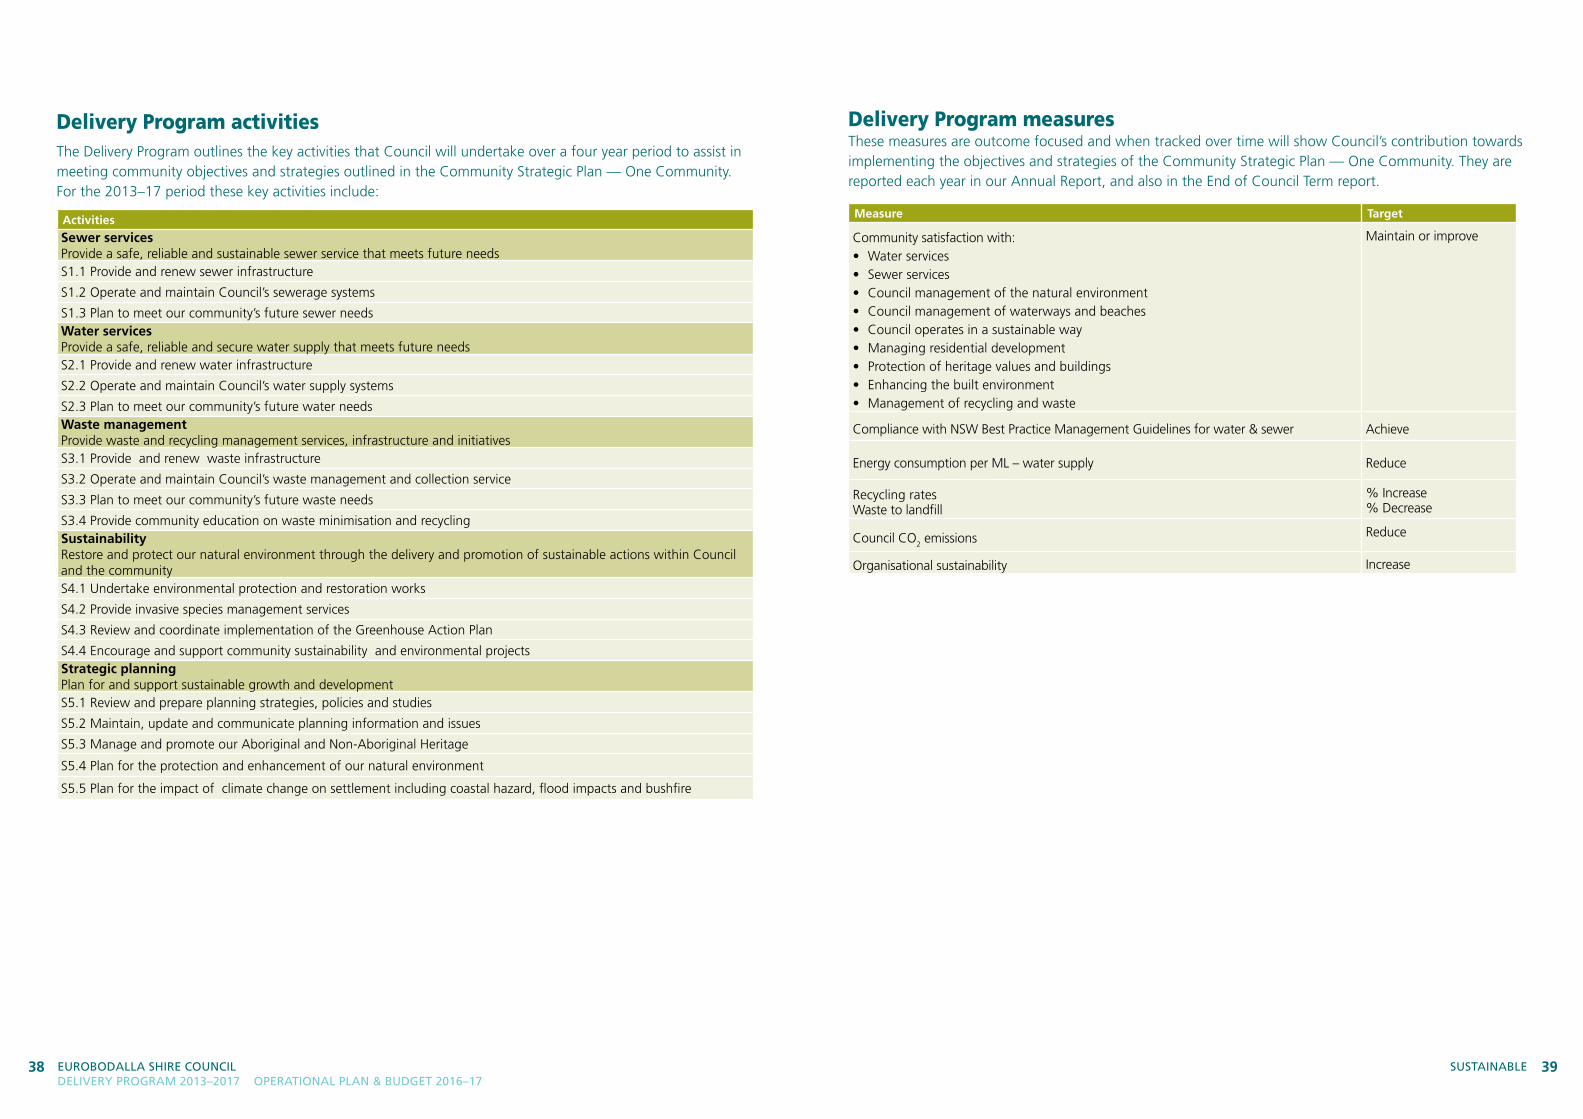
39Eurobodalla ShirE CounCil dEliVErY ProGraM 2013–2017 oPEraTional Plan & budGET 2016–17
38
Delivery Program activitiesThe Delivery Program outlines the key activities that Council will undertake over a four year period to assist in meeting community objectives and strategies outlined in the Community Strategic Plan — One Community. For the 2013–17 period these key activities include:
Activities
Sewer services Provide a safe, reliable and sustainable sewer service that meets future needsS1.1 Provide and renew sewer infrastructure
S1.2 Operate and maintain Council’s sewerage systems
S1.3 Plan to meet our community’s future sewer needsWater services Provide a safe, reliable and secure water supply that meets future needsS2.1 Provide and renew water infrastructure
S2.2 Operate and maintain Council’s water supply systems
S2.3 Plan to meet our community’s future water needsWaste management Provide waste and recycling management services, infrastructure and initiatives S3.1 Provide and renew waste infrastructure
S3.2 Operate and maintain Council’s waste management and collection service
S3.3 Plan to meet our community’s future waste needs
S3.4 Provide community education on waste minimisation and recycling Sustainability Restore and protect our natural environment through the delivery and promotion of sustainable actions within Council and the community S4.1 Undertake environmental protection and restoration works
S4.2 Provide invasive species management services
S4.3 Review and coordinate implementation of the Greenhouse Action Plan
S4.4 Encourage and support community sustainability and environmental projectsStrategic planning Plan for and support sustainable growth and development S5.1 Review and prepare planning strategies, policies and studies
S5.2 Maintain, update and communicate planning information and issues
S5.3 Manage and promote our Aboriginal and Non-Aboriginal Heritage
S5.4 Plan for the protection and enhancement of our natural environment
S5.5 Plan for the impact of climate change on settlement including coastal hazard, flood impacts and bushfire
Delivery Program measuresThese measures are outcome focused and when tracked over time will show Council’s contribution towards implementing the objectives and strategies of the Community Strategic Plan — One Community. They are reported each year in our Annual Report, and also in the End of Council Term report.
Measure Target
Community satisfaction with:• Waterservices• Sewerservices• Councilmanagementofthenaturalenvironment• Councilmanagementofwaterwaysandbeaches• Counciloperatesinasustainableway• Managingresidentialdevelopment• Protectionofheritagevaluesandbuildings• Enhancingthebuiltenvironment• Managementofrecyclingandwaste
Maintain or improve
Compliance with NSW Best Practice Management Guidelines for water & sewer Achieve
Energy consumption per ML – water supply Reduce
Recycling ratesWaste to landfill
% Increase% Decrease
Council CO2 emissions Reduce
Organisational sustainability Increase
SuSTainabLE

41Eurobodalla ShirE CounCil dEliVErY ProGraM 2013–2017 oPEraTional Plan & budGET 2016–17
40 SuSTainabLE
Delivery Program budget
Service Year income ($)
Expenditure ($)
Net result ($)
Capital expenditure
($)
Sewer services 2013-14 17,995,837 17,812,338 183,499 4,440,947
2014-15 18,254,239 16,637,913 1,616,326 3,942,172
2015-16 18,780,231 17,830,561 949,670 9,517,797
2016-17 19,302,749 18,431,404 871,345 10,136,000
Total 74,333,057 70,712,216 3,620,841 28,036,916
2017-18 20,049,645 19,441,670 607,975 13,720,604
Water services 2013-14 14,845,619 14,962,661 (117,041) 2,300,516
2014-15 15,077,751 14,584,108 493,643 2,566,784
2015-16 16,288,318 15,487,848 800,470 2,826,000
2016-17 16,961,395 16,136,337 825,058 3,245,000
Total 63,173,084 61,170,955 2,002,129 10,938,300
2017-18 17,389,805 15,929,007 1,460,798 3,527,370
Waste management 2013-14 9,273,720 7,992,842 1,280,878 200,871
2014-15 9,463,595 7,972,269 1,491,327 45,068
2015-16 10,302,924 10,004,403 298,521 2,656,108
2016-17 10,692,706 10,680,381 12,324 6,405,743
Total 39,732,945 36,649,895 3,083,051 9,307,790
2017-18 11,205,425 10,771,362 434,063 2,952,200
Sustainability 2013-14 568,704 1,342,698 (773,994) 20,809
2014-15 881,716 1,276,461 (394,745) 3,384
2015-16 685,854 2,293,093 (1,607,239) -
2016-17 164,817 2,877,944 (2,713,127) -
Total 2,301,091 7,790,196 (5,489,105) 24,193
2017-18 136,836 863,069 (726,233) -
Strategic planning 2013-14 113,521 1,183,033 (1,069,512) -
2014-15 96,851 1,219,134 (1,122,283) -
2015-16 165,293 1,365,319 (1,200,026) -
2016-17 263,195 1,742,278 (1,479,082) -
Total 638,860 5,509,764 (4,870,904) -
2017-18 45,500 1,337,913 (1,292,413) -
2013-14 Complete 2014-15 Complete 2015-16 In progress (shows revised budgets as at March Review 2016) 2016-17 Forward budget estimates only 2017-18 Final year of community & transport infrastructure program - outside current Delivery Program term 2013-17 (forward budget estimates only)Total shows total for the four year term of current Delivery Program 2013-17
actions
Activity Action Measure (target)Resp.
officer*S1.1 Provide and
renew sewer infrastructure
S1.1.1 Deliver capital and renewal works program
program complete (on time and within budget)
DMWS
S1.2 operate and maintain Council’s sewerage systems
S1.2.1 Operate sewerage systems customer service requests attended to within response times (>85%); EPA licence conditions (met); liquid trade waste licence conditions (met)
DMWS
S1.2.2 Provide treated effluent and sludge for reuse in community
pollution control licence conditions (met); reuse projects (maintain)
DMWS
*Full list of responsible officer codes detailed on page 90
budgetCost centre income Expenditure Net result Capital expenditure
Sewer services (490,000) 18,431,404 (18,921,404) 10,136,000
Development contributions 54,000 - 54,000 -
Sewerage rates & revenue 19,738,749 - 19,738,749 -
Total 19,302,749 18,431,404 871,345 10,136,000
Capital programCapital item Funding source Total
C&TiF* Cash Crown reserves
Grants & cont.
inf. fund Loans
SA006: Bodalla sewerage scheme - - - 900,000 - 2,100,000 3,000,000
SA00611: Rosedale/Guerilla Bay sewerage scheme - - - 1,900,000 - 2,300,000 4,200,000
SN011: Telemetry upgrades - 31,655 - 14,345 - - 46,000 SN05806: Batemans Bay sewage treatment plant upgrade - 137,630 - 62,370 - - 200,000
SN065: Bingie sewage treatment plant upgrade - 103,222 - 46,778 - - 150,000
SN081: Sewage treatment plant renewals - 151,393 - 68,607 - - 220,000
SN806: New service connections - 13,763 - 6,237 - - 20,000 SR023: Mains & service connections renewals - 550,520 - 249,480 - - 800,000
SR035: Tomakin treatment works upgrade - stage 1 - - - 50,000 - - 50,000
SR037: Sewer pump station & transport systems upgrades - 929,002 - 420,998 - - 1,350,000
SR058: Manhole restoration program - 68,815 - 31,185 - - 100,000
Total for sewer services - 1,986,000 - 3,750,000 - 4,400,000
10,136,000
* Community and Transport Infrastructure Fund
Operational Plan & budget 2016–17SEWER SERVICESProvide a safe, reliable and sustainable sewer service that meets future needs

43Eurobodalla ShirE CounCil dEliVErY ProGraM 2013–2017 oPEraTional Plan & budGET 2016–17
42 SuSTainabLESuSTainabLE
actions
Activity Action Measure (target)Resp.
officer*S2.1 Provide and
renew water infrastructure
S2.1.1 Deliver capital and renewal works program
program complete (on time and within budget)
DMWS
S2.1.2 Undertake water meter replacement program
10% of network replaced per annum DMWS
S2.2 operate and maintain Council’s water supply systems
S2.2.1 Identify and implement innovative water conservation and sustainable water usage practices
participation (increase) DMWS
S2.2.2 Operate water system Australian Drinking Water Guidelines (compliance); customer service requests attended to within response times (>85%)
DMWS
*Full list of responsible officer codes detailed on page 90
budgetCost centre income Expenditure Net Result Capital expenditure
Water rates & revenue 16,825,033 - 16,825,033 -
Water services 100,362 16,136,337 (16,035,975) 3,245,000
Development contributions 36,000 - 36,000 -
Total 16,961,395 16,136,337 825,058 3,245,000
Capital programCapital item Funding source Total
C&TiF* Cash Crown reserves
Grants & cont.
inf. fund Loans
WDWDC08: Deep Creek Dam - drainage works - 159,100 - 40,900 - - 200,000
WDWSD: Southern Dam - investigation & design - 560,000 - 240,000 - - 800,000
WMTCE: Consumer water meters - new - 111,370 - 28,630 - - 140,000 WMTRP: Consumer water meters - replacement program - 206,830 - 53,170 - - 260,000
WN030: Water refill stations - 31,820 - 8,180 - - 40,000
WR09901: Replacement telemetry parts - 35,798 - 9,202 - - 45,000
WR09902: Pump refurbishments - 87,505 - 22,495 - - 110,000
WR299: Renewals & replacements - 1,312,577 - 337,423 - - 1,650,000
Total for water services - 2,505,000 - 740,000 - - 3,245,000
* Community and Transport Infrastructure Fund
Operational Plan & budget 2016-17WATER SERVICESProvide a safe, reliable and secure water supply that meets future needs
actions
Activity Action Measure (target)Resp.
officer*S3.1 Provide and
renew waste infrastructure
S3.1.1 Deliver capital and renewal works program
program complete (on time and within budget)
DMWM
S3.2 operate and maintain Council’s waste management and collection service
S3.2.1 Manage and operate landfills and transfer station
landfill (% utilised) (remaining life); environmental compliance conditions (met)
DMWM
S3.2.2 Manage kerbside collection customer service requests attended to within response times (>85%); contractor (compliance)
DMWM
S3.2.3 Undertake annual hazardous waste collection
hazardous waste collected (increase) DMWM
S3.3 Plan to meet our community’s future waste needs
S3.3.1 Surfbeach landfill additional cell project (complete) DMWM
S3.3.2 Participate in regional collaboration and develop strategic industry partnerships
collaboration and partnership projects (evidence of)
DMWM
S3.4 Provide community education on waste minimisation and recycling
S3.4.1 Deliver community education on waste minimisation
diversion from landfill (increase); education initiatives (20) and participation (500); Waste and Recycling Guide (distributed)
DMWM
*Full list of responsible officer codes detailed on page 90
budgetCost centre income Expenditure Net Result Capital expenditure
Landfills stations 3,771,766 3,437,933 333,833 6,382,000
Recycling centres - 147,358 (147,358) -
Transfer stations 86,513 430,384 (343,871) -
Waste collection 5,354,395 4,388,919 965,476 -
Waste management 1,480,032 2,275,789 (795,756) 23,743
Total 10,692,706 10,680,381 12,324 6,405,743
Capital programCapital item Funding source Total
C&TiF* Cash Crown reserves
Grants & cont.
inf. fund Loans
Landfills stations
GA356: Surf Beach landfill - new cell - 4,250,000 - - - 1,250,000 5,500,000 GA554: Brou landfill - emission reduction - - - - - 50,000 50,000
GA655: Surf Beach landfill - emission reduction - - - - - 50,000 50,000
GA620: Surf Beach landfill - sedimentation basins - - - - - 32,000 32,000
GA653: Surf Beach landfill - leachate control system - 375,000 - - - 375,000 750,000
Total for landfill stations - 4,625,000 - - - 1,757,000 6,382,000
Waste servicesGA261: Surf Beach speciality waste centre - - - 23,743 - - 23,743
Total for waste services - - - 23,743 - - 23,743
Total for waste management - 4,625,000 - 23,743 - 1,757,000 6,405,743
Operational Plan & budget 2016-17WASTE MANAGEMENTProvide waste and recycling management services, infrastructure and initiatives
* Community and Transport Infrastructure Fund

45Eurobodalla ShirE CounCil dEliVErY ProGraM 2013–2017 oPEraTional Plan & budGET 2016–17
44 SuSTainabLESuSTainabLE
actions Activity Action Measure (target) Resp. officer*S4.1 undertake
environmental protection and restoration works
S4.1.1 Implement natural resource, coastal and estuary projects
projects (implemented); unbudgeted grant funding achieved ($)
DMES
S4.2 Provide invasive species management services
S4.2.1 Manage invasive species through an inspections schedule, issue of notices and fines
inspections (#); compliance (>90%) DMES
S4.2.2 Lantana pushback project - Year 3 of 3 year project
project milestones (met) DMES
S4.2.3 Coastal Weeds of National Significance project
project milestones (met) DMES
S4.2.4 Grey Headed Flying Fox dispersal program
project milestones (met) DMES
S4.3 review and coordinate implementation of the Greenhouse action Plan
S4.3.1 Implement energy, water and waste reduction initiatives within Council
council water savings (maintain or improve); council energy savings (maintain or improve)
DMES
S4.3.2 Coordinate the Sustainability Matrix Group
meetings (4) DMES
S4.3.3 Upgrade streetlighting to LED** project milestones (met) DMESS4.4 Encourage and
support community sustainability and environmental projects
S4.4.1 Provide environmental and sustainability advice and education
programs (#); participation (#) DMES
S4.4.2 Support community activities and groups such as Landcare and community gardens
number of groups supported (maintain or increase)
DMES
S4.4.3 Deua River restoration project project milestones (met) DMES
*Full list of responsible officer codes detailed on page 90
** This project has related capital expenditure listed in the Transport service area: TR009 street lighting, pg 56
budgetCost centre income Expenditure Net result
Coastal & estuary management - 73,416 (73,416)
Environmental management 8,517 145,645 (137,128)
Environmental protection 30,400 2,155,385 (2,124,985)
Invasive species management 85,900 255,698 (169,798)
Landcare projects 40,000 72,744 (32,744)
Natural resource management - 151,677 (151,677)
Sustainability - 23,379 (23,379)
Total 164,817 2,877,944 (2,713,127)
Operational Plan & budget 2016-17SUSTAINABILITYRestore and protect our natural environment through the delivery and promotion of sustainable actions within Council and the community
actions
Activity Action Measure (target)Resp.
officer*S5.1 review and
prepare planning strategies, policies and studies
S5.1.1 Residential Lands Strategy strategy (complete) DMSS
S5.1.2 Small towns DCP review review (complete) DMSS
S5.1.3 Recreation and Open Space Strategy strategy (complete) CPC
S5.1.4 Infrastructure contributions plan review plan (complete) DMSS
S5.1.5 Employment lands - industrial areas feasibility study
study (complete) DMSS
S5.1.6 Integrated growth and development strategy
strategy (complete); Batemans Bay visioning statement (complete)
DMSS
S5.1.7 Infrastructure contributions plan review plan (complete) DMSS
S5.2 Maintain ,update and communicate planning information and issues
S5.2.1 Review housing, land supply and demographics and communicate changes and issues
changes (communicated) DMSS/CPC
S5.2.2 Participate in State and regional planning forums and environmental reviews and report on and communicate issues relating to strategic planning
participation and communication (evidence of)
DMSS/CPC
S5.2.3 Coordinate the Recreation Matrix Group and associated projects
meetings (10) CPC
S5.3 Manage and promote our aboriginal and non-aboriginal heritage
S5.3.1 Coordinate the Heritage Advisory Committee and associated projects
meetings (3) DMSS
S5.3.2 Conduct the Local Heritage Places Grants Program
program (complete) DMSS
S5.3.3 Coordinate the free Heritage Advisory Service
level of use of service (referrals) (advice) DMSS
S5.5 Plan for the impact of climate change on settlement including coastal hazard, flood impacts, bushfire
S5.5.1 Eurobodalla Coastal Hazard Management Plan
project milestones (met) DMSS
S5.5.2 Narooma Coastal Inlets flood management plan
project milestones (met) DMSS
S5.5.3 Batemans Bay Urban Creek flood study project milestones (met) DMSS
S5.5.4 Tuross Estuary Management Plan review project milestones (met) DMSS
S5.5.5 Coordinate the Coastal and environmental management and advisory committee (CEMAC) and associated projects
meetings (4) DMSS
*Full list of responsible officer codes detailed on page 90
budgetCost centre income Expenditure Net result
Land use planning 35,114 921,932 (886,818)
Natural environment planning 228,081 820,346 (592,265)
Total 263,195 1,742,278 (1,479,082)
Operational Plan & budget 2016-17STRATEGIC PLANNINGPlan for and support sustainable growth and development

46 EurobodaLLa ShirE CounCiL dELiVErY ProGraM 2013–2017 oPEraTionaL PLan & budGET 2016–17
47ProduCTiVE
productive communitiesOur community prioritiesCommunity priorities are expressed as objectives in the Community Strategic Plan – One Community.
Objectives for a productive community include:
5. We help our local economy grow5.1 Plan for and develop the right assets and infrastucture5.2 Support the growth of our business community5.3 Promote our community as the place to visit, live, work
and invest6. We are skilled and have access to employment
opportunities6.1 Increase the range of opportunities to work locally6.2 Build on our quality education and training
opportunities
Council’s role• Provideandmaintainroadnetwork• Advocateforfundingformajorprojects• Advocateforevolvinglegislationtosupportpositivegrowth
and change• Provideandmaintainpublicinfrastructure• Promoteandsupportbusinessinvestmentandemployment
growth• Providevisitorinformationservices• AdvocateforNationalBroadbandNetworks• Partnerwithbusinessandindustrytoattractfundingand
investment• Developandpromotetourismbrand• Providesupportservices,networkingandtrainingopportunities
for local business and industry• Supportandadvocateforthegrowthoftertiaryeducation
opportunities in our area• Partnerwithbusinessandindustrytodevelopandexplore
opportunities for job growth within the region• Provideopportunitiesforcadetships,apprenticeshipsandwork
experience within council

Helping local business boomThis year we will work with local business on a number of initiatives.
We will run our popular capacity building workshops including Business Planning, e-commerce and social media, as well as networking events to assist businesses to make connections.
We will continue to engage to help improve Eurobodalla’s business accessibility through the Good Access is Good Business campaign. The campaign will make businesses aware of the opportunities available with the National Disability Insurance Scheme being launched in July 2016 and the developing accessible tourism market.
Renew Eurobodalla will help property owners fill their vacant shops and offices whilst helping start-up businesses find affordable rent. Included in this project will be assisting IT businesses to find and set-up shared working space.
Advocacy on behalf of business will include seeking improved mobile and telecommunications coverage. This has already secured three new mobile towers for the region and new government funding will be targeted.
Property Strategy To ensure we are managing Council’s property portfolio in the best interests of the community we will accelerate a review of our property assets and leases to ensure they deliver the most efficient return for ratepayers.
An implementation plan with detailed actions and performance indicators will be developed to accompany our Property Strategy.
This plan will include actions to prepare properties for market including valuations, development applications and subdivisions.
An audit will be undertaken of Council land to determine if it is being used in the most efficient way and identify opportunities for the sale of surplus land.
It will also include a review of Council leases of public land to balance the needs of commercial lease-holders versus the need for the broader community to receive a fair return from the public assets being used.
International opportunitiesCouncil will focus on new opportunities for tourism and freight with the recent announcement of international flights into Canberra Airport.
Council’s tourism and business development teams will collaborate and partner with Bega Valley Shire, Sapphire Coast Tourism, Destination NSW, Visit Canberra , Canberra Airport and Sydney to Melbourne Touring Inc to promote the south coast to international inbound tourists and business travellers.
This will involve working with local tourism and other businesses on product development and promotion in readiness for a potential increase in international visitation and trade.
Workshops and educational programs will be sourced and offered by council in partnership with key government agencies including Destination NSW and the Office of Small Business to build local business capacity and understanding of engaging with international visitors.
49
Paperless assessment processThis year we will investigate options for moving our development application lodgement and assessment processes to an electronic environment.
One of the key objectives of this project is to improve ease of access to the service for our customers.
Operating in an electronic environment will also improve risk management as our current process is largely dependent on physical files that can be lost, burnt or otherwise destroyed in the event of a disaster or fire.
Savings and efficiency gains are also expected in relation to time, expenditure, storage, floor space and resources.
With all documents being sent by email or downloaded via the internet this will also benefit applicants and developers providing access to approvals and lodgement of applications at the click of a mouse.
Staff will eventually have access to files on their tablets and will be able to issue inspection results to builders and applicants while out onsite.
Building on our Award winning campaign In 2015, Council and neighbouring local government areas collaborating under the South Coast Regional Tourism Organisation were awarded the NSW Tourism Award for Best Marketing Campaign for the ‘Unspoilt South Coast’.
The campaign was also a finalist in the Australian Tourism Awards.
The Unspoilt campaign represents several years of strategic marketing in partnership with Destination NSW to successfully differentiate the south coast from competitor destinations by showcasing the natural undeveloped beauty of the region through dramatic imagery and a simple yet powerful message; unspoilt.
This achievement opens up new opportunities and Council’s tourism unit will continue to build on the success of this campaign with strategic integrated marketing communications across a number of digital and traditional advertising media. Acquisition of exciting new images and video footage will be a major focus this year and will contribute to building and renewing visual content on the tourism website and social media.
Looking after our gravel roadsCouncil currently looks after 420km of gravel roads within Eurobodalla. Many of these support school bus routes and service farms, quarries and other industries as well as providing recreational links to our State Forests and National Parks.
While these roads carry lower volumes of traffic, they still provide important connections within our community.
To ensure our unsealed roads are in a safe condition we undertake maintenance and gravel resheeting work throughout each year.
Our maintenance program involves grading each road once or twice per year depending on traffic and terrain. If you would like to know when your road will be graded, our grading schedule can be found on Council’s website. Other maintenance works include clearing drainage pipes, removing vegetation, and looking after bridges.
The gravel resheeting program is a cyclic program undertaken on a priority basis taking into account road condition, traffic and use. The work involves restoring drainage, reshaping the road and providing new road gravel to ensure a safe and maintainable driving surface.
This year we will spend $1.1 million to resheet around 25km or 6% of our gravel road network.
EurobodaLLa ShirE CounCiL dELiVErY ProGraM 2013–2017 oPEraTionaL PLan & budGET 2016–17
48 ProduCTiVE

51Eurobodalla ShirE CounCil dEliVErY ProGraM 2013–2017 oPEraTional Plan & budGET 2016–17
50
Delivery Program activitiesThe Delivery Program outlines the key activities that Council will undertake over a four year period to assist in meeting community objectives and strategies outlined in the Community Strategic Plan — One Community. For the 2013–17 period these key activities include:
Activities
Business development & events To develop the Eurobodalla as a destination of choice to live, work, invest & visit
P1.1 Facilitate growth and development of our business community
P1.2 Undertake advocacy activites to deliver major initiatives and infrastructure to support future growth
P1.3 Seek and support the development and hosting of eventsTourism To develop the Eurobodalla as a destination of choice to visit P2.1 Provide tourism destination marketing and visitor services
Transport Provide an efficient, integrated transport network that meets community needs now and into the future
P3.1 Undertake advocacy activities to further the development of transport infrastructure and support future growth
P3.2 Develop, renew and maintain the road network
P3.3 Provide road safety and traffic management planning, programs and infrastructure
P3.4 Provide, maintain and renew stormwater and flood management infrastructure
Development services Facilitate growth and development through a transparent and efficient development application process
P4.1 Provide development assessment services
P4.2 Provide advice and information to industry and applicants
Delivery Program measuresThese measures are outcome focused and when tracked over time will show Council’s contribution towards implementing the objectives and strategies of the Community Strategic Plan — One Community. They are reported each year in our Annual Report, and also in the End of Council Term report.
Measure Target
Number of businesses supported through direct contact with Council’s Business Development Service including factors of attraction, job creation and investment value
New measure (establish benchmark)
Return on investment from Council’s contribution to major events held $ returned as % of total investment
Community satisfaction with:• Localandregionalroads• Sealedandunsealedroads• Streetlighting• Busshelters• Carparking• Trafficmanagement• Capacityofinfrastructureatpeaktimes• Roadsafety
Maintain
Community satisfaction with:• Council’sassistancetolocalbusinessesandsupportofgrowth• Council’stourismserviceandpromotionofarea
Maintain or Improve
Customer satisfaction with development assessment services Improve
ProduCTiVE
Delivery Program budget
Service Year income ($)
Expenditure ($)
Net result ($)
Capital expenditure
($)
Business development & events
2013-14 4,293,627 5,221,523 (927,897) 134,736
2014-15 4,615,938 5,211,747 (595,809) 181,473
2015-16 4,871,829 5,098,001 (226,171) 563,682
2016-17 4,702,959 5,186,399 (483,440) 5,290,909
Total 18,484,353 20,717,670 (2,233,317) 6,170,800
2017-18 4,908,498 5,151,684 (243,187) 90,602
Tourism 2013-14 271,570 1,371,241 (1,099,671) -
2014-15 264,187 1,515,342 (1,251,155) 23,967
2015-16 103,727 1,392,129 (1,288,402) 9,333
2016-17 46,732 1,358,886 (1,312,154) -
Total 686,216 5,637,599 (4,951,383) 33,300
2017-18 47,573 1,383,436 (1,335,863) -
Transport 2013-14 3,065,954 16,412,562 (13,346,607) 10,031,427
2014-15 4,718,582 18,196,903 (13,478,321) 9,867,297
2015-16 10,977,986 19,771,585 (8,793,599) 16,099,640
2016-17 7,460,016 17,458,024 (9,998,008) 21,108,570
Total 26,222,538 71,839,073 (45,616,535) 57,106,934
2017-18 5,692,977 17,828,138 (12,135,161) 17,663,174
Development services 2013-14 1,426,678 2,971,938 (1,545,260) -
2014-15 1,504,690 3,197,705 (1,693,016) -
2015-16 1,613,080 3,440,883 (1,827,803) -
2016-17 1,576,486 3,567,654 (1,991,169) -
Total 6,120,934 13,178,181 (7,057,247) -
2017-18 1,615,043 3,633,531 (2,018,488) -
2013-14 Complete 2014-15 Complete 2015-16 In progress (shows revised budgets as at March Review 2016) 2016-17 Forward budget estimates only 2017-18 Final year of community & transport infrastructure program - outside current Delivery Program term 2013-17 (forward budget estimates only)Total shows total for the four year term of current Delivery Program 2013-17

53Eurobodalla ShirE CounCil dEliVErY ProGraM 2013–2017 oPEraTional Plan & budGET 2016–17
52 ProduCTiVE
actions
Activity Action Measure (target)Resp.
officer*P1.1 Facilitate growth and
development of our business community
P1.1.1 Strengthen partnerships between Council and the business community
Business Advisory Committee meetings (4); businesses engaged (50); networking activities and partnerships (evidence of)
DMBDE
P1.1.2 Provide business support and development activities
workshops, courses, seminars (20); attendance (600); small business start-ups assisted (24); Renew Eurobodalla participants (12)
DMBDE
P1.1.3 Promote Eurobodalla as the place to invest and do business
collateral developed and circulation (evidence of); webpage visits (15% increase)
DMBDE
P1.2 undertake advocacy activities to deliver major initiatives and infrastructure to support future growth
P1.2.1 Advocate for improved infrastructure and funding to support regional initiatives
unbudgeted grant funding achieved ($); submissions (10)
DMBDE
P1.2.2 Provide and manage the Eurobodalla Regional Botanic Gardens
plant revenue ($75,976); visitors (48,856); volunteer hours (20,860); financial efficiency (improve)
DMBDE
P1.3 Seek and support the development and hosting of events
P1.3.1 Support event organisers in the delivery of a range of events
events assisted (30); event workshops (3); total supported events value ($1.75 million)
DMBDE
P1.3.2 Secure new events in targeted areas new events secured (6) DMBDE
*Full list of responsible officer codes detailed on page 90
budgetCost centre income Expenditure Net result Capital expenditureAirport 411,404 636,203 (224,800) 2,436,636Botanic gardens 121,453 574,022 (452,569) - Camping grounds 770,000 451,731 318,269 42,000 Caravan parks 3,381,253 2,698,053 683,200 85,000Economic development 15,609 701,954 (686,345) -
Real estate development - 106,295 (106,295) 2,727,273
Saleyards 3,240 18,140 (14,900) -
Total 4,702,959 5,186,399 (483,440) 5,290,909
Capital programCapital item Funding source Total
C&TiF* Cash Crown reserves
Grants & cont.
inf. fund Loans
Airport
OE070: Runway reseal/maintenance - 59,000 - - - - 59,000
OE0781: Terminal upgrade 113,500 - - - - - 113,500
OE0783: Aircraft holding area 120,000 - - - - - 120,000
OE078: Airport redevelopment masterplan - 2,144,136 - - - - 2,144,136
Total for airport 233,500 2,203,136 - - - - 2,436,636
Reasl estate developmentOE039: Batemans Bay Bowling Club acquisition
- 727,273 - - - 2,000,000 2,727,273
Total for real estate development - 727,273 - - - 2,000,000 2,727,273
Campgrounds
OECAMB: Mystery Bay - fire hydrants/hoses - 42,000 - - - - 42,000
Total for campgrounds - 42,000 - - - - 42,000
Caravan parksOE0056: Batemans Bay Beach Resort repairs/maintenance - - 25,000 - - - 25,000
OECVGH: Batemans Bay Beach Resort website - - 60,000 - - - 60,000
Total for caravan parks - - 85,000 - - - 85,000
Total 233,500 2,972,409 85,000 - - 2,000,000 5,290,909
Operational Plan & budget 2016-17BUSINESS DEVELOPMENT & EVENTSProvide promotion and support to develop the Eurobodalla as a destination of choice to live, work, invest & visit
actions
Activity Action Measure (target)Resp.
officer*P2.1 Provide tourism
destination marketing and visitor services
P2.1.1 Increase traffic to www.eurobodalla.com.au and drive leads to tourism businesses
website sessions (145,000)tracked leads to business (35,000)
EMCT
P2.1.2 Secure destination editorials in travel and mainstream media
articles (100) EMCT
P2.1.3 Deliver and implement cooperative industry marketing campaigns
campaigns (4) EMCT
P2.1.4 Engage with tourism businesses industry newsletters (12); industry forums (4)
EMCT
P2.1.5 Engage in strategic tourism partnerships
partnership activities (5) EMCT
P2.1.6 Undertake mid-point review of the 10 year Destination Management Plan
review (complete) EMCT
P2.1.7 Manage council’s visitor information services
accreditation (achieved) EMCT
*Full list of responsible officer codes detailed on page 90
budgetCost centre income Expenditure Net result
Tourist promotion 4,732 797,554 (792,822)
Visitor centres 42,000 561,332 (519,332)
Total 46,732 1,358,886 (1,312,154)
Operational Plan & budget 2016-17TOURISMProvide promotion and support to develop the Eurobodalla as a destination of choice to visit
* Community and Transport Infrastructure Fund

55Eurobodalla ShirE CounCil dEliVErY ProGraM 2013–2017 oPEraTional Plan & budGET 2016–17
54
actions
Activity Action Measure (target)Resp.
officer*P3.1 undertake
advocacy activities to further the development of transport infrastructure and support future growth
P3.1.1 Advocate for improved infrastructure and increased levels of funding
advocacy (evidence of); unbudgeted grant funding achieved ($)
DIS
P3.1.2 Coordinate the Local Traffic & Development Committees
meetings (9) DMTS
P3.2 develop, renew and maintain the road network
P3.2.1 Deliver capital and renewal works program
program complete (on time and within budget)
DMW
P3.2.2 Undertake contract works for the Roads and Maritime Services on the Kings highway
contract and budget (compliance) DMW
P3.3 Provide road safety and traffic management planning, programs and infrastructure
P3.3.1 Implement road safety programs and plans
grant funded program (met) DMTS
P3.4 Provide, maintain and renew stormwater and flood management infrastructure
P3.4.1 Deliver capital and renewal program program complete (on time and within budget)
DMW
P3.4.2 Maintain stormwater and flood mitigation systems
program complete (on time and within budget)
DMW
*Full list of responsible officer codes detailed on page 90
budgetCost Centre income Expenditure Net result Capital expenditure
Bridges 1,015,000 809,256 205,744 4,656,000
Bus shelters - 54,474 (54,474) 23,000
Car parking 128,000 645,975 (517,975) 245,500
Drainage and stormwater 451,743 1,424,958 (973,215) 701,449
Flood mitigation 4,400 26,248 (21,848) -
Lake openings - 3,061 (3,061) -
Local rural roads 1,140,000 4,594,521 (3,454,521) 7,808,520
Local urban roads 936,509 5,693,985 (4,757,476) 4,413,209
Roads & Maritime Services funded roads 3,636,857 3,078,380 558,477 2,068,857
Road safety 24,507 69,101 (44,594) -
Rock walls and sea walls - 95,121 (95,121) -
Street lighting 51,000 658,000 (607,000) 1,192,035
Development contributions 72,000 - 72,000 -
Transport local & arterial - 297,541 (297,541) -
Works at community request - 7,403 (7,403) -
Total 7,460,016 17,458,024 (9,998,008) 21,108,570
Operational Plan & budget 2016-17TRANSPORTProvide an efficient, integrated transport network that meets community needs now and into the future
Capital programCapital item Funding source Total
C&TiP* Cash Crown reserves
Grants & cont.
inf. fund Loans
Bridges
BR303: Bridge maintenance - - - 165,000 - - 165,000
BR310: Bridge renewals - 264,000 - - 257,000 - 521,000
BR320: Runnyford bridge - renewal - 51,500 - 850,000 48,500 - 950,000
BR622: Tyrone bridge - renewal - - - 1,250,000 - - 1,250,000
BR725: Corrugated pipe culverts 150,000 - - - - - 150,000 BR726: Cullendulla Drive, Long Beach - box culvet widening 50,000 - - - - - 50,000
BR729: Cadgee bridge 500,000 - - 470,000 - - 970,000
BR327: Mogendoura bridge - renewal - 341,510 - - - 258,490 600,000
Total for bridges 700,000 657,010 - 2,735,000 305,500 258,490 4,656,000
Bus sheltersTR811 - Bus shelters - - - - 23,000 - 23,000
Total for bus shelters - - - - 23,000 - 23,000
Carparking
RS7202: Moruya pool carpark - - - 40,000 - - 40,000
TR7761: Tilba carpark - - - - - 175,000 175,000TR776: Mogo carpark - - - 15,000 - - 15,000TR799: Carparking - 15,500 - - - - 15,500
Total for carparking - 15,500 - 55,000 - 175,000 245,500
Drainage & stormwater
PA121: Drainage renewals 391,449 50,000 - - - - 441,449 PA2601: Stormwater piping - Island View Rd, Tuross Head - 130,000 - - - - 130,000
PA2621: Stormwater piping - Hillside Crescent, Kianga - 50,000 - - - - 50,000
PA2671: Stormwater piping - Bay Lane, Narooma - 80,000 - - - - 80,000
Total for drainage & stormwater 391,449 310,000 - - - - 701,449
Local rural roads
TR024: Guardrail - - - 70,000 - - 70,000
TR501: Drainage culvert improvements - 50,000 - - - - 50,000
TR525: Congo Road South - - - 520,000 - - 520,000
TR5371: Old South Coast Road, Narooma 549,720 - - - - - 549,720
TR553: Ridge Road, Tilba - - - 500,000 - - 500,000
TR956: South Batemans Bay Link Road - - - 5,000,000 - - 5,000,000
Gravel resheet program 121,800 220,000 - 210,000 567,000 - 1,118,800
Total for local rural roads 671,520 270,000 - 6,300,000 567,000 - 7,808,520
Local urban roads
TR111: Reseals 407,200 555,000 - 250,000 521,000 - 1,733,200
TR4772: Princess Highway, Narooma - 350,249 - 65,751 - - 416,000
TR4791: Shell Street, Tuross Head - 378,875 - 71,125 - - 450,000 TR4851: Hanging Rock Place (Beach Rd to AFL carpark) - 378,875 - 71,125 - - 450,000
TR498: Road reserves acquisition - 30,000 - - - - 30,000
Pavement rehabilitation program - 342,500 - 398,509 593,000 - 1,334,009
Total for local urban roads 407,200 2,035,500 - 856,509 1,114,000 - 4,413,209
ProduCTiVE
* Community and Transport Infrastructure Fund

57Eurobodalla ShirE CounCil dEliVErY ProGraM 2013–2017 oPEraTional Plan & budGET 2016–17
56
Capital item Funding source Total
C&TiF* CashCrown
reservesGrants &
cont.inf. fund Loans
Roads & Maritime Services funded roads
RTA209: Beach Road, Hanging Rock - 290,000 - - - - 290,000
RTA212: Beach Road Junction, Hanging Rock - - - 854,857 - 924,000 1,778,857
Total for Roads & Maritime Services funded roads - 290,000 - 854,857 - 924,000 2,068,857
Street lighting
TR009: Street lighting - 1,192,035 - - - - 1,192,035
Total for street lighting - 1,192,035 - - - - 1,192,035
Total for transport 2,170,169 4,770,045 - 10,801,366 2,009,500 1,357,490 21,108,570
ProduCTiVE
actions Activity Action Measure (target) Resp. officer*P4.1 Provide
development assessment services
P4.1.1 Assess and determine development applications
mean determination time (<40days) DMDS
P4.1.2 Assess and determine construction certificates
determination time (90% <20days) DMDS
P4.1.3 Determine complying development applications
statutory requirements (met) DMDS
P4.1.4 Provide certification inspection services compliance inspections (95% within 2 days of notification)
DMDS
P4.1.5 Undertake pool compliance program inspections (300) DMDS
P4.1.6 Paperless development assessment and certification system
project milestones (met) DMDS
P4.1.7 Integrate online booking system for building and plumbing inspections
integration (complete) DMDS
P4.2 Provide advice and information to industry and applicants
P4.2.1 Distribute information to developers and builders
communication (evidence of) DMDS
P4.2.2 Provide prelodgement advice and assistance to applicants
advice provided (#); meetings (#) DMDS
*Full list of responsible officer codes detailed on page 90
budgetCost centre income Expenditure Net result
Building certificates & compliance 667,850 902,376 (234,526)
Development control 908,635 2,665,278 (1,756,643)
Total 1,576,486 3,567,654 (1,991,169)
Operational Plan & budget 2016-17DEVELOPMENT SERVICESFacilitate growth and development through a transparent and efficient development application process
* Community and Transport Infrastructure Fund
North Street, Batemans Bay
Campbell Street, Moruya
Marlin Street, Tuross Head
Centenary Drive, Narooma
Sylvan Street, Malua Bay
Bateman Place, Sunshine Bay
Bellbird Drive, Malua Bay
Pavement rehabilitation program This year our pavement rehabilitation program will include works in the following locations.
Eurobodalla Road
Bumbo Road
Runnyford Road
Old Mossy Point Road
Larrys Mountain Road
Araluen Road
Bingie Road
Cadgee Mountain Road
Wagonga Scenic Drive
Reedy Creek Road
River Road
Buckenboura Road
Donalds Creek Road
Nerrigundah Mountain Road
Duesbury Road
Quartpot Road
Rifle Range Road
Woodlands Road
Gravel resheet program This year our gravel resheet program will include works in the following locations.
Further information on projects within the program can be found on Council’s website www.esc.nsw.gov.au or by contacting our Infrastructure Services team.

58 EurobodaLLa ShirE CounCiL dELiVErY ProGraM 2013–2017 oPEraTionaL PLan & budGET 2016–17
59CoLLaboraTiVE
collaborative communitiesOur community prioritiesCommunity priorities are expressed as objectives in the Community Strategic Plan – One Community.
Objectives for a collaborative community include:
7. We are an engaged and connected community7.1 Encourage an informed community7.2 Enable broad, rich and meaningful engagement to
occur7.3 Build on our sense of community
8. We work together to achieve our goals8.1 Build strong relationships and shared responsibilities8.2 Work in partnership to plan for the future8.3 Provide representative, responsive and accountable
community governance
Council’s role• Provideopenclearlinesofcommunicationwiththecommunity• Providequalitycustomerservice• Encouragecommunityparticipationinplanningandpolicy
development• Provideadiverserangeofopportunitiesforthecommunityto
be involved and engaged • Valueandconsiderfeedback• Supportcommunitygroupsandorganisations• WorkinpartnershipwithFederalandStateGovernment,other
councils and regional organisations• Providecorporateandcivicfunctions• Conductcouncilbusinessinanopenandtransparentmanner
and in accordance with legislative and statutory requirements• Actwiththewidercommunityinmind• Beresponsivetonewinformation• Manageexpectations• Beanemployerofchoice• EnsuretheneedsofourShireandcommunityarereflectedin
state and regional plans• Seeksourcesoffundingtoimplementourcommunityvision

61CoLLaboraTiVE
Delivering on our vision for the futureThis year following Council elections, our Community Planning team will work with our new Councillors and community to review our suite of Integrated Planning and Reporting (IP&R) documents.
The IP&R Suite includes the Community Strategic Plan, which outlines the vision the community has for Eurobodalla, as well as Council’s four year Delivery Program and one year Operational plan which detail how Council will work towards achieving the community vision.
As part of this process we will prepare our Delivery Program detailing service commitments for the coming 4 year Council term. To ensure meaningful community involvement, in line with Councils community engagement framework, we will conduct an innovative community driven engagement and decision forming process to assist with the review of service levels across all of Council’s services. The outcomes of this engagement process will inform development of the IP&R documents as well as meet Council’s Fit for the Future commitment to review all service levels in consultation with the community.
Working in partnershipIn recent years Eurobodalla Shire Council and Bega Valley Shire Council have successfully collaborated in a number of areas including joint tendering and program delivery, sharing policies, and economic planning for key facilities. In 2015 we formalised this partnership with the development of a Memorandum of Understanding (MoU) between the two Councils.
The MoU outlines how both Councils, can continue to operate and serve their respective communities, whilst working together to achieve improved operational outcomes, improved services and financial results, and improved advocacy. The MoU will provide an opportunity for joint advocacy for regional projects and facilities for economic growth in the areas of tourism, business development and related infrastructure.
This year we will work in partnership with Bega to identify opportunities for joint initiatives and cooperation focused on long term sustainability, manage community assets and infrastructure and to deliver community services more efficiently in the face of increasing costs, community expectations and other challenges.
The implementation of projects through effective collaboration and resource sharing will stimulate innovation, optimise opportunities and improve outcomes for both Eurobodalla and Bega communities.
Improved web access for smart phone and tablet usersIn 2016-17 Council’s website will be upgraded to be mobile responsive.
This will provide people who use tablets, phones or other devices to find information online and enjoy a better online customer service experience.
www.esc.nsw.gov.au is Council’s 24 hour a day, 7 day a week customer service shop front, with around 13,000 visits a month.
More than 35% of visitors to Council’s website now use a tablet or other mobile device, which has more than doubled since 2014-15.
Council shares information and encourages people to find out more on its website through traditional media and marketing, social media and its online newsletter.
By upgrading the website to be mobile responsive, Council will provide a seamless experience for users to navigate between its online platforms and easily access information on their preferred device.
EurobodaLLa ShirE CounCiL dELiVErY ProGraM 2013–2017 oPEraTionaL PLan & budGET 2016–17
60
Delivery Program activitiesThe Delivery Program outlines the key activities that Council will undertake over a four year period to assist in meeting community objectives and strategies outlined in the Community Strategic Plan — One Community. For the 2013–17 period these key activities include:
Activities
Executive services Provide information, guidance and support to ensure effective community engagement and leadership and excellence in Local GovernmentC1.1 Conduct the business of council in an inclusive, responsive and transparent manner
C1.2 Manage the organisation to effectively and efficiently meet our statutory obligations
C1.3 Undertake advocacy and collaborative activities to further local issuesCommunication Ensure effective community engagement and communicationC2.1 Provide quality, timely and accessible information to the communityintegrated planning Capture our community’s vision for the future and coordinate Council’s delivery through the Integrated Planning and Reporting FrameworkC3.1 Coordinate the delivery of the Integrated Planning and Reporting Framework across the organisation
C3.2 Undertake organisation service review
Delivery Program measuresThese measures are outcome focused and when tracked over time will show Council’s contribution towards implementing the objectives and strategies of the Community Strategic Plan — One Community. They are reported each year in our Annual Report, and also in the End of Council Term report.
Measure Target
Community satisfaction with:
• Council’soverallperformance• Councillorperformance• ValueformoneyofCouncilservices• CommunicationfromCouncil• Opportunitytoparticipateindecisionformingprocesses• Longtermplanning
Maintain or improve
Community participation in local issues and events Maintain or improve
Knowledge of Council services programs and outcomes Maintain or improve

63Eurobodalla ShirE CounCil dEliVErY ProGraM 2013–2017 oPEraTional Plan & budGET 2016–17
62 CoLLaboraTiVE
Delivery Program budget
Service Year income ($)
Expenditure ($)
Net result ($)
Capital expenditure
($)
Executive services 2013-14 759,158 2,017,940 (1,258,782) -
2014-15 29,286 2,130,424 (2,101,137) 15,571
2015-16 29,650 1,643,310 (1,613,660) -
2016-17 4,286 1,908,784 (1,904,498) 15,500
Total 822,380 7,700,458 (6,878,078) 31,071
2017-18 4,363 1,655,479 (1,651,116) -
Communication 2013-14 - 423,085 (423,085) -
2014-15 - 500,775 (500,775) -
2015-16 - 574,541 (574,541) -
2016-17 - 627,861 (627,861) -
Total - 2,126,261 (2,126,261) -
2017-18 - 600,498 (600,498) -
Integrated planning 2013-14 3,431 348,798 (345,367) 64,200
2014-15 4,343 328,186 (323,843) -
2015-16 6,618 351,057 (344,439) -
2016-17 4,968 405,889 (400,921) -
Total 19,360 1,433,930 (1,414,571) 64,200
2017-18 5,057 277,858 (272,801) -
2013-14 Complete 2014-15 Complete 2015-16 In progress (shows revised budgets as at March Review 2016) 2016-17 Forward budget estimates only 2017-18 Final year of community & transport infrastructure program - outside current Delivery Program term 2013-17
(forward budget estimates only) Total shows total for the four year term of current Delivery Program 2013-17
actions
Activity Action Measure (target)Resp.
officer*C1.1 Conduct the
business of Council in an inclusive, responsive and transparent manner
C1.1.1 Support the Councillors in meeting their statutory obligations and roles as community representatives
community events (effective coordination of); councillor newsletters (45)
GM
C1.1.2 Support the conduct of effective Council meetings
minutes published on website (100%); council agendas available prior to scheduled meetings (100%); council meetings (10)
GM
C1.1.3 Facilitate and support civic functions including: Australia Day, Anzac day and Citizenship ceremonies.
civic functions (effective coordination of)
GM
C1.2 Manage the organisation to effectively and efficiently meet our statutory obligations
C1.2.1 Respond to legislative and policy requirements set by the Department of Local Government
legislative requirements (met) GM
C1.3 undertake advocacy and collaborative activities to further local issues
C1.3.1 Retain membership and involvement with Local Government Association. Canberra Region Joint Organisation, South East Australian Transport Strategy (SEATS) and other relevant groups.
Participate in and report on major initiatives
GM
C1.3.2 Continuation of Memorandum of Understanding with Bega Valley Shire Council
Participate in and report on major initiatives
GM
*Full list of responsible officer codes detailed on page 90
budgetCost centre income Expenditure Net result Capital expenditure
Council & Committees 3,636 757,748 (754,112) 15,500
Donations 650 95,379 (94,729) -
Elections - 272,000 (272,000) -
Executive - 783,657 (783,657) -
Total 4,286 1,908,784 (1,904,498) 15,500
Capital programCapital item Funding source Total
C&TiP* Cash Crown reserves
Grants & cont.
inf. fund Loans
Council & CommitteesGOCO: Communication devices for new Councillors - 15,500 - - - - 15,500
Total for executive services - 15,500 - - - - 15,500 * Community and Transport Infrastructure Fund
Operational Plan & budget 2016-17EXECUTIVE SERVICES Provide information, guidance and support to ensure effective community engagement and leadership and excellence in Local Government

65Eurobodalla ShirE CounCil dEliVErY ProGraM 2013–2017 oPEraTional Plan & budGET 2016–17
64
donationsRecipient Amount
Safety
Surf Life Saving clubs (S298) 21,116
Voluntary rescue squads (S298) 8,354
Voluntary coastal patrols (S298) 8,364
Total safety 37,834
Schools & education
School speech night award 2,150
University of Wollongong scholarships 3,735
St Celia Music Scholarship 2,153
Total schools & education 8,038
Sports & recreation
Moruya Batemans Bay Pistol Club - rates 579
Batemans Bay Sporting Shooters Association - rates 489
South East Region Academy of Sport 14,818
Moruya Sport Shooters - rates 782
Total sports & recreation 16,668
Community & health
Southcare Helicopter Service 3,527
Wreaths 1,500
Civic receptions 5,212
Citizenship ceremonies 730
Christmas decorations 5,000
Jeff Britten Achievement award 662
Australia Day celebrations 10,665
CWA Hall - Narooma - rates 1,755
CWA Hall - Batemans Bay - rates 2,455
CWA Hall - Moruya - rates 1,528
Moruya Historical Society - rates 3,201
Mayoral donations 4,394
Total community & health 40,629
Healthy communities grants 12,455
Total communities grants 12,455
Cultural
Aboriginal arts exhibition 4,250
Eurobodalla Arts Council - rates 1,477
Regional Arts Development Board 12,130
Bay Theatre Players - rates 1,760
School of Arts - Narooma 6,000
School of Arts - Narooma - rates 3,677
School of Arts - Central Tilba - rates 1,791
Moruya & District Brass Band 1,098
Basil Seller's art prize 15,000
Other art & cultural 4,036
Total cultural 51,221
Other
Donations - other 8,630
Total other 8,630
Total 175,475
• ThetableaboveisatotalofproposeddonationsacrossallCouncilserviceareas.
CoLLaboraTiVE
actions
Activity Action Measure (target)Resp.
officer*C2.1 Provide quality,
timely and accessible information to the community
C2.1.1 Manage Council’s media relationships and provide timely and accurate information
media releases and media queries (400) EMCT
C2.1.2 Prepare and distribute regular issues of Living in Eurobodalla magazine, the Council News email newsletter and grow the subscriber base
magazines (4); council news issues (10); increase subscribers (5%)
EMCT
C2.1.3 Manage Council’s web and social media presence
social media activities (300; sessions on esc.nsw.gov.au (5% increase)
EMCT
C2.1.4 Engage the community on key issues through workshops, on site meetings and monthly market program
community forums (evidence of) EMCT
C2.1.5 Guide and monitor uptake and implementation of the community engagement framework
engagement calendar and register (developed and in use); engagement plans for all major projects (prepared and endorsed); staff training (complete)
EMCT
C2.1.6 Mobile responsive web project project milestones (met) EMCT
*Full list of responsible officer codes detailed on page 90
budgetCost centre income Expenditure Net result
Media & communications - 627,861 (627,861)
Total - 627,861 (627,861)
Operational Plan & budget 2016-17COMMUNICATIONEnsure effective community engagement and information
actions
Activity Action Measure (target)Resp.
officer*C3.1 Coordinate
the delivery of the integrated Planning and reporting Framework across the organisation
C3.1.1 Prepare Council’s Delivery Program and Operational Plan
statutory requirements (met) CPC
C3.1.2 Prepare the Annual Report and progress reports
statutory requirements (met) CPC
C3.1.3 Project manage cross council input into Integrated Planning and Reporting documents
project plan (prepared and implemented); resourcing strategy (updated annually)
CPC
C3.1.4 Community Strategic Plan review review (complete) CPC
C3.1.5 Implement software and systems implementation (complete) CPC
C3.2 undertake organisation service review
C3.2.1 Strategic services service review review (complete) SRPO
*Full list of responsible officer codes detailed on page 90
budgetCost centre income Expenditure Net result
Community & corporate planning 4,968 405,889 (400,921)
Total 4,968 405,889 (400,921)
Operational Plan & budget 2016-17INTEGRATED PLANNINGCapture our communities vision for the future and coordinate Council’s delivery through the Integrated Planning and Reporting Framework
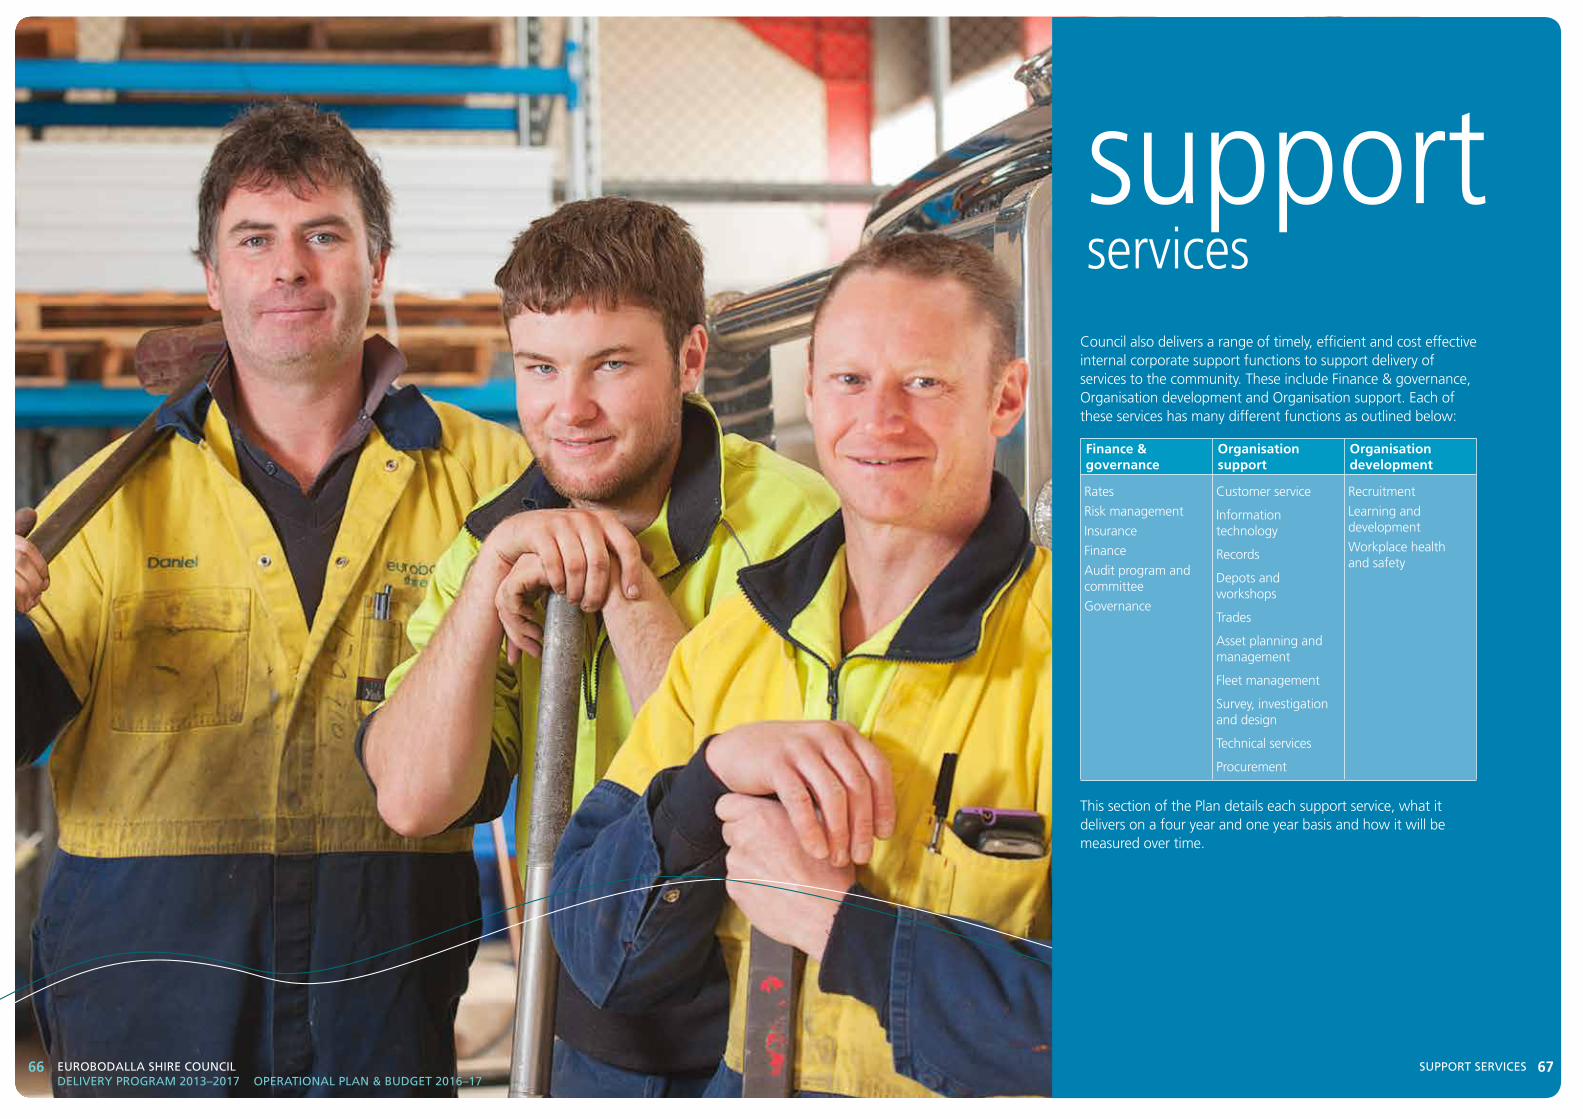
66 EurobodaLLa ShirE CounCiL dELiVErY ProGraM 2013–2017 oPEraTionaL PLan & budGET 2016–17
67SuPPorT SErViCES
support services
Council also delivers a range of timely, efficient and cost effective internal corporate support functions to support delivery of services to the community. These include Finance & governance, Organisation development and Organisation support. Each of these services has many different functions as outlined below:
Finance & governance
Organisation support
Organisation development
Rates
Risk management
Insurance
Finance
Audit program and committee
Governance
Customer service
Information technology
Records
Depots and workshops
Trades
Asset planning and management
Fleet management
Survey, investigation and design
Technical services
Procurement
Recruitment
Learning and development
Workplace health and safety
This section of the Plan details each support service, what it delivers on a four year and one year basis and how it will be measured over time.

69
Moving to an electronic, paperless officeThis year, in an effort to reach our goal of becoming a paperless office, council will move key corporate and records management services over to an electronic environment.
Analysis of current practices within each service area will inform the development of a timeframe for all internal processes to become fully electronic.
The project will include milestones such as the migration of paper based records to electronic, transfer of State records to State Archives for future preservation, and providing the right tools and mobile technologies for staff operating externally to access internal resources, eliminating the need for paper files in the field.
This will reduce costs associated with printing, postage, duplication and scanning and dramatically improve our corporate records processes.
We anticipate that increases to productivity will allow both internal and external customers to experience a faster, more accessible and convenient service; while assisting Council to work towards more environmentally friendly and sustainable practices.
Council’s procurement roadmapAs a result of an audit of Council’s procurement and contract management functions the development of a procurement strategy was identified as a priority. Last year we prepared the Procurement Strategy which will enable broad reform in the procurement area as well as provide a structured process to improve efficiencies, build probity and support council objectives.
This year we will continue to implement key actions from the strategy including: develop and implement a code of practice for contract management to establish agreed consistent processes to manage contracts and report on performance; conduct general training for all staff and specific training for key staff and contractors to ensure awareness of process; develop a regional pre-qualified trade services panel to improve ease of engagement; develop ongoing supplier education program to assist local business in understanding council requirements when preparing tenders and develop an annual procurement plan which includes all key procurement activities.
Ongoing implementation of the strategy will continue into the future.
Corporate Business SystemIn 2015-16 Council completed the tender process for a new and improved Corporate Business System. The project will provide an IT system solution that allows us to innovate and improve our services and efficiency.
It will provide better integration, remove data duplication, improve reporting, replace in-house programs, improve mobile technology options and assist in automating manual processes.
Moving to a single platform that uses up-to-date operating environments, such as cloud technology, will mean our software is compliant with current standards and sustainable for the future.
Our customers will also see benefits from the migration with the development of eBusiness solutions and self service capabilities that allow customers to lodge and track their own requests and applications, pay for services online and much more.
The process will take up to two years, depending on resourcing and data migration. This year we will finalise the contract negotiations, determine the implementation schedule and commence the process.
EurobodaLLa ShirE CounCiL dELiVErY ProGraM 2013–2017 oPEraTionaL PLan & budGET 2016–17
68
Delivery Program measuresThese measures are outcome focused and when tracked over time will show Council’s contribution towards implementing the objectives and strategies of the Community Strategic Plan – One Community. They are reported each year in our Annual Report, and also in the End of Council Term report.
Measure Target
Staff engagement and job satisfaction Improve
Workplace Health and Safety Audit # of actions implemented
Community satisfaction with:
• Council’scustomerservice• ManagementofCouncil’sfinances
Maintain or improve
Implementation of Council’s Asset Management Strategy # of actions completed
Delivery Program activitiesThe Delivery Program outlines the key activities that Council will undertake over a four year period to assist in meeting community objectives and strategies outlined in the Community Strategic Plan — One Community. For the 2013–17 period these key activities include:
Activities
Finance & governance Oversee Councils financial and governance obligations
SS1.1 Manage Council’s financial assets and obligations
SS1.2 Maintain a sound governance framework within which Council operates
Organisation development Facilitate recruitment, development and retention of quality staff that encourage continuous improvement and service excellence
SS2.1 Provide and manage frameworks for the development and maintenance of an effective and motivated workforce
SS2.2 Provide and maintain a framework for the management and minimisation of risks to health and safety of staff
Organisation support Support all areas of Council in achieving efficient and successful ongoing operations
SS3.1 Provide quality customer service
SS3.2 Provide efficient information and records management systems
SS3.3 Provide administrative, technical, professional and trade services
SS3.4 Plan for the sustainable management of Council assets
SuPPorT SErViCES

71Eurobodalla ShirE CounCil dEliVErY ProGraM 2013–2017 oPEraTional Plan & budGET 2016–17
70
Delivery Program budget
Service Year income ($)
Expenditure ($)
Net result ($)
Capital expenditure
($)
Organisation development
2013-14 134,433 1,342,801 (1,208,368) 13,588
2014-15 172,286 1,467,113 (1,294,827) -
2015-16 112,532 1,863,766 (1,751,234) -
2016-17 69,700 1,490,785 (1,421,085) 30,000
Total 488,951 6,164,465 (5,675,514) 43,588
2017-18 70,954 1,441,821 (1,370,866) -
Organisation support 2013-14 864,396 (6,866,580) 7,730,976 4,866,152
2014-15 980,866 (6,054,695) 7,035,561 3,751,217
2015-16 931,176 (6,501,130) 7,432,306 4,011,259
2016-17 906,946 (6,097,159) 7,004,105 6,683,142
Total 3,683,383 (25,519,564) 29,202,947 19,311,771
2017-18 923,272 (5,858,669) 6,781,941 5,318,614
Finance & governance
2013-14 28,283,028 4,879,503 23,403,524 -
2014-15 31,047,902 3,788,480 27,259,423 -
2015-16 32,945,490 5,908,245 27,037,245 62,160
2016-17 34,748,111 5,846,763 28,901,348 -
Total 127,024,532 20,422,992 106,601,540 62,160
2017-18 37,031,831 6,227,395 30,804,436 -
2013-14 Complete 2014-15 Complete 2015-16 In progress (shows revised budgets as at March Review 2016) 2016-17 Forward budget estimates only 2017-18 Final year of community & transport infrastructure program - outside current Delivery Program term 2013-17 (forward budget estimates only)Total shows total for the four year term of current Delivery Program 2013-17
The Resourcing Strategy Council’s Resourcing Strategy provides planning and analysis to ensure Council has the money, assets and infrastructure, and people required to deliver on the Community Strategic Plan, the Delivery Program and the Operational Plan.
The Resourcing Strategy, which is the main guiding document for Council support operations, consists of the Long Term Financial Plan, Asset Management Strategy and Workforce Management Plan. It provides for the long term planning and measurement of the key corporate functions of Council including Finance, Asset Management and Organisation Development.
Long Term Financial Plan The Long Term Financial Plan (LTFP) shows the way Council proposes to manage its financial commitments and maintain financial sustainability. This plan focuses on Council’s long term financial goal of financial sustainability and delivering quality services to the Community. This plan addresses areas that impact the Council’s ability to fund its services and capital works, whilst living within its means and ensuring financial sustainability. Details of how we will measure and report on our financial performance is detailed on page 6 of this document.
asset Management Strategy and Plans These key asset management documents provide the information needed to plan for future management of assets and identify ways to address challenges and fund the repair and upkeep of our current assets. They are a reflection of Council’s intention that our community and transport infrastructure network and services are maintained in partnership with other levels of Government and stakeholders to meet the needs of our community. Details of how we will measure and report on the performance of our assets is detailed on page 8 of this document.
Workforce Management Plan The Workforce Management Plan (WMP) provides a roadmap to manage Council’s workforce ensuring that we have the right number of people with the right skills, in the right job, at the right time. This plan focuses on retaining staff, developing leaders, up skilling Managers, and providing appropriate learning and participation opportunities in order to achieve the Delivery Program.
Our WMP is supported by the Learning and Development Plan and The Workplace Health and Safety Strategy. Together these three documents guide and measure the performance of our workforce.
SuPPorT SErViCES

73Eurobodalla ShirE CounCil dEliVErY ProGraM 2013–2017 oPEraTional Plan & budGET 2016–17
72 SuPPorT SErViCES
budget
Cost centre income Expenditure Net result Capital expenditure
Organisation supportAsset management 6,151 529,678 (523,527) - Corporate overheads - (16,170,744) 16,170,744 - Council land management 317,830 840,731 (522,900) - Customer services 10,100 843,490 (833,390) - Depots & workshops 164,019 2,811,933 (2,647,915) 2,307,310General administration - 123,976 (123,976) - Information technology 4,732 2,348,916 (2,344,184) 3,407,832Management committees 66,415 251,186 (184,771) - Office buildings - 722,568 (722,568) 290,000Private works 317,000 251,146 65,854 - Technical services 20,700 1,349,961 (1,329,261) 678,000
Total for organisation support 906,946 (6,097,159) 7,004,105 6,683,142
Organisation developmentPersonnel Services 69,700 1,490,785 (1,421,085) 30,000
Total for organisation development 69,700 1,490,785 (1,421,085) 30,000
Finance & governanceEnv. general rates & revenue 934,631 - 934,631 -
Finance 424,879 4,439,745 (4,014,867) -
General rates & revenues 33,383,634 (75,849) 33,459,483 -
Governance - 207,181 (207,181) -
Risk management & insurance 4,968 1,275,686 (1,270,719) -
Total for finance & governance 34,748,111 5,846,763 28,901,348 -
Total 35,724,757 1,240,389 34,484,368 6,713,142
Capital programCapital item Funding source Total
C&TiP* Cash Crown reserves
Grants & cont.
inf. fund Loans
Depots and workshops
ZO0663: Depot renewals - - - - 25,000 - 25,000 ZO068: Radio base - Gollaribee Mountain - 6,108 - - - - 6,108
ZOWKPO: Fleet & plant purchases - 2,276,202 - - - - 2,276,202
Total for depots & workshops - 2,282,310 - - 25,000 - 2,307,310
information technology
ZO075: Computer equipment - 180,000 - - - - 180,000 ZO701: Corporate Information Systems Review - 2,601,246 - - - 626,586 3,227,832
Total for information, communications & technology - 2,781,246 - - - 626,586 3,407,832
Office buildingsZO017: Administration building - improvements - 10,000 - - - - 10,000
ZO076: Furniture - 10,000 - - - - 10,000
ZO0161: Administration building - lift - - - - - 270,000 270,000
Total for office buildings - 20,000 - - - 270,000 290,000
Technical services
ZOCSTS: Capital program design costs 250,000 428,000 - - - - 678,000
Total for technical services 250,000 428,000 - - - - 678,000
Personnel services
ZOCSPS: Training room facilities - 30,000 - - - - 30,000
Total for personnel services - 30,000 - - - - 30,000
Total for support services 250,000 5,541,556 - - 25,000 896,586 6,713,142
Budget & capital program 2016–17SUPPORT SERVICESMeasuring corporate performance
The remaining functions of these support services including governance, information technology, customer service and records, depots and workshops and technical services, are measured through Council’s corporate performance measures
Function Measure(target)
Customer service & records management*
Number of calls receivedReception calls answered within 40sec (90%)Cash balance (nil discrepancies)Call abandonment rate (<5%)
Organisational customer service**
Correspondence (85% within agreed timeframes)Customer service requests (85% within agreed timeframes)Customer service skills as assessed against local government industry benchmarks• CustomerServiceIndex(LGAbenchmark:179)• Greetingskills(LGBenchmark:100)• Manner(LGBenchmark:100)• Enquiryresolutionskills(LGBenchmark:100)• Communicationskills(LGBenchmark:98)
Organisation development Staff retention rateYouth positions (maintain or increase)Workers lost time injury incidents (5% decrease)Equivalent fulltime staff (EFT)Population per EFTStaff costs as % of total budgetStaff turnoverNew workers compensation claims
Governance Government Information(Public Access) Act 2009 (GIPA)• FormalGIPAaccessapplicationsreceived• FormalGIPAaccessapplicationdetermined
Code of conduct• Numberofcodeofconductcomplaints• Complaintsinvestigatedrequiringaction• Costofdealingwithcodeofconductcomplaints
* Community and Transport Infrastructure Fund
* Customer service and records management measures measure performance of the specific team that deliver those services within council.** Organisational customer service refers to the level of service delivery provided by the whole organisation to the community

Budget 2016–17
EurobodaLLa ShirE CounCiL dELiVErY ProGraM 2013–2017 oPEraTionaL PLan & budGET 2016–17
74
Operational Plan Budget 2016-17 This section of the document outlines how Council’s budget for the 2016–17 period was prepared and includes detailed information on income, expenditure, capital programs, and key budget considerations. The net operating result before capital grants and contributions best presents our expected financial performance. A balanced net operating result over the long term is the key Fit for the Future Ratio that Council must meet and is fundamental to our ongoing financial sustainability. Our original forecast net operating result before capital grants and contributions for 2016-17 was a surplus of $1.37 million. Preparation of the 2016-17 budget has resulted in a deficit of $0.11million. The forecast deficit is predominantly due to receiving significant grant funding in 2015-16 with the majority of these funds budgeted to be spent in 2016-17. This has created a mismatch of income and expenditure between 2015-16 and 2016-17. However, the underlying trend is an improvement in our performance. This improvement has been achieved through a focus on the delivery of financial strategies that target cost savings and increased revenue, maintaining our Fit for the Future status in the General Fund. For our Water and Sewer Funds the focus was on continuing strong financial results through appropriate financing of capital programs to minimise borrowing costs. The following table shows the difference between the original consolidated 2016-17 budget and the revised budget:
Original ($’000)
Revised ($’000)
Total income (before capital grants & cont.) $102,209 $105,988
Total expenses $100,841 $106,103
Net operating result (before capital grants & cont.) $1,367 $(115)
Net operating result (after capital grants & cont.) $10,977 $12,667
Total capital program $48,861 $59,026
Cash position – increase/(decrease) in unrestricted funds $3,437 $(2,895)
The total capital program shows an increase of over $10 million on the original forecast due to the revised timing of some major projects such as the Surf Beach Landfill cell works, the airport redevelopment and the Corporate Business Information System in the General Fund, as well as the Rosedale/Guerilla Bay and Bodalla sewerage schemes and the Southern Dam in the Water and Sewer Funds. An addition of the new energy efficiency project to replace all streetlights with LED globes and the purchase of the Batemans Bay Bowling Club has also impacted the revised capital expenditure.
The change in the cash position reflects the implementation of Council’s Treasury Management Strategy to make better use of available cash reserves, reducing both reliance on borrowings and the amount of interest council pays.
While this budget is for the 2016–17 period it is important to note that Council also prepares a Long Term Financial Plan (LTFP) with a 10 year horizon. The LTFP is a decision making and problem solving tool to guide future action. It is updated annually and reviewed in detail every four years. The LTFP underpins the content of Council’s four year Delivery Program and one year Operational Plan.
75ThE budGET 2016-17

7776 ThE budGET 2016-17EurobodaLLa ShirE CounCiL dELiVErY ProGraM 2013–2017 oPEraTionaL PLan & budGET 2016–17
Budget considerationsSome of the key considerations in preparing the 2016-17 budget were:
Fit for the futureOur Fit for the Future improvement proposal, which outlined a range of actions and strategies to ensure we would be able to meet benchmarks of financial sustainability, was assessed by the Independent Pricing and Regulatory Tribunal (IPART) as “fit”. Fit for the Future ratios are measured on General fund performance only.
It is important that we maintain our “fit” status by implementing the strategies and actions in our proposal. The current forward budget process has updated our forecasts based on the revised budget position and progress with the financial strategies. Detailed information on Fit for the Future ratio performance can be found on page 2.
The overall Fit For the Future strategy is to achieve an operating surplus to enable the increased use of funds to meet long term infrastructure renewal needs.
rate revenueThe Independent Pricing & Regulatory Tribunal (IPART) is responsible for determining applications for increases in general income above the rate peg, known as ‘Special Rate Variations’. Council was successful in 2015-16 for a rate variation of 6.5%, including the rate peg amount for three consecutive years.
The revenue generated by the rate variation in 2016-17 improves the Operating Result by $1.48 million, and contributes to funding the delivery of year two of our Community and Transport Infrastructure Program valued at $5.28 million.
Treasury management strategyA key consideration in the budget process is how Council will finance its capital program. Council’s Treasury Management strategy aims to maintain satisfactory liquidity levels whilst minimising its reliance on external borrowings to finance this program.
Council’s liquidity position, which is its ability to pay its debts as and when they fall due, is measured by the current unrestricted ratio. The benchmark is at least $1.50 of cash for every $1.00 of liabilities requiring settlement in the short term. As at 30 June 2015, Council exceeded the benchmark with a current unrestricted ratio of $3.09 of cash for every $1.00 of current liabilities. It had $84 million in cash and investments and $29.2 million of this being unrestricted.
This strong liquidity position has enabled Council to look at using its available cash reserves instead of borrowings. By minimising our reliance on borrowings we reduce borrowing costs which improves our operating performance.
Cash reserves in the General Fund have been used to replace borrowings to finance capital works, in particular for the waste cell works. This same strategy has previously been employed successfully in Council’s Water and Sewer Funds.
Rates and annual charges 54%
User fees and other 24%
Grants 19%
Investment revenue 3%
Materials & contracts 37%
Employee costs 32%
Depreciation 28%
Interest 3%
Where does our money come from?
in 2016-17, we estimate we will manage an income of $106 million (excluding capital grants and contributions).
Over half of this will come from ratepayers. The rest is from user fees and charges, grants, development contributions and investments.
This year the Community and Transport Infrastructure Progam will raise an additional $1.85 million in revenue.
Budget position
operating performanceThe original forecast consolidated budget for 2016–17 was an operating surplus of $1.37 million (before capital grants and contributions). The revised consolidated budget for 2016-17 shows a deficit of $0.11 million.
Revised operating surpluses are budgeted in the Water Fund - $0.82 million, Sewer Fund - $0.87 million. Revised operating deficits are budgeted in the General Fund (including Environment and Waste) - $1.81 million.
Favourable impacts include: increased one off additional Roads to Recovery grant funding of $1.7 million, the successful implementation of Fit for the Future actions from our improvement proposal and increased revenue from contract works with the Roads and Maritime Services on the Kings Highway.
This was offset by additional expenditure relating to new budget items of $2.47 million, including Grey Headed Flying Fox dispersal program, resourcing for the review of Council’s Integrated Planning & Reporting documents, procurement roadmap implementation, operating costs for the Moruya arts facility, costs for the mystery shopper program and increased community newsletter costs.
Financing programImplementing the 2016-17 Operational Plan requires new borrowings of $16.7 million. $3.4 million of this is to fund year two of the Community and Transport Infrastructure Program.
Total borrowings over the four years of this Delivery Program 2013-17 is $46 million, including $5.8 million to fund the Community and Transport Infrastructure Program. These borrowings are directly linked to the total capital expenditure of $155 million over the four year period.
Cash/fund flow positionThe cash position of Council is different to the operating position as it excludes non cash movements. Non cash movements include things such as depreciation and provision for employee entitlements. These are costed to Council’s operating result but do not represent actual cash paid. The operating result does not include funds received from borrowings.
The 2016-17 consolidated budget forecasts deficit cash/fund flows of $2.89 million. The Water and Sewer Funds are forecasting surpluses of $4.1 million and $2.3 million respectively due to the current low requirement for renewal of infrastructure in these areas.
The cash flow deficit in the General Fund is forecast to be $9.3 million. This includes the Waste Fund which has significant cell works, predominately cash funded in accordance with Council’s Treasury Management Strategy.
Over the four years of this Delivery Program 2013-17 the net consolidated unrestricted cash funds are expected to increase by $15.1 million with the aim of maintaining conservative debt service ratios and appropriate unrestricted cash. Unrestricted cash means that these monies are available for any ordinary operating activities undertaken by the relevant Funds within Council. Restricted funds are those that are quarantined or reserved for specified activities.
Capital program Capital expenditure this year is budgeted at $59 million. This includes $5.28 million relating to the Community and Transport Infrastructure Program funded by the rate variation. This is an increase on last year’s program and Council will receive grants from various government agencies to fund the program, as well as utilise contractors for the design and construction of major
projects. The 2016–17 capital program is detailed on page 7.
Detailed financial statements and key explanatory notes for each of Council’s funds are outlined on the following pages.
Where does our money go?
in 2016-17, we estimate our operating expenditure to be approximately $106 million.
Council will also spend $59 million on capital and renewal works. $5.28 million of which will deliver year two of the Community and Transport Infrastructure Program.

79Eurobodalla ShirE CounCil dEliVErY ProGraM 2013–2017 oPEraTional Plan & budGET 2016–17
78
iNCOME STATEMENT 2013–14 2014–15 2015–16 2016–17
Revenue
Rates & annual charges 50,031,764 52,569,658 55,039,599 57,697,930
User fees and other 24,181,608 24,081,327 24,750,941 25,277,960
Investment revenues 3,200,407 3,311,535 3,102,287 3,240,923
Grants 16,678,407 19,034,008 24,103,597 19,771,782
Profit/(loss) on disposal of assets (2,639,060) (3,069,137) 126,596 -
Total revenue 91,453,126 95,927,391 107,123,020 105,988,595
Less expenses
Interest 4,082,597 3,976,894 3,282,466 3,002,313
Depreciation 27,319,854 29,109,882 28,898,480 29,806,210
Employee costs 32,552,775 32,129,986 32,726,627 34,198,243
Other costs (incl materials & contracts) 30,426,590 29,137,651 41,296,725 39,096,580
Total expenses 94,381,816 94,354,413 106,204,297 106,103,346
Net surplus (-deficit) before capital revenue (2,928,690) 1,572,977 918,722 (114,751)
Developer contributions 1,935,005 2,089,594 3,875,000 2,595,000
Capital grants & contributions 4,536,216 4,369,139 6,357,670 10,187,243
Net surplus (-deficit) after capital revenue 3,542,531 8,031,710 11,151,392 12,667,492
CASH/FUND FLOW STATEMENT
Operations
Receipts 100,563,407 105,455,260 117,229,093 118,770,838
Payments (67,027,985) (65,143,908) (77,305,818) (76,297,136)
Net cash provided (or used in) operations 33,535,423 40,311,352 39,923,276 42,473,702
investing
Proceeds from asset sales 695,494 1,282,516 1,363,985 727,430
Repayments from deferred debtors (14,000) (15,500) 20,000 20,000
Purchase of assets (27,118,456) (26,615,294) (42,231,683) (59,026,102)
Net cash provided (or used in) investing (26,436,962) (25,348,278) (40,847,698) (58,278,672)
Financing
Proceeds from borrowing 13,007,297 5,739,349 10,577,748 16,706,795
Repayments of borrowings (12,754,904) (11,032,437) (11,075,853) (9,856,690)
Net cash provided (or used in) financing 252,393 (5,293,088) (498,105) 6,850,105
Net increase/(decrease) in cash/funds 7,350,853 9,669,986 (1,422,528) (8,954,865)
Transfers from (to) restricted investments 3,633,664 (2,315,581) 1,084,224 6,058,924
Net increase (decrease) in unrestricted funds 10,984,517 7,354,405 (338,304) (2,895,941)2013-14 Complete2014-15 Complete2015-16 Year one of rate variation- in progress (shows revised budgets as of March Review 2016)2016-17 Year two of rate variation (forward budget estimates only)
Consolidated fund explanatory notes•Largeoperatingsurplusaftercapitalforecastfor2016-17duetosignificantcapitalincome. •Cashflowdeficitsreflectstrategiestominimiseborrowingsandtouseexistingcashreservestofundsignificantcapitalprograms.
Consolidated financial budgets
ThE budGET 2016-17
iNCOME STATEMENT 2013–14 2014–15 2015–16 2016–17
Revenue
Rates & annual charges 28,623,282 29,456,691 31,241,106 33,264,255
User fees and other 13,417,657 13,723,562 14,442,829 14,527,294
Investment revenues 2,673,477 3,018,613 2,657,465 2,563,023
Grants 16,284,912 18,603,074 23,701,692 19,369,879
Profit/(loss) on disposal of assets (2,177,151) (1,600,161) 11,379 -
Total revenue 58,822,177 63,201,779 72,054,471 69,724,451
Less expenses
Interest 2,077,249 2,165,936 2,016,902 2,007,940
Depreciation 14,997,402 16,671,614 16,225,107 17,342,212
Employee costs 27,501,720 26,433,501 26,809,849 28,455,666
Other costs (incl materials & contracts) 17,030,447 17,861,341 27,834,030 23,729,788
Total expenses 61,606,818 63,132,391 72,885,888 71,535,605
Net surplus (-deficit) before capital revenue (2,784,641) 69,388 (831,417) (1,811,155)
Developer contributions 864,266 941,529 975,000 795,000
Capital grants & contributions 3,844,604 2,961,838 4,314,670 7,387,243
Net surplus (-deficit) after capital revenue 1,924,229 3,972,754 4,458,253 6,371,088
CASH/FUND FLOW STATEMENT
Operations
Receipts 65,708,198 68,705,307 77,332,761 77,906,694
Payments (46,575,438) (46,360,154) (56,660,781) (54,193,394)
Net cash provided (or used in) operations 19,132,759 22,345,152 20,671,980 23,713,300
investing
Proceeds from asset sales 656,951 1,271,726 1,363,985 727,430
Repayments from deferred debtors (14,000) (15,500) 20,000 20,000
Purchase of assets (20,376,993) (20,106,339) (29,887,886) (45,645,102)
Net cash provided (or used in) investing (19,734,042) (18,850,113) (28,503,901) (44,897,672)
Financing
Proceeds from borrowing 10,091,487 4,619,277 4,987,527 11,467,460
Repayments of borrowings (3,812,829) (2,942,482) (2,942,483) (6,602,685)
Net cash provided (or used in) financing 6,278,658 1,676,796 2,045,044 4,864,775
Net increase/(decrease) in cash/funds 5,677,375 5,171,836 (5,786,877) (16,319,597)
Transfers from (to) restricted investments 2,510,285 (755,210) 341,047 6,998,924
Net increase (decrease) in unrestricted funds 8,187,660 4,416,625 (5,445,830) (9,320,673)2013-14 Complete2014-15 Complete2015-16 Year one of rate variation- in progress (shows revised budgets as of March Review 2016)2016-17 Year two of rate variation (forward budget estimates only)
General fund explanatory notes• Thebudgetedincomestatementpositionfor2016-17isadeficitof$1.81millionbeforecapitalrevenue.• Thebudgetedcashpositionisadeficitof$9.32million.ThisdeficitreflectstheTreasuryManagementStrategydesignedtominimiseborrowingsby
using cash reserves.
General fund (including Environment and Waste) financial statement

81Eurobodalla ShirE CounCil dEliVErY ProGraM 2013–2017 oPEraTional Plan & budGET 2016–17
80
iNCOME STATEMENT 2013–14 2014–15 2015–16 2016–17
Revenue
Rates & annual charges 4,648,541 5,861,762 6,037,656 6,197,303
User fees and other 9,972,228 9,592,580 9,548,112 9,990,666
Investment revenues 302,136 423,925 428,407 567,000
Grants 201,495 200,546 206,427 206,426
Profit/(Loss) on disposal of assets (309,795) (1,031,757) 67,716 -
Total revenue 14,814,605 15,047,057 16,288,318 16,961,395
Less expenses
Interest 622,155 583,725 161,562 62,183
Depreciation 6,069,874 6,076,833 6,184,009 5,872,328
Employee costs 4,260,213 4,839,896 5,007,069 4,854,173
Other costs (incl materials & contracts) 4,010,419 3,083,655 4,135,209 5,347,653
Total expenses 14,962,661 14,584,108 15,487,848 16,136,337
Net surplus (-deficit) before capital revenue (148,055) 462,949 800,470 825,058
Developer contributions 589,812 1,148,065 1,600,000 1,000,000
Capital grants & contributions 120,254 243,466 113,000 -
Net surplus (-deficit) after capital revenue 562,011 1,854,479 2,513,470 1,825,058
CASH/FUND FLOW STATEMENT
Operations
Receipts 15,834,466 17,470,344 17,933,602 17,961,395
Payments (8,892,787) (8,507,275) (9,303,840) (10,264,009)
Net cash provided (or used in) operations 6,941,679 8,963,069 8,629,762 7,697,386
investing
Proceeds from asset sales 38,543 10,790 - -
Purchase of assets (2,300,516) (2,566,784) (2,826,000) (3,245,000)
Net cash provided (or used in) investing (2,261,973) (2,555,994) (2,826,000) (3,245,000)
Financing
Repayments of borrowings (5,965,523) (1,509,603) (1,509,603) (69,603)
Net cash provided (or used in) financing (5,965,523) (1,509,603) (1,509,603) (69,603)
Net increase/(decrease) in cash/funds (1,285,817) 4,897,472 4,294,159 4,382,783
Transfers from (to) restricted investments 613,253 (662,518) (1,045,000) (280,000)
Net increase (decrease) in unrestricted funds (672,564) 4,234,954 3,249,159 4,102,7832013-14 Complete2014-15 Complete 2015-16 Year one of rate variation- in progress (shows revised budgets as of March Review 2016)2016-17 Year two of rate variation (forward budget estimates only)
Water fund explanatory notes• The access charge increased to $294 (1.7%) with the usage charge to increase also by 1.1% to $3.52 per kilolitre. This is consistent with best practice
pricing.•Thebudgetedincomestatementpositionbeforecapitalrevenueisasurplusof$0.83millionand$1.83millionsurplusaftercapitalrevenue.• Thebudgetedcashpositionisasurplusof$4.1million.•Renewalscontinuetobebelowannualdepreciationduetotheageandconditionofthenetwork,howeverappropriatemaintenancecontinueson
water infrastructure.•Councilaimstoprovideforadividendfromthisfundin2017-18subjecttoresults.
Water fund financial statement
ThE budGET 2016-17
iNCOME STATEMENT 2013–14 2014–15 2015–16 2016–17
Revenue
Rates & annual charges 16,759,941 17,251,205 17,760,837 18,236,372
User fees and other 791,723 765,184 760,000 760,000
Investment revenues 224,793 (131,003) 16,415 110,900
Grants 192,001 230,388 195,478 195,477
Profit/(Loss) on Disposal of Assets (152,114) (437,219) 47,501 -
Total revenue 17,816,344 17,678,554 18,780,231 19,302,749
Less expenses
Interest 1,383,193 1,227,234 1,104,002 932,190
Depreciation 6,252,578 6,361,435 6,489,364 6,591,670
Employee costs 790,842 856,590 909,709 888,405
Other costs (incl materials & contracts) 9,385,724 8,192,654 9,327,486 10,019,139
Total expenses 17,812,338 16,637,913 17,830,561 18,431,404
Net surplus (-deficit) before capital revenue 4,006 1,040,641 949,670 871,345
Developer contributions 480,928 910,010 1,300,000 800,000
Capital grants & contributions 571,357 253,825 1,930,000 2,800,000
Net surplus (-deficit) after capital revenue 1,056,292 2,204,477 4,179,670 4,471,345
CASH/FUND FLOW STATEMENT
Operations
Receipts 19,020,743 19,279,609 21,962,730 22,902,749
Payments (11,559,759) (10,276,478) (11,341,197) (11,839,734)
Net cash provided (or used in) operations 7,460,984 9,003,131 10,621,533 11,063,015
investing
Purchase of assets (4,440,947) (3,942,172) (9,517,797) (10,136,000)
Net cash provided (or used in) investing (4,440,947) (3,942,172) (9,517,797) (10,136,000)
Financing
Proceeds from borrowings 5,892,361 1,120,072 5,590,221 5,239,335
Repayments of borrowings (2,976,551) (6,580,353) (6,623,767) (3,184,402)
Net cash provided (or used in) financing (60,742) (5,460,281) (1,033,546) 2,054,933
Net increase/(decrease) in cash/funds 2,959,296 (399,322) 70,190 2,981,948
Transfers from (to) restricted investments (510,125) (897,853) 1,013,444 (660,000)
Net increase (decrease) in unrestricted funds 3,469,421 (1,297,174) 1,083,634 2,321,9482013-14 Complete 2014-15 Complete2015-16 Year one of rate variation- in progress (shows revised budgets as of March Review 2016)2016-17 Year two of rate variation (forward budget estimates only)
Sewer fund explanatory notes•Thesewerageaccesschargehasbeenincreasedby1.8%to$902(20mmconnectionaccesscharge)withtheusagechargetoincreasealsoby
1.8% to $1.78 per kilolitre.• Thebudgetedincomestatementpositionbeforecapitalrevenueisasurplusof$0.87millionand$4.47millionsurplusaftercapitalrevenue.• Thebudgetedcashpositionisasurplusof$2.32million.•CouncilcontinuestoincludefundingforthesmallvillagesewerageschemesofBodallaandRosedale/GuerrillaBay.•Renewalscontinuetobebelowannualdepreciationduetotheageandconditionofthenetwork,howeverappropriatemaintenancecontinues
on sewer infrastructure.•Councilwillseekadividendfromthisfundsubjecttoresultsin2016-17.
Sewer fund financial statement

Eurobodalla ShirE CounCil dP/oP 2013 ?????
EurobodaLLa ShirE CounCiL dELiVErY ProGraM 2013–2017 oPEraTionaL PLan & budGET 2016–17
82
Revenue Policy
Our Revenue Policy is prepared annually in accordance with Section 405 of the Local Government Act 1993. The Revenue Policy includes the following statements for the year 2016-17:
• Ratingstructure
• Leviesandcharges
• Pricingpolicy
• Borrowings
83rEVEnuE PoLiCY
Rating structureThe rating structure for General Rates is based on a combination of a base amount for all properties with the remainder calculated on a rate in the dollar, based on land value assigned by the Valuer–General.
Land valuations are based on market movements reviewed every three or four years. Eurobodalla local governemnt area was recently valued in 2014. The new valuations came into effect for rating from 1 July 2015.
rate peggingThe NSW Government introduced rate pegging in 1987. Rate pegging limits the amount by which the Council can increase its rate revenue from one year to the next. The amount of the rate peg is set by the Independent Pricing and Regulatory Tribunal of NSW(IPART).
The Independent Pricing & Regulatory Tribunal (IPART) is responsible for determining applications for increases in general income above the rate peg, known as ‘Special Rate Variations’. Council was successful in 2015-16 for a rate variation of 6.5%, including the rate peg amount for three consecutive years
This means that the General Rate will again increase by 6.5% for 2016-17 and 2017-18 including the rate peg amount, with the increase to remain permanently in the rate base.
.
rating categoriesEach parcel of land in the Eurobodalla has been categorised for rating purposes in accordance with Sections 515 to 519 of the Local Government Act 1993 (LGA).
residential Applies uniformly to all properties where the dominant use is residential or in the case of vacant land, where it is zoned or used for residential purposes.
Farmland Applies to all properties in the Eurobodalla that satisfy the farmland criteria in the LGA.
business Applies to all properties that are not identified as residential or farmland. Properties deemed “inactive” are excepted.
A differential loading is applied to commercial and industrial properties which contribute a greater share of the costs relating to:
• Tourismandeconomicdevelopment
• CBDamenitiesenhancingretail&tourism
• Additionalcleaning,maintenanceandconstructiontreatmentsrequired for road, traffic, drainage, toilet and street cleaning.
business (subcategory: inactive)Council places any properties that cannot be categorised as residential, business or farmland into the business inactive subcategory. Generally they are lands which have a restriction on their use or cannot be built on. This land will be rated at the same level as residential land.
Pensioner rebatesHolders of a pensioner concession card who own and occupy a rateable property are eligible for a pensioner concession. The LGA provides for a pensioner rebate of up to 50% of the aggregated ordinary rates and domestic waste management service charges, to a maximum of $250. They are also entitled to a maximum rebate of $87.50 for both water and sewer base charges at a total of $175.00 per annum.
Under the State’s existing mandatory Pensioner Concession Scheme, the State Government reimburses the Council 55% (up to $233.75 per property) of the pensioner concession. Council funds the remaining 45% (up to $191.25 per property). Eurobodalla has approximately 4,847 properties that receive a pensioner concession on their rates. Pensioner concessions are expected to total $1.9 million in 2016-17. The 55% pensioner subsidy received from the NSW Government will amount to approximately $1 million, leaving approximately $900,000 to be funded by Council and the community.
Charges on overdue accountsIn accordance with s566(3) of the Local Governmetn Act 1993, the Minister for Local Government determines the maximum rate of interest payable on overdue rates and charges each year. The applicable rate for 2016–17 will be the same as the 2015-16 interest rate which is 8% per annum. Council applies the same interest rate to other overdue debtor accounts. Details on the general fund can be found in the Budget section of this document.
rates income
Table 3.1 – Projected general rates income
CategoryRate
(cents in $)Base
charge ($)
% of Total income from base charge
No. of properties
No. of pensioners
Rateable value
($)
Gross yield
($)
Residential 0.2523 460.00 49.72 23,518 4847 4,335,141,665 21,860,195
Business 0.9572 460.00 13.92 1,233 - 366,420,895 4,074,560
Farmland 0.1897 460.00 32.24 283 - 144,191,920 403,712
Business inactive 0.2523 - - 10 - 536,940 1,354
Total 25,044 26,339,821
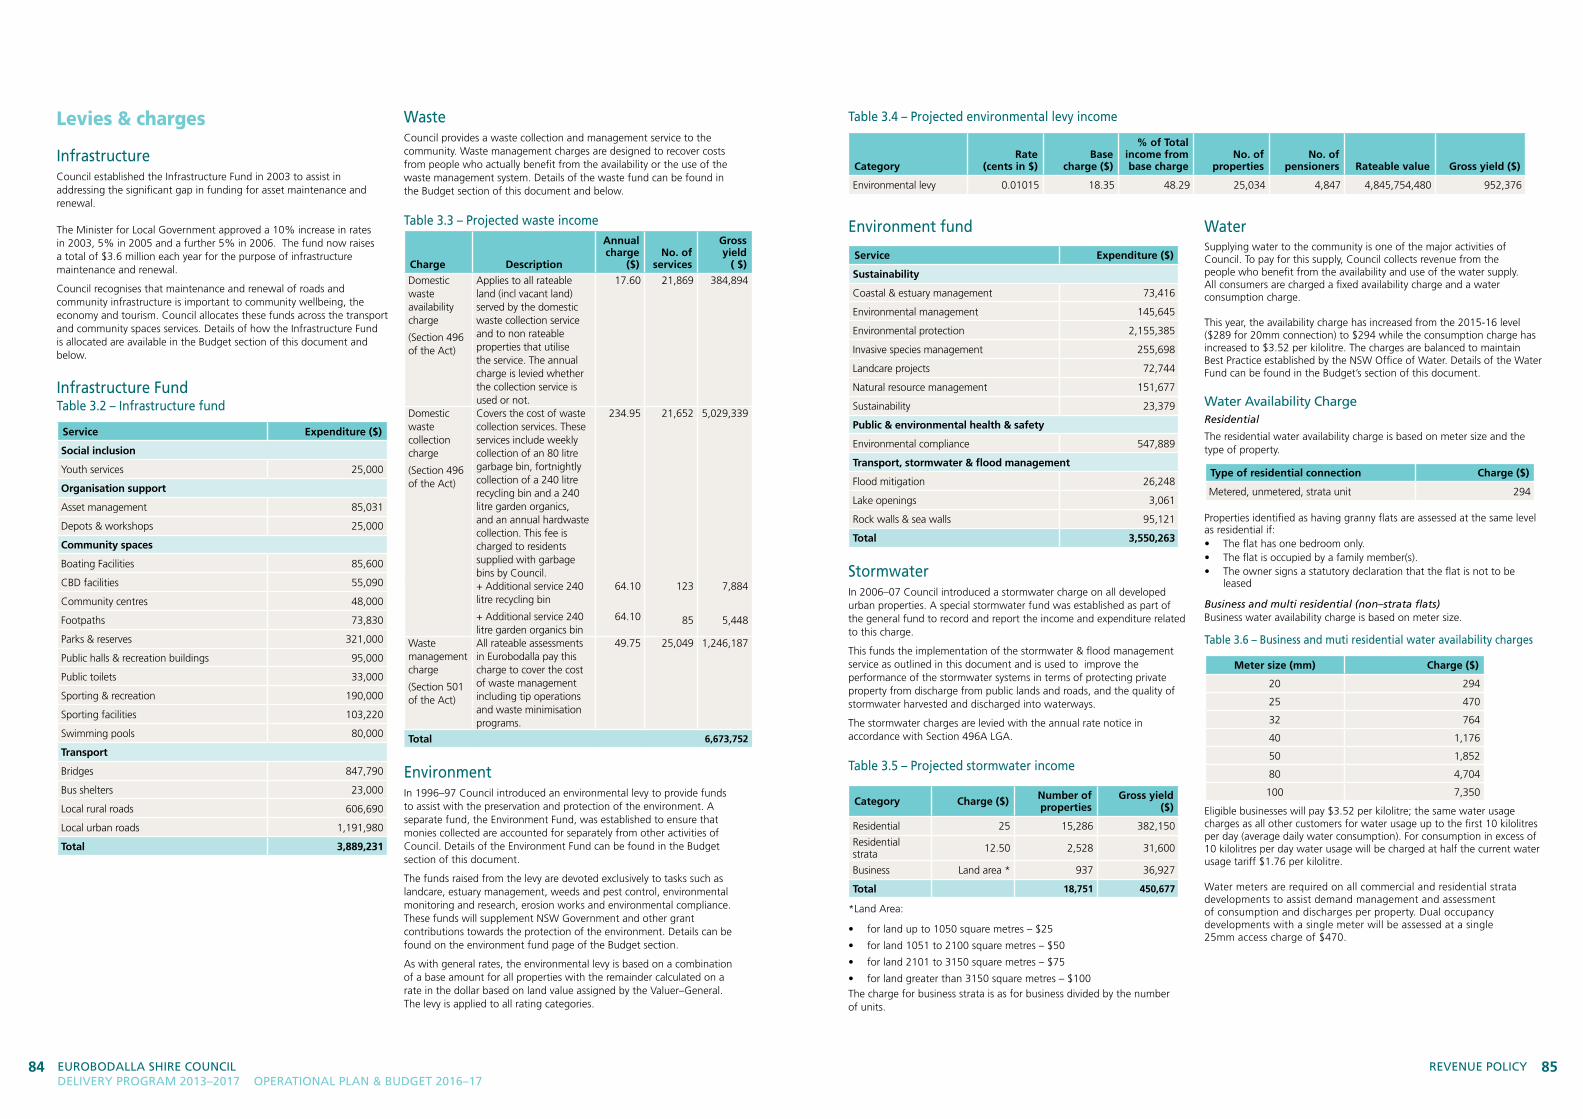
8584 EurobodaLLa ShirE CounCiL dELiVErY ProGraM 2013–2017 oPEraTionaL PLan & budGET 2016–17
Levies & charges
infrastructureCouncil established the Infrastructure Fund in 2003 to assist in addressing the significant gap in funding for asset maintenance and renewal. The Minister for Local Government approved a 10% increase in rates in 2003, 5% in 2005 and a further 5% in 2006. The fund now raises a total of $3.6 million each year for the purpose of infrastructure maintenance and renewal.
Council recognises that maintenance and renewal of roads and community infrastructure is important to community wellbeing, the economy and tourism. Council allocates these funds across the transport and community spaces services. Details of how the Infrastructure Fund is allocated are available in the Budget section of this document and below.
infrastructure Fund Table 3.2 – infrastructure fund
Service Expenditure ($)
Social inclusion
Youth services 25,000
Organisation support
Asset management 85,031
Depots & workshops 25,000
Community spaces
Boating Facilities 85,600
CBD facilities 55,090
Community centres 48,000
Footpaths 73,830
Parks & reserves 321,000
Public halls & recreation buildings 95,000
Public toilets 33,000
Sporting & recreation 190,000
Sporting facilities 103,220
Swimming pools 80,000
Transport
Bridges 847,790
Bus shelters 23,000
Local rural roads 606,690
Local urban roads 1,191,980
Total 3,889,231
WasteCouncil provides a waste collection and management service to the community. Waste management charges are designed to recover costs from people who actually benefit from the availability or the use of the waste management system. Details of the waste fund can be found in the Budget section of this document and below.
Table 3.3 – Projected waste income
Charge Description
Annual charge
($)No. of
services
Gross yield
( $)
Domestic waste availability charge
(Section 496 of the Act)
Applies to all rateable land (incl vacant land) served by the domestic waste collection service and to non rateable properties that utilise the service. The annual charge is levied whether the collection service is used or not.
17.60 21,869 384,894
Domestic waste collection charge
(Section 496 of the Act)
Covers the cost of waste collection services. These services include weekly collection of an 80 litre garbage bin, fortnightly collection of a 240 litre recycling bin and a 240 litre garden organics, and an annual hardwaste collection. This fee is charged to residents supplied with garbage bins by Council.
234.95 21,652 5,029,339
+ Additional service 240 litre recycling bin
+ Additional service 240 litre garden organics bin
64.10
64.10
123
85
7,884
5,448
Waste management charge
(Section 501 of the Act)
All rateable assessments in Eurobodalla pay this charge to cover the cost of waste management including tip operations and waste minimisation programs.
49.75 25,049 1,246,187
Total 6,673,752
EnvironmentIn 1996–97 Council introduced an environmental levy to provide funds to assist with the preservation and protection of the environment. A separate fund, the Environment Fund, was established to ensure that monies collected are accounted for separately from other activities of Council. Details of the Environment Fund can be found in the Budget section of this document.
The funds raised from the levy are devoted exclusively to tasks such as landcare, estuary management, weeds and pest control, environmental monitoring and research, erosion works and environmental compliance. These funds will supplement NSW Government and other grant contributions towards the protection of the environment. Details can be found on the environment fund page of the Budget section.
As with general rates, the environmental levy is based on a combination of a base amount for all properties with the remainder calculated on a rate in the dollar based on land value assigned by the Valuer–General. The levy is applied to all rating categories.
rEVEnuE PoLiCY
Environment fund
Service Expenditure ($)
Sustainability
Coastal & estuary management 73,416
Environmental management 145,645
Environmental protection 2,155,385
Invasive species management 255,698
Landcare projects 72,744
Natural resource management 151,677
Sustainability 23,379
Public & environmental health & safety
Environmental compliance 547,889
Transport, stormwater & flood management
Flood mitigation 26,248
Lake openings 3,061
Rock walls & sea walls 95,121
Total 3,550,263
Stormwater In 2006–07 Council introduced a stormwater charge on all developed urban properties. A special stormwater fund was established as part of the general fund to record and report the income and expenditure related to this charge.
This funds the implementation of the stormwater & flood management service as outlined in this document and is used to improve the performance of the stormwater systems in terms of protecting private property from discharge from public lands and roads, and the quality of stormwater harvested and discharged into waterways.
The stormwater charges are levied with the annual rate notice in accordance with Section 496A LGA.
Table 3.5 – Projected stormwater income
Category Charge ($) Number of properties
Gross yield ($)
Residential 25 15,286 382,150
Residential strata 12.50 2,528 31,600
Business Land area * 937 36,927
Total 18,751 450,677
*Land Area:
• forlandupto1050squaremetres–$25
• forland1051to2100squaremetres–$50
• forland2101to3150squaremetres–$75
• forlandgreaterthan3150squaremetres–$100The charge for business strata is as for business divided by the number of units.
WaterSupplying water to the community is one of the major activities of Council. To pay for this supply, Council collects revenue from the people who benefit from the availability and use of the water supply. All consumers are charged a fixed availability charge and a water consumption charge. This year, the availability charge has increased from the 2015-16 level ($289 for 20mm connection) to $294 while the consumption charge has increased to $3.52 per kilolitre. The charges are balanced to maintain Best Practice established by the NSW Office of Water. Details of the Water Fund can be found in the Budget’s section of this document. Water availability Charge Residential
The residential water availability charge is based on meter size and the type of property.
Type of residential connection Charge ($)
Metered, unmetered, strata unit 294
Properties identified as having granny flats are assessed at the same level as residential if:• Theflathasonebedroomonly.• Theflatisoccupiedbyafamilymember(s).• Theownersignsastatutorydeclarationthattheflatisnottobe
leased
Business and multi residential (non–strata flats) Business water availability charge is based on meter size.
Table 3.6 – business and muti residential water availability charges
Meter size (mm) Charge ($)
20 294
25 470
32 764
40 1,176
50 1,852
80 4,704
100 7,350
Eligible businesses will pay $3.52 per kilolitre; the same water usage charges as all other customers for water usage up to the first 10 kilolitres per day (average daily water consumption). For consumption in excess of 10 kilolitres per day water usage will be charged at half the current water usage tariff $1.76 per kilolitre. Water meters are required on all commercial and residential strata developments to assist demand management and assessment of consumption and discharges per property. Dual occupancy developments with a single meter will be assessed at a single 25mm access charge of $470.
Table 3.4 – Projected environmental levy income
CategoryRate
(cents in $)Base
charge ($)
% of Total income from base charge
No. of properties
No. of pensioners Rateable value Gross yield ($)
Environmental levy 0.01015 18.35 48.29 25,034 4,847 4,845,754,480 952,376

8786 EurobodaLLa ShirE CounCiL dELiVErY ProGraM 2013–2017 oPEraTionaL PLan & budGET 2016–17
Water consumption charge• All water consumed will be charged for by volume at $3.52 per
kilolitre from the July 2016 reading. • Aservicefeeof$10willapplytoallaccountswithconsumption
between 0 and 2 kilolitres. • Waterusagefeesarechargedthreetimeseachyearbasedonmeter
readings undertaken in July / August, November / December and March / April and bills are issued in the following month.
SewerCouncil is responsible for the sewerage services within Eurobodalla. Sewerage charges collect revenue from the people who actually benefit from the availability or use of Council’s sewerage system. Details of the sewer fund can be found in the Budget section of this document.
Residential
Residential properties pay an access fee based on the size of the water connection. The proposed rate for 2016-17 is $902.
Table 3.8 – Sewer residential charges
Charge Residential ($)
General service – metered, unmetered, strata unit 902
Turlinjah general service (85%) 766
Dual occupancy developments with a single meter will be assessed at a single 25mm availability charge of $1,443. Properties identified as granny flats are assessed at the same level as residential if:
• Theflathasonebedroomonly
• Theflatisoccupiedbyafamilymember(s)
• Theownersigningastatutorydeclarationthattheflatisnot to be leased.
Business & multi residential (non–strata flats)
Since 2009–10, business properties are charged depending on the type of business, water meter size and the usage. This ‘two part tariff’ is required under the State Government Best Practice Guidelines.
Depending on the type of business, properties are charged a usage fee relevant to the ratio of the estimated volume discharged into the sewer system. The sewerage discharge factor is the ratio of the estimated volume of sewerage discharged into the sewerage system to the customer’s total water consumption. This fee will be sent three times a year following meter readings on the same account as the water usage and trade waste usage fees. The business sewer usage charge for 2016-17 will be $1.78 per kilolitre.
Sewer access charges are proposed to increase in 2016-17 from $886 for a single 20mm connection to $902 and for larger meters the fees will rise by a proportional amount. Business and Multi Residential properties will be levied charges based on water meter size. As the meter size increases the availability charge increases to reflect Council’s costs in providing for larger capabilities of discharge.
Multi residential is defined as properties with more than a single dwelling. They include flats and dual occupancy developments but exclude strata units.
Table 3.9 – Water meter size, availability and charges
Water meter size (mm) Availability factor Charge ($)
20 1.0 902
25 1.6 1,443
32 2.6 2,34540 4.0 3,60850 6.3 5,682
80 16.0 14,432
100 25.0 22,550
Vacant 1.0 902
Strata 1.0 902
Special sewer chargesSpecial sewer charges were introduced for Bodalla urban residential and business areas at the rate of $200 per assessment in 2008–09 in order to contribute toward the cost of survey investigation and design. It was planned that once commissioned, the full sewer charge would be introduced.
Table 3.10 Special sewer charges expected income
Category Sewer Charge ($)
No of
Properties
No of
Pensioners
Gross
Yield $
Residential general service 902 18,282 4148 16,728,132
Bodalla sewer 200 164 - 32,800
Business Meter size 1,125 - 2,338,804
Business Trade waste 440 - 100,000
Total yield 19,199,736
Liquid trade waste chargesCouncil applies an annual charge to all commercial/industrial properties capable of discharge of liquid trade waste into sewer. This fee covers the cost of annual inspection or audit. A re–inspection fee may apply.
Liquid trade waste discharge fee
Depending on the type of business listed on the schedule, properties are charged a usage fee discounted by a discharge factor. The liquid trade waste discharge factor is the ratio of the volume of liquid trade waste discharged into the sewerage system divided by the volume of water consumed. This fee is calculated on whether the discharger applies pre–treatment (such as removal of grease, oils, sediment, etc) prior to discharge. This fee is sent three times a year following meter readings on the same account as the water usage fee.
Table 3.7 – Projected water consumption income
Category Access charge Consumption charge(S) No of properties No of pensioners Gross yield ($)
Residential Meter size 3.52 20,047 4,313 13,521,866
Business Meter size 3.52 983 – 2,701,206
Total 16,223,072
rEVEnuE PoLiCY
Table 3.11 Liquid trade waste charges
Liquid trade waste annual fee $96.20
Liquid trade waste annual fee (large discharger) $516.00
Compliant discharge $1.42/KlNon-compliant discharge (failure to comply with Council’s conditions of approval)
$13.25/Kl
Based on the type and quality of discharge and extent of pre–treatment prior to entering the sewer, ‘excess mass charges’ may also apply. For more information refer to Council’s Liquid Trade Waste Policy at www.esc.nsw.gov.au
Pricing methodologyAll of Council’s fees and charges that are not subject to statutory control are reviewed on an annual basis prior to finalisation of Council’s annual operating budget.
The pricing principles recognise a ‘community service obligation’ where full recovery of costs through fees may make some services or facilities ‘financially out of reach’ to some members of the community as well as the importance to appropriately account for expenses (environment, social and financial) to price services and products correctly.
Council’s Pricing Policy generally supports the cost recovery philosophy. It recognises people’s ability to pay and balances an expectation that some services will be cross subsidised from rates for the common good of the community. Pricing will:
• Explorecostrecoveryopportunities
• Ensurevalueformoneybyprovidingeffectiveandefficientservice
• Balanceratesandgrantsagainstotherfundingsources
• Managefinancialriskinavolatileclimate
• Ensurethatdebtfinancingislimitedtoworksofacapitalnatureandthat the total debt is limited to ensure long–term financial stability
• Developpricingstructuresthatcanbeadministeredsimplyandcheaply and be understood by the public
• Developpricingstructuresthatreflectreallifecycleandenvironmentalcosts
• Recognisepricingencouragesordiscouragesconsumeruseandbehaviours
Council’s Pricing Policy and full range of Council Fees and Charges for 2016-17 are available in the separate Fees and Charges document.
Debt recoveryCommercial debt recovery procedures will be pursued in order to minimize the impact of outstanding debts on Council’s financial position. Council will adhere to ethical guidelines in respect of debt recovery procedures. Debtors will be advised of the likely additional legal costs prior to the issue of any summons. Land may be sold, with Council approval, where rates or other property debt arrears are greater than the land value of the property or rates are in arrears for five years.
Private works orders must be signed and authorized by the responsible paying person/property owner, prior to those works commencing. In some circumstances, deposits or guarantees will be required. Credit checks will also be undertaken.

89Eurobodalla ShirE CounCil dEliVErY ProGraM 2013–2017 oPEraTional Plan & budGET 2016–17
88
Borrowings Loans are borrowed for major projects for a term equivalent to the life of the asset (usually not greater than 30 years). Where grants are available and may allow construction of an asset sooner, then loans are used to attract or match that grant.
Loans allow us to spread the cost of the asset over the length of the loan period, ensuring that both current and future generations contribute to paying for the asset. This is in accordance with the inter–generational equity principle.
Council avoids borrowing for the annual recurring cost of asset renewals.
All loans are financed from an approved financial institution that offers the most competitive interest rate. For more information refer to Council’s Borrowing Management Policy at www.esc.nsw.gov.au
Table 3.12: Statement of proposed borrowings by fund
Purpose 2016–17
New loans
General fund
Bridges 1,105,455
Road infrastructure 2,300,612
Airport 4,946
Streetscaping & foreshore works 1,981,434
Open space land & recreational facilities 1,767,743
Council administration building -
Boatramps, wharves, jetties and rockwalls 277,422
Other 490,165
General fund Sub–total 7,927,776
*Waste fund 1,757,000
*Sewer fund 4,400,000
*Water fund -
All funds total new loans 14,084,776
Renewal loans
General fund 1,782,684
Waste fund -
Sewer fund 839,335
Water fund -
All funds total renewal loans 2,622,019
All funds grand total all loans 16,706,795
*Please refer to detailed capital plan for additional information.
Accounting policies and notes1) Policies are generally as stated in the audited financial accounts.
2) Sale of assets; the gross value of sales is disclosed in the statement of fund flows. The “carrying value” of assets sold is assumed to be equal to the sale value.
3) Depreciation is forecast based on existing assets, works in progress and proposed purchases/construction.
4) Borrowing may be substituted with other funding sources if available at the time.
5) Capital Grants & contributions exclude the estimated value of non-cash assets contributed by developers.
6) Costs exclude net present value of future remediation of landfills and the like.
7) Investment revenues are based on estimated cash/fund flow actually realised.
rEVEnuE PoLiCY
23,518 rateable residential properties
Rating categorisation mapsCouncil is required to have available for inspection, maps showing those parts of Eurobodalla to which each category and sub-category of the ordinary rate and each special rate applies. These maps are available by request at Council’s Customer Service Centre in Moruya.
Rate samplesCouncil also prepares rate samples for a range of rating categories and areas across Eurobodalla which show the potential rating impact for residents. These rating samples are available by request at Council’s Customer Service Centre in Moruya.
283 rateable farmland properties
To provide feedback on any of the documents or for further information on process or content, please contact Council on (02) 4474 1000 or [email protected]

Eurobodalla ShirE CounCil dEliVErY ProGraM 2013–2017 oPEraTional Plan & budGET 2016–17
90
Key for responsible officer codes
Code Responsible officer
APC Assets Planning Coordinator
CPC Community Planning Coordinator
CAC Coordinator Arts & Culture
DCARS Director Community, Arts & Recreation
DFBD Director Finance & Business Development
DIS Director Infrastructure Services
DPSS Director Planning & Sustainability
DMBDE Divisional Manager Business Development & Events
DMCARDS Divisional Manager Community Arts & Recreation Development
DMDS Divisional Manager Development Services
DMES Divisional Manager Environmental Services
DMF Divisional Manager Finance
DMGI Divisional Manager Governance & Information
DMOD Divisional Manager Organisation Development
DMSS Divisional Manager Strategic Services
DMTS Divisional Manager Technical Services
DMWM Divisional Manager Waste
DMWS Divisional Manager Water & Sewer
DMW Divisional Manager Works
EA Executive assistant
EMCT Executive Manager Communications & Tourism
GM General Manager
LC Library Coordinator
MCC Manager Community Care
RSO Road Safety Officer
SRPO Service review project officer
SSE Support Services Engineer