Delivering - AnnualReports.co.uk...Selling generic products across the US Generics $135.1m +27.8%...
136
Hikma Pharmaceuticals PLC Annual report 2009 Delivering...
Transcript of Delivering - AnnualReports.co.uk...Selling generic products across the US Generics $135.1m +27.8%...

Hikma Pharmaceuticals PLC 13 Hanover Square London W1S 1 HW UK
www.hikma.com
Hikma Pharmaceuticals PLC Annual report 2009
Hikm
a Pharm
aceuticals PLC
Annual report 2009
Delivering...

For more information visit our website
www.hikma.com
Hikma Pharmaceuticals PLC Since Hikma was founded, we have grown into
a successful multinational pharmaceutical group. Our business today is diverse in its product line
and the breadth of its geographic coverage. This diversification will ensure that we maintain
our track record of strong growth
About this annual report
Produced and designed by Radley Yeldar www.ry.com
This report is printed on “Look!” paper. This paper is made from virgin wood fibre from well-managed forests independently certified according to the rules of
the Forest Stewardship Council (FSC). It is manufactured at a mill that is certified to ISO14001 and EMAS environmental standards. The mill uses pulps that are totally chlorine
free (TCF), and some pulp is bleached using an elemental chlorine fee (ECF) process. The inks in printing this report are all vegetable-based.
Printed at St Ives Westerham Press Ltd, ISO14001, FSC certified and CarbonNeutral®
01
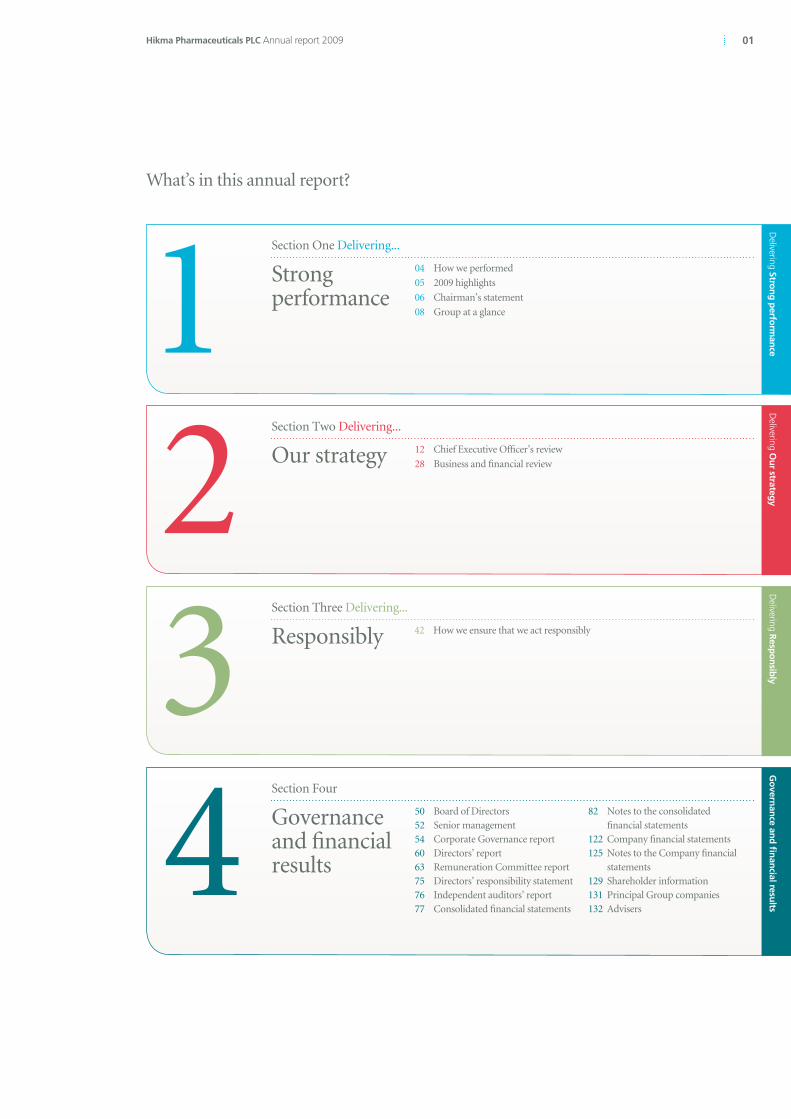
What’s in this annual report?
Hikma Pharmaceuticals PLC Annual report 2009
Delivering Strong perform
anceD
elivering Our strategy
Delivering Responsibly
Governance and fi
nancial results
Section Two Delivering...
Our strategy 12 Chief Executive Officer’s review
28 Business and financial review
Section Three Delivering...
Responsibly 42 How we ensure that we act responsibly
Section Four
Governance and financial results
50 Board of Directors52 Senior management54 Corporate Governance report60 Directors’ report63 Remuneration Committee report75 Directors’ responsibility statement76 Independent auditors’ report77 Consolidated financial statements
82 Notes to the consolidated financial statements
122 Company financial statements125 Notes to the Company financial
statements129 Shareholder information131 Principal Group companies132 Advisers
Section One Delivering...
Strong performance
04 How we performed
05 2009 highlights
06 Chairman’s statement
08 Group at a glance1234

02 Hikma Pharmaceuticals PLC Annual report 200902 Hikma Pharmaceuticals PLC Annual report 2009
03
Delivering Strong perform
ance
1Section One
Delivering strong performance
04 How we performed
05 2009 highlights
06Chairman’s statement
08 Group at a glance
03
Delivering Strong perform
ance
1

Hikma Pharmaceuticals PLC Annual report 200904
In 2009, Hikma significantly outpaced the slowing global healthcare market and, despite
difficult worldwide economic conditions, achieved record results demonstrating the strength of
our diversified business
How we performed
2009 revenue
$637 million
Revenue CAGR 2004–09
+24.6%
2009 operating margin
16.8%
Products marketed
382
2009 operating cash flow
$119 million
2009 employees
4,880
2009 revenues by region
MENA* 63.5%
US 24.0%
Europe and RoW 12.5%
2009 revenues by segment
Branded 55.4%
Injectables 22.6%
Generics 21.2%
* Middle East and North Africa region (“MENA”).
05
Delivering Strong perform
ance
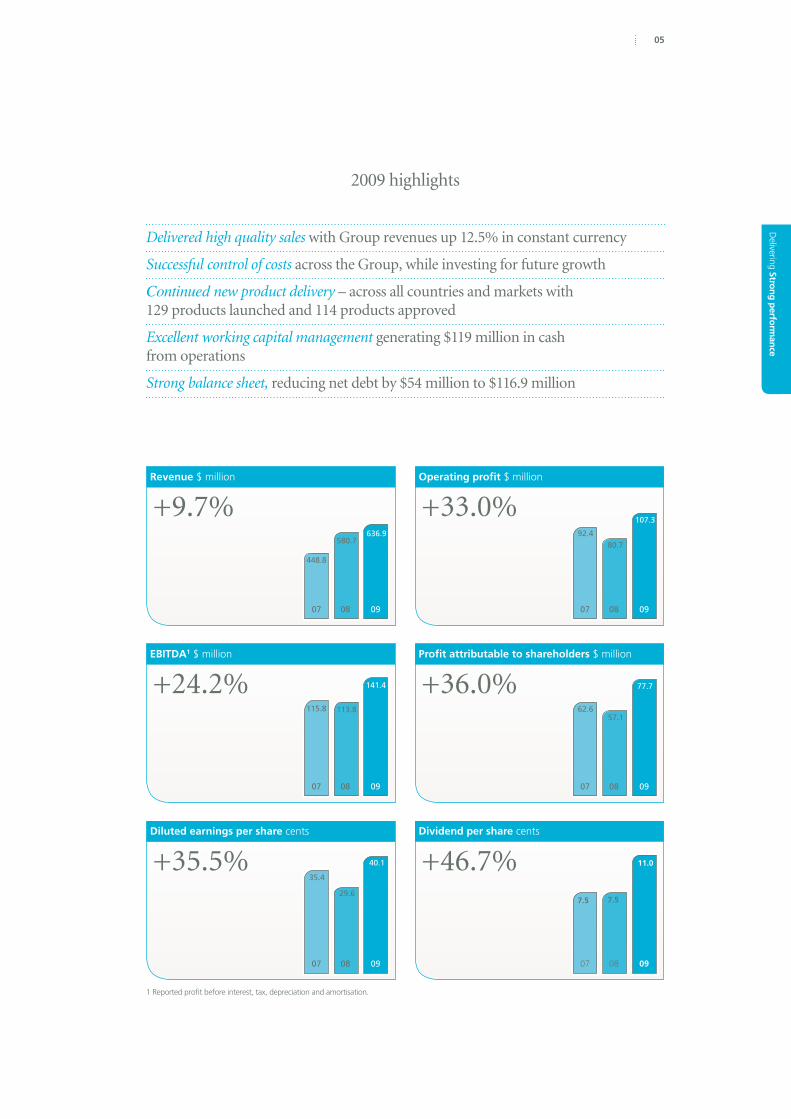
Delivered high quality sales with Group revenues up 12.5% in constant currency
Successful control of costs across the Group, while investing for future growth
Continued new product delivery – across all countries and markets with 129 products launched and 114 products approved
Excellent working capital management generating $119 million in cash from operations
Strong balance sheet, reducing net debt by $54 million to $116.9 million
2009 highlights
Revenue $ million
448.8
580.7636.9
07 08 09
+9.7%Operating profit $ million
92.480.7
107.3
07 08 09
+33.0%
EBITDA1 $ million
115.8 113.8
141.4+24.2%
07 08 09
Profit attributable to shareholders $ million
62.657.1
77.7
07 08 09
+36.0%
Dividend per share cents
7.5 7.5
11.0
07 08 09
+46.7%Diluted earnings per share cents
35.4
29.6
40.1
07 08 09
+35.5%
1 Reported profit before interest, tax, depreciation and amortisation.
06 Hikma Pharmaceuticals PLC Annual report 2009
Hikma has once again delivered an outstanding performance. We have focused on integrity, high quality
sales and cost management across all areas of our diversified business model, achieving record sales of
$637 million and 36% growth in net income
Chairman’s statement
Branded Our businesses in the Middle East and North Africa (“MENA”) region continued to grow ahead of the underlying markets, reinforcing our position as the leading regional pharmaceutical manufacturer.
Injectables While revenues in our global Injectables business were down slightly compared to 2008, we expect that during 2010 this business will return to the growth profile it previously enjoyed. We continue to make good progress in implementing our oncology strategy, and saw Hikma’s first oncology products launched in the MENA region during the second half of the year.
GenericsOur US Generics business had an excellent year, achieving record sales and an impressive return to profitability as our new US management team implemented strategic and operational changes. The competitive environment remained challenging in the US but reduced competition in certain product lines helped the recovery of this business, enabling us to maximise our opportunities and increase our market share in key products.
Quality Underlying all of our achievements in 2009 was our continued commitment to quality and integrity. We continue to adhere to the highest quality and
ethical standards across all of our operating units and believe these are essential to delivering long‑term shareholder value.
DividendThe Board is recommending a final dividend of 6.5 cents per share (approximately 4.3 pence per share), which will make a dividend for the full year of 11.0 cents per share, an increase of 47% on 2008. The proposed final dividend will be paid on 27 May 2010 to shareholders on the register on 16 April 2010, subject to approval by shareholders at the Annual General Meeting.
Balance sheet developmentsOur focus on working capital management during the year has delivered excellent results. Significantly higher operating cash flow has materially lowered our net debt compared to 2008, strengthening our balance sheet and giving us financial flexibility to pursue future growth opportunities.
Shareholder valueFrom the Company’s listing in October 2005 through the end of 2009, we have delivered a total shareholder return of 87.5%. We are delighted with this performance, which exceeds that of the FTSE 250 index and the FTSE Pharmaceuticals index, which grew by 32.5% and 17.7%, respectively, over the same period.

07
Delivering Strong perform
ance
OutlookHikma should continue to benefit from the overall pharmaceutical market growth in the MENA region, which we expect to remain higher than the global pharmaceutical market. Our share of the MENA market should also continue to increase as we further penetrate into existing markets, expand into new markets and grow our portfolio of own‑brand and in‑licensed products. There also remains considerable scope for us to grow our global Injectables business following the significant investments we have
made in portfolio development, sales and marketing and manufacturing capacity.
Our US Generics business is on a strong footing and we are confident that we can maintain the positive momentum we have created in this business. Overall for the Group we expect to deliver Group sales growth in the low‑teens in 2010 and expect gross margin to be broadly in line with the improved gross margin we achieved in 2009.
Going forwardIn summary, I am confident of the Company’s prospects for this year and for the years to come. This confidence is based on the diversity of our business model and the strength of each of our core businesses within it.
Samih Darwazah Non-Executive Chairman
Hikma Pharmaceuticals PLC
FTSE 250
FTSE 350/Pharmaceuticals & Biotechnology
Nov 05-40
-20
0
20
80
60
40
100
May 06 May 07Nov 06 Nov 07 May 08 Nov 08 May 09 Nov 09
Hikma’s total shareholder return since IPO
10
Source: Factset.

08 Hikma Pharmaceuticals PLC Annual report 2009
Group at a glance
Key:
Manufacturing
R&D plants
17th largest generic company in the US market
Focus on quality sales and high service levels
Quality is increasingly a key competitive advantage
Leveraging our efficient and lower cost manufacturing facilities in MENA
49 products in 108 dosage strengths and forms
Geographical area: US
Top products:
Amoxicillin
Cefaclor
Digoxin
Doxycycline
Isosorbide Mononitrate
Selling generic products across the US
Generics
$135.1m+27.8%
2009 Revenue
We develop, manufacture and market generic and in-licensed pharmaceutical products within three core
businesses. Our operations span 49 countries and focus on key therapeutic areas such as anti‑infectives,
cardiovascular, alimentary tract and CNS
09
Delivering Strong perform
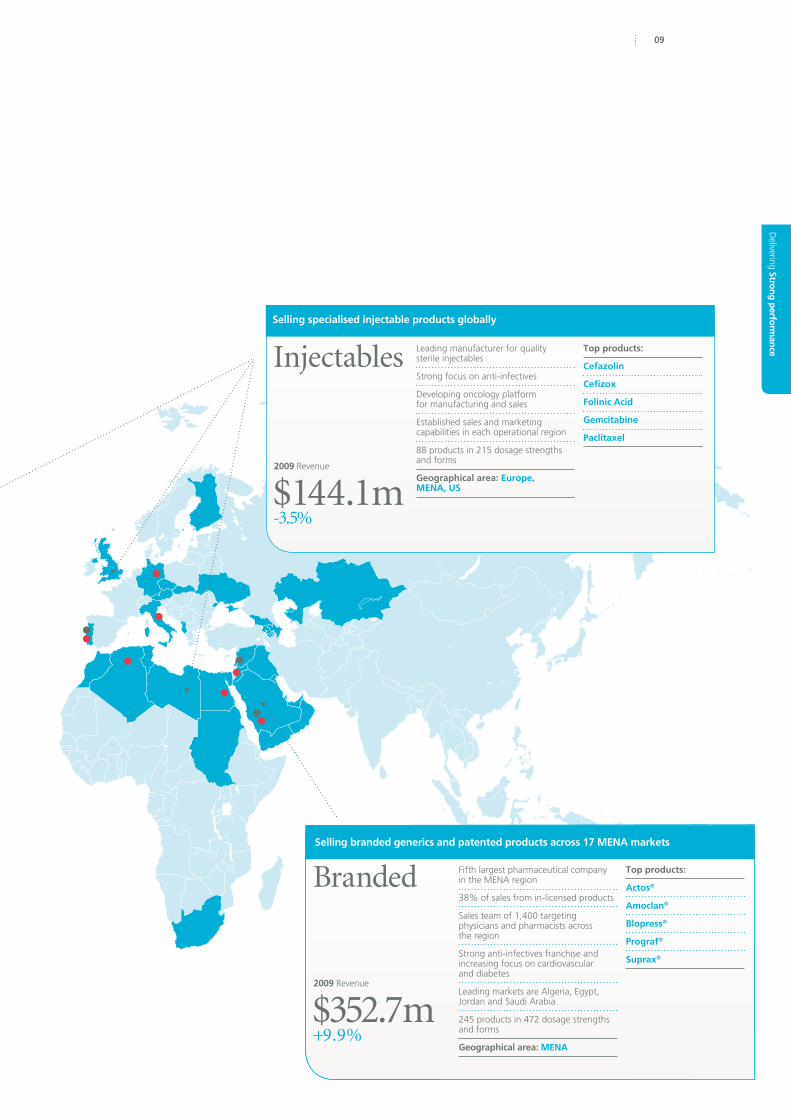
anceInjectables Top products:
Cefazolin
Cefizox
Folinic Acid
Gemcitabine
Paclitaxel
Leading manufacturer for quality sterile injectables
Strong focus on anti‑infectives
Developing oncology platform for manufacturing and sales
Established sales and marketing capabilities in each operational region
88 products in 215 dosage strengths and forms
Geographical area: Europe, MENA, US
Selling specialised injectable products globally
$144.1m ‑3.5%
2009 Revenue
Branded
Fifth largest pharmaceutical company in the MENA region
38% of sales from in‑licensed products
Sales team of 1,400 targeting physicians and pharmacists across the region
Strong anti‑infectives franchise and increasing focus on cardiovascular and diabetes
Leading markets are Algeria, Egypt, Jordan and Saudi Arabia
245 products in 472 dosage strengths and forms
Geographical area: MENA
Top products:
Actos®
Amoclan®
Blopress®
Prograf®
Suprax®
Selling branded generics and patented products across 17 MENA markets
$352.7m+9.9%
2009 Revenue

10 Hikma Pharmaceuticals PLC Annual report 2009

Delivering O
ur strategy
Section Two
Delivering our strategy
2
11
12 Chief Executive Officer’s review
28 Business and financial review

12 Hikma Pharmaceuticals PLC Annual report 2009
Strengthening our leading position in the MENA regionOur position as the leading regional pharmaceutical company in the MENA region remains solidly in place. We continue to increase our market share across the region as a whole – expanding our product portfolio in growing therapeutic areas and penetrating further into new markets, while maintaining our strong position in the field of anti-infectives. In rapidly changing markets like Algeria, we have demonstrated our ability to turn obstacles into opportunities – delivering a strong performance relative to other players in this market. Increasingly we are benefiting from the acquisitions of Hikma Egypt and Arab Pharmaceutical Manufacturing (“APM”) – which are now well integrated into the Hikma Group.
Developing our global product range in growing therapeutic areasOur product portfolio continues to grow with 24 new compounds and 47 new dosage strengths and forms marketed and sold this year. A further 114 approvals across all regions and markets ensures that we will maintain a steady stream of new product launches in 2010. Our portfolio also continues to develop in new therapeutic areas, with new launches in oncology, CNS, diabetes and respiratory.
Extending our reach and diversity through partnershipsWe continue to deliver a strong performance from our in-licensed products, which grew by 25% in 2009, reinforcing our position as the licensing partner of choice in the MENA region. We signed three new licensing agreements during the year that will bring four new products into our portfolio over the coming years and will strengthen our product offering in key therapeutic areas. Using our local manufacturing capabilities, we will be able to introduce these products into multiple markets simultaneously across the MENA region.
Increasing the scale of our speciality Injectables businessOur efforts to build scale in our global Injectables business continue, with 16 products launched across our markets in 2009 and continued investment in sales and marketing. The 41 approvals received across all regions and geographies in 2009 will help to deliver growth in 2010.
Leveraging our expertise and capacity in the US marketDuring 2009 a considerable effort went into continuing the turnaround of our operations in the US, with outstanding results for the full year. The performance of the Generics business in the US has exceeded our expectations and I am confident that the operational issues we have faced in the past are well behind us. We have refocused the business on providing higher service levels and we
2009 has been a very successful year for Hikma in which we have made excellent progress towards
achieving our strategic objectives
Chief Executive Officer’s review
Delivering O
ur strategy
13
are successfully utilising our high quality, lower cost MENA manufacturing facilities in the US market. Through well-coordinated and collaborative efforts, our teams in the US, Jordan and Saudi Arabia have delivered excellent results, significantly increasing sales of our global products.
Maintaining our world class manufacturing capabilitiesI am extremely proud of our manufacturing and regulatory personnel, whose teamwork and commitment to the highest quality standards really paid off this year. Our plant in Portugal passed its FDA inspection this autumn with no observations, demonstrating the true excellence of the Group regulatory team. This teamwork and commitment to excellence was reinforced in January 2010, when our Jordanian facility (which includes a general formulation plant, a penicillin plant, and a chemical plant) also
passed its FDA inspection, again with no observations.
Quality is proving to be a key differentiating factor and our investment in and commitment to quality continues to deliver results.
Implementing our new organisational structureTo achieve our growth ambitions, we must have the right personnel and systems to support them in place. Thus, during 2009, we implemented a new organisational structure, which was sufficiently established to contribute to the year’s success. The new structure created corporate-level marketing, operational, HR and business development functions designed to improve the efficiency of our activities across the Group. I am confident that the new structure will enable us to focus on efficiency and deliver on our strategic objectives going forward.
Through our new corporate HR function we are implementing fundamental processes that will help us to recruit, develop, retain, engage and manage our people, thereby supporting our short and long-term strategic business objectives.
I am confident that the new structure will enable us to devote an even higher focus on efficiency and quality in all of our operations, thereby enabling us to deliver on our strategic objectives going forward.
Our strategy for growth
Said Darwazah Chief Executive Officer
Strengthen our leading position in the MENA region
lExtend our reach and diversity as a partner of choice in the MENA region
%%%%%%
Increase the scale of our speciality Injectables business
Leverage our expertise and capacity in the US market
Build on our world-class manufacturing and API sourcing capabilities
„„„
Develop our global product range in growing therapeutic areas

14 Hikma Pharmaceuticals PLC Annual report 2009
Chief Executive Officer’s review continued
Strong results in 2009All of these efforts have enabled us to achieve 36% net income growth for the Group in 2009. In the context of the difficult economic environment, these results are truly impressive and demonstrate the strength of our diversified business model, our dedicated efforts to improve efficiency and the hard work of the Hikma teams around the world.
Looking aheadLooking forward to 2010 and beyond, we still have much work to do. We will be implementing the following key initiatives to help us deliver continued operational excellence and strong financial results.
Improving efficiency continues to be a high priorityBecause of the value to be generated, we continue to challenge and engage every person in the Group to innovate for efficiency while maintaining quality. Maximising plant utilisation, lowering overheads, reducing inventories, better cash collection – these are just some of the areas where our people are committed to creating value. There is always scope to do what we do better – and every little bit helps.
Top 10 MENA companies in 2009
RankValue
$mGrowth
%Market share
%
MENA private market 8,028 +10.0 100.0
Sanofi-Aventis 1 769 –2.6 9.6
GlaxoSmithKline 2 619 +13.0 7.7
Pfizer 3 465 +4.5 5.8
Novartis 4 442 +5.5 5.5
Hikma 5 294 +12.4 3.7
Merck & Co 6 231 +3.1 2.9
Spimaco 7 198 +11.6 2.5
AstraZeneca 8 177 +24.0 2.2
Bayer 9 167 +3.7 2.1
Pharco 10 138 +14.1 1.7
All market data sourced from IMS Health, MAT December 2009. Figures reflect private retail sales in Algeria, Jordan, Kuwait, Egypt, Tunisia, Morocco, UAE, Lebanon and Saudi Arabia.
15
Delivering O
ur strategy
Centres of excellence in manufacturing will enhance our global product range Global products are integral to our growth strategy. Developing and strengthening our global product range is essential. Through the creation of manufacturing centres of excellence, we have a significant opportunity to grow sales and improve margins by better utilising our manufacturing facilities across the Group. In our Injectables business we are already doing this – we manufacture in Portugal and sell across the US, Europe and MENA. Our oral cephalosporins, which are produced in Saudi Arabia and sold across the MENA region and also in the US, are another good example. Yet numerous other opportunities remain. 2010 will see the launch of our oncology products in the MENA region and continuing efforts to prepare our oncology manufacturing plant in Germany for the manufacture of FDA approved products. We expect to leverage further our cephalosporin plant in Saudi Arabia and our penicillin and general formulation plants in Jordan to produce not just for MENA but also for the US and, in some cases, Europe.
Strengthening Group communicationsImproving communication across the Group is also critical. Strong communication and excellent teamwork paid off in 2009 from a regulatory perspective. The US turnaround was also made easier by the well coordinated efforts of the US, Jordanian and Saudi teams previously mentioned. Facilitating communication across departments and geographies in our rapidly expanding Group will remain a priority.
Growing through acquisitionsWe remain very ambitious for the longer-term prospects for the Group and we have an excellent track record for making successful acquisitions and integrating them swiftly. Acquisitions in the MENA region remain a priority – both to enter new markets and develop our position in existing markets. We will also continue to look for opportunities in Europe, the US and Asia, particularly when it comes to acquiring new global products and new technologies.
Developing new partnershipsOur commitment to developing our in-licensed portfolio remains very much intact. We believe that we remain the clear partner of choice in the MENA region for licensing opportunities, as the recent additions to our in-licensed portfolio demonstrate.
Investing in our peopleAs a company we have always been committed to developing our people. As the Group grows, this is increasingly important. We will continue to challenge ourselves to improve and commit to providing the opportunities necessary for our teams to develop. Striving to make Hikma the employer of choice will ensure we retain the skills required to take our business forward.
Going forwardI am very excited by the opportunities we have to expand our business in 2010 and beyond.
Said Darwazah Chief Executive Officer
16 Hikma Pharmaceuticals PLC Annual report 2009
DELIvErING OUr StrAtEGy
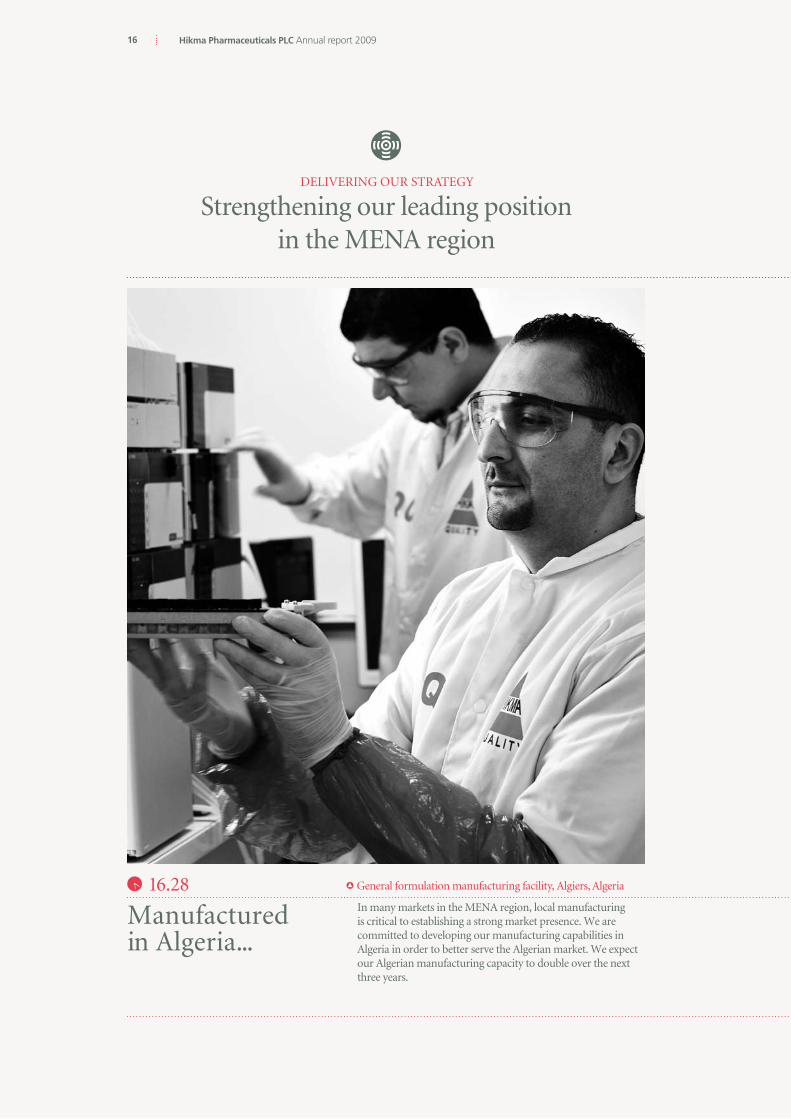
Strengthening our leading position in the MENA region
l
9 General formulation manufacturing facility, Algiers, Algeria
In many markets in the MENA region, local manufacturing is critical to establishing a strong market presence. We are committed to developing our manufacturing capabilities in Algeria in order to better serve the Algerian market. We expect our Algerian manufacturing capacity to double over the next three years.
Manufactured in Algeria...
16.28

17
9 Patients in Algeria are benefiting from our locally produced products
We worked hard in 2009 to build our market share in Algeria, particularly in the important cardiovascular and metabolic therapeutic areas. Making a wide range of high quality products available to patients in Algeria is also a key priority. three new products were launched in Algeria in 2009.
... Administered in Algeria
13.28

18 Hikma Pharmaceuticals PLC Annual report 2009
DELIvErING OUr StrAtEGy
Developing our global product range in growing therapeutic areas
9 Oncology manufacturing facility, vienenburg, Germany
We made excellent progress in the development of our oncology business in 2009. We are now producing four of our own oncology products at our cytotoxic manufacturing facility in Germany. this facility has been inspected by health authorities from across Europe and the MENA region and we are working hard to prepare the facilities for production for the US market.
Manufactured in Germany...
06.57

19
9 Hikma is making cancer treatment more accessible to patients in Jordan
Following the initial launch of our injectable oncology products in Jordan and yemen in the second half of 2009, patients in the Middle East now have access to our high quality generic oncology products. We have an excellent opportunity to build a leading oncology business in the MENA region and plan a further four oncology launches in 2010.
... Administered in Jordan
09.57
20 Hikma Pharmaceuticals PLC Annual report 2009
DELIvErING OUr StrAtEGy
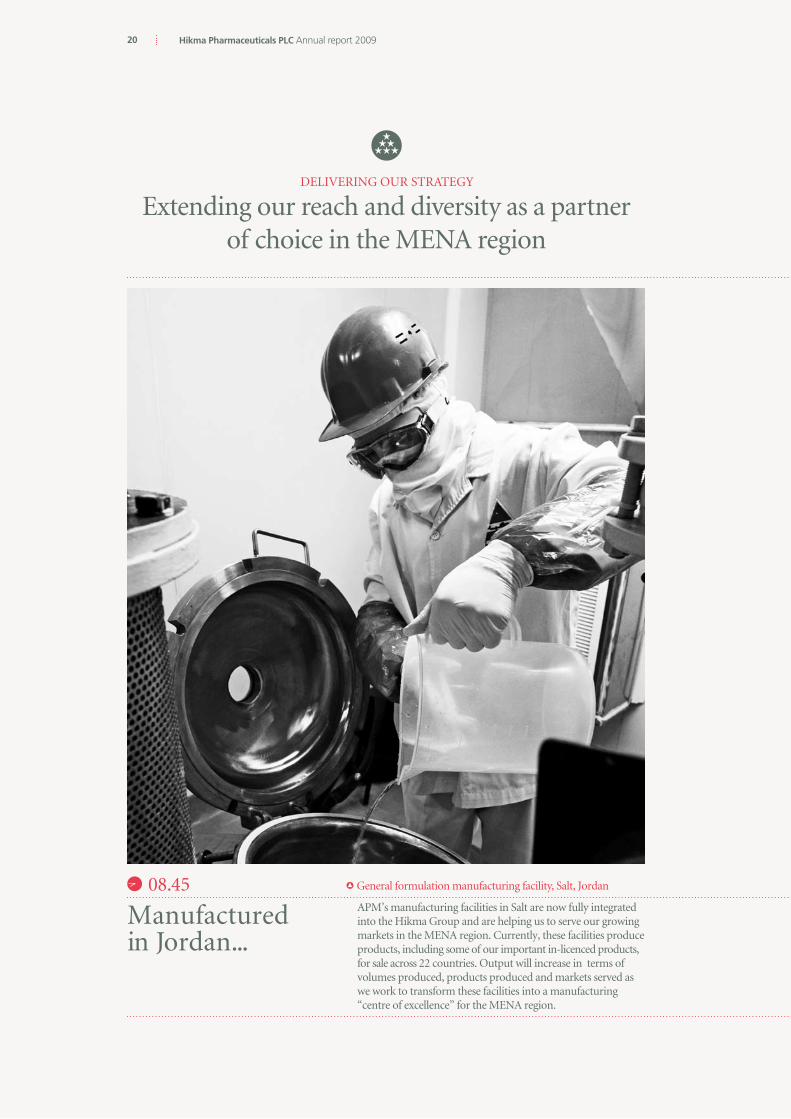
Extending our reach and diversity as a partner of choice in the MENA region
%%%%%%
9 General formulation manufacturing facility, Salt, Jordan
APM’s manufacturing facilities in Salt are now fully integrated into the Hikma Group and are helping us to serve our growing markets in the MENA region. Currently, these facilities produce products, including some of our important in-licenced products, for sale across 22 countries. Output will increase in terms of volumes produced, products produced and markets served as we work to transform these facilities into a manufacturing “centre of excellence” for the MENA region.
Manufactured in Jordan...
08.45

21
9 Actos®, the leading type 2 diabetes treatment, is now available to patients in Egypt
As our product portfolio grows, we are enhancing the range of high quality and affordable products available to patients across the MENA region. In 2009, our product offering expanded to 245 products in 472 dosage strengths and forms, including 40 in-licenced products. Seven new products were launched in Egypt, including Actos®, tanatril®(imidapril), Blopress® and Omnicef®.
... Administered in Egypt
11.45

22 Hikma Pharmaceuticals PLC Annual report 2009
DELIvErING OUr StrAtEGy
Increasing the scale of our speciality Injectables business
9 Sterile injectable manufacturing facility, Sintra, Portugal
Our sterile injectable manufacturing facilities in Portugal produce high quality injectable products for the US, European and MENA markets. these facilities are producing sterile liquids and cephalosporins and we have recently added significant lyophilisation capacity.
Manufactured in Portugal...
11.42

23
9 Our sterile injectable products are reaching patients across Europe
In Europe, we currently sell 23 compounds in 78 dosage strengths and forms. We have a strong presence in Germany, Portugal and Italy and are also rolling out our products in Austria, Spain and the Netherlands as well as in other new markets.
... Administered in Germany
08.42
24 Hikma Pharmaceuticals PLC Annual report 2009
DELIvErING OUr StrAtEGy
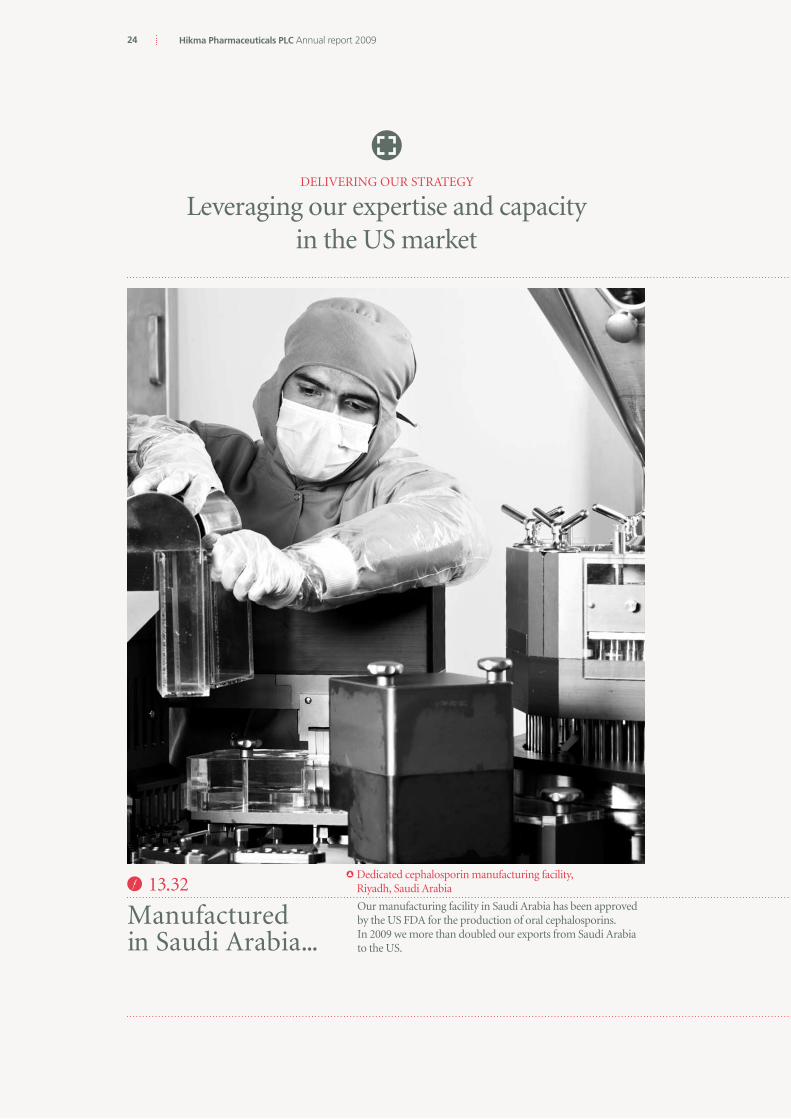
Leveraging our expertise and capacity in the US market
9 Dedicated cephalosporin manufacturing facility, riyadh, Saudi Arabia
Our manufacturing facility in Saudi Arabia has been approved by the US FDA for the production of oral cephalosporins. In 2009 we more than doubled our exports from Saudi Arabia to the US.
Manufactured in Saudi Arabia...
13.32

25
9 Our leading anti-infectives are being dispensed to patients in the US
Demand for our oral anti-infectives, which we manufacture at our facilities in Jordan and Saudi Arabia, grew significantly in 2009. We increased our market share of Cephaclor, one of our leading cephalosporins, from 1% to nearly 30% for the year.
... Administered in the United States
10.32
26 Hikma Pharmaceuticals PLC Annual report 2009
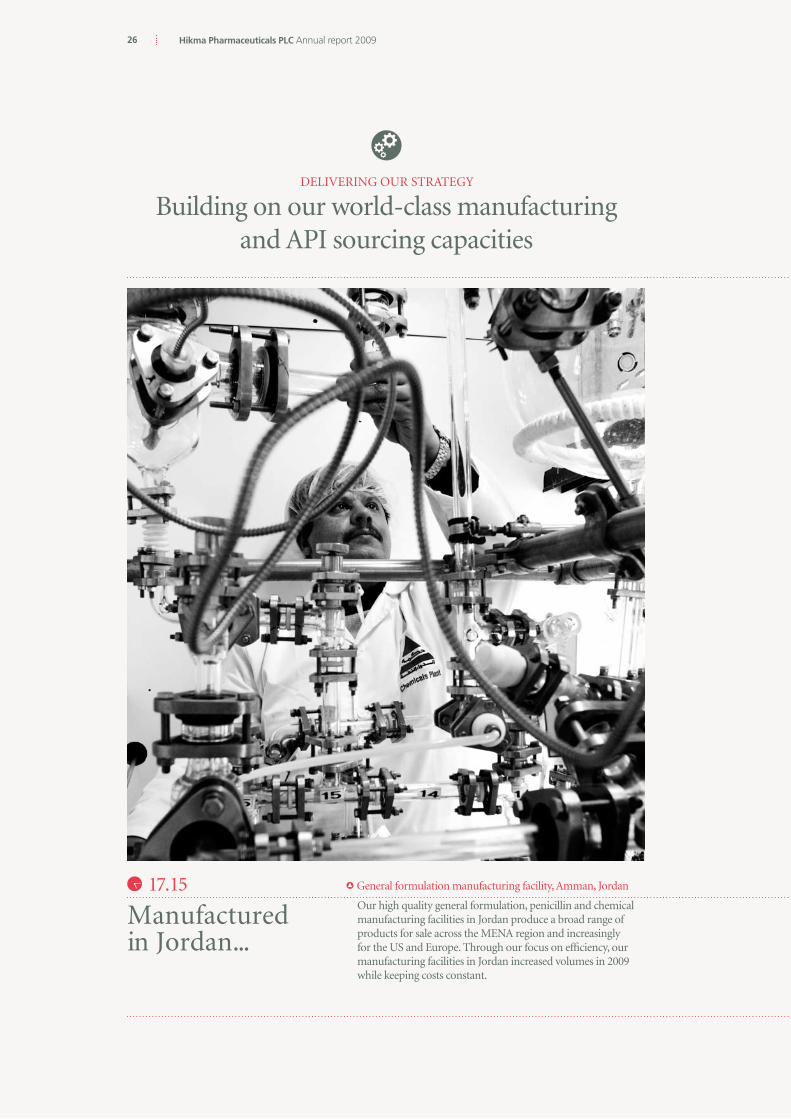
DELIvErING OUr StrAtEGy
9 General formulation manufacturing facility, Amman, Jordan
Our high quality general formulation, penicillin and chemical manufacturing facilities in Jordan produce a broad range of products for sale across the MENA region and increasingly for the US and Europe. through our focus on efficiency, our manufacturing facilities in Jordan increased volumes in 2009 while keeping costs constant.
Building on our world-class manufacturing and API sourcing capacities
„„„
Manufactured in Jordan...
17.15

27
9 Our leading anti-infectives are reaching patients in Iraq
Demand for our leading anti-infectives Amoclan® and Suprax® grew significantly in Iraq in 2009. Hikma’s overall sales to Iraq more than doubled as we launched new products and worked hard to rebuild our sales and marketing capabilities in this recovering market. A total of six new products and 10 new dosage strengths and forms were launched in Iraq in 2009.
... Administered in Iraq
16.15

28
The Directors are pleased to present their report and audited financial statements for the year ended 31 December 2009. For the purposes of this report, “Company” means Hikma Pharmaceuticals PLC and “Group” means the Company and its subsidiary and associated undertakings.
Key performance indicatorsThe Board measures progress on our strategic objectives by reference to five key financial performance indicators (“KPIs”) applied on a Group‑wide and segmental basis. These same indicators are used by the executive management to manage the business. Performance in 2009 against these indicators is set out in the table below, together with the prior year performance data.
Group performanceRevenue for the Group increased by 9.7% to $636.9 million, compared to $580.7 million in 2008. During the period our Branded business continued to perform well and we saw a considerable improvement in our US Generics business compared to 2008. These strong performances were partially offset by a slight decline in Injectables revenues compared to 2008, reflecting the impact of negative foreign exchange movements and our strategic decision to curtail private label sales in the US.
Exchange rate movements had a negative impact on Group revenue of approximately $16.3 million, or 2.6%, and on Group operating profit of approximately $8.3 million, or 7.8%. The impact on sales resulted primarily from the strengthening of the US Dollar relative to the Euro, Algerian Dinar, Sudanese Pound and Egyptian Pound. The impact on operating profit resulted from the strengthening of the US Dollar relative to the Algerian Dinar, Sudanese Pound and Egyptian Pound. On a constant currency basis, Group revenues increased by 12.5%.
Hikma Pharmaceuticals PLC Annual report 2009
Hikma’s diversified business delivered record sales and 36% earnings growth in 2009
Business and financial review
1 As of 2009, the Board is using an amended set of key performance indicators that better reflect the Group performance.
Revenue by segment
2009 2008
Branded 55.4% 55.3%
Injectables 22.6% 25.7%
Generics 21.2% 18.2%
Hikma’s key performance indicators1
2009 2008
Revenue growth +9.7% +29.4%
Operating profit growth/ revenue growth 3.4x –0.4x
Total working capital days 230 236
Return on invested capital 10.6% 8.7%
New product launches 24 17

29
The Branded business continues to represent 55% of Group sales and the combined Branded and Injectables sales in MENA now make up 63.5% of total Group sales.
The Group’s gross profit increased by 18.7% to $304.4 million, compared to $256.5 million in 2008. Group gross margin was 47.8%, compared to 44.2% in 2008, and well ahead of the targeted two percentage point improvement that we set at the beginning of the year. This improvement primarily reflects the increase in profitability in our Generics business, which was driven by strategic price increases across our portfolio and a shift in product mix. Production efficiencies and our continued efforts to optimise our API sourcing also delivered cost benefits during the year.
Group operating expenses grew by 12.1% to $197.1 million, compared to $175.8 million in 2008, but as a percentage of sales remained relatively stable at 31.0%, compared to 30.3% in 2008. The paragraphs below address the Group’s main operating expenses in turn.
Group sales and marketing expenses grew more slowly than Group sales during the year, increasing by 8.3% to $98.1 million, compared to $90.6 million in 2008. Consequently sales and marketing expenses decreased slightly as a percentage of sales from 15.6% in 2008 to 15.4%. This reflects better control of sales and marketing expenses in the Branded business, despite continued investment in developing our sales and marketing capabilities across the region, and strong growth in the Generics business, with its lower associated sales and marketing costs.
General and administrative expenses increased by 17.3% to $66.7 million, compared to $56.9 million in 2008. This is due to an increase in the cost of Group‑wide employee compensation and incentive schemes and an increase in bad debt provisions of approximately $2 million. General and administrative expenses as a percentage of sales increased to 10.5%, from 9.8% in 2008.
Investment in R&D decreased by 24.0% to $16.8 million, with total investment in R&D now representing 2.6% of Group revenue, compared to 3.8% in 2008. The decline in 2009 came from reduced investment in bioequivalence studies for our US Generics business and increased emphasis on in‑licensing and acquisition of new products. Going forward, we expect to increase our investment in R&D as a percentage of sales as we re‑focus our efforts on developing our global product portfolio and on the fast growing field of oncology.
Other net operating expenses increased by $9.3 million to $15.5 million in 2009. This increase is due primarily to an increase in provisions for slow moving items and foreign exchange losses resulting mainly from the depreciation in the Algerian and Sudanese currencies and the Euro.
Operating profit for the Group increased by 33.0% to $107.3 million, compared to $80.7 million in 2008. Our Group operating margin improved by three percentage points to 16.8% compared to 13.9% in 2008.
Delivering O
ur strategy
Revenue by region
2009 2008
MENA 63.5% 63.0%
US 24.0% 22.5%
Europe and Rest of World 12.5% 14.5%
30 Hikma Pharmaceuticals PLC Annual report 2009
Business and financial review continued
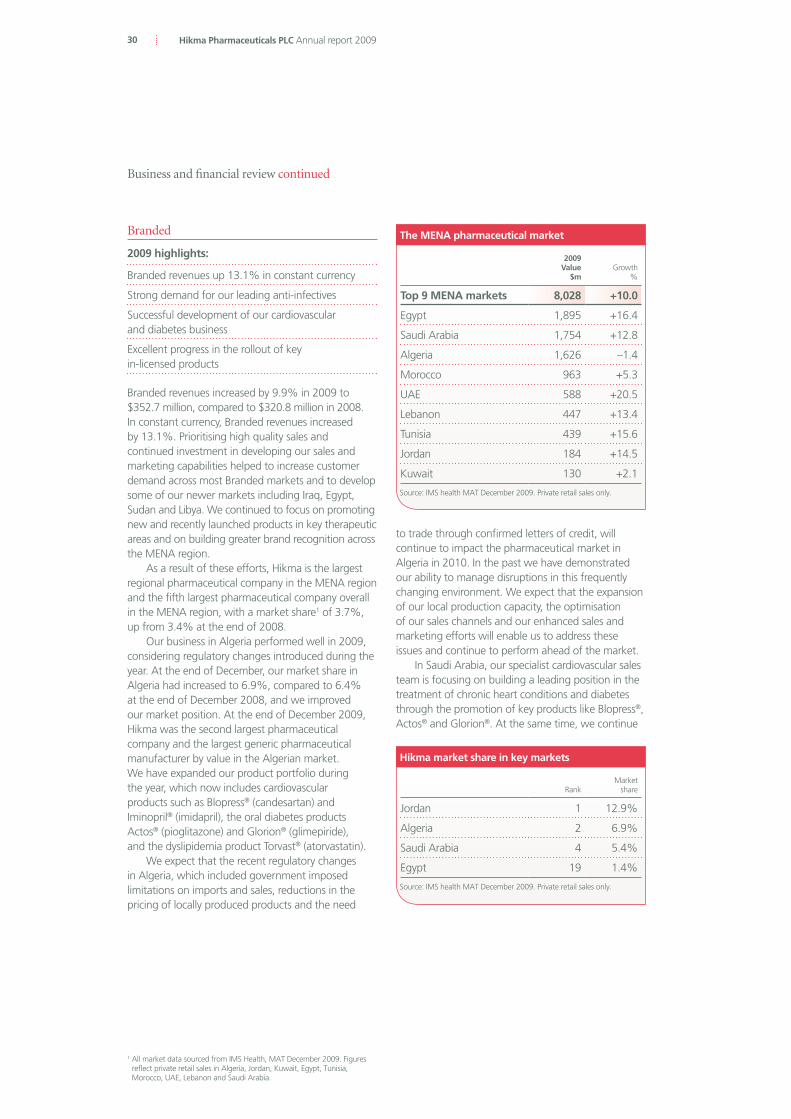
RankMarket
share
Jordan 1 12.9%
Algeria 2 6.9%
Saudi Arabia 4 5.4%
Egypt 19 1.4%
Source: IMS health MAT December 2009. Private retail sales only.
Hikma market share in key markets
1 All market data sourced from IMS Health, MAT December 2009. Figures reflect private retail sales in Algeria, Jordan, Kuwait, Egypt, Tunisia, Morocco, UAE, Lebanon and Saudi Arabia.
2009Value
$mGrowth
%
Top 9 MENA markets 8,028 +10.0
Egypt 1,895 +16.4
Saudi Arabia 1,754 +12.8
Algeria 1,626 –1.4
Morocco 963 +5.3
UAE 588 +20.5
Lebanon 447 +13.4
Tunisia 439 +15.6
Jordan 184 +14.5
Kuwait 130 +2.1
Source: IMS health MAT December 2009. Private retail sales only.
The MENA pharmaceutical marketBranded
2009 highlights:
Branded revenues up 13.1% in constant currency
Strong demand for our leading anti‑infectives
Successful development of our cardiovascular and diabetes business
Excellent progress in the rollout of key in‑licensed products
Branded revenues increased by 9.9% in 2009 to $352.7 million, compared to $320.8 million in 2008. In constant currency, Branded revenues increased by 13.1%. Prioritising high quality sales and continued investment in developing our sales and marketing capabilities helped to increase customer demand across most Branded markets and to develop some of our newer markets including Iraq, Egypt, Sudan and Libya. We continued to focus on promoting new and recently launched products in key therapeutic areas and on building greater brand recognition across the MENA region.
As a result of these efforts, Hikma is the largest regional pharmaceutical company in the MENA region and the fifth largest pharmaceutical company overall in the MENA region, with a market share1 of 3.7%, up from 3.4% at the end of 2008.
Our business in Algeria performed well in 2009, considering regulatory changes introduced during the year. At the end of December, our market share in Algeria had increased to 6.9%, compared to 6.4% at the end of December 2008, and we improved our market position. At the end of December 2009, Hikma was the second largest pharmaceutical company and the largest generic pharmaceutical manufacturer by value in the Algerian market. We have expanded our product portfolio during the year, which now includes cardiovascular products such as Blopress® (candesartan) and Iminopril® (imidapril), the oral diabetes products Actos® (pioglitazone) and Glorion® (glimepiride), and the dyslipidemia product Torvast® (atorvastatin).
We expect that the recent regulatory changes in Algeria, which included government imposed limitations on imports and sales, reductions in the pricing of locally produced products and the need
to trade through confirmed letters of credit, will continue to impact the pharmaceutical market in Algeria in 2010. In the past we have demonstrated our ability to manage disruptions in this frequently changing environment. We expect that the expansion of our local production capacity, the optimisation of our sales channels and our enhanced sales and marketing efforts will enable us to address these issues and continue to perform ahead of the market.
In Saudi Arabia, our specialist cardiovascular sales team is focusing on building a leading position in the treatment of chronic heart conditions and diabetes through the promotion of key products like Blopress®, Actos® and Glorion®. At the same time, we continue

31
Delivering O
ur strategy
to see steady demand for our leading anti‑infectives in this market. At the end of December, our market share in Saudi Arabia had increased to 5.4%, compared to 4.9% at the end of December 2008. We are now the fourth largest pharmaceutical company by value in the Saudi market, compared to the fifth largest at the end of December 2008.
In Jordan we have maintained our position as the market leader with a market share of 12.9%, up from 12.4% at the end of December 2008. We delivered a strong performance in Jordan during the period supported by strong sales of our leading anti‑infectives and tender sales.
In Egypt, we delivered strong growth across most of our product portfolio and began the rollout of some of our key Branded products, including Actos®, Tanatril® (imidapril) Blopress®, and Omnicef®. At the end of December, our market share in Egypt was stable at 1.4%.
Other markets that performed well during the year were Iraq, Sudan, Libya and Lebanon, where we benefited from more favourable operating environments, strong demand for our own brands, and the launches of some of our leading in‑licensed products.
Revenue from in‑licensed products grew by 24.9% in 2009 to $133.6 million, representing 37.9% of Branded sales. Actos® has now been launched in 13 markets, Blopress® has been launched in 15 markets, and Blopress Plus® and Takepron® have been launched in nine markets. Our sales and marketing teams are working hard to establish these products as leading cardiovascular and diabetes brands in the MENA through a combination of medical education programmes, sponsorship of scientific conferences and targeted marketing campaigns.
We continue our efforts to develop our portfolio of in‑licensed products, evidenced by the signing of three new licensing agreements during the year. In June we signed an agreement with Teikoku Pharma USA for our own brand of Lidoderm®, the first and only US FDA approved patch for post‑herpetic neuralgia. This agreement covers the territories of Algeria, Morocco, Iraq, Libya, Sudan, and Tunisia. In July, we signed two agreements with Faes Farma SA, a Spanish manufacturing company – one for the manufacturing and marketing of mesalazine, a generic product used for the treatment
of inflammatory intestinal disease, and one for the license to manufacture and market the novel anti‑histamine Bilastine®.
In December 2009, Astellas Pharma Europe, Ltd. granted Hikma the license to promote and distribute Advagraf®, Astellas’ prolonged‑release once‑daily formulation of Prograf®, the immunosuppressant tacrolimus, in the MENA region. Through this agreement, Astellas grants exclusive rights to Hikma for the distribution and promotion of Advagraf® across 17 MENA countries. Hikma will also continue to distribute and promote Prograf® in the same territories.
In early January 2010, we signed an exclusive agreement to represent BioCryst, a US‑based biotechnology company, in respect of its anti‑viral product Peramivir for pandemic flu treatment stockpiling opportunities with governments in MENA region.
All of these agreements reflect our position as the partner of choice for marketing branded products in the region.
In 2009, the Branded business launched a total of 71 products across all markets, including six new compounds and 18 new dosage forms and strengths. The Branded business also received 69 regulatory approvals across the region, including 10 for new products.
Gross profit in the Branded business increased by 8.6% to $187.6 million, compared to $172.8 million in 2008. The Branded business’s gross margin declined slightly to 53.2%, compared to 53.9% in 2008, reflecting the depreciation of the Algerian Dinar, Sudanese Pound and Egyptian Pound.
Branded operating profit increased by 4.5% to $91.4 million, compared to $87.5 million in 2008. Operating margin in the Branded business was 25.9%, compared to 27.3% in 2008. This change is mainly due to the negative impact of exchange rates described above.
In 2010, we expect low double digit revenue growth in our Branded business, with sales spread more evenly over the course of the year than in previous years, reflecting a shift in the geographic and product sales mix. If foreign exchange rates remain stable in 2010, we expect Branded operating margins to be broadly in line with 2009.

32 Hikma Pharmaceuticals PLC Annual report 2009
Injectables
2009 highlights:
Injectables revenues down 3.5% to $144.1 million
14% growth in Injectables sales in the MENA region
Strategic decision to curtail private label sales in the US
Successful FDA inspection of our sterile manufacturing facilities in Portugal with zero observations
Injectables revenues across all regions recovered in the second half of the year, enabling us to close the year only slightly down on 2008, with sales of $144.1 million, compared to $149.3 million in 2008. The slight decline in full year sales was due primarily to our decision to curtail private label sales in our US business and the depreciation in the Algerian and Sudanese currencies and the Euro.
MENA Injectables sales increased by 14.0% to $62.3 million, compared to $54.7 million in 2008. On a constant currency basis, MENA Injectables sales grew by 18.5%. This increase is attributed to strong growth in Iraq and Algeria, an increasing contribution from existing markets like Lebanon and Jordan, and an initial contribution from newly launched oncology products.
Having successfully built a hospital sales force in the US, we now have greater capability to market our own products in this market. In the second half of the year we more than doubled own product sales,
benefiting from a new supply agreement signed with a leading group purchasing organisation and from new product launches.
Due to a strategic decision to curtail private label sales (approximately $11 million in 2008), US Injectables sales declined year on year to $17.0 million, from $24.8 million in 2008.
European Injectable sales reached $64.8 million in 2009, down 7.3% from $69.9 million in 2008. The decline is attributed to the depreciation of the Euro, a loss of $3.6 million in sales from a discontinued in‑licensed product and continued pricing pressure in Germany, our largest market. This was partially offset by increased sales from new product launches and an increase in market share in some of our newer markets.
In 2009, the Injectables business launched a total of 55 products across all markets, including 16 new compounds and 26 new dosage forms and strengths. The Injectables business also received a total of 41 regulatory approvals across all regions and markets, including 24 in MENA, nine in Europe and eight in the US.
Injectables gross profit decreased by 0.7% to $62.9 million, compared to $63.4 million in 2008, with gross margin increasing to 43.7%, compared to 42.4% in 2008. The increase in margin reflects the increase in sales from the MENA region as a percentage of total Injectables sales.
Injectables operating profit decreased by 30.6% to $15.3 million, compared to $22.1 million in 2008. Injectables operating margin decreased to 10.7% in 2009, down from 14.8% in 2008. This decline is explained by lower sales in the US and Europe and increasing operating expenses relating to higher sales and marketing expenses in MENA and the US and an increase in foreign exchange losses.
Following the investments we have been making in our Injectables business in recent years, we expect strong growth in Injectables sales in 2010 driven by our expanding product portfolio, increasing demand for contract manufacturing and continuing momentum in sales, particularly in the MENA region and the US.
Business and financial review continued
2009 Injectable revenues (by region)
Europe 45.0%
US 11.8%
MENA 43.2%

33
Delivering O
ur strategy
Generics
2009 highlights:
Delivered significant improvement in Generics revenues, up 27.8%
More than doubled gross margin to 38.9%, up from 18.3% in 2008
Revenue in our Generics business increased by 27.8% to $135.1 million, compared to $105.7 million in 2008. This strong performance reflects the actions of the strengthened US management team and in particular focused sales, marketing and operational improvements. Over the past 18 months we have rationalised our product portfolio, increased our focus on our higher margin products and implemented price increases across our portfolio. Through focused sales targeting and improved service levels, we have been developing better relationships with key wholesale and retail customers, and are consequently improving the predictability of our revenue streams. At the same time our operations have become more efficient.
The strong performance also reflects the changing competitive landscape in the US. The absence of some of our competitors from the market has created new opportunities, increasing demand across our product portfolio and reducing our reliance on any one product. Demand has been particularly strong for the anti‑infectives we produce at our FDA approved facilities in Jordan and Saudi Arabia. During 2009 we tripled sales of anti‑infectives produced at these facilities.
All of these actions led to an increase in Generics gross profit of 172.1% to $52.5 million, compared to $19.3 million in 2008. Gross margin more than doubled from 18.3% in 2008 to 38.9% in 2009. Consequently, the Generics segment achieved an operating profit of $25.0 million in 2009, compared to an operating loss of $5.8 million in 2008. Generic operating margins reached 18.5% in 2009.
In 2009, the Generics business launched two new compounds in three new dosage forms and strengths.
Having returned to profitability in our Generics business in 2009, we are confident that this business will continue to perform well in 2010 and currently expect high single‑digit sales growth for the full year.
MAT Jan2009
MAT Jan2010
Total prescriptions written (m) 2,254 2,418
Market growth +9.5% +7.2%Source: IMS Health MAT January. Number of prescriptions filled in the US generics market for oral pharmaceuticals.
US generic market
Generics sales by customer type
08 09 08 09 08 09 08 09 08 09 08 09
Wholesalers Chains Core distributors Mail order andmanaged care
Private label Other
Source: Company data.
34 Hikma Pharmaceuticals PLC Annual report 2009
Other businesses Other businesses primarily comprise Arab Medical Containers (“AMC”), a manufacturer of pharmaceutical packaging, and International Pharmaceuticals Research Centre, which conducts bio‑equivalency studies. These businesses, which supply third parties as well as other Group operations, had aggregate revenues of $5.1 million, compared with aggregate revenue of $4.8 million in 2008. This represented 0.8% of Group revenues in 2009.
These Other businesses delivered an operating loss of $2.3 million in 2009, compared to an operating loss of $3.7 million in 2008. The slight improvement can be attributed to increased efficiencies in corporate research and development costs.
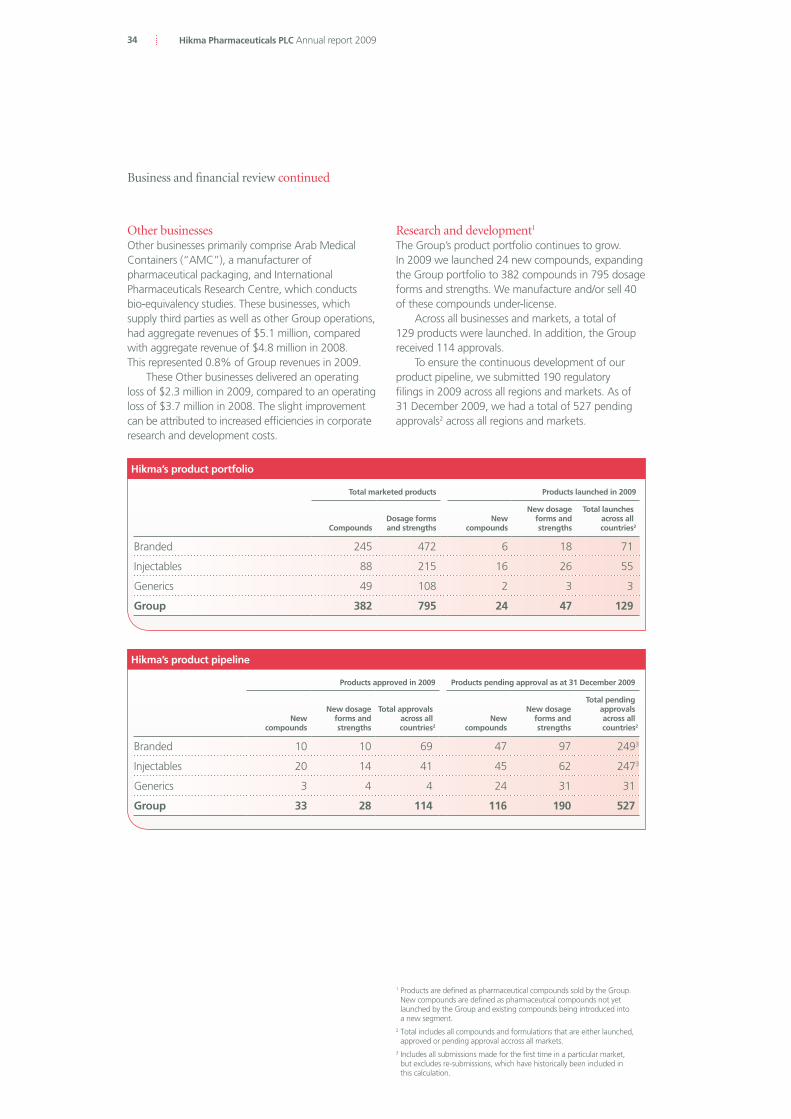
Research and development1 The Group’s product portfolio continues to grow. In 2009 we launched 24 new compounds, expanding the Group portfolio to 382 compounds in 795 dosage forms and strengths. We manufacture and/or sell 40 of these compounds under‑license.
Across all businesses and markets, a total of 129 products were launched. In addition, the Group received 114 approvals.
To ensure the continuous development of our product pipeline, we submitted 190 regulatory filings in 2009 across all regions and markets. As of 31 December 2009, we had a total of 527 pending approvals2 across all regions and markets.
Hikma’s product portfolio
Total marketed products Products launched in 2009
Compounds Dosage forms and strengths
New compounds
New dosage forms and strengths
Total launchesacross allcountries2
Branded 245 472 6 18 71
Injectables 88 215 16 26 55
Generics 49 108 2 3 3
Group 382 795 24 47 129
Hikma’s product pipeline
Products approved in 2009 Products pending approval as at 31 December 2009
New compounds
New dosage forms and strengths
Total approvalsacross allcountries2
New compounds
New dosage forms and strengths
Total pending approvals across allcountries2
Branded 10 10 69 47 97 2493
Injectables 20 14 41 45 62 2473
Generics 3 4 4 24 31 31
Group 33 28 114 116 190 527
Business and financial review continued
1 Products are defined as pharmaceutical compounds sold by the Group. New compounds are defined as pharmaceutical compounds not yet launched by the Group and existing compounds being introduced into a new segment.
2 Total includes all compounds and formulations that are either launched, approved or pending approval accross all markets.
3 Includes all submissions made for the first time in a particular market, but excludes re‑submissions, which have historically been included in this calculation.
35
Delivering O
ur strategy
We estimate the approximate addressable market for our portfolio of pending approvals to be approximately $27 billion, based on the 2009 full year sales of the currently marketed equivalent products in the markets covered by the pending approvals.
At 31 December 2009, we had a total of 71 new products under development, the majority of which should receive several marketing authorisations for differing strengths and/or product forms over the next few years.
Net finance expenseNet finance expense decreased to $12.3 million, compared to $16.7 million in 2008 due to lower interest rates and lower net debt levels as explained in the operating cash flow and investment section below.
Profit before taxProfit before taxes for the Group increased by 48.0% to $94.8 million, compared to $64.0 million in 2008.
TaxThe Group incurred a tax expense of $15.5 million in 2009. The effective tax rate was 16.3%, compared to 10.8% in 2008. The increase in the effective tax rate reflects the return to profitability in our US Generics business.
Non-controlling interestThe profit attributable to non‑controlling interest was negative $1.6 million in 2009. This primarily arose on profits in our 51% owned subsidiary in Sudan.
Profit for the yearThe Group’s profit attributable to equity holders of the parent increased by 36.0% to $77.7million. On constant currency, growth in profit attributable to equity holders of the parent increased by 49.9%.
Adjusted profit for the yearExcluding the amortisation of intangible assets (other than software), the Group’s adjusted profit for the year attributable to equity holders of the parent increased by 24.1% to $83.6 million for the year ended 31 December 2009, compared with $67.43 million in 2008.
Earnings per share Diluted earnings per share for the year to 31 December 2009 were 40.1 cents, up 35.6% from 29.6 cents in 2008.
DividendThe Board has recommended a final dividend of 6.5 cents per share (approximately 4.3 pence per share), which will make a dividend for the full year of 11.0 cents per share, up from 7.5 cents per share in 2008, an increase of 46.7%. The proposed final dividend will be paid on 27 May 2010 to shareholders on the register on 16 April 2010, subject to approval by shareholders at the Annual General Meeting.

36 Hikma Pharmaceuticals PLC Annual report 2009
Business and financial review continued
Operating cash flow and investmentThe Group achieved an overall improvement in working capital for the period, reducing its working capital days by six days. Improvement was made in the MENA region and in Europe, where we generated significant cash flow from operations. This increase is a reflection of our continued focus on improving collections, increased factoring of receivables and a leaner supply chain. This improvement was offset, however, by our US Generics business, where receivables increased due to a change in customer mix and where a planned increase in inventories is helping us to maintain high service levels and improve profitability.
Group receivable days increased by seven days compared to 31 December 2008, from 109 days to 116 days as at 31 December 2009. Inventory days increased by three days to 177 days reflecting an increase in inventories in the US related to our efforts to improve service levels. Increases in receivable and inventory days were offset by an improvement in payable days of 15 days.
Working capital improvements coupled with improved profitability led to a significant increase in operating cash flow to reach $119.0 million, compared to $75.0 million in 2008.
Balance sheetCapital expenditure declined to $37.0 million from $56.7 million in 2008. During the period, expenditure was focused on the completion of our new lyophilisation plant in Portugal, the expansion of our manufacturing capacity in Algeria and Egypt and overall maintenance capex across all of our facilities.We will increase capital expenditure in 2010 as we expand our manufacturing capacity in the MENA region to support demand for our global products.
As a result of working capital improvements and reduced capital expenditure, net debt decreased from $170.9 million as at 31 December 2008 to $116.9 million as at 31 December 2009 keeping the Group in a very strong financing position.
OutlookHikma should continue to benefit from the overall pharmaceutical market growth in the MENA region, which we expect to remain higher than the global pharmaceutical market. Our share of the MENA market should also continue to increase as we further penetrate into existing markets, expand into new markets and grow our portfolio of own‑brand and in‑licensed products. There also remains considerable scope for us to grow our global Injectables business following the significant investments we have made in portfolio development, sales and marketing and manufacturing capacity. Our US Generics business is on a strong footing and we are confident that we can maintain the positive momentum we have created in this business. Overall for the Group we expect to deliver Group sales growth in the low‑teens in 2010 and expect gross margin to be broadly in line with the improved gross margin we achieved in 2009.
Basis of preparation and forward-looking statementsThis business and financial review has been prepared solely to provide additional information to shareholders to assess the Company’s strategies and the potential for those strategies to succeed, and should not be relied on by any other party or for any other purpose. Certain statements in the above review are forward‑looking statements – using words such as “intends”, “believes”, “anticipates” and “expects”. Where included, these have been made by the Directors in good faith based on the information available to them up to the time of their approval of this report. By their nature, forward‑looking statements are based on assumptions and involve inherent risks and uncertainties that could cause actual results or events to differ materially from those expressed or implied by the forward‑looking statements, and should be treated with caution. These risks, uncertainties or assumptions could adversely affect the outcome and financial effects of the plans and events described in this review. Forward‑looking statements contained in this review regarding past trends or activities should not be taken as a representation that such trends or activities will continue in the future. You should not place undue reliance on forward‑looking statements, which speak as only of the date of the approval of this report.
Except as required by law, the Company is under no obligation to update or keep current the forward‑looking statements contained in this review or to correct any inaccuracies which may become apparent in such forward‑looking statements.
Operating cash flow $ million
53.3
75.0
119.0
07 08 09
+58.7%

37
Delivering O
ur strategy
Principal risks and uncertainties
The Group’s business faces risks and uncertainties
The section below includes the principal risks and uncertainties that the Group considers could have a significant effect on its financial
condition, results of operations or future performance. The list is not set out in order of priority and other risks, currently unknown or
not considered material, could have a similar effect.
!OPERATIONAL RISKS:
Risk
Compliance with cGMP Non-compliance with manufacturing standards (often referred to as “Current Good Manufacturing Practices” or cGMP)
Potential impact
– Delays in supply or an inability to market or develop the Group’s products
– Delayed or denied approvals for the introduction of new products
– Product complaints or recalls
– Bans on product sales or importation
– Disruptions to operations
– Litigation
Mitigation
– Commitment to maintain the highest levels of quality across all manufacturing facilities
– Strong global compliance function that oversees across the Group
– Remuneration and reward structure that helps retain experienced personnel
– Continuous staff training
Risk
Disruptions in the manufacturing supply chain – Inability to procure active
ingredients from approved sources
– Inability to procure active ingredients on commercially viable terms
– Inability to procure the quantities of active ingredients needed to meet market requirements
– Inability to supply finished product to our customers in a timely fashion
Potential impact
– Failure to develop and/or commercialise new products
– Delays in marketing existing products
– Lost revenue streams on short notice
– Reduced service levels and damage to customer relationships
Mitigation
– Alternate approved suppliers of active ingredients
– Long-term relationships with reliable raw material suppliers
– Corporate auditing team continuously monitors regulatory compliance of API suppliers
– Focus on improving service levels and optimising our supply chain
Risk
Product development Failure to secure new products or compounds for development, either through internal research and development efforts, in-licensing, or acquisition
Potential impact
– Inability to grow sales and increase profitability for the Group
– Lower return on investment in research and development
Mitigation
– Experienced and successful in-house research and development team
– Strong business development team
– Track record of building in-licensed brands
38 Hikma Pharmaceuticals PLC Annual report 2009
Principal Risks and Uncertainties continued
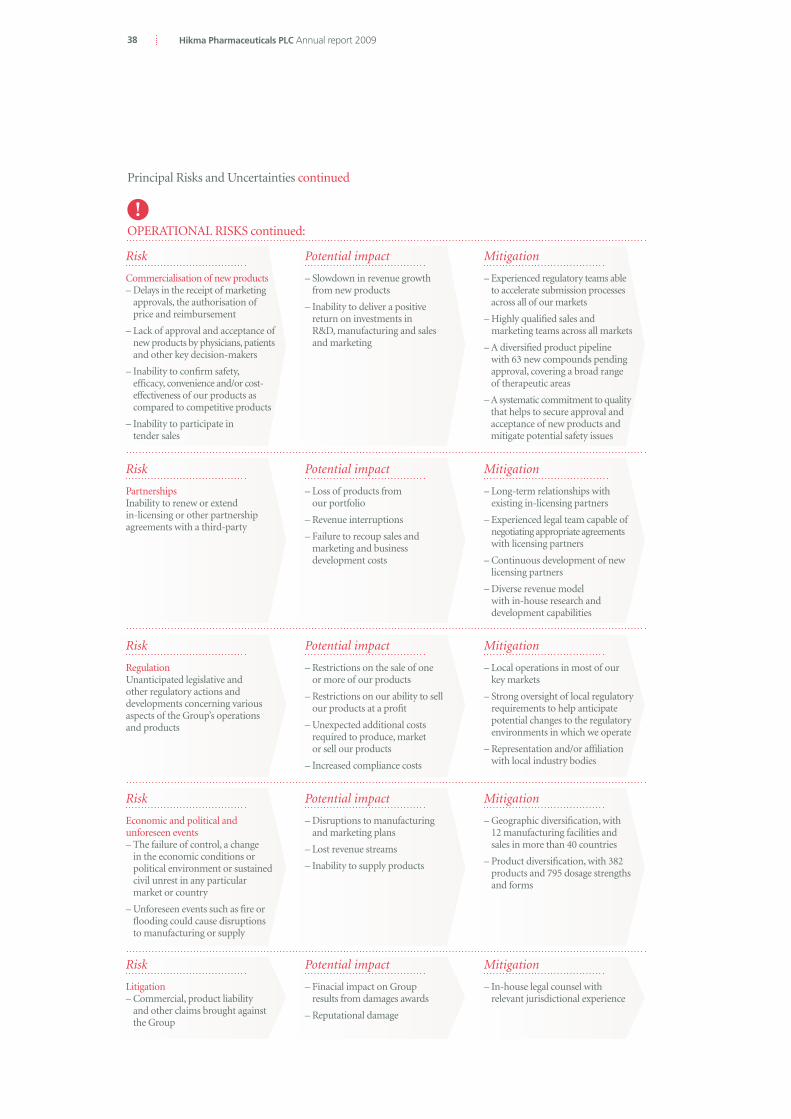
OPERATIONAL RISKS continued:
Risk
Commercialisation of new products – Delays in the receipt of marketing
approvals, the authorisation of price and reimbursement
– Lack of approval and acceptance of new products by physicians, patients and other key decision-makers
– Inability to confirm safety, efficacy, convenience and/or cost- effectiveness of our products as compared to competitive products
– Inability to participate in tender sales
Potential impact
– Slowdown in revenue growth from new products
– Inability to deliver a positive return on investments in R&D, manufacturing and sales and marketing
Mitigation
– Experienced regulatory teams able to accelerate submission processes across all of our markets
– Highly qualified sales and marketing teams across all markets
– A diversified product pipeline with 63 new compounds pending approval, covering a broad range of therapeutic areas
– A systematic commitment to quality that helps to secure approval and acceptance of new products and mitigate potential safety issues
Risk
Partnerships Inability to renew or extend in-licensing or other partnership agreements with a third-party
Potential impact
– Loss of products from our portfolio
– Revenue interruptions
– Failure to recoup sales and marketing and business development costs
Mitigation
– Long-term relationships with existing in-licensing partners
– Experienced legal team capable of negotiating appropriate agreements with licensing partners
– Continuous development of new licensing partners
– Diverse revenue model with in-house research and development capabilities
Risk
Economic and political and unforeseen events – The failure of control, a change
in the economic conditions or political environment or sustained civil unrest in any particular market or country
– Unforeseen events such as fire or flooding could cause disruptions to manufacturing or supply
Potential impact
– Disruptions to manufacturing and marketing plans
– Lost revenue streams
– Inability to supply products
Mitigation
– Geographic diversification, with 12 manufacturing facilities and sales in more than 40 countries
– Product diversification, with 382 products and 795 dosage strengths and forms
Risk
Litigation – Commercial, product liability
and other claims brought against the Group
Potential impact
– Finacial impact on Group results from damages awards
– Reputational damage
Mitigation
– In-house legal counsel with relevant jurisdictional experience
Risk
Regulation Unanticipated legislative and other regulatory actions and developments concerning various aspects of the Group’s operations and products
Potential impact
– Restrictions on the sale of one or more of our products
– Restrictions on our ability to sell our products at a profit
– Unexpected additional costs required to produce, market or sell our products
– Increased compliance costs
Mitigation
– Local operations in most of our key markets
– Strong oversight of local regulatory requirements to help anticipate potential changes to the regulatory environments in which we operate
– Representation and/or affiliation with local industry bodies
!
39
Delivering O
ur strategy
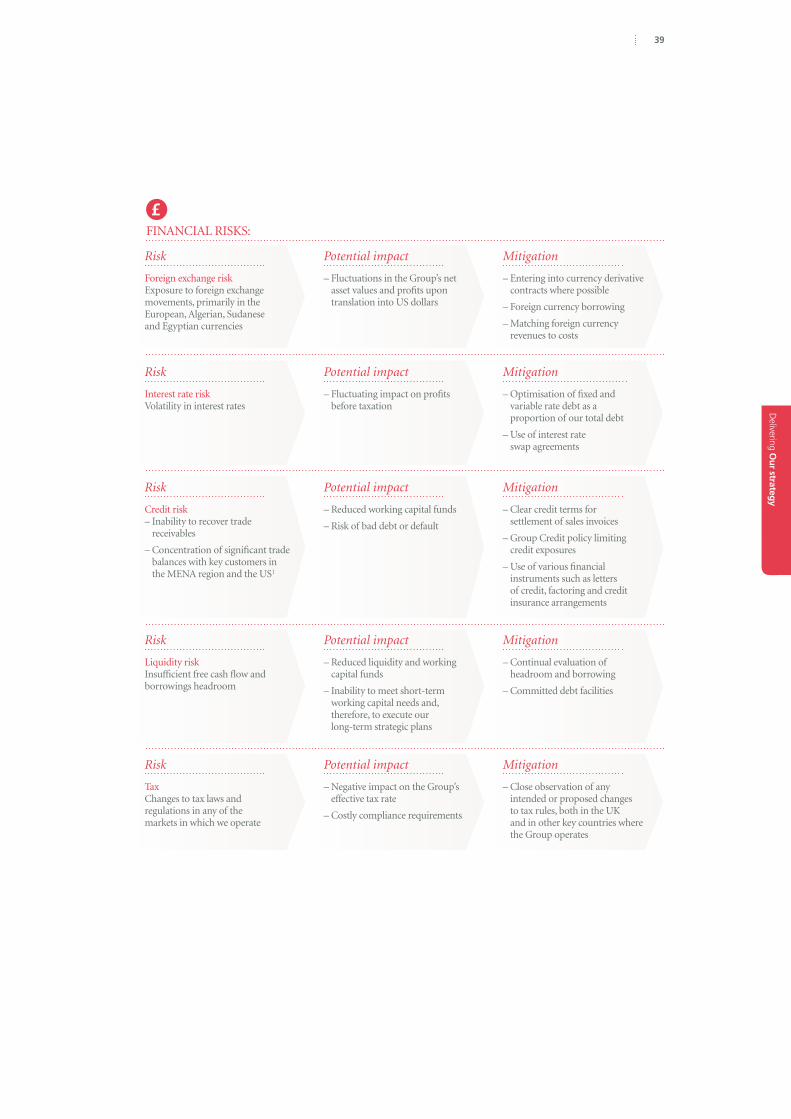
FINANCIAL RISKS:
£
Risk
Foreign exchange risk Exposure to foreign exchange movements, primarily in the European, Algerian, Sudanese and Egyptian currencies
Potential impact
– Fluctuations in the Group’s net asset values and profits upon translation into US dollars
Mitigation
– Entering into currency derivative contracts where possible
– Foreign currency borrowing
– Matching foreign currency revenues to costs
Risk
Interest rate risk Volatility in interest rates
Potential impact
– Fluctuating impact on profits before taxation
Mitigation
– Optimisation of fixed and variable rate debt as a proportion of our total debt
– Use of interest rate swap agreements
Risk
Liquidity risk Insufficient free cash flow and borrowings headroom
Potential impact
– Reduced liquidity and working capital funds
– Inability to meet short-term working capital needs and, therefore, to execute our long-term strategic plans
Mitigation
– Continual evaluation of headroom and borrowing
– Committed debt facilities
Risk
Tax Changes to tax laws and regulations in any of the markets in which we operate
Potential impact
– Negative impact on the Group’s effective tax rate
– Costly compliance requirements
Mitigation
– Close observation of any intended or proposed changes to tax rules, both in the UK and in other key countries where the Group operates
Risk
Credit risk – Inability to recover trade
receivables
– Concentration of significant trade balances with key customers in the MENA region and the US1
Potential impact
– Reduced working capital funds
– Risk of bad debt or default
Mitigation
– Clear credit terms for settlement of sales invoices
– Group Credit policy limiting credit exposures
– Use of various financial instruments such as letters of credit, factoring and credit insurance arrangements

40 Hikma Pharmaceuticals PLC Annual report 2009

41
Delivering Responsibly
Section Three
Delivering responsibly
342
How we ensure that we act responsibly

42 Hikma Pharmaceuticals PLC Annual report 2009
Overview from Mazen Darwazah, Vice-Chairman2009 has been a rewarding and productive period for our corporate responsibility (“CR”) programme. Throughout the year, we have focused on developing a long-term, sustainable strategy, which not only addresses the very real social issues affecting society today but does so in a way that makes sense for our business and reflects the core Hikma values.
Since the Company was founded in 1978, we have been committed to honesty, integrity and the highest possible standards in everything we do. We are dedicated to the welfare and education of our employees, committed to the communities in which we work and determined to preserve and protect the environment in which we operate. These principles have guided us for the past 30 years and will continue to do so in the future.
To that end, we have designed a five-year plan taking us from 2010 to 2015. The plan revolves around two broad themes – wellbeing and education, and four key platforms – our people, our community, our environment and global welfare. These have been chosen specifically because they combine our very real commitment to stakeholders and society with a desire to embed CR into the heart of our business.
2009 achievementsCorporate responsibility is and always has been an essential part of the Hikma way. Strong commitments to our community and the environment have helped to make Hikma what it is today – a highly successful international pharmaceutical company with a reputation for integrity.
Over the last three years we have sought to formalise our approach to CR to ensure that it is increasingly embedded in the way we conduct business. We began this process in 2006 by creating a Group-wide CR programme and introducing an official Hikma Code of Conduct. The following year, we built on that progress and in 2008 established a Board-level steering committee and an expanded working committee.
In 2009, we increased the number of CR Champions across the Group. The champions are focused on raising awareness of social, health and environmental issues in our business. In employee and community matters, we gave particular emphasis to four events: the Hikma Global Volunteering Day, ‘You are Hikma’, Hikma’s Day against Breast Cancer and Hikma’s Day against Diabetes. Volunteering is an important part of Hikma’s CR approach and the annual Global Volunteering Day focuses each year on a different healthcare theme. We also spent time in 2009 developing and refining the five-year strategy for CR, endorsed and supported by our executive and non-executive Board members.
Aligning business and CRWe believe we owe a duty of care towards our employees, our customers, our suppliers and the wider community. Our commitment to operating responsibly has and will continue to differentiate us from our competitors. It has helped us to build our strong brand and, ultimately, it will help us to drive sales and to operate more efficiently.
Developing a long-term sustainable strategy that addresses the social issues affecting society today
in a way that makes sense for our business and reflects the core Hikma values
Corporate responsibility report
Champions work to deliver initiatives and engage with employees to encourage and motivate.
10
Number of CR Champions

Delivering Responsibly
At the end of 2008, we undertook a significant review of our CR governance structure in line with our ongoing aim of embedding CR throughout the Hikma Group and driving the CR programme from the Board and senior management to operational functions. This year was the first full year of operations for the Board-level CR Steering Committee and CR Working Committee.
The seniority and breadth of experience that the members bring to these committees ensures that CR remains focused and aligned to the business. Facilitated by the Corporate Communications and CR team, the Group is responsible for agreeing strategy, endorsing activities, reviewing activity reports and assessing progress. This approach provides coherence and economies of scale as well as a framework to share best practice across our markets.
On the ground, CR Champions work to implement our strategy across the Group. At the end of 2009, we had a team of ten CR Champions, each dedicated to one of our manufacturing facilities. During the course of 2010, we will build on this initiative, adding two new Champions to the existing team.
These Champions work to deliver initiatives, engage with and report to country managers and encourage and motivate employees to make CR part of their day-to-day operations. All our Champions are full time employees with a range of experience and expertise, which ensures that CR remains focused on business benefit and is embedded in employees’ working lives.
Our Champions deliver monthly reports to the CR department and their country managers. These managers then report back to the Group on progress, encouraging diligence and continuity. We are now
establishing KPIs for senior management to deepen their support for CR in their respective markets.
ReportingWe have continued to use the Global Reporting Initiative’s G3 guidelines as a benchmark tool. Building on our work in previous years, we have focused in particular on community investment, environmental impacts, employees and labour practices.
Many of our subsidiaries began reporting against GRI metrics for the first time in 2009, including Egypt, Germany, Italy, Jordan’s APM facility and Saudi Arabia. We have also started to use dedicated reporting software, underlining our commitment to the GRI approach and enhancing comparative reporting in the future.
PeopleWe value our people as our most important asset. To successfully grow our business, we need to develop and reward our people.
With our commitment to maintaining the highest quality standards and cGMP (current good manufacturing practices), technical training has always been a top priority across the Group. In 2008, analysis of GRI data helped us to identify areas of need for further training. On this basis, we targeted an increase in non-technical training for 2009. In line with these targets and in recognition of the important role CR plays within the Group, a two-day training workshop was held in 2009, focusing on developing the champions’ knowledge and understanding of CR and discussing future strategic aims. Of course, we also maintained our Continuing Education Scheme, which supports employees in full funded further education programmes.
Hikma responsibility structure
Board of Directors
Working Committee
CR Champion
Steering Committee
43

44 Hikma Pharmaceuticals PLC Annual report 2009
Corporate and social responsibility report continued
Health and safetyHealth and safety lie at the core of our business. We cannot operate successfully and deliver quality products without ensuring the health and wellbeing of our employees.
Communication of Hikma’s Health and Safety Policy – to meet and, where possible, exceed all the labour laws and regulations with regards to workplace health and safety in all the countries in which we operate – was prioritised during the year. We are committed to continuous improvements in health and safety and will be working towards the Group-wide implementation of OHSAS ISO 18001, the occupational health and safety management system, or its equivalents in 2010.
Our Health and Safety Policy is becoming more widely implemented across the Group. Developed in 2007 and launched in 2008, the policy involves the appointment of an HSE supervisor in each business unit. The appointment process continued during 2009.Health and safety training was offered to all employees across the Group in 2009. This was part of a commitment made in 2008 and we are proud to have achieved this goal. We have also made significant progress on absenteeism and occupational injury rates. Occupational injury rates were less than 1 per cent in 2009 and, in many countries, a zero rating was achieved. We hope to make further improvements in 2010, following the launch of an explicit programme targeting zero level occupational injuries.
Promoting the health and safety of our employees is clearly aligned with our key business objectives – to deliver better health to the markets we serve. In 2009, our businesses focused on developing a strong presence in the growing fields of heart disease,
diabetes and cancer. Sponsoring symposia and conferences for doctors, we have helped to build a strong knowledge base in the MENA region.
In 2009, two important events were organised to raise awareness of cancer and diabetes among our employees and our communities and to promote healthier lifestyles – Hikma’s Day against Breast Cancer and Hikma’s Day against Diabetes.
The Day against Breast Cancer was a Group-wide event with participation from all business units. Free breast examination and mammograms were offered to female employees in some business units. Other initiatives included poster and brochure campaigns, awareness e-mails, lectures on prevention and fundraising in support of cancer research.
A similar approach was taken with our Day against Diabetes. Awareness of the causes and risks of diabetes was heightened through lectures and poster campaigns at a number of Hikma business units. In others, blood sugar analysis tests were offered to employees and in the US, employees took part in the American Heart Foundation’s Heart Walk campaign.
EthicsHikma is committed to the highest ethical principles and we endeavour to ensure that all our employees conform to the highest possible standards of integrity and honesty.
We are members of the Global Compact, a UN-sponsored initiative for businesses committed to aligning their operations and strategies with ten universally accepted principles in the areas of human rights, labour, environment and anti-corruption. Hikma remains committed to upholding these principles and embedding them into its operations. In 2009, further steps were taken to train existing staff and all new joiners now receive guidance on our commitment to the Global Compact as part of
Occupational injury rates were less than 1% and in many countries zero.
<1%
Occupational injury rates
employees employees

45
Delivering Responsibly
Community
The number of participants more than doubled for the Hikma Global Volunteering Day from 500 in 2008.
1,200
$1.2mCharitable donations in 2009
their induction programme. In November 2009, we issued a Communication on Progress report underlining our actions to date.
We now audit all our main suppliers with regard to their employment practices. The practice was initiated two years ago and we constantly seek to improve communication with suppliers and gain more feedback from them.
We are also making progress with our Code of Conduct. In 2009, more than 65% of all employees signed the code and it was incorporated into the induction process for new employees. In 2010 our Code of Conduct will be included in performance appraisals.
In 2009, we also updated our “Equal Treatment of Employees & Harassment” policy, which states that we do not condone favouritism or inequality in any shape or form.
In 2009, Hikma Pharmaceuticals was awarded the Best Company in an Emerging Market Award at the annual Scrip Awards. This award is testament to the continued progress the Company is making to be a leader in the MENA region across all areas of its business including CR.
CommunityActive and effective engagement with the community is an essential part of our CR strategy.
The Hikma Global Volunteering Day, held in April each year, aims to encourage employees across the Group to invest time in their local communities. The number of participants more than doubled this year – from 500 in 2008 to 1,200 in 2009. Aligned with our business objectives, the Volunteering Day aims to support better health in our local communities.
This year, staff worldwide participated in a variety of charitable activities, including donating blood, cleaning hospitals, kindergartens and orphanages and spending time with the children, and raising money for research.
Of course, we are active in our communities throughout the year through a number of other initiatives, including providing funding for students in the fields of Technical Pharmacy and Applied Medical Sciences. The time, interest and funding that we provide to local students is a real indication of our ongoing commitment to the communities in which we work. Over the long term, these efforts should also help to ensure that we can continue to attract well-trained employees in each of the markets in which we are operating.
Across the MENA region, Hikma volunteers also supported poor local communities, providing financial and practical assistance to those in need. In the United States, fundraising was undertaken and support was given to local homeless groups, disadvantaged families and the elderly.
Hikma has also partnered with the Global Fund to fight Aids, TB and Malaria. In 2009, the Company and the Samih Darwazah Foundation donated the seed money to establish the MENA Chapter of the Global Fund. This is located in Amman Jordan, and will operate across the Middle East and North Africa. A board of directors has been selected, an executive director has been hired and in 2010, the Chapter will launch its first awareness and advocacy campaigns.
Across the Group, we continued through 2009 to give generously to local causes, donating medicines to NGOs and communities in crisis. Our employees also volunteered their time to many NGOs worldwide.

46 Hikma Pharmaceuticals PLC Annual report 2009
Corporate and social responsibility report continued
Diesel consumption decreased in Algeria
-21% Energy consumption
EnvironmentHikma, like every business, has an impact on the environment, both locally and globally. We are working towards limiting that impact by educating our staff and encouraging them to think about their effect on the environment in everything they do. We are also actively exploring ways in which we can reduce carbon emissions across the Group and reduce waste, particularly harmful waste.
Hikma’s Environmental Policy five key pledges:
to integrate our environmental policy across 1. the Group;
to reduce our impact on climate change;2.
to comply with environmental legislation and 3. regulation in every country in which we operate;
to strive for continuous improvement in our 4. environmental protection; and
to implement and develop ISO 14001 or its 5. equivalent at every production site across the Company.
In 2008, we made good progress in this area, obtaining the ISO 14001 certification at our AMC facility and our Hikma Jordan facility. In 2009, both facilities gained the continuity certificate. In 2010, we are committed to continuing our work on ISO 14001 and exploring more international accreditations.
GRI data collection continued to heighten awareness of energy usage in 2009 and helped to identify ways to drive a reduction in energy consumption across our business units. The collection and analysis of data improved considerably in 2009 and we expect to report further progress in 2010.
In many units, real advances have been made in energy and water consumption since 2008. In Algeria, electricity consumption fell 11% year on year from 1.5 million KWh to 1.3 million KWh while diesel consumption was 21% lower at 57,000 litres over the same period. The business also intends to drive forward a more aggressive recycling programme and incinerate hazardous waste in a more effective manner.
Hikma Jordan and AMC reduced diesel consumption by at least 10%, thanks to a concerted effort to be more energy efficient.
Hikma Jordan’s water consumption fell dramatically, from 44,674 cubic metres to 27,168 cubic metres, Portugal reduced water consumption by 15% to 74,431 cubic metres and Saudi Arabia cut water consumption by 16% to 47,430 cubic metres.
Across the Group, Company vehicles have been upgraded to more environmentally efficient options. In addition, there is an ongoing and regularly reinforced awareness campaign, which stresses Hikma’s desire to reduce its environmental impact and stresses the part that each and every employee can play in this endeavour. We will be reporting back on our progress to all our stakeholders.
Following initial work in 2009, Hikma will be assessing its carbon emissions in Jordan during 2010. This analysis is based on the Carbon Disclosure Project framework and will provide valuable insights across the Group on how to measure our emissions and take steps to reduce our emissions as a Group in the coming years.
Moving forward – our five-year planWe have designed a five-year plan taking us from 2010 to 2015. This revolves around two broad themes, wellbeing and education. Wellbeing is intrinsically linked to our role in the pharmaceutical industry and our core duty of care to those around us. Education is integral to the effective development of the Company and the communities we serve.
These themes will be a reference point for our CR efforts over the next five years and within this framework, we have created four key areas of focus: our people, our community, our environment and global welfare, which reflects our awareness of the need to enhance health and wellbeing wherever we operate and wherever we do business. While we have implicitly recognised these areas as being of crucial importance in the past, explicit recognition will, we believe, allow us to reinforce our efforts to drive CR internally and on the world stage.

47
Delivering Responsibly
OUR PLATFORMS
Community
Hikma does not exist in isolation. It wishes to engage in its local communities, recognising the importance of establishing a strong community footprint in all countries of operation
Aim
Building our brand
People
Our people are our greatest asset. They are ambassadors for the Company and we aim to support them as fully as possible, in terms of training, welfare, recognition and supporting diversity
Aim
Making us stronger
Environment
Mitigating our environmental impact should be offered as standard by Hikma as a company. We should promote a sustainable presence in our communities through recycling, waste reduction and energy efficiency
Aim
Efficient use of resources
Ethics
Hikma should encourage all counterparties to adopt the policies and behaviours of Hikma, and to support the high levels of ethical business practice undertaken by Hikma
Aim
Preferred partner for business
– Partnership with the Jordan River Foundation
– Global Volunteering Day
– Fundraising for local homeless groups, disadvantaged families and the elderly
– Professional and technical training and development
– Transparent remuneration structure with job grading and levelling
– Compliance with health and safety regulation
– “You are Hikma”
– Energy and water conservation, recycling and waste management
– Solvency recovery pilot
– Member of UN Global Compact
– Member of PACI
– Audit of main suppliers’ employment practices
ACTING RESPONSIBLY
– Partnering with the Global Fund to fight AIDS, TB and Malaria
– Distribution of free medicines
– Local fundraising for research and treatment of chronic diseases
– Hikma’s Day against Breast Cancer
– Hikma’s Day against Diabetes
– Free breast exams and mammograms for all employees
– Local clean water initiatives
– Focus on hazardous waste reduction
– Stakeholder engagement
– Adherence to highest quality standards across our global business
WELLBEING
– Funding students in the fields of Technical Pharmacy and Applied Medical Sciences
– Educational bursaries
– Community open days at Hikma
– Internships and work experience
– Staff education seminars
– Awareness sessions on key diseases
– Health and safety training for all employees
– Environmental awareness lectures
– Awareness campaigns
– Staff training
– Staff training on Global Compact principles
– Incorporating Code of Conduct in induction training
EDUCATION
– EC1 – Direct economic value generated (including revenues, costs, donations, investments)
– EC8 – Development and impact of infrastructure investments for public benefit
– LA7 – Rates of injury, disease, lost days, absenteeism
– LA10 – Average hours of training per employee per category
– SO3 – Percentage of employees trained in anti-corruption policies
– EN3 – Direct energy consumption
– EN8 – Total water withdrawal
– EN22 – Total weight of waste
– PR1 – Life cycle stages in which H&S impact of products are measured for improvements
– HR2 – Percentage of suppliers/contractors undergone human rights screening
GRI REPORTING

48 Hikma Pharmaceuticals PLC Annual report 2009

49
Governance and financial results
Section Four
4
Governance and fi
nancial results
50 Board of Directors
52 Senior management
54 Corporate Governance report
60 Directors’ report
63 Remuneration Committee report
75 Directors’ Responsibility Statement
76 Independent auditors’ report
77 Consolidated financial statements
82 Notes to the consolidated financial statements
122 Company financial statements
125 Notes to the Company financial statements
129Shareholder information
131 Principal Group Companies
132 Advisers

50 Hikma Pharmaceuticals PLC Annual report 2009
Board of Directors
Samih Darwazah Non-Executive Chairman, 79
Samih Darwazah, remained as Chairman of the Company following his resignation as Chief Executive Officer in July 2007.
Prior to forming Hikma Pharmaceuticals Ltd in 1978 Mr Darwazah held various managerial positions with Eli Lilly. Between 1995 and 1996 he served as Minister of Energy and Mineral Resources in Jordan and was a member of the Advisory Economic Council to His Majesty the King of Jordan. He also founded the Jordan Trade Association. Samih is a qualified pharmacist and holds a masters degree from the St. Louis College of Pharmacy, Missouri. He is also Chairman of Labatec – Pharma SA.
Said Darwazah Chief Executive Officer, 52
Said was appointed Chief Executive Officer in July 2007. He joined Hikma in 1981, and was Chairman and CEO of the Group holding company from 1994–2003.
Said played a key role in the development of the Group strategy during his tenure, including the acquisition of West-ward Pharmaceuticals in the USA and the development of the Injectables business in Europe and the MENA region. During this period the Company’s facilities in the USA, Jordan, and Portugal, received FDA approval. Said was Minister of Health for the Hashemite Kingdom of Jordan from 2003–2006. He is currently a member of the board of Central Bank of Jordan and Chairman of the Dead Sea Touristic and Real Estate Investments and the Health Care Accreditation Council of Jordan. He has a degree in Industrial Engineering from Purdue University (USA) and an M.B.A. from INSEAD.
Ali Al-Husry Non-Executive Director, 51
Ali Al-Husry was appointed as a Non-Executive Director in 2005. He joined Hikma as Director of Hikma Pharma Limited in 1991 and has held various directorships within the Group. For these reasons Ali is not considered an independent director.
In 1995 he was a founder of The Capital Bank of Jordan and was Chief Executive Officer until 2007 where he continues to be a director. He is Chairman of Endeavour Jordan, a director of the Microfund for Women and a member of the Board of Trustees of the Jordan Museum. He brings great financial experience to the Board as well as an in-depth knowledge of the MENA region and Hikma Pharmaceuticals. Ali has a degree in Mechanical Engineering from the University of Southern California and an M.B.A. from INSEAD.
Mazen Darwazah • Executive Vice-Chairman, CEO of MENA, 51
Mazen Darwazah was appointed Executive Vice-Chairman in 2005. Since joining Hikma in 1985 he has held various positions within the Group, including Chairman and CEO of Hikma Pharmaceuticals Limited (Jordan). As CEO of the MENA business Mazen is responsible for the strategic development of the business in this region.
Mazen is also a director of the Jordan International Insurance Company and holds a number of non executive directorships of various non-governmental and educational organisations. He has previously served as the President of the Jordanian Association of Manufacturers of Pharmaceuticals and Medical Appliances. Mazen holds a B.A. in Business Administration from Beirut University, Lebanon.

51
Governance and fi
nancial results
Breffni Byrne *† Independent Non-Executive Director, 64
Breffni Byrne was appointed to the Board in October 2005 and is Chairman of the Audit Committee.
As a chartered accountant with over 30 years of experience in public practice, including significant international responsibilities, he has extensive experience in financial reporting, international operations, corporate governance and general financial and commercial matters. Breffni is Chairman of NCB Stockbrokers, a non-executive director of Irish Life and Permanent plc, Cpl Resources plc, Coillte Teoranta (the Irish state forestry company) and other companies.
Dr. Ronald Goode *† Independent Non-Executive Director, 66
Ronald Goode was appointed to the Board in December 2006. Ron has spent over 30 years in the international pharmaceutical industry, including senior positions with Pfizer and Searle.
He is currently the Chairman of The Goode Group, advisers to the pharmaceutical industry, on the Advisory Board of ART Recherches et Technologies Avancees Inc. (a TSX-listed company), a director of Mercy Ships International and a trustee of Thunderbird School of Global Management. He was formerly President and Chief Executive Officer of Unimed Pharmaceuticals, Inc. and eXegenics Inc.
Board Committee membership key* Audit Committee† Remuneration Committee• Nomination Committee
Micheal Ashton *†• Independent Non-Executive Director, 64
Michael Ashton was appointed to the Board in October 2005 and is Chairman of the Remuneration Committee.
Michael has over 30 years experience in the pharmaceutical industry, having previously held positions with Pfizer, Inc. and Merck, Inc. He was formerly Chairman, President and Chief Executive of Faulding, Inc and Chief Executive of Skyepharma PLC. He is also a non-executive director at Transition Therapeutics, Proximagen Neuroscience plc and Phosphagenics Limited.
Sir David Rowe-Ham *†• Senior Independent Non-Executive Director, 74
Sir David Rowe-Ham was appointed to the Board in October 2005 and holds the position of Chairman of the Nomination Committee.
Sir David brings to Hikma a wide experience in financial matters, corporate governance, public affairs and the development of listed companies. He is also Chairman of Arden Partners plc and Olayan Europe Ltd.
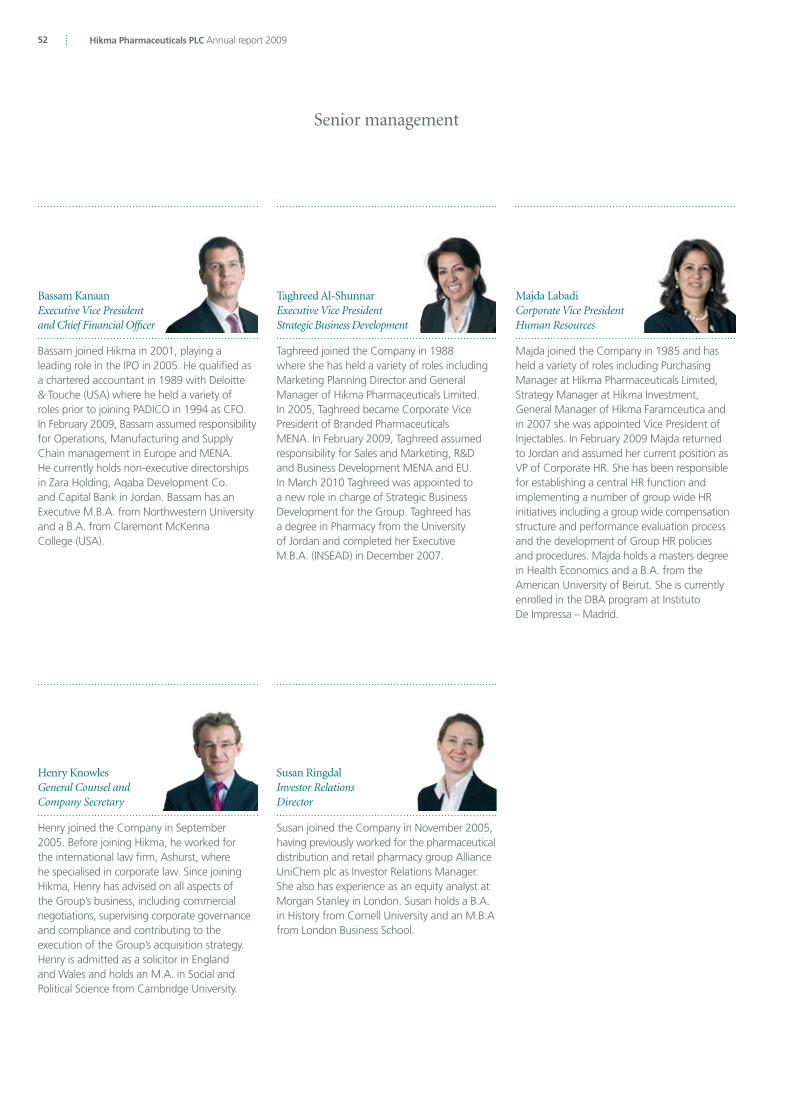
52 Hikma Pharmaceuticals PLC Annual report 2009
Senior management
Henry Knowles General Counsel and Company Secretary
Henry joined the Company in September 2005. Before joining Hikma, he worked for the international law firm, Ashurst, where he specialised in corporate law. Since joining Hikma, Henry has advised on all aspects of the Group’s business, including commercial negotiations, supervising corporate governance and compliance and contributing to the execution of the Group’s acquisition strategy. Henry is admitted as a solicitor in England and Wales and holds an M.A. in Social and Political Science from Cambridge University.
Bassam Kanaan Executive Vice President and Chief Financial Officer
Bassam joined Hikma in 2001, playing a leading role in the IPO in 2005. He qualified as a chartered accountant in 1989 with Deloitte & Touche (USA) where he held a variety of roles prior to joining PADICO in 1994 as CFO. In February 2009, Bassam assumed responsibility for Operations, Manufacturing and Supply Chain management in Europe and MENA. He currently holds non-executive directorships in Zara Holding, Aqaba Development Co. and Capital Bank in Jordan. Bassam has an Executive M.B.A. from Northwestern University and a B.A. from Claremont McKenna College (USA).
Taghreed Al-Shunnar Executive Vice President Strategic Business Development
Taghreed joined the Company in 1988 where she has held a variety of roles including Marketing Planning Director and General Manager of Hikma Pharmaceuticals Limited. In 2005, Taghreed became Corporate Vice President of Branded Pharmaceuticals MENA. In February 2009, Taghreed assumed responsibility for Sales and Marketing, R&D and Business Development MENA and EU. In March 2010 Taghreed was appointed to a new role in charge of Strategic Business Development for the Group. Taghreed has a degree in Pharmacy from the University of Jordan and completed her Executive M.B.A. (INSEAD) in December 2007.
Majda Labadi Corporate Vice President Human Resources
Majda joined the Company in 1985 and has held a variety of roles including Purchasing Manager at Hikma Pharmaceuticals Limited, Strategy Manager at Hikma Investment, General Manager of Hikma Faramceutica and in 2007 she was appointed Vice President of Injectables. In February 2009 Majda returned to Jordan and assumed her current position as VP of Corporate HR. She has been responsible for establishing a central HR function and implementing a number of group wide HR initiatives including a group wide compensation structure and performance evaluation process and the development of Group HR policies and procedures. Majda holds a masters degree in Health Economics and a B.A. from the American University of Beirut. She is currently enrolled in the DBA program at Instituto De Impressa – Madrid.
Susan Ringdal Investor Relations Director
Susan joined the Company in November 2005, having previously worked for the pharmaceutical distribution and retail pharmacy group Alliance UniChem plc as Investor Relations Manager. She also has experience as an equity analyst at Morgan Stanley in London. Susan holds a B.A. in History from Cornell University and an M.B.A from London Business School.

53
Governance and fi
nancial results
Khalid Nabilsi Corporate Vice President for Finance
Khalid joined Hikma in 2001 and was a member of the IPO team in 2005. Prior to assuming his current role Khalid held several senior positions in the Finance department including Group Financial Controller. Following qualification as a CPA he held a variety of roles in financial accounting, reporting and financial advisory services, most recently with Atlas Investment Group where he was involved in merger and acquisition advisory services. Prior to Atlas, Khalid has managed several multinational audit engagements at Arthur Andersen in Amman, Jordan. Khalid has an M.B.A. from the University of Hull in the UK.
Fadi Nassar Corporate Vice President Active Pharmaceutical Ingredients (API)
Fadi joined Hikma in 1988 and has worked in various roles within the Group including Operations, Purchasing and Business Development. He was promoted to Corporate Vice President, API in 2007. Fadi holds a bachelors degree in Chemical Engineering from Newcastle University and a masters degree in Chemical Engineering from Leeds University. Fadi is also a graduate of INSEAD’s International Executive Program.
Michael Raya Corporate Vice President and CEO West-Ward
Michael joined the Company in 1992 from Vitarine Pharmaceuticals where he worked from 1984 until 1992 in various roles, including Vice President, Quality Control. Prior to this, Michael worked at Schering-Plough and Hoffman LaRoche. Michael joined Hikma in 1992 and was appointed CEO of West-Ward in 2009, where he has been instrumental in the turnaround of the company and the globalisation of the product portfolio. Michael holds a masters degree in Industrial Pharmacy from Long Island University and a bachelor’s degree in Chemistry from St. Francis College. Michael is also a graduate of INSEAD’s International Executive Program.
Ragheb Al-Shakhshir Corporate Vice President Research and Development
Ragheb joined Hikma in 2000 as a Research & Development Manager. Prior to joining Hikma he held a variety of roles as Senior Scientist at Novartis Pharmaceuticals, and at Alcon Labs. From 2003-2008 Ragheb led the Hikma R&D Injectable team and from February 2009 assumed the responsibility of Vice President for Research and Development. Ragheb has a PhD in Industrial and Physical Pharmacy from Purdue University and a B.A. in Chemical Engineering from the University of Wisconsin-Madison.
Dr Ibrahim Jalal Senior Corporate Vice President Technical Affairs
Ibrahim joined Hikma in June 1979 as Technical Director and has held a variety of roles including Corporate Technical Vice President for Compliance and Senior Corporate Vice President for R&D. He has played a leading role in Hikma securing FDA approval for its manufacturing units. Ibrahim holds a PhD in Pharmacy from the University of Wisconsin/Madison (USA).

54 Hikma Pharmaceuticals PLC Annual report 2009
Combined codeThe Board is responsible for, and committed to, meeting the standards of good corporate governance set out in the Combined Code on Corporate Governance published by the Financial Reporting Council in June 2008 (the “Combined Code”) and the corporate governance principles set out in the Markets Law of the Dubai Financial Services Authority (the “Markets Law”) (together the “Corporate Governance Principles”). This report, the Audit Committee report set out on pages 57 to 59 and the Remuneration Committee Report set out on pages 63 to 74 describe how the Board applied the Corporate Governance Principles during the year under review.
The Listing Rules of the Financial Services Authority and the Markets Law require the Group to report on their application of the principles of good governance and the extent of their compliance with the Corporate Governance Principles. This statement provides details on how the Group has applied these principles.
During the year under review, the Company applied the principles set out in Section 1 of the Combined Code, including both the main principles and the supporting principles, and the Corporate Governance Principles. At the year end the Company was in full compliance with the Corporate Governance Principles.
The BoardThe Group is led and controlled by the Board of Directors.
The Board is responsible for setting the strategic direction and monitoring the financial performance of the Group against its targets. The Board also promotes good corporate governance within the Group, and ensures that the Group meets its responsibilities to shareholders, employees, suppliers, customers and other stakeholders. There is a formal schedule of matters reserved to the Board for consideration and decision, which is reviewed and, if necessary updated, annually. This includes approval of strategic plans, approval of financial statements and the annual Group budget, approval of material investment decisions, acquisitions and divestments, and review of the effectiveness of the Group’s systems of internal control.
The Board delegates its powers to the CEO who is responsible for delivering the company’s strategic objectives and is assisted in this task by the executive management team.
The senior management team who report directly to the CEO meet with him to discuss strategy and key objectives for their areas of responsibility. The CEO reports on operational progress in these areas to the Board and the key senior management team present to the Board, as appropriate, to highlight and debate developments in their business.
Composition of the BoardThe Board comprises eight members, half of whom are independent: a Non-Executive Chairman, five Non-Executive Directors, one of whom is not classified as independent for the purposes of the Combined Code and two Executive Directors. The Board considers the independence of the Non-Executive Directors on an annual basis during the corporate governance review that takes place in December each year.
The names of the Directors and their biographical details are set out on pages 50 and 51. The Chairman and the Executive Vice-Chairman were appointed to the Board on the incorporation of the Company on 8 September 2005. The Chief Executive Officer was appointed to the Board on 1 July 2007, and save for Ronald Goode, who joined the Board on 12 December 2006, each of the Non-Executive Directors joined the Board on 14 October 2005. The Non-Executive Directors have diverse business backgrounds, skills and experience and as such bring independent judgement to bear on issues of strategy, performance, resources, key appointments, standards of conduct and other matters presented to the Board. In 2010, Ronald Goode offers himself for re-election at the Annual General Meeting.
The roles of the Chairman and Chief Executive Officer are separate, and the Board has approved a statement of their responsibilities in writing. These guidelines are reviewed annually by the Board. Prior to the appointment of the current Chief Executive Officer the Board undertook consultation with its major shareholders and external advisers regarding the continuation of Samih Darwazah in his role as Chairman. The Board concluded that his former executive role should not prevent him from remaining as Chairman, especially as he has an in-depth understanding of the Group and the business and is able to provide a valuable contribution in his capacity as Non-Executive Chairman.
The Board does not classify Ali Al-Husry as an independent Director for the purposes of the Combined Code as a result of his involvement with Darhold Limited, the Company’s largest shareholder. He was also a Director of Hikma Pharmaceuticals Limited prior to the Company’s listing. However, he continues to bring broad financial experience to the Board as well as a detailed knowledge of the MENA region which is significant to the Group’s business.
The Senior Independent Director is Sir David Rowe-Ham who remains available to shareholders should they have concerns that they do not wish to raise with the Chairman. Sir David is also Chairman of the Nomination Committee and is responsible for chairing the meetings of Non-Executive Directors conducted without the presence of the Chairman or executive management.
The Board continues to discuss its composition and the skills and business experience of its members. All of the directors believe in the necessity for challenge and debate in the boardroom and consider that the Board relationships encourage honest and open debate with the Executive Directors. Furthermore the Non-Executive Directors maintain strong relationships outside the timetabled board meetings with senior executive management and visit company subsidiaries regularly. They believe that the Board’s decision making process is inclusive, and is not dominated by any individual or group of individuals.
Information flowBoard and committee papers are circulated to members in advance of the meetings. In addition to formal meetings, the Chairman and Non-Executive Directors maintain regular contact with each other and executive management outside the formal Board timetable. The Chairman also holds informal meetings with Non-Executive Directors without the executive management present to discuss issues affecting the Group. Senior executives attend Board meetings and make presentations on the results and strategies of their business units.
Corporate Governance report

55
This year the Board received presentations from all members of the senior management team on their areas of responsibility. Strategic presentations were received on human resources, sales, compliance, supply chain management, finance and operations. Each of the senior executives has been scheduled to update the Board on their initiatives during the course of 2010.
All Directors have access to the advice and services of the Company Secretary, who is responsible for ensuring that good board procedures are followed and for advising the Board through the Chairman on all matters of corporate governance. The appointment and removal of the Company Secretary is a matter reserved for the Board. To the extent necessary, the Directors are able to obtain independent professional advice at the Company’s expense in the performance of their duties as directors.
Board Training/Continuing Professional DevelopmentThe Directors maintain a close dialogue between Board meetings, ensuring that, amongst other things, the Non-Executive Directors are kept up to date with major developments in the Group’s business. The Board is also encouraged to visit the major business units and to meet the senior management teams in order to facilitate a better understanding of the key issues facing the business. In the year under review, the July Board meeting was held at the Group’s facilities in Portugal where the Board had access to the senior management team and reviewed the construction and progress of the new lyophilisation plant. The Company’s brokers and financial advisers presented industry and market updates to the board four times in 2009. These sessions are in addition to the written briefings on areas of regulatory and legislative change presented at each Board meeting in the form of the Corporate Governance Paper. This year briefings took place on the Companies Act 2006, the Walker Review, the FRC Review of Combined Code, Listing Rules Review and the Bribery Bill. The Non-Executive Directors have attended a number of training sessions specifically aimed at Non-Executive Directors addressing the Walker Review and other corporate governance topics.
Board meetingsDuring the year under review the Board held eight scheduled meetings and one unscheduled meeting. The Company Secretary attended all Board Meetings and Committee Meetings. A table showing attendance at these meetings is set out below. To the extent directors are unable to attend additional meetings called on short notice, or are prevented from doing so by prior commitments, they receive and read the papers for consideration at that meeting, relay their comments in advance and, where necessary, follow up with the Chairman on the decisions taken.
Board performance evaluation The Non-Executive Directors, other than Ronald Goode, were re-elected on 14 May 2009, having first been elected by shareholders on 25 May 2006. Said Darwazah was appointed on 1 July 2007 and elected by shareholders on 15 May 2008. Ronald Goode who was appointed on 12 December 2006 will be seeking re-election by shareholders at the AGM on 13 May 2010. He was first elected by shareholders at the AGM on 6 June 2007. All Directors are subject to re-election at intervals of no more than three years. Non-Executive Directors are appointed for an initial term of three years, which can be renewed and extended for not more than two further three-year terms.
As required by the Combined Code, a formal evaluation of the performance of the Board, the Chairman, the Committee Chairmen and the individual Non-Executive Directors was undertaken during the period under review.
During 2009 the Board reviewed its approach to Board evaluations and approved a three year evaluation process, which includes seeking external consultation every third year. In 2009 the Board evaluation was managed internally by the Senior Independent Director. In 2010 the Board will continue to review its performance internally with the assistance of a consultant and in 2011 it will seek an externally moderated evaluation.
This year the Board refreshed its approach to the appraisal process using a new format of questions specifically targeted on the quality of decision making and information made available to the Board. As in previous years the evaluation process was led by the Senior Independent Director, who met with each of the Directors and the Committee Chairmen to undertake an appraisal of the performance of the Board, its Committees and each of the individual Directors. The results of the evaluation process and feedback were reviewed with the Chairman and formed part of his appraisal of the overall effectiveness of the Board and its members. Overall the review concluded that the Board functions well, with good communication, and with issues raised in good time to allow for consultation, debate and effective decision-making. Recommendations were made regarding the enhancement of some of the information provided to the Board and amendments to the Board timetable and these are being implemented in 2010.
In addition to the matters set out above in respect of all Directors, the Senior Independent Director met with the Non-Executive Directors to undertake a formal appraisal of the performance of the Chairman. This review addressed the effectiveness of his leadership, the setting of the Board agenda, communication with shareholders, internal communication and Board efficiency. The Non-Executives concluded that the Chairman gave clear leadership and direction to the Board, and where necessary implemented changes and managed the agenda to reflect the changing business environment in 2009.
Governance and fi
nancial results
Meeting record Board Audit Remuneration Nomination
Meetings held 9 8 6 2
Samih Darwazah 9 – – –
Said Darwazah 9 – – –
Mazen Darwazah 9 – – 2
Ali Al-Husry 8* – – –
Michael Ashton 9 8 6 2
Breffni Byrne 9 8 6 –
Sir David Rowe-Ham 9 8 6 2
Ronald Goode 9 8 6 –
*Ali Al-Husry missed one Board meeting due to other commitments.
Board meetings
56 Hikma Pharmaceuticals PLC Annual report 2009
Corporate Governance report continued
Directors’ service arrangements and terms of appointmentDetails of the Executive Directors’ service arrangements and Non-Executive Directors’ letters of appointment are contained in the Remuneration Committee Report on pages 64 to 70.
Directors’ remunerationDetails of the remuneration of the Executive and Non-Executive Directors are contained in the Remuneration Committee Report set out on pages 64 to 70.
Board committeesIn accordance with the principles of good corporate governance and in compliance with the Combined Code and the Markets Law, the Board maintains three committees - the Audit Committee, Nomination Committee and Remuneration Committee.
Each of the three Combined Code committees has terms of reference, which were reviewed during the year. Copies are published on the Company’s website at www.hikma.com. The Chairman give regular reports of the Committees’ business to the Board.
Other CommitteesThe Group also has an Ethics Committee and a Corporate Social Responsibility Committee, which draw their members from the Board and senior management of the Group.
Nomination CommitteeThe Nomination Committee consists of two independent Non-Executive Directors – Sir David Rowe-Ham (Committee Chairman) and Michael Ashton – and the Executive Vice Chairman, Mazen Darwazah. As required by the Corporate Governance Principles, the majority of the members of the Committee are independent Non-Executive Directors and an independent Non-Executive Director holds the Chairmanship of the Committee.
The Nomination Committee is responsible for succession planning and for ensuring that all appointments to the Board are made on objective criteria. In accordance with its terms of reference, the Committee is required to take into account the skills, knowledge and experience of the Board in making its decisions and is able to use external search firms or open advertising to compile shortlists of candidates for the Board. It is also charged with reviewing the appropriateness of the size, structure and composition of the Board.
The Nomination Committee met twice during the year, with full attendance. It met to discuss and review succession planning and to discuss the performance evaluation and appraisal system for the Board.
Remuneration CommitteeThe Remuneration Committee consists of the Company’s four independent Non-Executive Directors – Michael Ashton (Committee Chairman), Breffni Byrne, Sir David Rowe-Ham and Ronald Goode. The Remuneration Committee therefore complies with the membership requirements laid out in the Corporate Governance Principles.
The Committee met six times during the year with full attendance. The Committee is responsible for setting and reviewing executive remuneration and that of the Company Secretary and is able to take advice from external consultants when required. A full report on the role of the Remuneration Committee is set out in the Remuneration Committee Report on page 63. During the year under review, there has been close co-operation between the new corporate Head of HR and the Chairman of the Remuneration Committee to ensure that executive remuneration policies and structure are appropriate and adequately reflect the remuneration structures and policies in place for the Group’s employees as a whole.
Audit CommitteeThe Audit Committee consists of four independent Non-Executive Directors – Breffni Byrne (Committee Chairman), Michael Ashton, Sir David Rowe-Ham and Ronald Goode. The Audit Committee therefore complies with the membership requirements laid out in the Corporate Governance Principles.
The Committee met eight times during the year with full attendance. A full report of the role of the Audit Committee and details of how it carried out its duties is set out in the Audit Committee report on pages 57 to 59.
Ethics CommitteeThe Ethics Committee is chaired by Ronald Goode and draws its members from the Board and senior management across the Group. The Ethics Committee meets on an ad hoc basis to respond to issues as they arise across all areas of the Group’s business. Thus, the Committee is responsible for the oversight of all of statements and policies on ethics, conduct, values and principles within the Group.
CR Steering CommitteeThe CR Steering Committee is chaired by the Executive Vice-Chairman, Mazen Darwazah and draws its members from the Board (Ronald Goode) and senior management. The CR Steering Committee is responsible for reviewing the strategy and direction of the Group’s social, community and environmental programme. The Committee is also responsible for the oversight of the CR Working Committee to undertake the implementation of the Group’s CR programme.
Internal ControlThe Board has overall responsibility for the Group’s systems of internal control and risk management and has complied with the requirements of the Corporate Governance Principles in establishing a continuous process for identifying, evaluating and managing the risks the Group faces. The Board is responsible for monitoring the effectiveness of these systems on an ongoing basis and, at least annually, conducting a formal review of the Group’s policies on internal control. The system of internal control provides reasonable but not absolute assurance against material misstatement or loss.

57
Governance and fi
nancial results
The key elements are as follows:
a reporting structure with clear procedures, authorisation limits, segregation of duties and delegated authorities;
annual budgets and updated forecasting for the Group that identify risks and opportunities which are reviewed and approved by the Board;
a comprehensive system of internal financial reporting which includes regular comparison of financial results and key performance indicators against budget and forecast, informed by management commentary;
a clearly defined process for controlling capital expenditure and other financial commitments, including appropriate authorisation levels, which are monitored and approved by the Board as appropriate;
written policies and procedures for all material functional areas with specific responsibility allocated to individual managers.
During the year under review, Ernst & Young continued its management and execution of the Group’s internal audit function on a global basis under a three year contract which commenced in 2009. This involves a risk-driven approach to internal audit which is overseen by the Audit Committee. The internal audit process focuses on reviewing areas of business risk, internal controls, financial reporting and other systems in the Company’s main subsidiaries and at the corporate level, with regular reports of its findings made to the Audit Committee. Ernst & Young have direct access to the Audit Committee and the Board Chairman.
The Board confirms that, in accordance with the requirements of the Corporate Governance Principles, a review of the effectiveness of the Group’s systems of internal controls was conducted during the year under review.
WhistleblowingThe Group Whistleblowing Policy contains arrangements for the Chairman of the Audit Committee, the Senior Independent Director, and Ronald Goode (as a US-based member of the Audit Committee) to receive, in confidence, complaints on accounting, risk issues, internal control and other instances of allegedly improper behaviour by Group employees.
InsuranceThe Company maintains an appropriate level of Directors’ and Officers’ insurance in respect of action taken against Directors.
Audit Committee reportThe Combined Code requires that this Annual Report separately describes the work of the Audit Committee and how it discharges its responsibilities.
Terms of referenceThe Audit Committee terms of reference include all matters indicated by the Corporate Governance Principles and clearly set out its authority and duties. These can be found on the Company’s website at www.hikma.com and are summarised as follows:
monitor the integrity of the financial statements and any other formal announcement relating to the Group’s financial performance and review summary financial statements and interim management statements;
review and challenge accounting policies and accounting for significant or unusual transactions;
review and challenge the adoption of accounting standards, estimates and judgements and the clarity of disclosure in financial reports;
review and challenge compliance with stock exchange, UK Listing Authority and legal requirements including the requirements of the Combined Code and Markets Law;
review arrangements for employees to raise concerns, in confidence, about possible wrongdoing in financial reporting or other matters;
monitor and review the internal financial controls and the Group’s overall risk identification and management systems;
consider and approve the remit and effectiveness of the internal audit function, its annual plan, its resources and access to information and its freedom from management or other restrictions;
review and monitor management’s responsiveness to the findings and recommendations of the internal auditors;
consider and make recommendations for appointment, re-appointment and removal of the Company’s external auditor, and oversee the relationship with the external auditor;
review and monitor the quality, independence and objectivity of the external auditor (accounting for relevant UK and professional regulatory requirements) and approve their remuneration and terms of engagement;
develop and implement a policy on the supply by the external auditor of non-audit services, taking into account relevant ethical guidance and potential conflicts of interest.
The Audit Committee’s terms of reference were reviewed by the Audit Committee during the period under review and were subsequently reviewed and approved by the Board.
58 Hikma Pharmaceuticals PLC Annual report 2009
CompositionHikma’s Audit Committee comprises four members – Breffni Byrne, Michael Ashton, Sir David Rowe-Ham, and Ronald Goode – all of whom are independent Non-Executive Directors, and whose biographical details are set out on page 51. The Committee is chaired by Breffni Byrne, who is a chartered accountant and who is considered by the Board to have recent and relevant financial experience. No members of the Committee have links with the Company’s external auditors. The Company therefore considers that it complies with the Corporate Governance Principles regarding the composition of the Audit Committee. The Committee Chairman receives additional remuneration to compensate him for his additional responsibilities.
Responsibilities The Audit Committee assists the Board in discharging its responsibilities with regard to financial reporting, external and internal audit and internal control. This includes reviewing the Company’s annual report and financial statements, interim report, Interim Management Statements and trading updates, reviewing and monitoring the extent of non-audit work undertaken by external auditors, and monitoring the effectiveness and output of the Company’s internal audit activities, internal controls and risk management systems. The Audit Committee is also responsible for making recommendations to the Board on the appointment, re-appointment and removal of the external auditors, as well as the effectiveness of the audit process. The ultimate responsibility for reviewing and approving the annual report and financial statements and the half-yearly reports remains with the Board. The Board has also delegated responsibility for the operation of the Company’s policies on monitoring directors’ conflicts of interest to the Audit Committee and thus has been included in the Audit Committee’s terms of reference.
MeetingsThe Audit Committee met eight times during the year under review, with the Chief Financial Officer and the Company Secretary in attendance. The Audit Committee reviewed the 2008 annual report & financial statements, the 2009 interim report, the two Interim Management Statements released by the Company and each of the regulatory statements made by the Company in respect of trading and results issued during the year. The Committee also reviewed and approved the audit plans for 2010 for both internal and external auditors and the related scope of internal audit work to be undertaken. The Committee reviewed the effectiveness of the Group’s internal controls and risk management processes and the disclosures made in the annual report & financial statements on these matters and reported on these to the Board. The Committee also reviewed its own terms of reference and general effectiveness, both specifically and in the context of the overall annual review of corporate governance matters conducted by the Company.
The Group’s external auditors, Deloitte LLP, attended four Audit Committee meetings for the purposes of presenting their 2008 audit results and findings, the results of the 2009 interim review and their audit plan for 2010. The internal auditors, Ernst & Young presented the results of their audit programme for 2009 to the Audit Committee together with their proposed audit plan for 2010. The Audit Committee continues to review the response by management, proposed action plans and the overall effectiveness of the internal audit function. In accordance with the Combined Code, the Audit Committee also met with the Group’s external auditor and internal auditor without executive management present.
In addition, during 2009, the Audit Committee Chairman met with external auditors in the USA and Portugal. The Audit Committee Chairman also met with Ernst & Young in Jordan to discuss the results of the 2009 internal audit programme.
Attendance of members at Audit Committee meetings is shown on page 55 of the Corporate Governance report.
External auditorsThe Audit Committee is responsible for the development, implementation and monitoring of the Group’s policy on external audit. Oversight and responsibility for monitoring the independence and objectivity of the external auditors lies with the Audit Committee, and day-to-day responsibility with the Chief Financial Officer. The Audit Committee is also the point of primary contact for contact with the Board. The Group has adopted a policy in relation to the provision of non-audit services by the external auditors. The policy also sets out the categories of non-audit services which the external auditors will and will not be allowed to provide to the Group.
In line with audit independence requirements the external auditor does not provide services such as information system design and valuation or advocacy work which could be considered to be inconsistent with the audit role. In addition, audit-related and non-related services provided by the external auditor in excess of certain monetary limits require prior approval by the Audit Committee. The Committee has reviewed the non-audit services provided by the external auditor and is satisfied that the nature of these services has not compromised the auditor’s independence.
Fees paid in respect of audit, audit-related and non-audit services are outlined in Note 6 to the Consolidated Financial Statements. Audit-related services are services carried out by the external auditor by virtue of its role as auditor and principally include assurance-related work and accounting advice.
A policy has also been adopted whereby prior approval by the Audit Committee is required before the recruitment of a senior member of the audit team or the recruitment of an employee of the external auditors to a senior finance position within the Group.
It is also the Committee’s policy to consider every year whether there should be an audit tender process and whether using auditors from one audit network continues to enhance the quality of the audit.
Corporate Governance report continued

59
Governance and fi
nancial results
To fulfil its responsibility regarding the independence of the external auditors, the Audit Committee reviewed:
the external auditors’ plan for the current year, noting the role of the senior statutory audit partner, who signs the audit report and who, in accordance with professional rules, has not held office for more than five years, and any changes in the key audit staff;
the arrangements for day-to-day management of the audit relationship;
the overall extent of non-audit services provided by the external auditors; and
the past service of the auditors who were first appointed in for the year ending 2004.
The Committee has considered the likelihood of a withdrawal of the auditor from the market and noted that there are no contractual obligations to restrict the choice of external auditors.
To assess the effectiveness of the external auditors, the Audit Committee reviewed:
the arrangements for ensuring the external auditors’ independence and objectivity;
the external auditors’ fulfilment of the agreed audit plan and any variations from the plan;
the robustness and perceptiveness of the auditors in their handling of the key accounting and audit judgements; and
the content of the external auditor’s reporting on internal control.
OverviewConsequently, the Audit Committee concludes that it has acted in accordance with its terms of reference and ensured the independence and reviewed the effectiveness of the external auditors. The Audit Committee also recommends to the Board that Deloitte LLP be reappointed. The Chairman of the Audit Committee will be available at the Annual General Meeting to answer questions on the work of the Committee.
Dialogue with shareholdersOngoing communication with shareholders is a high priority. The Company undertakes a continuous programme of meetings with institutional shareholders in the UK, Europe, the United States and the MENA region. This programme includes but is not limited to one-on-one meetings, investor days, conference calls and presentations at investor conferences. In addition the Company makes formal presentations at the time of its annual and interim results which are webcast and disseminated on the Company’s website. The Chief Executive Officer, Executive Vice-Chairman, Chief Financial Officer and other senior corporate executives have all participated in the investor programme during the period under review.
The Senior Independent Director and Chairman met with institutional investor protection committees who requested meetings during the year to discuss Corporate Governance matters, the business as a whole and its management.
The principal ongoing communication with shareholders is through the publication of the Company’s Annual Report and Financial Statements, Interim Results and Interim Management Statements, together with the opportunity to question the Board and Committees at the Annual General Meeting. Shareholders are encouraged to attend the AGM and if unable to do so are encouraged to vote by proxy. Copies of presentations made at the AGM are available on the website after the event together with the results of the voting. The full Board is present at the AGM. The Company maintains a website (www.hikma.com) containing financial and other information which is updated regularly. Additionally, the Company presents a balanced view of the Group’s performance and prospects through the release of appropriate press announcements and other updates.
The Board is kept updated on the views of shareholders and the market in general through the feedback from the investor meeting programme and results presentations. Analysts’ reports are circulated to the Board members together with monthly Investor Relations reports. The Investor Relations Director also presents to the Board to provide feedback from institutional investors.
Procedures to deal with conflict of interestsThe Company has implemented procedures to deal with directors’ conflicts of interest or potential conflicts of interest. Responsibility has been delegated to the Audit Committee to operate, monitor and review the procedures, which have operated effectively during the year.

60 Hikma Pharmaceuticals PLC Annual report 2009
Directors’ reportThe Directors are pleased to present their report together with the audited financial statements for the year ended 31 December 2009.
Business ReviewThe company is required by the Companies Act 2006 to set out a fair review of the business during the year and a description of the principal risks and uncertainties facing the Company, noting the performance and development of the Company during the year and the position at the year end. The information that fulfils these requirements and which is incorporated in this report by reference, is included in the following sections of the Annual Report:
a review of the business and strategy and expected future developments is set out in the Chairman’s statement on pages 6 and 7, the Chief Executive’s Review on pages 12 to 15 and the Business and Financial Review on pages 28 to 36;
the principal risks and uncertainties are set out on pages 37 to 39 and financial risks are described on page 39;
key financial performance indicators are described on page 28;
information on environmental, social and community issues is set out in our Corporate Responsibility report on pages 42 to 47;
the principal operating subsidiaries are set out on page 131;
the Corporate Governance report is set out on pages 54 to 59.
Principal activityThe principal activities of the Group are the development, manufacture and marketing of a broad range of generic and in-licensed pharmaceutical products in solid, semi-solid, liquid and injectable final dosage forms. Hikma’s operations are conducted through three business segments: Branded Pharmaceuticals, Injectable Pharmaceuticals, and Generic Pharmaceuticals. The majority of Hikma’s operations are in the MENA region, the United States and Europe.
The Group’s net sales, gross profit and operating profit are shown by business segment in Note 4 to the consolidated financial statements.
Results and dividendsThe Group’s profit for the year attributable to shareholders in 2009 was $78 million (2008: $57 million). The Board is recommending a final dividend of 6.5 cents per share (approximately 4 pence) (2008: 4.0 cents). The proposed final dividend will be paid on 27 May 2010 to shareholders on the register on 16 April 2010, subject to approval at the Annual General Meeting on 13 May 2010.
An interim dividend of 4.5 cents per share was paid on 16 October 2009 (approximately 2.8 pence per ordinary share) (2008: 3.5 cents) which together with the final dividend, will make a total of 11.0 cents per share for the period (2008: 7.5 cents)
Directors and their interestsThe names of the Directors as at the date of this report, together with details of their roles, backgrounds and abilities, are set out in the Directors’ biographies on pages 50 and 51. Details of the independence of Non-Executive Directors are set out in the Corporate Governance report on page 54.
The Executive and Non-Executive Directors served the Company throughout the year. At the 2010 Annual General Meeting, Ronald Goode will retire in accordance with Article 104 of the Articles of Association and, being eligible, will offer himself for re-election. The explanatory notes to the Notice of Annual General Meeting sets out why the Board believes Ronald Goode should be re-elected.
Details of Directors’ share-based incentives and interests in the ordinary shares of the company are provided in the Remuneration Committee Report on pages 67 to 74.
Creditor payment policyThe Company’s policy, which is also applied by the Group, is to settle terms of payment with suppliers when agreeing the terms of each transaction, ensure that suppliers are made aware of and abide by the terms of payment. Trade creditors of the company at 31 December 2009 were equivalent to 63 days’ purchases (2008: 48 days), based on the average daily amount invoiced by suppliers during the year.
Charitable and political contributionsDuring the year the Group made charitable donations of approximately $1.2 million (2008: $2.4 million), principally to local charities serving the communities in which the Group operates. Donations of medicines accounted for approximately $108,000 (2008: $1.4 million) of total donations made.
The Group does not make political donations.
Research and Development (R & D)The Group’s investment in Research & Development during 2009 represented 2.6% of group revenue (2008: 3.8%). Further details on the Group’s R&D activities can be found on page 34.
Going concernAlthough the current economic conditions may affect short-term demand for the Company’s products, as well as place pressure on our customers and suppliers in terms of liquidity issues, the Directors believe that the Group’s geographic spread, product diversity and large customer and supplier base substantially mitigate these risks. In addition, the Group operates in the relatively defensive generic pharmaceuticals industry which we expect to be less affected compared to other industries that are subject to greater cyclical changes.
The Group has $378 million of banking facilities of which $193 million were undrawn as at 31 December 2009. These facilities are well diversified across the operating subsidiaries of the Group and are with a number of financial institutions. 44% of the Group’s short term and undrawn long-term facilities are of committed nature. See Notes 24, 27 and 29 for details. The Directors continue to expect the short-term facilities to be renewed upon maturity. In addition the Group maintained cash balances of $68.0 million as at 31 December 2009. The Group’s forecasts, taking into account reasonable possible changes in trading performance, facility renewal sensitivities and maturities of long-term debt, show that the Group should be able to operate well within the levels of its facilities and their related covenants.
61
Governance and fi
nancial results
After making enquiries, the Directors believe that the Group is adequately placed to manage its business and financing risks successfully despite the current uncertain economic outlook. The Directors have formed a judgement that there is reasonable expectation that the Group has adequate resources to continue in operational existence for the foreseeable future. The Directors therefore continue to adopt the going concern basis in preparing the financial statements.
Capital structure Details of the authorised and issued share capital, together with movements in the issued share capital during the year can be found in Note 31 to the financial statements. The Company has one class of Ordinary Shares which carries no right to fixed income. Each share carries the right to one vote at general meetings of the Company. As at 31 December 2009 the Company had 191,627,607 shares of 10 pence each in issue. During 2009 the Company issued 2,390,000 ordinary shares pursuant to the exercise of options under the Hikma Pharmaceuticals PLC 2004 Stock Option Plan.
There are no specific restrictions on the size of a holding or on the transfer of shares, which are both governed by the general provisions of the Company’s Articles of Association and prevailing legislation. The Directors are not aware of any agreements between holders of the Company’s shares that may have resulted in restrictions on the transfer of securities or on voting rights. No person has any special rights with regard to the control of the Company’s share capital and all issued shares are fully paid.
Details of any significant shareholdings in the Company can be found on page 61 of this report.
Details of the employee share schemes are set out in Note 36 to the financial statements. Shares are also held by the Hikma Pharmaceuticals Employee Benefit Trust (“EBT”) and are detailed in Note 33 to the financial statements. The EBT has waived its right to vote on the shares it holds and also to its entitlement to a dividend. No other shareholder has waived the right to a dividend.
At the Annual General Meeting on 14 May 2009, the Directors were authorised to issue relevant securities up to an aggregate nominal amount of £6,320,227, and to be empowered to allot equity securities for cash on a non pre-emptive basis up to an aggregate nominal amount of £948,034, at any time up to 30 June 2010. The Directors propose to renew these authorities at the Annual General Meeting to be held on 13 May 2010 for a further year. In the year ahead, other than in respect of the Company’s obligations to satisfy rights granted to employees under its various share-based incentive arrangements, the Directors have no present intention of issuing any of the authorised but unissued share capital of the Company.
The powers of the directors are determined by its Articles of Association, the Combined Code and other relevant UK legislation. At the AGM on 13 May 2010 the Directors will propose, for shareholder approval, the adoption of new Articles of Association to take effect from the close of the meeting. The amendments to the Articles are to reflect the changes to English Company law due to the final amendments to the Companies Act 2006 which took effect in October 2009. Full details of the amendments to the Articles are listed below. Directors powers are detailed in the Corporate Governance Report starting on page 54. The Articles give the Directors the power to appoint and remove directors and they also provide for re-election at three yearly intervals. The power to issue and allot shares contained in the Articles, are subject to shareholder approval at each annual general meeting. The Articles, which are available on the website, may only be amended by special resolution of the shareholders.
Significant Agreements and ContractsDue to the nature of the Group’s business, members of the Group are party to agreements that could alter or be terminated upon a change or control of the Group following a takeover. However, none of these agreements is individually deemed to be significant in terms of its potential impact on the business of the Group taken as a whole. The Directors are not aware of any agreements between the Company and its directors or employees that provide for compensation for loss of office or employment that occurs because of a takeover bid.
There are no persons, with whom the Company has contractual or other arrangements, who are deemed to be essential to the business of the Company.
Pre-emptive issue of Ordinary SharesDuring the year under review, and in the period since 1 November 2005, the date of the Company’s IPO, the Company did not issue any Ordinary Shares pursuant to an authority given by shareholders at annual general meeting to issue Ordinary Shares for cash on a non pre-emptive basis, other than in respect of the placing undertaken on 17 January 2008.
Directors’ indemnitiesThe Company has made qualifying third party indemnity provisions for the benefit of its directors. These indemnities are uncapped in amount in relation to losses and liabilities which directors may incur to third parties in the course of the performance of their duties.
Substantial shareholdingsAs at the date of this document, the Company had been notified pursuant to sections 89A to 89L of the Financial Services and Markets Act 2000 and Rule 5 of the Disclosure and Transparency Rules of the UKLA of the following interests in the voting rights attaching to shares in the capital of the Company:
Name of shareholder Number of shares Percentage held
Darhold Limited* 57,183,028 29.82%
* Messrs Samih Darwazah, Said Darwazah, Mazen Darwazah and Ali Al-Husry, each being a Director and shareholder of the Company, are shareholders in the capital of Darhold Limited. Samih Darwazah, Said Darwazah and Mazen Darwazah are also Directors of Darhold Limited.
Substantial Shareholdings

62 Hikma Pharmaceuticals PLC Annual report 2009
The Takeover Code – Rule 9 At the Annual General Meeting held on 14 May 2009, a vote of the independent shareholders of the Company approved the award of up to an aggregate of 200,000 ordinary shares pursuant to the Company’s 2006 Long Term Incentive Plan to Said Darwazah and Mazen Darwazah (the “LTIP Holders”) and 3,000 ordinary shares pursuant to the Management Incentive Plan to Hana Ramadan. Because of the relationship of the LTIP Holders with Darhold Limited, who at the time of the Annual General Meeting held 57,183,028 Ordinary Shares (at 7 April 2009 representing 29.82% of the issued share capital of the Company, and as at 16 March 2010 being the latest practicable date prior to the publication of this document, holding 57,183,028 Ordinary Shares, representing 29.82% of the issued share capital of the Company), each of the LTIP Holders and MIP holder (together with certain other identified individuals at that date) was treated as acting in concert with Darhold Limited for the purposes of the Takeover Code (the “Concert Party”). As at 7 April 2009, the Concert Party held, in aggregate, interests in 66,097,758 Ordinary Shares in the capital of Hikma (then representing 34.86% of the then issued share capital of the Company). As at 16 March 2010 being the latest practicable date prior to the publication of this document, the Concert Party held, in aggregate, interests in 65,878,430 ordinary shares in the capital of Hikma (representing 34.354% of the then issued share capital of the Company). On full exercise of the options under the Hikma Pharmaceuticals 2004 Stock Option Plan (the “2004 Plan”) and full vesting of the LTIP and MIP awards, the Concert Party would potentially have, in aggregate, interests in 66,392,930 shares in the capital of the Company (representing 34.53% of the enlarged issued share capital of the Company, on the basis that no Ordinary Shares were issued other than pursuant to the exercise of such options or vesting of LTIP and MIP awards).
During the period from the Annual General Meeting in 2009 to 16 March 2010, the LTIP and MIP awards’ holders together with other members of the Concert Party who hold options over ordinary shares pursuant to the 2004 Plan (the “Option Holders”) have exercised, in aggregate, options over 664,000 Ordinary Shares in the capital of the Company, of which 35,000 Ordinary Shares were sold immediately upon exercise, 480,000 Ordinary Shares were retained and 100,000 were retained but subsequently disposed of by the option holder.
Auditors Each person who was a Director of the Company at the date when this report was approved confirms that:
so far as the Director is aware, there is no relevant audit information of which the Company’s auditors are unaware; and
the Director has taken all the steps that he ought to have taken as a Director to make himself aware of any relevant audit information and to establish that the Company’s auditors are aware of that information.
This confirmation is given and should be interpreted in accordance with the provisions of section 418 of the Companies Act 2006.
Deloitte LLP have expressed their willingness to continue in office as auditors and a resolution to reappoint them will be proposed at the forthcoming Annual General Meeting.
Annual General MeetingThe Annual General Meeting of the Company will be held at Regus, 2nd Floor, Berkeley Square House, Berkeley Square, London W1J 6BD, United Kingdom on Thursday, 13 May 2010, starting at 10.30 a.m. The Notice convening the meeting is given in a separate document accompanying this document, and includes a commentary on the business of the AGM, and notes to help shareholders exercise their rights at the meeting. The Chairmen of the Audit, Remuneration and Nomination committees will be at the Annual General Meeting to answer questions from shareholders.
Approved by the Board of Directors on 16 March 2009 and signed on its behalf by
Henry Knowles Company Secretary
16 March 2010
Directors’ report continued

63
Governance and fi
nancial results
IntroductionThis report has been prepared in accordance with The Large & Medium-Sized Companies and Groups (Accounts and Reports) Regulations 2008, (the “Regulations”). The report also meets the relevant requirements of the Listing Rules of the Financial Services Authority and describes how the Board has applied the principles and complied with the provisions of the Combined Code and the Markets Law relating to directors’ remuneration. As required by the Regulations, an advisory resolution to approve this report will be proposed at the Annual General Meeting of the Company at which the financial statements will be approved.
The auditors are required to report on the”auditable part” of this report and to state whether, in their opinion, that part of the report has been properly prepared in accordance with the Companies Act 2006 and the Regulations. The report is therefore divided into separate sections for unaudited and audited information.
Unaudited Information
Remuneration Committee The Directors who were members of the Committee during the year under review are set out on page 56 of the Directors’ report.
The responsibility for the establishment of a remuneration policy and its cost is a matter for the full Board, on the advice of the Remuneration Committee. The ongoing recommendations of the Remuneration Committee have been approved without amendment by the Board for submission to shareholders.
The Remuneration Committee is responsible for developing policy on remuneration for Executive Directors and senior management and for determining specific remuneration packages for each of the Executive Directors. The Remuneration Committee members have no personal financial interest other than as shareholders in matters to be decided, no potential conflicts of interests arising from cross directorships and no day-to-day involvement in running the business.
The Remuneration Committee sought the assistance of the Chairman, the Chief Executive Officer and Executive Vice Chairman on matters relating to Directors’ performance and remuneration in respect of the period under review. The Chairman, Chief Executive Officer, Executive Vice Chairman and General Counsel may attend meetings of the Remuneration Committee by invitation except when their individual remuneration arrangements are discussed. No Director takes part in discussions relating to his own remuneration or benefits. As detailed below, during the year the Remuneration Committee received independent advice on executive compensation from PricewaterhouseCoopers LLP. No services other than those detailed in this report were provided to the Company by PricewaterhouseCoopers LLP during the year under review.
The Remuneration Committee is formally constituted with written terms of reference which describe the full remit of the Committee’s role described. The terms of reference are available on the Company’s website or on request by shareholders in writing from the Company Secretary whose contact details are set out on page 129 of this Annual Report.
Philosophy behind Remuneration Committee’s approachThe Company’s remuneration policy is designed to encourage, reward and retain executives and the Remuneration Committee believes that shareholders’ interests are best served by remuneration packages which have a large emphasis on performance related pay, thus encouraging executives to focus on delivering the Group’s business strategy. By providing meaningful incentives to executives the Company’s policy seeks to ensure that the appropriate balance between fixed and performance related pay is maintained.
During 2009 the Hikma Group undertook a review of Company remuneration to ensure that the overall remuneration practices achieved the strategic aims of the Group and to confirm and ensure that, taking account of all employment conditions, the remuneration of all employees, management and directors remained aligned. In this way the policy for remuneration of Executive Directors was benchmarked against employment and remuneration polices across all employees.
Remuneration Committee report

64 Hikma Pharmaceuticals PLC Annual report 2009
Remuneration policy 2009
Overall policyThe Remuneration Committee’s policy during the year under review was to set the main elements of the remuneration package at the following quartiles in comparison to the Company’s Comparator Group:
Base salaryAnnual bonus potential Pension Benefits in kind
Potential total short-term remuneration available
Potential annual share awards
Potential total compensation value
Lower Quartile to Median
Upper Quartile Lower Quartile Lower Quartile to Median to Median
Median to Upper Quartile
Upper Quartile Median to Upper Quartile
This supports the performance based culture of the Company. Fixed costs are minimised and total short-term remuneration will only reach and exceed the median if the performance-based bonus is earned for the relevant financial year.
The policy in respect of long-term incentives and potential compensation value is an extension of the policy on total short-term remuneration. Executives will only receive a market competitive package if the annual bonus and long-term incentives are earned.
With the difficult global economic backdrop to 2009 and the banking industry turmoil, there has been much focus on executive pay as a potential causal factor in the banking crisis. This has had widespread coverage and has generated significant political pressure for change to the practices of the financial services industry in particular. This culminated in the publication of the Walker Review in November 2009, making a number of new recommendations of principle to be applied to remuneration in the financial services sector from the 2010 reporting year onwards. In addition, there have been a number of associated publications from shareholder bodies and institutional investors clarifying their expectations for remuneration in 2009 and a draft revised UK Corporate Governance Code has been issued for consultation.
In formulating the application of its policy for 2009 and future years, the Remuneration Committee has been cogniscent of the evolving landscape in remuneration developments. The Remuneration Committee is confident that its policies remain effective and robust.
2009 Comparator Group During 2009 the Company updated its Comparator Group to ensure that it remained appropriate for the Company on an ongoing basis, reflecting the increase in size and further internationalisation of the Company and reacting to the significant consolidation in the pharmaceutical industry that had affected a significant proportion of the previously selected Comparator Group companies.
The constituents of the Company’s Comparator Group (“CG”) for benchmarking remuneration during 2009 were as follows:
Name Name Name
Amylin Pharmaceuticals Inc Hospira Inc. Sanofi Aventis
AstraZeneca PLC Impax Labs Inc Sepracor Inc.
BTG PLC King Pharmaceuticals Inc. Shire Pharmaceuticals PLC
Crucell NV Merck KgaA UCB SA
Endo Pharmaceuticals Holdings Mylan Inc Valeant Pharmaceutical International
Forest Laboratories Inc Novartis AG Watson Pharmaceuticals Inc
Grilfols SA Prostraken Group PLC
Factors the Remuneration Committee took into account when selecting the 2009 CG included:
the industry within which the Company operates, specifically taking into account both the international nature of the Company’s business and its competitors;
the international nature of the Company’s current executive team and potential recruits to that team;
the market capitalisation, turnover and number of employees of the Company; and
the UK listing environment of the Company.
Remuneration Committee report continued

65
Governance and fi
nancial results
Throughout this report, references to quartiles are to quartiles in the Comparator Group.The 2009 Comparator Group was used as the total shareholder return performance condition comparator group for awards granted in 2009 under
the Hikma Pharmaceuticals PLC 2006 Long-Term Incentive Plan (“LTIP”) and will also be used for the 2010 LTIP Awards. The Company has historically used the same comparators for both benchmarking remuneration and the performance condition for awards granted during the relevant year, and will continue to do so in 2010.
Ongoing review The Remuneration Committee continues to review the remuneration policy on an annual basis to ensure it remains appropriate for the financial year under review. Factors taken into account by the Remuneration Committee include:
market conditions affecting the Company;
the recruitment market in the Company’s sector;
changing market practice;
changing views of institutional shareholders and their representative bodies; and
the current economic climate.
The Remuneration Committee has oversight of the main reward structures throughout the Company and was involved in the Company review mentioned above. Following both this Company review and the Committee’s specific review for Executive Directors the Committee is satisfied that the Company’s incentive structures are consistent with the risk profile of the Company set by the Board and also encourage a long-term sustainable view to be taken by participants. One of the features of the Company’s remuneration which the Committee believes is particularly relevant in this context is the availability of plans encouraging wide share ownership at all levels of management.
It is the current intention of the Remuneration Committee to apply the 2009 policy in 2010.
2009 Balance between fixed and variable performance-based compensation The chart below demonstrates the balance between the potential fixed and variable performance-based compensation for each Executive Director for the year ended 31 December 2009.
Fixed compansation is calculated as:
Variable performance compensation is calculate as:
Salary Benefits
Pension contribution
Maximum bonus availableFair market value of maximum
potential LTIP award
Said Darwazah 39.4% 60.6%
Mazen Darwazah 40.8% 59.2%
Elements of Executive Directors’ remuneration
Base salary
Policy 2009 and 2010 – Lower quartile to median The Company’s remuneration policy is to set the levels of base salary for the Executive Directors below the median to support a performance based culture.
When determining the base salary of the Executive Directors the Committee takes into consideration:
the levels of base salary for similar positions with comparable status, responsibility and skills in organisations of broadly similar size and complexity, in particular the lower quartile and median salary levels of those comparable companies within the pharmaceuticals industry and the Comparator Group;
the performance of the individual Executive Director;
the individual Executive Director’s experience and responsibilities; and
pay and conditions throughout the Company.

66 Hikma Pharmaceuticals PLC Annual report 2009
Remuneration Committee report continued
The following tables summarises the base salary of Executive Directors:
Name2009
Salary2010 Salary Rise
Median Rise in Comparator
Group
Said Darwazah $630,000 $630,000 0% 7%
Median $1,082,000
Lower quartile $804,000
Mazen Darwazah $420,000 $420,000 0% 11%
Median $500,000
Lower quartile $432,000
After reviewing the above criteria, the Committee elected not to increase Executive Directors’ salaries for 2010. It remains the Committee’s ongoing policy that, save in exceptional circumstances, only modest rises in base salary should be required.
Annual performance related bonus
Policy 2009 and 2010 – Upper quartile bonus potential Bonus payments are not pensionable. The following tables summarise the main features of the Company’s executive bonus plan.
Bonus Said Darwazah Mazen Darwazah
Company bonus potential 100% 100%
Upper Quartile CG 206% 197%
Median CG 190% 151%
2009 Bonus Paid as percentage of salary 73% 73%
Upper Quartile Bonus Payments in the CG as a percentage of salary 105% 82%
The maximum target bonus potential is 100% of salary. It is possible for exceptional performance to earn up to a total maximum bonus of 200% of salary. The maximum bonus potentials for 2010 will remain the same as those applied for 2009.
The bonuses for 2009 have been paid on the basis of the level of the achievement of the performance targets. The table below shows the principal performance targets used for 2009 and their percentage satisfaction.
Percentage of maximum
bonus potential subject to target
Percentage satisfaction of bonus target
Percentage of salary payable
Said Darwazah
Profit after tax 50% 96% 48%
Operational milestones 30% 16% 5%
Personal business targets 20% 100% 20%
Total 73%
Mazen Darwazah
Profit after tax 50% 96% 48%
Operational milestones 30% 33% 10%
Personal business targets 20% 75% 15%
Total 73%
The targets for the annual bonus plan are reviewed and agreed by the Remuneration Committee each year to ensure that they are appropriate to the current market conditions and position of the Company and in order to ensure that they continue to remain challenging. Underlying performance targets for Executive Directors’ bonuses were reviewed during 2008 to ensure that they remained in line with the Group’s overall business strategy in 2009. The Committee applied the same parameters in 2009 and it is the opinion of the Committee that the overall nature of the conditions remains appropriate for the requirements of the Group in 2010.

67
Governance and fi
nancial results
Share incentives
Policy 2009 and 2010 – Upper quartile The Remuneration Committee’s policy is to provide annual share grants to senior executives at a maximum of the upper quartile level compared to the Comparator Group. Ongoing share incentives are provided to the Executive Directors solely through the LTIP. The Remuneration Committee believes that share awards under the LTIP enable the Company to provide a competitive incentive and retention tool which is also cost effective in respect of both shareholder dilution and income statement expense. Furthermore, the proposed grant of awards with the attached performance condition ensures that the Company’s comparative Total Shareholder Return (“TSR”1) performance against the Comparator Group is at least at the upper quartile before executives receive the full benefit of their share incentives. This structure demonstrates the Remuneration Committee’s desire to correlate incentive arrangements with the achievement of substantial performance.
The Remuneration Committee granted the following awards to executive directors during 2009.
NamePercentage
of salary
UQ in CG percentage
of salary
Said Darwazah 127.3% 283%
Mazen Darwazah 114.5% 176%
In 2009 the Company introduced a new Management Incentive Plan. The levels of LTIP awards made in 2009 therefore reflect the smaller population of participants in the LTIP.
The following table summarises the main features of the LTIP in 2009 and its proposed operation during 2010.
Maximum annual grant face value as percentage of salary and performance condition
Maximum annual grant 300% (current normal operating maximum set by the Remuneration Committee 200%). The Awards will be subject to comparative TSR performance against the Comparator Group. 20% of Awards will be released for median performance with full release occurring for upper quartile comparative performance. The Remuneration Committee will also ensure that the underlying financial performance of the Company is consistent with its TSR performance. When considering this underlying financial performance the factors taken into account by the Remuneration Committee will include profit after tax, revenue growth and the achievement of operational milestones.
Said Darwazah Mazen Darwazah
Maximum grants for 2010 face value2 as a percentage of salary 200% 200%
The following table sets out the level of release of current subsisting LTIP awards if the Company’s performance measured as at 31 December 2009 continued until the end of the relevant performance period.
LTIP Grant Company TSR ranking against CG
Percentage of Award released if performance measured as at 31 December 2009 continued
to the end of the relevant performance period
2007 LTIP Grant Fourth of 17 companies 100%
2008 LTIP Grant Ninth of 17 companies 20%
2009 LTIP Grant Second of 20 companies 100%
It should be noted that the real value received by the Executive Directors under the share incentive arrangements will be dependent upon the degree to which the performance conditions are satisfied at the end of the three year performance period and the share price of the Company at that time.
1 Total Shareholder Return (“TSR”) – is a measure showing the return on investing in one share of the Company over the performance period (the return is the value of the capital gain and reinvested dividends). It is normally used comparatively and the Company which achieves the best return is ranked number one.
2 Face value for awards under the LTIP face value is the aggregate market value of the shares subject to the award at the date of grant.

68 Hikma Pharmaceuticals PLC Annual report 2009
Remuneration Committee report continued
Basis of performance condition selection and measurement Comparative TSR was selected as the performance condition for the proposed awards by the Remuneration Committee as it ensures that the executives have outperformed their peers over the measurement period in delivering shareholder value before being entitled to receive any of their awards irrespective of general market conditions. The Remuneration Committee will provide a full explanation and justification at the time of the release of the award and why it believes that the underlying financial performance of the Company is consistent with this TSR performance.
The Remuneration Committee determines whether the performance conditions for share awards are satisfied. The Committee has appointed PricewaterhouseCoopers LLP to assist in the ongoing calculation of TSR in accordance with the rules of the LTIP. The Committee will approve these figures prior to the release of any award.
Dilution In accordance with the guidelines set out by the Association of British Insurers (“ABI”) the Company can issue a maximum of 10% of its issued share capital in a rolling ten year period to employees under all its share plans and a maximum of 5% of this 10% for discretionary share plans. Under the LTIP rules, grants of no more than 3% of the issued ordinary share capital of the Company may be awarded in the first three years following the Company’s IPO, undertaken in 2005.
The following table summarises the current level of dilution resulting from Company share plans following the IPO:
Type of plan
Share awards as a percentage of issued share capital as at
31 December 2009 in a rolling ten year period
Share awards as a percentage of issued share capital as at
31 December 2009 granted during the year
All Employee Share Plans (10% limit) 0% 0%
Discretionary Share Plans (5% limit) 2.145% 0.77%
The Company has not implemented any all-employee share incentive arrangements.It is the Company’s current intention that LTIP awards granted in 2009 will be satisfied by newly issued shares.
Post-employment benefits
Policy 2009 and 2010 – Lower quartile to median The Executive Directors participate in the Hikma Pharmaceuticals Defined Contribution Retirement Benefit Plan (the “Benefit Plan”) in accordance with the Rules of the Benefit Plan relevant to employees of the Group based in Jordan. Under the Benefit Plan the Group matches employee contributions made to the Benefit Plan. These are fixed at 5% of applicable salary. Participants are entitled to 30% of the Group’s contributions to the Benefit Plan after three years of employment with the Group, and an additional 10% in each subsequent year. The participant’s interest in the Group’s contribution fully vests after ten years of employment.
The following table sets out the percentage post-employment contributions compared to the Comparator Group.
Said Darwazah Mazen Darwazah
Company 1.35% 1.86%
Upper quartile 30% 25%
Median 25% 15%
Lower quartile 15% 10%
In addition, pursuant to applicable law, each of the Executive Directors receives contributions as a percentage of salary which is paid by the Group into Government social security systems.
Benefits in kind
Policy 2009 and 2010 – Market practice The Company provides the normal benefits in kind for executives of this level in a company of this size, such as company cars, healthcare and life insurance.

69
Governance and fi
nancial results
Total compensation
Policy 2009 and 2010 – Median to upper quartile depending on performance The following table shows the value of each of the main elements of the remuneration package provided to the Executive Directors during the year ended 31 December 2009.
NameSalary $000
Bonus paid $000
Benefits $000
Total payments $000
FMV LTIP $000
Total actual and FMV
$000
Total on target in 2009 CG at
median $000
Said Darwazah $630 $458 $95 $1,183 $486 $1,669 $5,408
Mazen Darwazah $420 $305 $71 $796 $292 $1,088 $1,708
Other remuneration matters
Directors’ shareholding policy The Company does not have a formal directors’ shareholding requirement due to the substantial shareholdings of the Executive Directors. The Committee, however, wholeheartedly supports the alignment of interests created by a minimum level of executive shareholding and should the make-up of the Board change would consider the introduction of a formal shareholding requirement.
Management Incentive Plan (“MIP”) During 2009 the Company made the first awards to management under the MIP. Under the MIP, the Company will make grants of nil cost option awards to executive management across the Group based on the satisfaction of annual performance targets. The key features of the MIP are as follows:
the MIP is open to management level employees across the Group below senior executive level;
participation in the LTIP will preclude participation in the MIP;
participants will be notified of a maximum monetary entitlement, (the maximum award level is anticipated to be 50% of salary p.a.) the value of which will be awarded to participants in the form of nil cost options over shares, based on annual performance against individual and Group KPIs;
nil cost options will vest two years after the date of award (being approximately three years after the commencement of the financial year to which the award relates), subject to the participant remaining in employment with the Group during this period. Once the options have been awarded, the continued employment requirement is the only condition for vesting.
The MIP awards made in respect of 2009 will be satisfied out of market purchased shares held for the purpose in the Group’s Employment Benefit Trust. The AGM to be held on 13 May 2010 the Company will seek approval from shareholders to satisfy ongoing awards under the MIP from newly issued shares. The principal terms of the MIP will be set out in a Circular accompanying the Annual Report.
Executive Directors’ contracts Details of the service contracts of the Executive Directors of the Company in force at the end of the year under review are as follows:
Name Company notice period Contract date Unexpired term of contract Potential termination payment
Said Darwazah 12 months 1 July 2007 Rolling contract 12 months salary and benefits
Mazen Darwazah 12 months 25 May 2006 Rolling contract 12 months salary and benefits
The Executive Directors’ contracts are on a rolling basis, unless terminated by at least 12 months’ written notice. This arrangement is in line with best corporate practice for listed companies. In the event of the termination of an executive’s contract, salary and benefits will be payable during the notice period (there will, however, be no automatic entitlement to bonus payments or share incentive grants during the period of notice other than in accordance with the rules of the relevant incentive plan). The Remuneration Committee will ensure that there have been no unjustified payments for failure on an Executive Director’s termination of employment. There are no special provisions in the contracts of employment extending notice periods on a change of control, liquidation of the Company or cessation of employment.

70 Hikma Pharmaceuticals PLC Annual report 2009
Remuneration Committee report continued
External appointments The Committee recognises that Executive Directors may be invited to take up non-executive directorships or public sector and not-for-profit appointments, and that these can broaden the experience and knowledge of the director, from which the Company can benefit. Executive Directors may therefore accept such appointments as long as they do not lead to a conflict of interest, and are allowed to retain any fees paid under such appointments. During the year under review, Said Darwazah and Mazen Darwazah received fees of US$11,850 and US$3,385 respectively, in respect of such appointments.
Non-Executive Directors’ Fees
Policy 2009 – Upper Quartile The remuneration of the non-executive directors is determined by the Board based upon recommendations from the Chief Executive Officer and Executive Vice Chairman and is within the limits set by the Articles of Association.
The nature of the Company’s business is international, requiring the Non-Executive Directors to travel to the USA, Middle East and Europe. The Board is therefore made up of Non-Executive Directors with a wide range of experience both in the UK and internationally. The use of options for Non-Executive Directors is very prevalent in the US and also to some extent internationally. However, as a UK listed company complying with UK best practice it is not considered appropriate to grant options to the Company’s Non-Executive Directors. To ensure that the Company remains able to attract the appropriate calibre of candidate and to take account of its inability to grant options, the Board has therefore set its fee policy at the upper quartile.
The individual basic and committee fees, which are paid in £ Sterling, are as follows:
2009 2010
NameTotal fee
£000Basic fee
£000Chairmanship fee
£000Committee fee
£000Total fee
£000
Upper quartile fees in CG
£000
Samih Darwazah 157.5 157.5 – – 157.5 293
Michael Ashton 67.5 63 7.5 7.5 78 136
Ali Al-Husry 60 63 – – 63 129
Breffni Byrne 75 63 15 7.5 88.5 139
Ronald Goode 60 63 – 7.5 70.5 135
Sir David Rowe-Ham 67.5 63 7.5 7.5 78 135
A review of the level of Non-Executive Director fees was conducted during 2009. The Board commissioned PricewaterhouseCoopers LLP to conduct a study of non-executive remuneration against the Comparator Group. This showed that, in relation to the overall Non-Executive Director fee policy set by the Group, Hikma’s Non-Executive Director fees remained out of step with those of the Comparator Group. Following the review it was resolved by the Board that the composition of the Non-Executive Director fees should be updated to reflect not only the work undertaken as a chairman of a board committee, but also as a member of Board committees. Therefore, a Board committee membership fee will be paid in addition to the basic fee to those Non-Executive Directors who sit on the board committees. In conjunction with the review the Board also resolved that from 1 January 2010, the basic fees of Non-Executive Directors should be increased to the amounts set out above. There has been no change in the fees of the Non-Executive Chairman. The increases continue to move Non-Executive fees back towards the Group’s stated policy, though overall Non-Executive fees remain below the level set by Group policy. The Board continues to believe that it is important to ensure that the fees paid to Non-Executives remain competitive, that they reflect the increasingly important role played by Non-Executives and allow the Nomination Committee to recruit Non-Executive Directors of the appropriate calibre in accordance with the requirements of succession planning.
Non-Executive Directors do not participate in any bonus plan or share incentive programme operated by the Company and are not entitled to pension contributions or other benefits provided by the Company. The Non-Executive Directors do not have service contracts, but have letters of appointment with the Company. Each appointment is terminable on one months’ notice from either the Company or the Director, but is envisaged to be for an initial period of up to 36 months, subject to the terms of the Company’s Articles of Association, the Companies Act and shareholder approval.
Name Date of original appointment Notice payment
Samih Darwazah 17 July 2007 1 month
Michael Ashton 14 October 2005 1 month
Ali Al-Husry 14 October 2005 1 month
Breffni Byrne 14 October 2005 1 month
Ronald Goode 12 December 2006 1 month
Sir David Rowe-Ham 14 October 2005 1 month

71
Governance and fi
nancial results
Total Shareholder Return performance graph The graph shows the Company’s performance, measured by total shareholder return (“TSR”), compared to the constituents of the Comparator Group and FTSE 250 Index from 1 November 2005 to 31 December 2009. The Comparator Group has been selected as it is the group of companies whose performance the Company compared to in determining the release of awards under the LTIP. The FTSE 250 Index has been selected to provide a broader comparator of the Company’s performance and is the main Index in which the Company’s shares are included.
Audited information
Aggregate Directors’ remuneration for 2009 and 2008 The total amounts for Directors’ remuneration were as follows:
2009 US$
2008 US$
Emoluments 2,739,389 2,637,686
Compensation for loss of office – –
Gains on exercise of share options 4,644,835 4,120,020
Amounts receivable under long-term incentive schemes – –
Money purchase pension contributions – –
Total 7,384,224 6,757,706
Total Shareholder Return from 1 November 2005 (percent)
100
60
40
20
80
0
–40
–20
Hikma Pharmaceuticals PLC FTSE 250 Index FTSE 350/Pharmaceuticals & Biotechnology
11/05
TSR
(%)
11/0605/06 05/07 11/07 05/08 11/08 05/09 11/09

72 Hikma Pharmaceuticals PLC Annual report 2009
Remuneration Committee report continued
Directors’ emoluments and compensation
DirectorFees/Basic salary
US$Other benefits*
US$ Annual bonuses
US$2009 Total
US$2008 Total
US$
Executives
Said Darwazah 630,000 94,520 458,325 1,182,845 1,013,011
Mazen Darwazah 420,000 71,418 305,550 796,968 765,487
Non-Executives
Samih Darwazah 245,693 – – 245,693 278,255
Ali Al-Husry 93,431 – – 93,431 105,616
Michael Ashton 105,113 – – 105,113 118,829
Breffni Byrne 116,795 – – 116,795 132,043
Ronald Goode 93,431 – – 93,431 105,616
Sir David Rowe-Ham 105,113 – – 105,113 118,829
Aggregate Emoluments 1,809,576 165,938 763,875 2,739,389 2,637,686
*Other benefits include provision of health insurance, company car, medical expenses and statutory contributions to Government social security funds
Directors’ post-employment benefitsEach of the Executive Directors received contributions to the Hikma Pharmaceuticals Defined Contribution Retirement Benefit Plan (Jordan) during the year under review. The contributions paid by the Group were as follows:
Director2009 US$
2008 US$
Said Darwazah 8,505 8,505
Mazen Darwazah 7,818 7,818
Directors’ interests in shares The table below details the Directors’ holdings in the share capital of the Company, including the changes between 31 December 2009 and the date of this document.
Ordinary shares of 10 pence
Director1 January
200931 December
200916 March
2010
Samih Darwazah 2,195,450 2,515,450 2,515,450
Said Darwazah 413,445 413,445 413,445
Mazen Darwazah 777,591 986,591 986,591
Michael Ashton 4,566 18,566 18,566
Ali Al Husry 1,109,748 1,109,748 1,109,748
Breffni Byrne 10,000 10,000 10,000
Ronald Goode 9,000 9,000 9,000
Sir David Rowe-Ham 10,000 10,000 10,000
Total shares: 4,259,800 5,072,800 5,072,800
Each of Samih Darwazah, Said Darwazah, and Mazen Darwazah are directors of Darhold Limited, which is therefore a connected person of these individuals for the purposes of the Listing Rules and the Disclosure and Transparency Rules of the Financial Services Authority. Samih Darwazah, Said Darwazah Mazen Darwazah and Ali Al-Husry are also shareholders of Darhold Limited. At the date of this document, Darhold Limited held 57,183,028 Ordinary Shares in the capital of the Company.

73
Governance and fi
nancial results
Directors’ share options The aggregate emoluments disclosed above do not include any amounts or the value of options to acquire Ordinary Shares in the capital of the Company granted or held by the Executive Directors.
Options granted under the 2004 Plan are not subject to performance criteria, though vesting of options under the 2004 Plan was conditional on the successful listing of the Company’s share on the London Stock Exchange. During the year Samih Darwazah continued to hold options over shares awarded to him during his period as an executive of the Company, as he remained a qualified holder under the terms of the 2004 Stock Option Plan. During the year, Samih Darwazah exercised options over 320,000 Ordinary Shares of the Company, and Mazen Darwazah exercised options over 320,000 Ordinary Shares of the Company. Samih Darwazah and Mazen Darwazah no longer hold any options under the 2004 Plan. No other options were exercised by Directors during the year and no options expired unexercised. Furthermore, there were no variations to the terms and conditions of share options during the year.
Hikma Pharmaceuticals PLC 2004 Stock Option Plan
Number ofoptions
Director
As at 31 December
2009
As at 1 January
2009
No. of options exercised
during the year Exercise price
(US$)Price paid for award
Initial date of vesting** Date of expiry
Samih Darwazah – 320,000 320,000 0.9075* –
1 Nov 2005
11 Oct 2014
Said Darwazah – – – – – – –
Mazen Darwazah – 320,000 320,000 0.9075* – 1 Nov 2005
11 Oct 2014
*Representing the Exercise price of options following the share re-organisation undertaken on 31 October 2005. Options were awarded on 12 October 2004 with an Exercise price of US$3.63
** Share Options became exercisable following the successful listing of the Company’s shares on the London Stock Exchange. Options under the 2004 Plan have phased vesting over five years, with 20% vesting each year on the anniversary of award, being 12 October.
The gains/notional gains made by Directors on the exercise of their stock options during the year were as follows:
DirectorOptions
exercised DateShare price
(£)Exchange rate (US$)
Gain (US$) Held/Sold
Samih Darwazah 320,000 14 Oct 2009
4.70 1.581 2,377,824 Held
Mazen Darwazah 160,000 15 April 2009
3.90 1.4878 928,387 Held
160,000 27 Nov 2009
5.04 1.66 1,338,624 Held/Sold
Total 4,644,835

74 Hikma Pharmaceuticals PLC Annual report 2009
Remuneration Committee report continued
Hikma Pharmaceuticals PLC 2006 Long Term Incentive Scheme
No. of LTIP shares
Director
As at 31 December
2009
As at 1 January
2009
Said Darwazah 315,000 190,000
Mazen Darwazah 179,000 104,000
Director No. of LTIP shares Price paid for award Exercise price Date of award
Initial date of vesting Date of expiry
Said Darwazah 100,000 – nil 10 Sept 2007
10 Sept 2010
10 Sept 2017
90,000 – nil 29 April 2008
29 April 2011
29 April 2018
125,000 – nil 19 May 2009
19 May 2012
19 May 2019
Mazen Darwazah 50,000 – nil 10 Sept 2007
10 Sept 2010
10 Sept 2017
54,000 – nil 29 April 2008
29 April 2011
29 April 2018
75,000 – nil 19 May 2009
19 May 2012
19 May 2019
The closing market price for the Ordinary Shares on 31 December 2009 was 510 pence. During the period from 1 January 2009 to the year-end the share’s closing price ranged from a low of 316 pence to a high of 522.5 pence.
AuditThe emoluments and Directors’ interests’ information disclosed in the Directors’ report on remuneration, which is required by Schedule 8 of the Regulations and the Companies Act 2006 (as amended), has been audited.
Approved by the Board of Directors on 16 March 2010 and signed on its behalf
Michael Ashton Chairman of the Remuneration Committee

75
Governance and fi
nancial results
The Directors are responsible for preparing the Annual Report and the financial statements in accordance with applicable laws and regulations.
Company law requires the Directors to prepare such financial statements for each financial year. Under that law the Directors are required to prepare Group financial statements in accordance with International Financial Reporting Standards (IFRSs) as adopted by the European Union and Article 4 of the IAS Regulation and have also chosen to prepare the parent company financial statements under IFRSs as adopted by the European Union. Under company law the Directors must not approve the accounts unless they are satisfied that they give a true and fair view of the state of affairs of the Company and of the profit or loss of the Company for that period. In preparing these financial statements, the Directors are required to:
properly select and apply accounting policies;
present information, including accounting policies, in a manner that provides relevant, reliable, comparable and understandable information;
provide additional disclosures when compliance with the specific requirements in IFRSs are insufficient to enable users to understand the impact of particular transactions, other events and conditions on the entity’s financial position and financial performance; and
make an assessment of the Company’s ability to continue as a going concern.
The Directors are responsible for keeping proper accounting records that are sufficient to show and explain the Company’s transactions and disclose with reasonable accuracy at any time the financial position of the Company and enable them to ensure that the financial statements comply with the Companies Act 2006. They are also responsible for safeguarding the assets of the Company and hence for taking reasonable steps for the prevention and detection of fraud and other irregularities.
The Directors are responsible for the maintenance and integrity of the corporate and financial information included on the Company’s website. Legislation in the United Kingdom governing the preparation and dissemination of financial statements may differ from legislation in other jurisdictions.
We confirm to the best of our knowledge:
1. the financial statements, prepared in accordance with the International Financial Reporting Standards as adopted by the EU, give a true and fair view of the assets, liabilities, financial position and profit or loss of the Company and the undertakings included in the consolidation taken as a whole; and
2. the management report, which is incorporated into the Directors’ report, includes a fair review of the development and performance of the business and the position of the Company and the undertakings included in the consolidation taken as a whole, together with a description of the principal risks and uncertainties that they face.
By order of the Board
Said Darwazah Mazen Darwazah Chief Executive Officer Executive Vice Chairman, CEO MENA
16 March 2010
Directors’ Responsibility Statement
76
We have audited the financial statements of Hikma Pharmaceuticals PLC for the year ended 31 December 2009 which comprise the Consolidated Statement of Comprehensive Income, the Consolidated and the Company Balance Sheets, the Consolidated and the Company Statements of Changes in Equity, the Consolidated and the Company Cash Flow Statements and the related notes 1 to 56. The financial reporting framework that has been applied in their preparation is applicable law and International Financial Reporting Standards (IFRSs) as adopted by the European Union and as regards the parent Company financial statements, as applied in accordance with the provisions of the Companies Act 2006.
This report is made solely to the Company’s members, as a body, in accordance with Chapter 3 of Part 16 of the Companies Act 2006. Our audit work has been undertaken so that we might state to the Company’s members those matters we are required to state to them in an auditors’ report and for no other purpose. To the fullest extent permitted by law, we do not accept or assume responsibility to anyone other than the Company and the Company’s members as a body, for our audit work, for this report, or for the opinions we have formed.
Respective responsibilities of directors and auditorsAs explained more fully in the Directors’ Responsibilities Statement, the Directors are responsible for the preparation of the financial statements and for being satisfied that they give a true and fair view. Our responsibility is to audit the financial statements in accordance with applicable law and International Standards on Auditing (UK and Ireland). Those standards require us to comply with the Auditing Practices Board’s (APB’s) Ethical Standards for Auditors.
Scope of the audit of the financial statementsAn audit involves obtaining evidence about the amounts and disclosures in the financial statements sufficient to give reasonable assurance that the financial statements are free from material misstatement, whether caused by fraud or error. This includes an assessment of: whether the accounting policies are appropriate to the Group’s and the Parent Company’s circumstances and have been consistently applied and adequately disclosed; the reasonableness of significant accounting estimates made by the Directors; and the overall presentation of the financial statements.
Opinion on financial statementsIn our opinion:
the financial statements give a true and fair view of the state of the Group’s and of the Company’s affairs as at 31 December 2009 and of the Group’s profit for the year then ended;
the Consolidated financial statements have been properly prepared in accordance with IFRSs as adopted by the European Union;
the Company financial statements have been properly prepared in accordance with IFRSs as adopted by the European Union and as applied in accordance with the provisions of the Companies Act 2006; and
the financial statements have been prepared in accordance with the requirements of the Companies Act 2006 and, as regards the Group financial statements, Article 4 of the IAS Regulation.
Separate opinion in relation to IFRSs as issued by the IASBAs explained in note 2 to the Group financial statements, the Group in addition to complying with its legal obligation to apply IFRSs as adopted by the European Union, has also applied IFRSs as issued by the International Accounting Standards Board (IASB).
In our opinion the Group financial statements comply with IFRSs as issued by the IASB.
Opinion on other matters prescribed by the Companies Act 2006In our opinion:
the part of the Directors’ Remuneration Report to be audited has been properly prepared in accordance with the Companies Act 2006; and
the information given in the Directors’ Report for the financial year for which the financial statements are prepared is consistent with the financial statements.
Matters on which we are required to report by exceptionWe have nothing to report in respect of the following:
Under the Companies Act 2006 we are required to report to you if, in our opinion:
adequate accounting records have not been kept by the Parent Company, or returns adequate for our audit have not been received from branches not visited by us; or
the Parent Company financial statements and the part of the Directors’ Remuneration Report to be audited are not in agreement with the accounting records and returns; or
certain disclosures of Directors’ remuneration specified by law are not made; or
we have not received all the information and explanations we require for our audit.
Under the Listing Rules we are required to review:
the Directors’ statement contained within the Directors’ Report in relation to going concern; and
the part of the Corporate Governance Statement relating to the Company’s compliance with the nine provisions of the 2006 June 2008 Combined Code specified for our review.
Edward Hanson (Senior Statutory Auditor)for and on behalf of Deloitte LLPChartered Accountants and Statutory Auditors London, United Kingdom
16 March 2010
Independent auditors’ report to the members of Hikma PLC
Hikma Pharmaceuticals PLC Annual report 2009

77
Governance and fi
nancial results
Consolidated statement of comprehensive income for the year ended 31 December 2009
Notes2009
$000’s2008
$000’s
Continuing operations
Revenue 4 636,884 580,656
Cost of sales 4 (332,459) (324,174)
Gross profit 4 304,425 256,482
Sales and marketing costs (98,083) (90,560)
General and administrative expenses (66,677) (56,853)
Research and development costs (16,843) (22,172)
Other operating expenses (net) 8 (15,529) (6,215)
Total operating expenses (197,132) (175,800)
Adjusted operating profit 114,742 94,326
Exceptional items :
– Revision to estimates for chargebacks, returns and rebates 5 – (4,800)
– Acquisition integration costs 5 – (1,629)
Intangible amortisation* 5 (7,449) (7,215)
Operating profit 4 107,293 80,682
Finance income 9 514 817
Finance expense 10 (12,827) (17,545)
Other (expense)/income (193) 80
Profit before tax 94,787 64,034
Tax 11 (15,469) (6,915)
Profit for the year 6 79,318 57,119
Attributable to:
Non-controlling interest 32 1,635 (6)
Equity holders of the parent 77,683 57,125
79,318 57,119
Earnings per share (cents)
Basic 13 40.9 30.4
Diluted 13 40.1 29.6
Cumulative effect of change in fair value of available for sale investments 2 (216)
Cumulative effect of change in fair value of financial derivatives (202) (78)
Exchange difference on translation of foreign operations 1,364 (15,454)
Total comprehensive income for the year 80,482 41,371
Attributable to:
Non-controlling interest 1,586 (6)
Equity holders of the parent 78,896 41,377
80,482 41,371
* Intangible amortisation comprises the amortisation on intangible assets other than software.
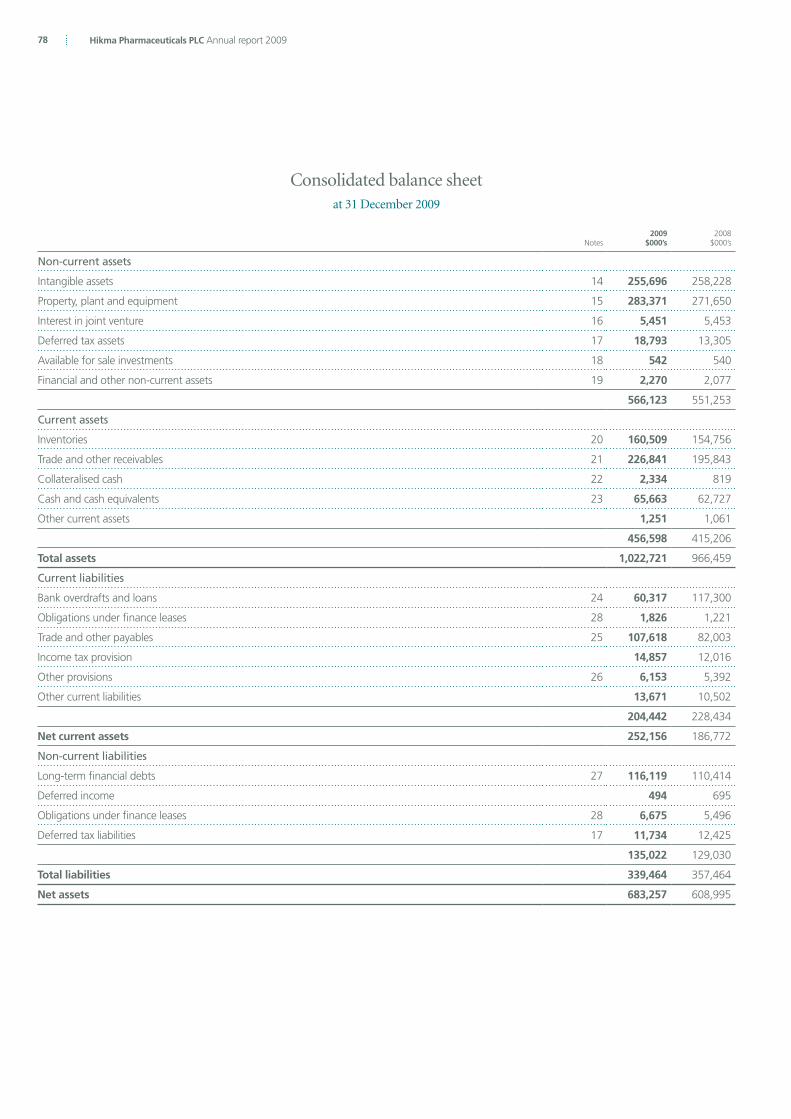
78 Hikma Pharmaceuticals PLC Annual report 2009
Notes2009
$000’s2008
$000’s
Non-current assets
Intangible assets 14 255,696 258,228
Property, plant and equipment 15 283,371 271,650
Interest in joint venture 16 5,451 5,453
Deferred tax assets 17 18,793 13,305
Available for sale investments 18 542 540
Financial and other non-current assets 19 2,270 2,077
566,123 551,253
Current assets
Inventories 20 160,509 154,756
Trade and other receivables 21 226,841 195,843
Collateralised cash 22 2,334 819
Cash and cash equivalents 23 65,663 62,727
Other current assets 1,251 1,061
456,598 415,206
Total assets 1,022,721 966,459
Current liabilities
Bank overdrafts and loans 24 60,317 117,300
Obligations under finance leases 28 1,826 1,221
Trade and other payables 25 107,618 82,003
Income tax provision 14,857 12,016
Other provisions 26 6,153 5,392
Other current liabilities 13,671 10,502
204,442 228,434
Net current assets 252,156 186,772
Non-current liabilities
Long-term financial debts 27 116,119 110,414
Deferred income 494 695
Obligations under finance leases 28 6,675 5,496
Deferred tax liabilities 17 11,734 12,425
135,022 129,030
Total liabilities 339,464 357,464
Net assets 683,257 608,995
Consolidated balance sheetat 31 December 2009

79
Notes2009
$000’s2008
$000’s
Equity
Share capital 31 34,236 33,857
Share premium 272,785 269,973
Own shares 33 (2,203) (1,124)
Other reserves 371,067 300,503
Equity attributable to equity holders of the Parent 675,885 603,209
Non-controlling interest 32 7,372 5,786
Total equity 683,257 608,995
The financial statements of Hikma Pharmaceuticals PLC, registered number 5557934, were approved by the Board of Directors and signed on its behalf by:
Said Darwazah Mazen DarwazahChief Executive Officer Executive Vice Chairman, CEO MENA
16 March 2010
Governance and fi
nancial results
Consolidated balance sheet – continuedat 31 December 2009
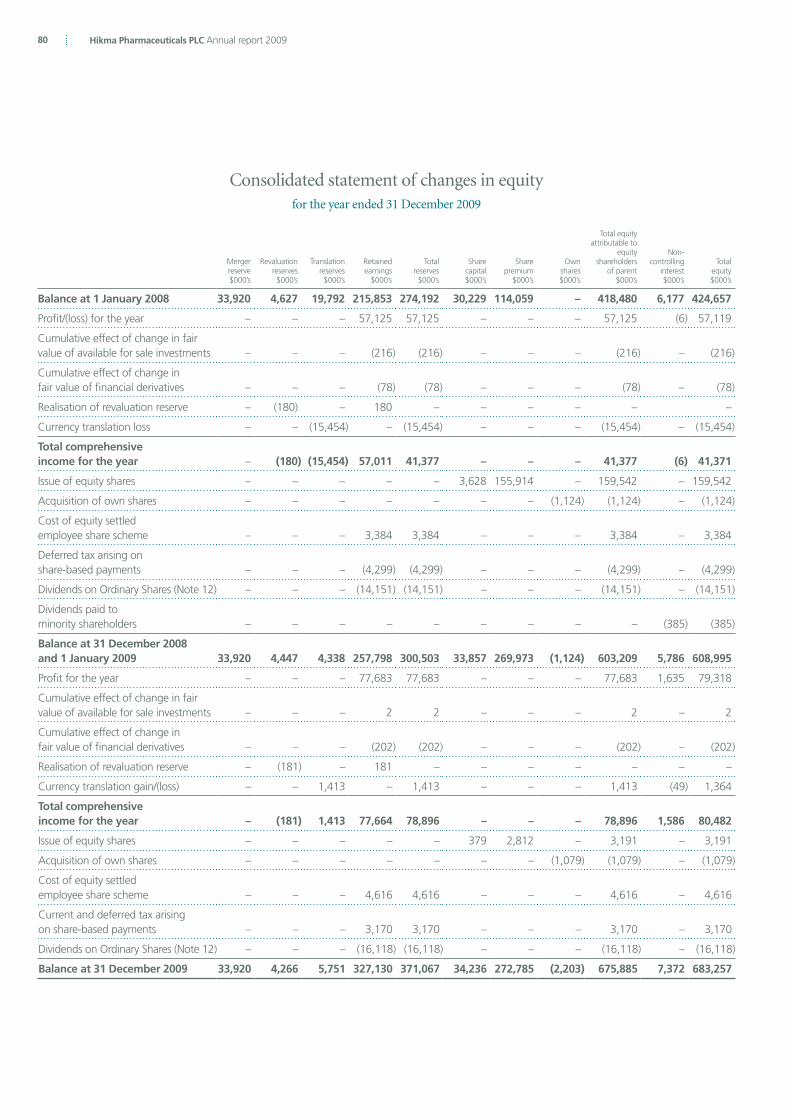
80 Hikma Pharmaceuticals PLC Annual report 2009
Merger reserve$000’s
Revaluation reserves$000’s
Translation reserves$000’s
Retained earnings
$000’s
Total reserves$000’s
Share capital$000’s
Share premium
$000’s
Own shares$000’s
Total equity attributable to
equity shareholders
of parent$000’s
Non-controlling
interest$000’s
Total equity$000’s
Balance at 1 January 2008 33,920 4,627 19,792 215,853 274,192 30,229 114,059 – 418,480 6,177 424,657
Profit/(loss) for the year – – – 57,125 57,125 – – – 57,125 (6) 57,119
Cumulative effect of change in fair value of available for sale investments – – – (216) (216) – – – (216) – (216)
Cumulative effect of change in fair value of financial derivatives – – – (78) (78) – – – (78) – (78)
Realisation of revaluation reserve – (180) – 180 – – – – – –
Currency translation loss – – (15,454) – (15,454) – – – (15,454) – (15,454)
Total comprehensive income for the year – (180) (15,454) 57,011 41,377 – – – 41,377 (6) 41,371
Issue of equity shares – – – – – 3,628 155,914 – 159,542 – 159,542
Acquisition of own shares – – – – – – – (1,124) (1,124) – (1,124)
Cost of equity settled employee share scheme – – – 3,384 3,384 – – – 3,384 – 3,384
Deferred tax arising on share-based payments – – – (4,299) (4,299) – – – (4,299) – (4,299)
Dividends on Ordinary Shares (Note 12) – – – (14,151) (14,151) – – – (14,151) – (14,151)
Dividends paid to minority shareholders – – – – – – – – – (385) (385)
Balance at 31 December 2008 and 1 January 2009
33,920 4,447 4,338 257,798 300,503 33,857 269,973 (1,124) 603,209 5,786 608,995
Profit for the year – – – 77,683 77,683 – – – 77,683 1,635 79,318
Cumulative effect of change in fair value of available for sale investments – – – 2 2 – – – 2 – 2
Cumulative effect of change in fair value of financial derivatives – – – (202) (202) – – – (202) – (202)
Realisation of revaluation reserve – (181) – 181 – – – – – – –
Currency translation gain/(loss) – – 1,413 – 1,413 – – – 1,413 (49) 1,364
Total comprehensive income for the year – (181) 1,413 77,664 78,896 – – – 78,896 1,586 80,482
Issue of equity shares – – – – – 379 2,812 – 3,191 – 3,191
Acquisition of own shares – – – – – – – (1,079) (1,079) – (1,079)
Cost of equity settled employee share scheme – – – 4,616 4,616 – – – 4,616 – 4,616
Current and deferred tax arising on share-based payments – – – 3,170 3,170 – – – 3,170 – 3,170
Dividends on Ordinary Shares (Note 12) – – – (16,118) (16,118) – – – (16,118) – (16,118)
Balance at 31 December 2009 33,920 4,266 5,751 327,130 371,067 34,236 272,785 (2,203) 675,885 7,372 683,257
Consolidated statement of changes in equityfor the year ended 31 December 2009

81
Governance and fi
nancial results
Consolidated cash flow statementfor the year ended 31 December 2009
Notes2009
$000’s2008
$000’s
Net cash from operating activities 34 118,979 74,969
Investing activities
Purchases of property, plant and equipment (35,170) (56,205)
Proceeds from disposal of property, plant and equipment 1,080 1,003
Purchase of intangible assets (5,213) (9,313)
Proceeds from disposal of intangible assets 1,316 1,257
Change in interest in joint venture 2 (910)
Investment in financial and other non current assets (193) (787)
Investment in available for sale investments (net) – 252
Payments of prior year acquisition costs – (2,234)
Finance income 514 817
Net cash used in investing activities (37,664) (66,120)
Financing activities
(Increase)/decrease in collateralised cash (1,515) 4,809
Increase in long-term financial debts 39,275 101,685
Repayment of long-term financial debts (33,570) (48,933)
Decrease in short-term borrowings (56,983) (159,237)
Increase/(decrease) in obligations under finance leases 1,784 (436)
Dividends paid (16,118) (14,151)
Dividends paid to non-controlling shareholders – (385)
Purchase of own shares (1,079) (1,124)
Interest paid (13,461) (17,097)
Proceeds from issue of new shares 3,191 162,026
Costs of issue of new shares – (2,484)
Net cash (used in)/from financing activities (78,476) 24,673
Net increase in cash and cash equivalents 2,839 33,522
Cash and cash equivalents at beginning of year 62,727 28,905
Foreign exchange translation movements 97 300
Cash and cash equivalents at end of year 65,663 62,727

82 Hikma Pharmaceuticals PLC Annual report 2009
Notes to the consolidated financial statements
1. Adoption of new and revised standardsThe following new and revised Standards and Interpretations have been adopted in the current year. Their adoption has not had any significant impact on the amounts reported in these financial statements but may impact the accounting for future transactions and arrangements.
IAS 1 (revised 2007) Presentation of Financial statements IAS 1 (2007) has introduced a number of changes in format and contents of the financial statements.
IAS 23 (revised 2007) Borrowing Costs
The principal change to the Standard was to eliminate the option to expense all borrowing costs when incurred. This change has had no impact on these financial statements because it has always been the Group’s accounting policy to capitalise borrowing costs incurred on qualifying assets.
Amendments to IAS 32 Financial Instruments: Presentation and IAS 1 Presentation of Financial Statements – Puttable Financial Instruments and Obligations Arising on Liquidation
The revisions to IAS 32 amend the criteria for debt/equity classification by permitting certain puttable financial instruments and instruments (or components of instruments) that impose on an entity an obligation to deliver to another party a pro-rate share of the net assets of the entity only on liquidation, to be classified as equity, subject to specified criteria being met.
Amendments to IAS 39 Financial Instruments: Recognition and Measurement – Eligible Hedged Items
The amendments provide clarification on two aspects of hedge accounting: identifying inflation as a hedged risk or portion, and hedging with options.
Embedded Derivatives (Amendments to IFRIC 9) Reassessment of Embedded Derivatives and IAS 39 Financial Instruments: Recognition and Measurement
The amendments clarify the accounting for embedded derivatives in the case of a reclassification of a financial asset out of the “fair value through profit or loss” (FVTPL) category as permitted by the October 2008 amendments to IAS 39 Financial Instruments: Recognition and Measurement (see above).
IFRS 8 Operating Segments
The Group has adopted IFRS 8 Operating Segments with effect from 1 January 2009. IFRS 8 requires operating segments to be identified on the basis of internal reports about components of the Group that are regularly reviewed by the Chief Executive to allocate resources to segments and to assess their performance. In contrast, the predecessor Standard (IAS 14 Segment Reporting) required the Group to identify two sets of segments (business and geographical), using a risks and returns approach, with the Group’s system of internal financial reporting to key management personnel serving only as the starting point for the identification of such segments.
Improving Disclosures about Financial Instruments (Amendments to IFRS 7 Financial Instruments: Disclosures)
The amendments to IFRS 7 expand the disclosures required in respect of fair value measurements and liquidity risk.
Amendment to IFRS 2 Share-based Payment – Vesting Conditions and Cancellations
The amendments clarify the definition of vesting conditions for the purposes of IFRS 2, introduce the concept of “non-vesting” conditions and clarify the accounting treatment for cancellations.
Amendments to IAS 20 – Accounting for Government Grants and Disclosure of Government Assistance
IAS 20 has been amended to require that the benefit of a government loan at a below-market rate of interest to be treated as a government grant. This accounting treatment was not permitted prior to this amendment.

83
Governance and fi
nancial results
1. Adoption of new and revised standards continued
IFRIC 16 – Hedges of a Net Investment in a Foreign Operation The Interpretation provides guidance on the detailed requirements for net investment hedging for certain hedge accounting designations.
IFRIC 18 – Transfers of Assets from customers
The Interpretation addresses the accounting by recipients for transfers of property, plant and equipment from “customers” and concludes what item of property, plant and equipment transferred meets the definition of an asset from the perspective of the recipient, the recipient should recognise the asset at its fair value on the date of transfer, with the credit recognised in accordance with IAS 18 Revenue.
At the date of authorisation of these financial statements, the following Standards and Interpretations which have not been applied in these financial statements were in issue but not yet effective (and in some cases had not yet been adopted by the EU):
IFRS 1 (amended)/IAS 27 (amended) Cost of an Investment in a Subsidiary, Jointly Controlled Entity or Associate
IFRS 2 (amended) Group cash-settled share based payment transactions
IFRS 3 (revised 2008) Business Combinations
IAS 24 (amended) Related Party Disclosures
IAS 27 (revised 2008) Consolidated and Separate Financial Statements
IAS 28 (revised 2008) Investments in Associates
IAS 32 (amended) Classification of Rights Issues
IFRIC 17 Distributions of Non-cash Assets to Owners
IFRS 9 Financial Instruments
IFRIC 14 Prepayments of a minimum funding requirements
IFRIC 19 Extinguishing financial liabilities with equity instruments
Improvements to IFRSs (April 2009)
The Directors anticipate that the adoption of these Standards and Interpretations in future periods will have no material impact on the financial statements of the Group except for treatment of acquisition of subsidiaries and associates when IFRS 3 (revised 2008), IAS 27 (revised 2008) and IAS 28 (revised 2008) come into effect for business combinations for which the acquisition date is on or after 1 January 2010.
2. Significant accounting policies
General InformationHikma Pharmaceuticals PLC is a company incorporated in the United Kingdom under the Companies Act. The address of the registered office is given on page 131.
Basis of accountingHikma Pharmaceuticals PLC’s consolidated financial statements are prepared in accordance with International Financial Reporting Standards (IFRSs) issued by the International Accounting Standards Board. The financial statements have also been prepared in accordance with IFRSs adopted for use in the European Union and therefore comply with Article 4 of the EU IAS Regulation. The financial statements have been prepared under the historical cost convention, except for the revaluation to market of certain financial assets and liabilities.
The Group’s previously published financial statements were also prepared in accordance with International Financial Reporting Standards. The presentational and functional currency of Hikma Pharmaceuticals PLC is the US Dollar as the majority of the Company’s business is conducted
in US Dollars (USD). The significant accounting policies are set out below.
84 Hikma Pharmaceuticals PLC Annual report 2009
2. Significant accounting policies continued
Basis of consolidationThe consolidated financial statements incorporate the results of Hikma Pharmaceuticals PLC (the “Company”) and entities controlled by the Company (together the “Group”) and the Group’s share of the results and net assets of its associates. Control is achieved where the Company has the ability to govern the financial and operating policies either directly or indirectly of an investee entity so as to obtain benefits from its activities.
On acquisition, the assets and liabilities and contingent liabilities of a subsidiary are measured at their fair values at the date of acquisition. Any excess of the cost of acquisition over the fair values of the identifiable net assets acquired is recognised as goodwill. Non-controlling interests in the net assets of consolidated subsidiaries are identified separately from the Group’s equity therein. The non-controlling interest is stated at the minority’s proportion of the fair values of the assets and liabilities recognised. Subsequently, any losses applicable to the non-controlling interest in excess of the non-controlling interest are allocated against the interests of the parent. The results of subsidiaries acquired or disposed of during the year are included in the consolidated statement of comprehensive income from the effective date of acquisition or up to the effective date of disposal, as appropriate. Where necessary, adjustments are made to the financial statements of subsidiaries to bring the accounting policies used in line with those used by the Group. All intra-Group transactions, balances, income and expenses are eliminated on consolidation.
The acquisition of subsidiaries is accounted for using the purchase method. The cost of the acquisition is measured at the aggregate of the fair values, at the date of exchange, of assets given, liabilities incurred or assumed, and equity instruments issued by the Group in exchange for control of the acquiree, plus any costs directly attributable to the business combination. The acquiree’s identifiable assets, liabilities and contingent liabilities that meet the conditions for recognition under IFRS 3 are recognised at their fair value at the acquisition date.
Goodwill arising on acquisition is recognised as an asset and initially measured at cost, being the excess of the cost of the business combination over the Group’s interest in the net fair value of the identifiable assets, liabilities and contingent liabilities recognised. If, after reassessment, the Group’s interest in the net fair value of the acquiree’s identifiable assets, liabilities and contingent liabilities exceeds the cost of the business combination, the excess is recognised immediately in the statement of comprehensive income.
The non-controlling interest in the acquiree is initially measured at the minority’s proportion of the net fair value of the assets, liabilities and contingent liabilities recognised.
Going concernThe Directors have, at the time of approving the financial statements, a reasonable expectation that the Company and the Group have adequate resources to continue in operational existence for the foreseeable future. Thus they continue to adopt the going concern basis of accounting in preparing the financial statements (see page 60).
Investment in associatesAn associate is an entity over which the Group is in a position to exercise significant influence, but not control or joint control, through participation in the financial and operating policy decisions of the investee.
The results and assets and liabilities of associates are incorporated in the financial statements using the equity method of accounting except when classified as held for sale.
Significant influence is the power to participate in the financial and operating policy decisions of the investee, but not control or joint control over these policies.
Investment in joint ventureA joint venture is a contractual arrangement whereby the Group and a third party undertake an economic activity that is subject to joint control. Joint control is the contractually agreed sharing of control over an economic activity, and exists only when the strategic financial and operating decisions relating to the activity require the unanimous consent of the parties sharing control (the venturers).
Each venturer contributes cash or other resources to the jointly controlled entity. These contributions are included in the accounting records of the venturer and recognised in its financial statements as an investment in the jointly controlled entity.
The Group recognises its interest in the joint venture using proportionate consolidation. The application of proportionate consolidation means that the balance sheet of the Group includes its share of the assets that it controls jointly and its share of the liabilities for which it is jointly responsible.
Notes to the consolidated statements continued
85
Governance and fi
nancial results
2. Significant accounting policies continued
Intangible assets(a) Goodwill arising on consolidation represents the excess of the cost of acquisition over the Group’s interest in the fair value of the identifiable assets and liabilities of a subsidiary at the date of acquisition. Goodwill is initially recognised as an asset at cost and is subsequently measured at cost less any accumulated impairment losses.
Goodwill which is recognised as an asset is reviewed for impairment at least annually. Any impairment is recognised immediately in profit or loss and is not subsequently reversed.
For the purpose of impairment testing, goodwill is allocated to each of the Group’s cash-generating units. Cash-generating units to which goodwill has been allocated are tested for impairment annually, or more frequent when there is an indication that the unit may be impaired. If the recoverable amount of the cash-generating unit is less than the carrying amount of the unit, the impairment loss is allocated first to reduce the carrying amount of any goodwill allocated to the unit and then to the other assets of the unit pro-rata on the basis of the carrying amount of each asset in the unit.
On disposal of a subsidiary, the attributable amount of goodwill is included in the determination of the profit or loss on disposal.
(b) Marketing rights are amortised over their useful lives commencing in the year in which the rights first generate sales.
(c) Customer relationships represent the value attributed to the long term relationships held with existing customers at the date of acquisition and are amortised over their useful economic life.
(d) Product related intangibles (i) product files and under-licenced products are assigned indefinite useful lives which are reviewed for impairment at least annually; and
(ii) Under licence agreements and product dossiers are amortised over their useful lives in the year of acquisition.
(e) Purchased software is amortised over the useful economic lives when the asset is available for use.
(f) In process research and development recognised on acquisition is amortised over the useful life in the year of acquisition.
(g) Trade name some trade names are assigned indefinite useful lives and others have finite useful lives over which they are amortised where applicable, in the period from acquisition.
Foreign currenciesFor the purpose of the consolidated financial statements, the results and financial position of each Group company are expressed in US dollars, the functional currency of Hikma Pharmaceuticals PLC and the presentational currency of the consolidated financial statements.
Transactions in currencies other than local currency are recorded at the rates of exchange prevailing on the dates of the transactions. At each balance sheet date, monetary assets and liabilities that are denominated in foreign currencies are retranslated at the rates prevailing on the balance sheet date. Non-monetary assets and liabilities carried at fair value that are denominated in foreign currencies are translated at the rates prevailing at the date when the fair value was determined. Non-monetary items that are measured in terms of historical cost in a foreign currency are not retranslated.
Gains and losses arising on retranslation are included in net profit or loss for the period, except for exchange differences arising on non-monetary assets and liabilities where the changes in fair value and the related foreign exchange are recognised directly in equity.
On consolidation, the assets and liabilities of the Group’s overseas operations are translated at exchange rates prevailing on the balance sheet date. Income and expense items are translated at the average exchange rates for the period. Exchange differences arising, if any, are classified as equity and transferred to the Group’s translation reserve. Such cumulative translation differences are recognised as income or as expenses in the period in which the operation is disposed of.
Goodwill and fair value adjustments arising on the acquisition of a foreign entity are treated as assets and liabilities of the foreign entity and translated at the closing rate.
Revenue recognitionRevenue is recognised in the statement of comprehensive income when goods or services are supplied or made available to external customers against orders received and when title and risk of loss has passed.
Revenue represents the amounts receivable after the deduction of discounts, value added tax, other sales taxes, and allowances given, provisions for chargebacks and accruals for estimated future rebates and returns. The methodology and assumptions used to estimate rebates and returns are monitored and adjusted regularly in light of contractual and historical information and past experience.
86 Hikma Pharmaceuticals PLC Annual report 2009
Notes to the consolidated financial statements continued
2. Significant accounting policies continued
Chargebacks The provision for chargebacks is the most significant and complex estimate used in the recognition of revenue. In the USA the Group sells its products directly to wholesale distributors, generic distributors, retail pharmacy chains and mail-order pharmacies. The Group also sells its products indirectly to independent pharmacies, managed care organisations, hospitals, and Group purchasing organisations, collectively referred to as “indirect customers”. The Group enters into agreements with its indirect customers to establish pricing for certain products. The indirect customers then independently select a wholesaler from which they purchase the products at agreed-upon prices. The Group will provide credit to the wholesaler for the difference between the agreed-upon price with the indirect customer and the wholesaler’s invoice price. This credit is called a chargeback. The provision for chargebacks is based on historical sell-through levels by the Group’s wholesale customers to the indirect customers, and estimated wholesaler inventory levels. As sales are made to the large wholesale customers, the Group continually monitors the reserve for chargebacks and makes adjustments when it believes that actual chargebacks may differ from estimated reserves.
Returns and rebates In certain countries and consistent with industry practice, the Group has a product return policy that allows selected customers to return the product within a specified period prior to and subsequent to the expiration date, in exchange for a credit to be applied to future purchases.
The Group estimates its provision for returns and rebates based on historical experience, changes to business practices and credit terms. While such experience has allowed for reasonable estimations in the past, history may not always be an accurate indicator of future returns. The Group continually monitors the provisions for returns and rebates, and makes adjustments when it believes that actual product returns may differ from established reserves.
Price adjustments Price adjustments, also known as “shelf stock adjustments”, are credits issued to reflect decreases in the selling prices of the Group’s products that customers have remaining in their inventories at the time of the price reduction. Decreases in selling prices are discretionary decisions made by Group management to reflect competitive market conditions. Amounts recorded for estimated shelf stock adjustments are based upon specified terms with direct customers, estimated declines in market prices and estimates of inventory held by customers. The Group regularly monitors these and other factors and re-evaluates the reserve as additional information becomes available.
Borrowing costsBorrowing costs directly attributable to the acquisition, construction or production of qualifying assets, which are assets that necessarily take a substantial period of time to get ready for their intended use or sale, are added to the cost of those assets, until such time as the assets are substantially ready for their intended use or sale.
To the extent that variable rate borrowings are used to finance a qualifying asset and are hedged in an effective cash flow hedge of interest rate risk, the effective portion of the derivative is deferred in equity and released to profit or loss when the qualifying asset impacts profit or loss. To the extent that fixed rate borrowings are used to finance a qualifying asset and are hedged in an effective fair value hedge of interest rate risk, the capitalised borrowing costs reflect the hedged interest rate.
Investment income earned on the temporary investment of specific borrowings pending their expenditure on qualifying assets is deducted from the borrowing costs eligible for capitalisation.
All other borrowing costs are recognised in profit or loss in the period in which they are incurred.
Dividend incomeIncome from investments is recognised when the shareholders’ rights to receive payment have been established.
LeasingLeases are classified as capital leases whenever the terms of the lease transfer substantially all the risks and rewards of ownership to the lessee. All other leases are classified as operating leases. Rentals payable under operating leases are charged to income on a straight-line basis over the term of the operating lease. Benefits received and receivable as an incentive to enter into an operating lease are also spread on a straight-line basis over the lease term.
Assets held under capital leases are recognised as assets of the Group at their fair value or, if lower, at the present value of the minimum lease payments, each determined at the inception of the lease. The corresponding liability to the lessor is included in the balance sheet as a capital lease obligation. Lease payments are apportioned between finance charges and reduction of the lease obligation so as to achieve a constant rate of interest on the remaining balance of the liability.

87
Governance and fi
nancial results
2. Significant accounting policies continued
Government grantsGovernment grants relating to property, plant and equipment are treated as deferred income and released to the statement of comprehensive income over the expected useful lives of the assets concerned.
Research and developmentResearch and development expenses are fully charged to the statement of comprehensive income, as the Group considers that the regulatory and other uncertainties inherent in the development of its products generally mean that the recognition criteria in IAS 38 “Intangible assets” are not met. Where, however the recognition criteria are met, intangible assets will be recognised and amortised over their useful economic life.
Retirement benefit costsPayments to defined contribution retirement benefit schemes are charged as an expense as they fall due. Payments made to state-managed retirement benefit schemes are dealt with as payments to defined contribution schemes where the Group’s obligations under the schemes are equivalent to those arising in a defined contribution retirement benefit scheme.
TaxThe Group provides for income tax according to the laws and regulations prevailing in the countries where the Group operates. Furthermore, the Group computes and records deferred tax assets and liabilities according to IAS 12 “Income Taxes”.
The tax expense represents the sum of the tax currently payable and deferred tax.The tax currently payable is based on taxable profit for the year. Taxable profit differs from net profit as reported in the statement of comprehensive
income because it excludes items of income or expense that are taxable or deductible in other years and it further excludes items that are never taxable or deductible. The Group’s liability for current tax is calculated using tax rates that have been enacted or substantively enacted by the balance sheet date.
Deferred tax is the tax expected to be payable or recoverable on differences between the carrying amounts of assets and liabilities in the financial statements and the corresponding tax bases used in the computation of taxable profit, and is accounted for using the balance sheet liability method. Deferred tax liabilities are generally recognised for all taxable temporary differences and deferred tax assets are recognised to the extent that it is probable that taxable profits will be available against which deductible temporary differences can be utilised. Such assets and liabilities are not recognised if the temporary difference arises from goodwill or from the initial recognition (other than in a business combination) of other assets and liabilities in a transaction that affects neither the tax profit nor the accounting profit.
Deferred tax liabilities are recognised for taxable temporary differences arising on investments in subsidiaries and associates, and interests in joint ventures, except where the Group is able to control the reversal of the temporary difference and it is probable that the temporary difference will not reverse in the foreseeable future.
The carrying amount of deferred tax assets is reviewed at each balance sheet date and reduced to the extent that it is no longer probable that sufficient taxable profits will be available to allow all or part of the asset to be recovered.
Deferred tax is calculated at the tax rates that are expected to apply in the period when the liability is settled or the asset is realised. Deferred tax is charged or credited in the statement of comprehensive income, except when it relates to items charged or credited directly to equity, in which case the deferred tax is also dealt with in equity.
Deferred tax assets and liabilities are offset when there is a legally enforceable right to offset current tax assets against current tax liabilities and when they relate to income taxes levied by the same taxation authority and the Group intends to settle its current tax assets and liabilities on a net basis.
Share-based payment transactionsEmployees (including directors) of the Group receive remuneration in the form of share-based payments, whereby employees render services in exchange for shares or rights over shares (“equity-settled transactions”).
Share-based paymentsIFRS 2 “Share-based Payments” requires an expense to be recognised when the Group buys goods or services in exchange for share or rights over shares (“share-based payments”) or in exchange for other equivalent assets.
The cost of share based payments’ transactions with employees is measured by reference to the fair value at the date at which the share based payments are granted. The fair value of the equity settled stock options scheme is determined using a binomial model. The fair value of the long-term incentive plan is determined using a Monte Carlo valuation model. The expected life used in the models has been adjusted, based on management’s best estimate, for the effects of non-transferability, exercise restrictions, and behavioural considerations (further details are given in note 36). In valuing share based payments, no account is taken of any performance conditions, other than conditions linked to the market price of the shares of Hikma Pharmaceuticals PLC.

88 Hikma Pharmaceuticals PLC Annual report 2009
Notes to the consolidated financial statements continued
2. Significant accounting policies continued
Share-based payments (continued)The cost of share-based payments is recognised, together with a corresponding increase in equity, on a straight-line basis over the vesting period based on the Group’s estimate of shares that will eventually vest. No expense is recognised for awards that do not ultimately vest. Where the terms of a share-based payments award are modified, as a minimum an expense is recognised as if the terms had not been modified. In addition, an expense is recognised for any increase in the value of the transaction as a result of the modification, as measured at the modification date. Where a share based payments award is cancelled, it is treated as if it had vested on the date of cancellation, and any expense not yet recognised for the award is recognised immediately. However, if a new award is substituted for a cancelled award, and designated as a replacement award on the date that it is granted, the cancelled and new awards are treated as if they were a modification of the original award, as described in the previous paragraph. The dilutive effect of outstanding share based payments is reflected as additional share dilution in the computation of diluted earnings per share.
Property, plant and equipmentProperty, plant and equipment have been stated at cost on acquisition and are depreciated, except for land, on a straight-line basis at the following depreciation rates:
Buildings 2% to 4%
Vehicles 10% to 20%
Fixtures & equipment 6% to 33%
Projects under construction are not depreciated until construction has been completed.Any additional costs that extend the useful life of property, plant and equipment are capitalised. Property, plant and equipment which are financed
by leases giving Hikma Pharmaceuticals PLC substantially all the risks and rewards of ownership are capitalised at the lower of the fair value of the asset and the present value of the minimum lease payments at the inception of the lease, and depreciated in the same manner as other property, plant and equipment over the shorter of the lease term or their useful life. Whenever the recoverable amount of an asset is impaired, the carrying value is reduced to the recoverable amount and the impairment loss is taken to the statement of comprehensive income. Projects under construction are carried at cost, less any recognised impairment loss.
Depreciation of these assets, on the same basis as other property assets, commences when the assets are ready for their intended use.The gain or loss arising on the disposal or retirement of an asset is determined as the difference between the sales proceeds and the carrying
amount of the asset and is recognised in the statement of comprehensive income.
InventoriesInventories are stated at the lower of cost and net realisable value. Purchased products are stated at acquisition cost and all other costs incurred in bringing each product to its present location and condition. Cost of own-manufactured products comprises direct materials and, where applicable, direct labour costs and those overheads that have been incurred in bringing the inventories to their present location and condition. In the balance sheet, inventory is primarily valued at standard cost, which approximates to historical cost determined on a moving average basis, and this value is used to determine the cost of sales in the statement of comprehensive income. Net realisable value represents the estimated selling price in the ordinary course of business, less all estimated costs of completion and all estimated costs necessary to make the sale. Provisions are made for inventories with net realisable value lower than cost or for slow moving inventory.
Financial instruments Financial assets and financial liabilities are recognised on the Group’s balance sheet when the Group becomes a party to the contractual provisions of the instrument.
Derivative financial instruments are used to manage the Group’s exposure to interest rate and foreign exchange risks. The principal derivative instruments used by the Group are interest rate swaps and foreign exchange forward and option contracts. The Group does not hold or issue derivative financial instruments for trading or speculative purposes.
Derivative financial instruments are initially recognised in the balance sheet at cost and then re-measured at subsequent reporting dates to fair value. The resulting gain or loss is recognised in profit or loss immediately unless the derivative is designated and effective as a hedging instrument, in which event the timing of the recognition in profit or loss depends on the nature of the hedge relationship.
Hedging derivatives are classified on inception as fair value hedges, cash flow hedges or net investment hedges. Changes in the fair value of derivatives designed as fair value hedges are recorded in the statement of comprehensive income, with the changes in the fair value of the hedged asset or liability.
Changes in the fair value of derivatives designed as cash flow hedges are recognised in equity. Amounts deferred in equity are transferred to the statement of comprehensive income in line with the hedged forecast transaction.
Hedges of net investments in foreign entities are accounted for in a similar way to cash flow hedges.Changes in the fair value of any derivative instruments that do not qualify for hedge accounting are recognised immediately in the statement
of comprehensive income.

89
Governance and fi
nancial results
2. Significant accounting policies continued
Investments Available for sale investments with quoted market prices are initially recognised at cost on acquisition and re-measured to their fair values at year-end. Gains or losses on re-measurement to fair value are recognised in shareholders’ equity until the investments are sold, disposed of, or determined to be impaired, at which time the cumulative gains or loss relating to these investments previously recognised in equity is included in the statement of comprehensive income. Available for sale financial assets without market prices and the fair value of which cannot be reliably measured are stated at cost, less a provision for any impairment loss, which is taken to the statement of comprehensive income.
The fair value of quoted financial assets represents the closing price in the financial markets at the date of the financial statements. However, the fair value of unquoted financial assets, or those with no declared price are estimated by comparing the fair value of a similar financial instrument or through a discounted cash flow method.
Accounts receivable Trade receivables are measured at initial recognition at fair value. Appropriate allowances for estimated irrecoverable amounts are recognised in profit or loss when there is objective evidence that the asset is impaired. The allowance recognised is measured as the difference between the asset’s carrying amount and the present value of estimated future cash flows discounted at the effective interest rate computed at initial recognition.
Cash and cash equivalents Cash and cash equivalents include highly liquid investments with original maturities of three months or less and are subject to an insignificant risk of changes in value.
Bank borrowings Interest-bearing bank loans and overdrafts are recorded at the proceeds received, net of direct issue costs. Finance charges, including premiums payable on settlement or redemption and direct issue costs, are accounted for on an accrual basis using the effective interest method and are added to the carrying amount of the instrument to the extent that they are not settled in the period in which they arise.
Trade payables Trade payables are not interest-bearing and are stated at fair value.
Equity instruments Equity instruments issued by the Group are recorded at the proceeds received, net of direct issue costs.
Provisions Provisions are recognised when the Group has a present obligation (legal or constructive) as a result of a past event, it is probable that an outflow of resources will be required to settle the obligations and a reliable estimate can be made of the amount of the obligation.
Impairment of tangible and intangible assets excluding goodwillAt each balance sheet date, the Group reviews the carrying amounts of its tangible and intangible assets to determine whether there is any indication that those assets have suffered an impairment loss. If any such indication exists, the recoverable amount of the asset is estimated in order to determine the extent of the impairment loss. An intangible asset with an indefinite useful life is tested for impairment annually and whenever there is an indication that the asset may be impaired.
Recoverable amount is the higher of fair value less costs to sell and value in use. In assessing value in use, the estimated future cash flows are discounted to their present value using a pre-tax discount rate that reflects current market assessments of the time value of money and the risks specific to the asset for which the estimates of future cash flows have not been adjusted.
If the recoverable amount of an asset (or income-generating unit) is estimated to be less than its carrying amount, the carrying amount of the asset (income-generating unit) is reduced to its recoverable amount. An impairment loss is recognised as an expense immediately.
Where an impairment loss subsequently reverses, the carrying amount of the asset (cash-generating unit) is increased to the revised estimate of its recoverable amount, but so that the increased carrying amount does not exceed the carrying amount that would have been determined had no impairment loss been recognised for the asset (cash-generating unit) in prior years. A reversal of an impairment loss is recognised as income immediately.
90 Hikma Pharmaceuticals PLC Annual report 2009
Notes to the consolidated financial statements continued
3. Critical accounting judgements and key sources of estimation uncertaintyIn the application of the Group’s accounting policies, which are described in Note 2, the Directors are required to make judgements, estimates and assumptions about the carrying amounts of assets and liabilities that are not readily apparent from other sources. The estimates and associated assumptions are based on historical experience and other factors that are considered to be relevant. Actual results may differ from these estimates.
The estimates and underlying assumptions are reviewed on an ongoing basis. Revisions to accounting estimates are recognised in the period in which the estimate is revised if the revision affects only that period or in the period of the revision and future periods if the revision affects both current and future periods.
The Group’s management believes that, among others, the following accounting policies that involve management judgements and estimates are the most critical to understanding and evaluating the Group’s financial results.
Chargebacks(see details above)
Revenue recognition The Group’s revenue recognition policies require management to make a number of estimates, with the most significant relating to chargebacks, product returns, rebates and price adjustments which vary by product arrangements and buying groups.
Accounts receivable and bad debtsThe Group estimates, based on its historical experience, the level of debts that it believes will not be collected. Such estimates are made when collection of the full amount of the debt is no longer probable. These estimates are based on a number of factors including specific customer issues and industry, economic and political conditions. Bad debts are written-off when identified.
Goodwill and intangible assetsThe critical areas of judgement in relation to goodwill and intangible assets are the useful economic lives of the product-related intangibles and the growth rates used in the impairment tests for goodwill.
Contingent liabilities The Group is involved in various legal proceedings considered typical to its business relating to employment, product liability and other commercial disputes. Often this litigation is subject to substantial uncertainties, and therefore the probability of a loss, if any, being sustained or an estimate of the amount of any loss, is difficult to ascertain. Consequently, it is often not practicable to make a reasonable estimate of the possible financial effect, if any, that could arise from the ultimate resolution of legal proceedings. In such cases, where the Group believes that a disclosure is required, information regarding the nature and facts of the case is disclosed. For current matters see Note 35. Although there can be no assurance regarding the outcome of the disclosed legal proceeding, based on management’s current and considered view, the Group does not expect it to have a materially adverse effect on our financial position. This position could change over time.

91
Governance and fi
nancial results
4. Segmental reportingFor management purposes, the Group is currently organised into three operating divisions – Generic, Branded and Injectables. These divisions are the basis on which the Group reports its segment information.
The Group discloses underlying operating profit as the measure of segment result as this is the measure used in the decision-making and resource allocation process of the chief operating decision maker, who is the Group’s Chief Executive Officer.
Information regarding the Group’s operating segments is reported below.
The following is an analysis of the Group’s revenue and results by reportable segment in 2009:
Year ended 31 December 2009Branded
$000’sInjectables
$000’sGeneric
$000’sOthers$000’s
Group$000’s
Revenue 352,674 144,069 135,060 5,081 636,884
Cost of sales (165,066) (81,162) (82,524) (3,707) (332,459)
Gross profit 187,608 62,907 52,536 1,374 304,425
Result
Adjusted segment result 96,029 17,859 25,360 (2,345) 136,903
Intangible amortisation* (4,580) (2,526) (343) – (7,449)
Segment result 91,449 15,333 25,017 (2,345) 129,454
Unallocated corporate expenses (22,161)
Operating profit 107,293
Finance income 514
Finance expense (12,827)
Other expense (193)
Profit before tax 94,787
Tax (15,469)
Profit for the year 79,318
Attributable to:
Non-controlling interest 1,635
Equity holders of the parent 77,683
79,318
* Intangible amortisation comprises the amortisation on intangible assets other than software.
“Others” mainly comprise Arab Medical Containers Ltd and International Pharmaceutical Research Center Ltd and the Chemicals division of Hikma Pharmaceuticals Ltd Jordan.
Unallocated corporate expenses are primarily made up of employee costs, office costs, professional fees and donations.
Segment assets and liabilities 2009Branded
$000’sInjectables
$000’sGeneric
$000’s
Corporate and Others
$000’sGroup$000’s
Additions to property, plant and equipment (cost) 23,827 9,594 2,925 609 36,955
Additions to intangible assets 1,889 2,591 709 24 5,213
Total property, plant and equipment and intangible assets (net book value) 341,548 157,938 30,815 8,766 539,067
Depreciation 14,715 4,730 4,567 1,187 25,199
Amortisation (including software) 5,509 2,956 434 50 8,949
Balance sheet
Total assets
Segment assets 679,112 204,220 119,093 20,296 1,022,721
Total liabilities
Segment liabilities 203,750 91,104 30,567 14,043 339,464
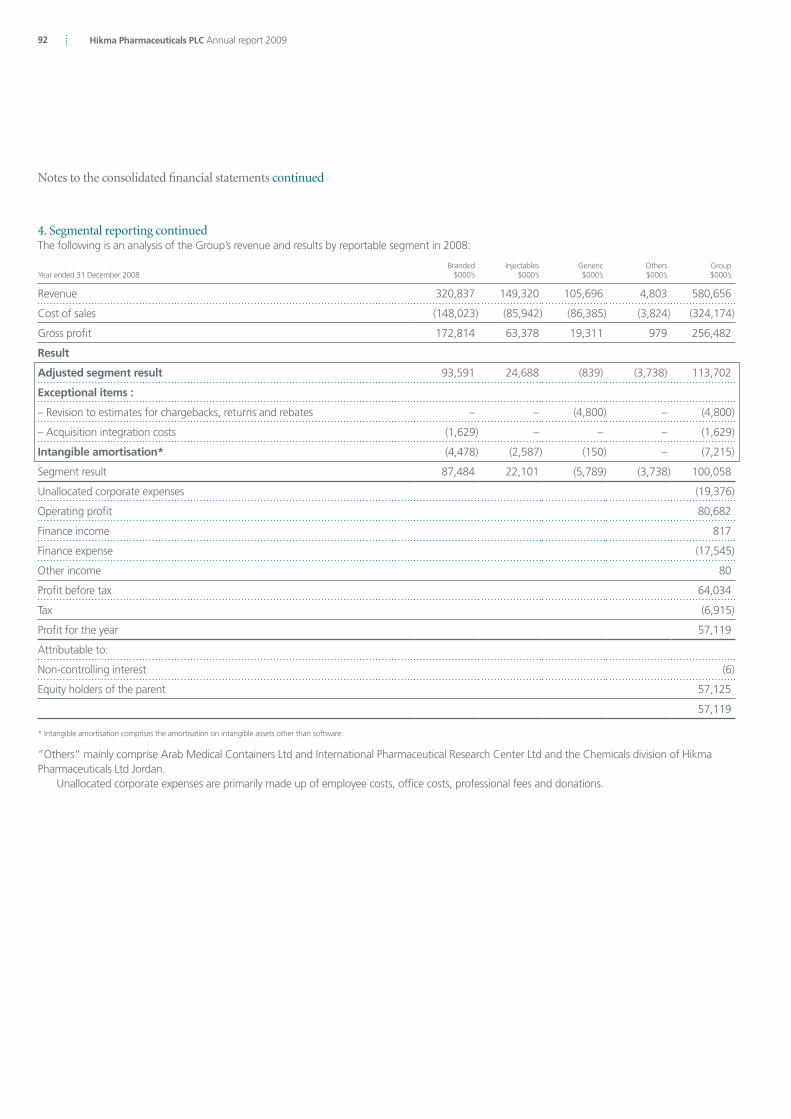
92 Hikma Pharmaceuticals PLC Annual report 2009
Notes to the consolidated financial statements continued
4. Segmental reporting continuedThe following is an analysis of the Group’s revenue and results by reportable segment in 2008:
Year ended 31 December 2008Branded
$000’sInjectables
$000’sGeneric$000’s
Others$000’s
Group$000’s
Revenue 320,837 149,320 105,696 4,803 580,656
Cost of sales (148,023) (85,942) (86,385) (3,824) (324,174)
Gross profit 172,814 63,378 19,311 979 256,482
Result
Adjusted segment result 93,591 24,688 (839) (3,738) 113,702
Exceptional items :
– Revision to estimates for chargebacks, returns and rebates – – (4,800) – (4,800)
– Acquisition integration costs (1,629) – – – (1,629)
Intangible amortisation* (4,478) (2,587) (150) – (7,215)
Segment result 87,484 22,101 (5,789) (3,738) 100,058
Unallocated corporate expenses (19,376)
Operating profit 80,682
Finance income 817
Finance expense (17,545)
Other income 80
Profit before tax 64,034
Tax (6,915)
Profit for the year 57,119
Attributable to:
Non-controlling interest (6)
Equity holders of the parent 57,125
57,119
* Intangible amortisation comprises the amortisation on intangible assets other than software.
“Others” mainly comprise Arab Medical Containers Ltd and International Pharmaceutical Research Center Ltd and the Chemicals division of Hikma Pharmaceuticals Ltd Jordan.
Unallocated corporate expenses are primarily made up of employee costs, office costs, professional fees and donations.
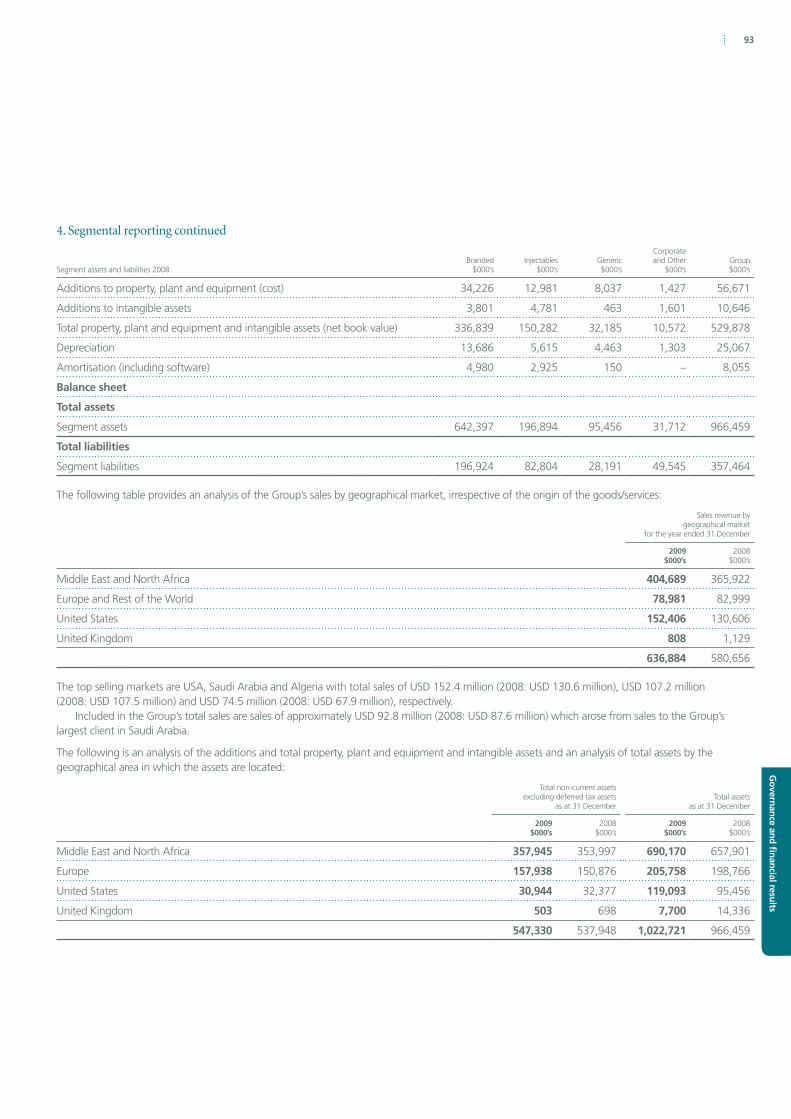
93
Governance and fi
nancial results
4. Segmental reporting continued
Segment assets and liabilities 2008Branded
$000’sInjectables
$000’sGeneric$000’s
Corporate and Other
$000’sGroup $000’s
Additions to property, plant and equipment (cost) 34,226 12,981 8,037 1,427 56,671
Additions to intangible assets 3,801 4,781 463 1,601 10,646
Total property, plant and equipment and intangible assets (net book value) 336,839 150,282 32,185 10,572 529,878
Depreciation 13,686 5,615 4,463 1,303 25,067
Amortisation (including software) 4,980 2,925 150 – 8,055
Balance sheet
Total assets
Segment assets 642,397 196,894 95,456 31,712 966,459
Total liabilities
Segment liabilities 196,924 82,804 28,191 49,545 357,464
The following table provides an analysis of the Group’s sales by geographical market, irrespective of the origin of the goods/services:
Sales revenue by geographical market
for the year ended 31 December
2009$000’s
2008$000’s
Middle East and North Africa 404,689 365,922
Europe and Rest of the World 78,981 82,999
United States 152,406 130,606
United Kingdom 808 1,129
636,884 580,656
The top selling markets are USA, Saudi Arabia and Algeria with total sales of USD 152.4 million (2008: USD 130.6 million), USD 107.2 million (2008: USD 107.5 million) and USD 74.5 million (2008: USD 67.9 million), respectively.
Included in the Group’s total sales are sales of approximately USD 92.8 million (2008: USD 87.6 million) which arose from sales to the Group’s largest client in Saudi Arabia.
The following is an analysis of the additions and total property, plant and equipment and intangible assets and an analysis of total assets by the geographical area in which the assets are located:
Total non-current assets excluding deferred tax assets
as at 31 DecemberTotal assets
as at 31 December
2009$000’s
2008$000’s
2009$000’s
2008$000’s
Middle East and North Africa 357,945 353,997 690,170 657,901
Europe 157,938 150,876 205,758 198,766
United States 30,944 32,377 119,093 95,456
United Kingdom 503 698 7,700 14,336
547,330 537,948 1,022,721 966,459

94 Hikma Pharmaceuticals PLC Annual report 2009
Notes to the consolidated financial statements continued
5. Exceptional items and intangible amortisationExceptional items are disclosed separately in the statement of comprehensive income to assist in the understanding of the Group’s underlying performance.
For the years ended 31 December
2009$000’s
2008$000’s
Revision to estimates for chargebacks, returns and rebates – (4,800)
Acquisition integration costs – (1,629)
Exceptional items – (6,429)
Intangible amortisation (7,449) (7,215)
Exceptional items and intangible amortisation* (7,449) (13,644)
Tax effect 1,531 3,408
Impact on profit for the year (5,918) (10,236)
*Intangible amortisation comprises the amortisation on intangible assets other than software.
Revision to estimates for chargebacks, returns and rebates represents a one-off charge taken against revenue during 2008.Acquisition integration costs represent expenses incurred in integrating APM and Hikma Pharma SAE (Egypt) into the Group. These are included within sales and marketing and general and administrative expenses.
6. Profit for the yearProfit for the year has been arrived at after charging/(crediting):
For the years ended 31 December
2009$000’s
2008$000’s
Net foreign exchange losses/(gains) 1,783 (1,012)
Research and development costs 16,843 22,172
Loss/(gain) on sale of property, plant and equipment 236 (6)
Depreciation of property, plant and equipment 25,199 25,067
Amortisation of intangible assets (including software) 8,949 8,055
Inventories:
Cost of inventories recognised as an expense 213,558 210,514
Write-down of inventories 12,501 8,589
Staff costs (see Note 7) 156,274 142,021
Auditors’ remuneration (see below) 1,302 1,524

95
Governance and fi
nancial results
6. Profit for the year continuedA detailed analysis of the Group’s auditors’ remuneration on a worldwide basis is provided below:
For the years ended 31 December
2009 $000’s
2008 $000’s
Audit of the Company’s annual accounts 330 397
Audit of the Company’s subsidiaries pursuant to legislation 624 661
Total audit fees 954 1,058
Audit related service* 119 268
Total audit and audit related fees 1,073 1,326
– Tax compliance services 103 7
– Tax advisory services 88 129
– Transaction due diligence services 38 62
Total non-audit fees 191 198
Total fees 1,302 1,524
*These fees predominantly relate to review procedures in respect of the interim financial information.
A description of the work of the Audit Committee is set out in the Audit Committee report on pages 57 to 59 and includes an explanation of how auditor objectivity and independence is safeguarded when non-audit services are provided by the auditors.
7. Staff costsThe average monthly number of employees (including Executive Directors) was:
For the years ended 31 December
2009Number
2008 Number
Production 2,689 2,554
Selling and marketing 1,567 1,254
Research and development 141 176
General and administrative 483 647
4,880 4,631
For the years ended 31 December
2009$000’s
2008$000’s
*
Their aggregate remuneration comprised:
Wages, salaries and bonuses 110,779 102,414
Social security costs 9,278 7,977
Post employment benefits 2,187 1,944
End of service indemnity 2,982 4,007
Share-based payments 4,616 3,384
Car and housing allowance 12,075 9,798
Other costs and employee benefits 14,357 12,497
156,274 142,021
*The 2008 comparatives have been restated. The net impact on the balance sheet and the statement of comprehensive income is nil.

96 Hikma Pharmaceuticals PLC Annual report 2009
Notes to the consolidated financial statements continued
8. Other operating expenses (net)
For the years ended 31 December
2009$000’s
2008$000’s
Other operating expense (18,583) (9,903)
Other operating income 3,054 3,688
(15,529) (6,215)
Other operating expenses consist mainly of the increase in provisions against slow moving inventory items, abnormal spoilage and trading foreign losses. Other operating income consists mainly of gain on sale of intangible assets.
9. Finance income
For the years ended 31 December
2009$000’s
2008$000’s
Interest income 514 817
10. Finance expense
For the years ended 31 December
2009$000’s
2008$000’s
Interest on bank overdrafts and loans 7,367 13,320
Interest on obligations under finance leases 197 340
Other bank charges 5,263 3,652
Net foreign exchange loss – 233
12,827 17,545
11. Tax
For the years ended 31 December
2009$000’s
2008*$000’s
Current tax:
UK current tax 560 10,830
Double tax relief (560) (10,830)
Foreign tax 19,988 9,268
Prior year adjustments 1,035 76
Deferred tax (Note 17) (5,554) (2,429)
15,469 6,915
*The 2008 comparatives have been restated in relation to the amount of UK current tax and double tax relief. The net impact on the balance sheet and the statement of comprehensive income is nil.
UK corporation tax is calculated at 28% (2008: 28.5%) of the estimated assessable profit made in the UK for the year.
Taxation for other jurisdictions is calculated at the rates prevailing in the respective jurisdiction.

97
Governance and fi
nancial results
11. Tax continuedThe charge for the year can be reconciled to profit before tax per the statement of comprehensive income as follows:
For the years ended 31 December
2009$000’s
2008*$000’s
Profit before tax: 94,787 64,034
Tax at the UK corporation tax rate of 28% ( 2008: 28.5% ) 26,540 18,250
Profits taxed at different rates (15,776) (15,089)
UK tax on dividend income 560 10,830
Double tax relief offset (560) (10,830)
Permanent differences 3,643 2,886
Losses for which no benefit is recognised 27 792
Prior year adjustments 1,035 76
Tax expense for the year 15,469 6,915
*The 2008 comparatives have been restated in relation to the amount of UK current tax and double tax relief. The net impact on the balance sheet and the statement of comprehensive income is nil.
12. Dividends
2009$000’s
2008$000’s
Amounts recognised as distributions to equity holders in the year:
Final dividend for the year ended 31 December 2008 of 4.0 cents (2007: 4.0 cents) per share 7,575 7,542
Interim dividend for the year ended 31 December 2009 of 4.5 cents (2008: 3.5 cents) per share 8,543 6,609
16,118 14,151
The proposed final dividend for the year ended 31 December 2009 is 6.5 cents (2008: 4.0 cents) per share, bringing the total dividends for the year to 11.0 cents (2008: 7.5 cents) per share.
13. Earnings per shareThe calculation of the basic and diluted earnings per share is based on the following data:
For the years ended 31 December
2009$000’s
2008$000’s
Earnings for the purposes of basic and diluted earnings per share being net profit attributable to equity holders of the parent 77,683 57,125
Number of sharesNumber
‘000Number
‘000
Weighted average number of Ordinary Shares for the purposes of basic earnings per share 189,757 187,876
Effect of dilutive potential Ordinary Shares:
Share options 3,968 5,295
Weighted average number of Ordinary Shares for the purposes of diluted earnings per share 193,725 193,171
2009Earningsper share
cents
2008Earningsper share
cents
Basic 40.9 30.4
Diluted 40.1 29.6

98 Hikma Pharmaceuticals PLC Annual report 2009
Notes to the consolidated financial statements continued
14. Intangible assets
Goodwill$000’s
Marketingrights
$000’s
Customer relationships
$000’s
Product related
intangibles$000’s
In processR&D
$000’sTrade names
$000’s
Otheracquisition
related intangibles
$000’sSoftware
$000’sTotal
$000’s
Cost
Balance at 1 January 2008 157,192 5,412 65,369 20,005 4,609 6,393 3,289 5,201 267,470
Additions – 2,660 – 1,987 – 15 44 5,940 10,646
Reclassification – (1,114) – 990 – 124 – – –
Disposals – – – (305) (129) – – – (434)
Translation adjustments (1,997) (209) (938) (283) (10) (249) (138) (185) (4,009)
Balance at 1 January 2009 155,195 6,749 64,431 22,394 4,470 6,283 3,195 10,956 273,673
Additions – 2,153 – 1,094 – 19 10 1,937 5,213
Disposals – (194) – – (200) – – (18) (412)
Translation adjustments 871 118 373 258 6 99 9 27 1,761
Balance at 31 December 2009 156,066 8,826 64,804 23,746 4,276 6,401 3,214 12,902 280,235
Amortisation
Balance at 1 January 2008 (608) (592) (1,604) (686) – – (365) (3,774) (7,629)
Charge for the year – (704) (4,383) (1,600) (304) (19) (205) (840) (8,055)
Reclassification – (11) 253 (212) – – – (30) –
Disposals – – – 10 – – – – 10
Translation adjustments – 42 70 78 1 – 2 36 229
Balance at 1 January 2009 (608) (1,265) (5,664) (2,410) (303) (19) (568) (4,608) (15,445)
Charge for the year – (1,105) (4,294) (1,540) (297) (19) (194) (1,500) (8,949)
Translation adjustments – (32) (56) (27) (1) – (11) (18) (145)
Balance at 31 December 2009 (608) (2,402) (10,014) (3,977) (601) (38) (773) (6,126) (24,539)
Carrying amount
At 31 December 2009 155,458 6,424 54,790 19,769 3,675 6,363 2,441 6,776 255,696
At 31 December 2008 154,587 5,484 58,767 19,984 4,167 6,264 2,627 6,348 258,228

99
Governance and fi
nancial results
14. Intangible assets continuedGoodwill acquired in a business combination is allocated, at acquisition, to the cash generating units (CGUs) that are expected to benefit from that business combination. The carrying amount of goodwill had been allocated as follows:
2009$000’s
2008$000’s
Branded
Arab Pharmaceuticals Manufacturing Co. 74,399 74,399
Al Jazeera Pharmaceutical Industries Ltd 6,752 6,752
Hikma Pharma SAE (Egypt) 34,877 34,680
116,028 115,831
Injectables
German operations 37,787 37,162
Hikma Italia S.p.A 806 757
38,593 37,919
Others
Arab Medical Containers 742 742
IPRC and STD 95 95
837 837
Total 155,458 154,587
The Group tests goodwill annually for impairment or more frequently if there are indications that goodwill may be impaired.The recoverable amounts of the CGUs are determined from value in use calculations. The value in use calculations are based on the budget for the
following year, grown at 2% in perpetuity. The key assumptions for the value in use calculations are those regarding the discount rates and short-term growth forecast in budgets.
Management estimates discount rates using WACC rates that reflect the current market assessments of the time value of money and the risks specific to the CGUs. The discount rates used varied between 8.4% and 13.4%. The short-term growth rates range from 17% to 78%.
The Group has conducted a sensitivity analysis on the impairment test of each CGU’s carrying value. In each case the valuations indicate sufficient headroom such that a reasonably possible change to key assumptions is unlikely to result in an impairment of the related goodwill.
100 Hikma Pharmaceuticals PLC Annual report 2009
Notes to the consolidated financial statements continued
14. Intangible assets continued
Other intangible assetsAmortisation of all intangibles assets with finite useful lives is charged on a straight-line basis.
Marketing rights Marketing rights are amortised over their useful lives commencing on the year in which the rights first generate sales.
Product related intangibles Product related intangibles include three types:
a. Product files and under-licensed products The product files and under-licence products intangibles are assessed as having indefinite useful life due to the expected longevity of the products with an indefinite useful life. These assets are being reviewed for impairment at least annually. The carrying value of these assets is USD 5,837,000 (2008: USD 5,837,000).
b. Under-licence agreements Under-licence agreements have an average estimated useful life of 11 years (2008: 11 years).
c. Product dossiers Product dossiers have an average estimated useful life of 15 years (2008: 15 years).
Customer relationships Customer relationships represent the value attributed to the existing direct customers that the Company acquired on the acquisition of subsidiaries. The customer relationships have an average estimated useful life of 15 years (2008: 15 years).
In process R&D In process R&D represents the pipeline of products under development that were recognised on the acquisition of Arab Pharmaceutical Manufacturing Company and Alkan Pharma SAE. The In process R&D has an average estimated useful life of 15 years (2008: 15 years).
Trade name Trade names were recognised on the acquisition of Ribosepharm and Arab Pharmaceutical Manufacturing Company. The trade name recognised on the acquisition of Ribosepharm is expected to have an indefinite economic useful life due to its expected longevity. The carrying value of Ribosepharm’s trade name is USD 6,003,000 (2008: USD 5,904,000), the movement has arisen due to retranslation. The trade name recognised on the acquisition of Arab Pharmaceutical Manufacturing Company has an estimated useful life of 12 years (2008: 12 years).
Software Software intangibles mainly represent the Enterprise Resource Planning solution that is being implemented in different operations across the Group. The software has an average estimated useful life of five years.
Other acquisition related intangibles This mainly represents intangible assets recognised on the acquisition of Thymoorgan which relate to its specialist manufacturing capabilities. The estimated useful lives vary from 10 years to indefinite useful life. The carrying value of assets with indefinite lives is USD 1,075,000 (2008: USD 1,075,000), the movement has arisen due to retranslation.

101
Governance and fi
nancial results
15. Property, plant and equipment
Land and buildings
$000’s Vehicles
$000’s
Machinery and equipment
$000’s
Fixtures and equipment
$000’s
Projects under construction
$000’s Total
$000’s
Cost
Balance at 1 January 2008 131,020 9,217 166,198 30,497 20,287 357,219
Additions 4,731 1,689 9,783 6,531 33,937 56,671
Disposals (68) (671) (4,213) (2,079) (991) (8,022)
Transfers 4,854 32 2,922 113 (7,921) –
Translation adjustment (2,040) (128) (2,705) (426) (776) (6,075)
Balance at 1 January 2009 138,497 10,139 171,985 34,636 44,536 399,793
Additions 2,141 1,392 9,608 3,307 20,507 36,955
Disposals (122) (646) (2,192) (740) (611) (4,311)
Transfers 13,779 192 9,998 1,240 (25,209) –
Translation adjustment 510 (19) 778 113 427 1,809
Balance at 31 December 2009 154,805 11,058 190,177 38,556 39,650 434,246
Accumulated depreciation
Balance at 1 January 2008 19,040 3,583 73,832 14,108 – 110,563
Charge for the year 4,058 1,456 15,270 4,283 – 25,067
Disposals and transfers 485 (431) (5,448) (282) – (5,676)
Translation adjustment (438) (66) (1,061) (246) – (1,811)
Balance at 1 January 2009 23,145 4,542 82,593 17,863 – 128,143
Charge for the year 4,510 1,603 14,712 4,374 – 25,199
Disposals and transfers (55) (314) (2,393) (274) – (3,036)
Translation adjustment 140 (6) 354 81 – 569
Balance at 31 December 2009 27,740 5,825 95,266 22,044 – 150,875
Carrying amount
At 31 December 2009 127,065 5,233 94,911 16,512 39,650 283,371
Carrying amount
At 31 December 2008 115,352 5,597 89,392 16,773 44,536 271,650
The net book value of the Group’s machinery and equipment includes an amount of USD 12,743,000 (2008: USD 6,028,000) in respect of assets held under finance lease.
As at 31 December 2009 the Group had pledged property, plant and equipment having a carrying value of USD 79,557,000 (2008: USD 87,289,000) as collateral for various long-term loans. This amount includes both specific items around the Group and the net property, plant and equipment of the Group’s businesses in Portugal, Saudi Arabia and US.
In 1994, the Portuguese Government granted Hikma Farmaceutica an amount of Euro 1,600,000 to build the company’s factory in accordance with the SINPEDIP program. In 2008, the German Government provided Thymoorgan Pharmazie GmbH a grant of Euro 560,000 being a contribution towards the acquisition of two freeze dryers and additional equipment. The carrying value of the grants as of 31 December 2009 were USD 40,000 (2008: USD 153,000) for Hikma Farmaceutica and USD 454,000 (2008: 542,000) for Thymoorgan Pharmazie GmbH.
During the year 2009, the Group entered into contractual commitments for the acquisition of property, plant and equipment amounting to USD 776,000 (2008: USD 7,412,000).
The amount of borrowing costs that have been capitalised in the year within the projects under construction is USD 422,000 (2008: USD 426,000). The average capitalisation rate used ranges between 2.9%–12.1% (2008: 2.0%–3.9%).

102 Hikma Pharmaceuticals PLC Annual report 2009
Notes to the consolidated financial statements continued
16. Interest in joint ventureAPM was acquired by the Group on 27 December 2007. During 2005, APM entered in a 50% joint venture agreement with another Jordanian company to establish a new manufacturing plant in Algeria (Al Dar Al Arabia Pharmaceutical Manufacturing Company). APM’s share of the joint venture as at 31 December 2009 is USD 5,451,000 (2008: USD 5,453,000), being the amount paid at the balance sheet date to finance the construction of the plant.
17. Deferred taxThe following are the major deferred tax liabilities and assets recognised by the Group and movements thereon during the current and prior reporting year.
Tax losses$000’s
DeferredR&D costs
$000’s
Othershort-term temporary differences
$000’s
Amortisableassets
$000’sFixed assets
$000’sStock options
$000’sTotal
$000’s
At 1 January 2008 (1,683) (275) (4,273) 6,997 3,010 (6,570) (2,794)
Charge/(credit) to income 1,457 – (4,658) 407 365 – (2,429)
Charge to equity – – – – – 4,299 4,299
Adjustments 112 (33) (365) 38 571 (244) 79
Exchange differences 2 13 1 38 (89) – (35)
At 1 January 2009 (112) (295) (9,295) 7,480 3,857 (2,515) (880)
Charge/(credit) to income (616) – (6,652) (39) 2,836 (1,083) (5,554)
Credit to equity – – – – – (1,233) (1,233)
Adjustments (35) – – – – 509 474
Exchange differences (19) (5) (2) 110 50 – 134
At 31 December 2009 (782) (300) (15,949) 7,551 6,743 (4,322) (7,059)
Certain deferred tax assets and liabilities have been appropriately offset. The following is the analysis of the deferred tax balances (after offset) for financial reporting purposes:
2009$000’s
2008$000’s
Deferred tax liabilities 11,734 12,425
Deferred tax assets (18,793) (13,305)
(7,059) (880)
No deferred tax asset has been recognised on tax losses totalling USD 3,873,000 (2008: USD 6,647,000) due to the unpredictability of the related future profit streams. These losses may be carried forward for four years before expiry.
No deferred tax liability is recognised on temporary differences of USD 30 million (2008: USD 246 million) relating to the unremitted earnings of overseas subsidiaries as the Group is able to control the timing of the reversal of these temporary differences and it is probable that they will not reverse in the foreseeable future. The temporary differences at 31 December 2009 are significantly reduced from the previous year as a result of a change to UK tax legislation which largely exempts from UK tax overseas dividends received on or after 1 July 2009. The temporary differences at 31 December 2009 represent only the unremitted earnings of those overseas subsidiaries where remittance of those earnings may still result in a tax liability, principally as a result of dividend withholding taxes levied by the overseas tax jurisdictions in which these subsidiaries operate.

103
Governance and fi
nancial results
18. Available for sale investmentsAvailable for sale investments represents investments in listed equity securities and unlisted securities that are recorded at the fair value based on either quoted market price for similar listed companies or using other valuation methods for unlisted companies.
2009 2008
Listed$000’s
Non Listed*$000’s
Total$000’s
Listed$000’s
Non Listed*$000’s
Total$000’s
1 January 250 290 540 866 142 1,008
Additions – – – – 158 158
Disposals – – – (410) – (410)
Fair value adjustments recognised in equity (5) 7 2 (206) (10) (216)
31 December 245 297 542 250 290 540
* Included in this amount is an investment in a non-listed US company (MENA Innovative Technologies Inc.) of USD 62,000 (2008: USD 62,000) that represents 32.5% (2008: 32.5%) of its common share capital (see Note 38). The Group does not exert significant influence over this entity.
19. Financial and other non-current assets
As at 31 December
2009$000’s
2008$000’s
Investments recorded at cost 485 485
Amounts due from investments 726 490
Amounts due from related parties recorded at cost 491 474
Other financial assets 568 628
2,270 2,077
Investments recorded at cost represent the Group’s share of 32% (2008: 32%) in Societe D’Industries Pharmaceutiques Ibn Al Baytar S.A. – Tunisia over which the Group does not exert significant influence.
This company owns another Tunisian company (Societe Hikma Medicef Limited-Tunisia), which is therefore a related party. Amounts due from investments recorded at cost consist of amounts due from the same Tunisian investment (see Note 38).
20. Inventories
As at 31 December
2009$000’s
2008$000’s
Finished goods 41,453 45,585
Work-in-progress 28,074 23,609
Raw and packing materials 79,040 71,733
Goods in transit 11,942 13,829
160,509 154,756
Goods in transit include inventory held at third parties whilst in transit between Group companies.
As at31 December
2008$000’s
Additions$000’s
Utilisation$000’s
Translationadjustments
$000’s
As at31 December
2009$000’s
Provision for slow moving inventory 8,553 12,818 (7,359) (20) 13,992
The total expense in the income statement for the write-off of inventory including provision for such write offs was USD 12,501,000 (2008: USD 8,589,000).

104 Hikma Pharmaceuticals PLC Annual report 2009
Notes to the consolidated financial statements continued
21. Trade and other receivables
As at 31 December
2009$000’s
2008$000’s
Trade receivables 203,250 173,958
Prepayments 16,063 14,345
Value added tax recoverable 5,569 5,306
Interest receivable 49 108
Employee advances 1,910 2,126
226,841 195,843
Trade receivables are stated net of provisions for chargebacks, doubtful debts and expired goods as follows:
As at31 December
2008$000’s
Additions$000’s
Utilisation$000’s
Translationadjustments
$000’s
As at31 December
2009$000’s
Chargebacks and returns 24,903 208,263 (195,104) 40 38,102
Doubtful debts 15,151 4,699 (83) (9) 19,758
Expired goods 6,629 3,598 (3,554) 17 6,690
46,683 216,560 (198,741) 48 64,550
The following table sets forth a summary of the age of trade receivables:
Past due
Not pastdue on the
reporting date$000’s
less than90 days
$000’s
between 91 and
180 days$000’s
between 181 and
360 days$000’s
Overone year
$000’sImpaired
$000’sTotal
$000’s
At 31 December 2009
Total trade receivables as of 31 December 2009 212,063 23,437 6,181 3,223 3,138 19,758 267,800
Related allowance for doubtful debts – – – – – (19,758) (19,758)
212,063 23,437 6,181 3,223 3,138 – 248,042
Chargebacks and returns provision (38,102)
Expired goods provision (6,690)
Net receivables 203,250
Past due
Not pastdue on the
reporting date$000’s
less than90 days$000’s
between 91 and
180 days$000’s
between 181 and 360 days
$000’s
Overone year
$000’sImpaired
$000’sTotal
$000’s
At 31 December 2008
Total trade receivables as of 31 December 2008 155,818 31,272 11,396 5,744 1,260 15,151 220,641
Related allowance for doubtful debts – – – – – (15,151) (15,151)
155,818 31,272 11,396 5,744 1,260 – 205,490
Chargebacks and returns provision (24,903)
Expired goods provision (6,629)
Net receivables 173,958
The Group establishes an allowance for impairment that represents its estimate of losses in respect of specific trade and other receivables where it is deemed that a receivable may not be recoverable. When the receivable is deemed irrecoverable, the allowance account is written off against the underlying receivable.
More details on the Group’s policy for credit and concentration of risk management are provided in Note 29.
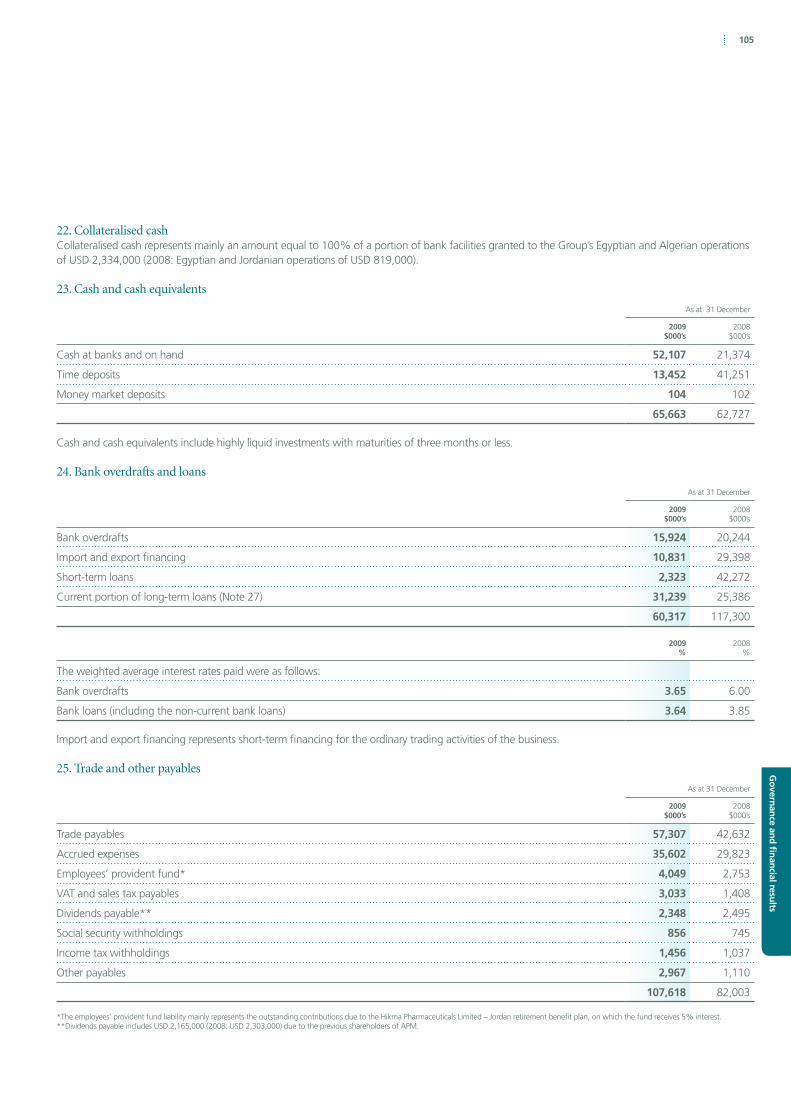
105
Governance and fi
nancial results
22. Collateralised cashCollateralised cash represents mainly an amount equal to 100% of a portion of bank facilities granted to the Group’s Egyptian and Algerian operations of USD 2,334,000 (2008: Egyptian and Jordanian operations of USD 819,000).
23. Cash and cash equivalents
As at 31 December
2009$000’s
2008$000’s
Cash at banks and on hand 52,107 21,374
Time deposits 13,452 41,251
Money market deposits 104 102
65,663 62,727
Cash and cash equivalents include highly liquid investments with maturities of three months or less.
24. Bank overdrafts and loans
As at 31 December
2009$000’s
2008$000’s
Bank overdrafts 15,924 20,244
Import and export financing 10,831 29,398
Short-term loans 2,323 42,272
Current portion of long-term loans (Note 27) 31,239 25,386
60,317 117,300
2009%
2008%
The weighted average interest rates paid were as follows:
Bank overdrafts 3.65 6.00
Bank loans (including the non-current bank loans) 3.64 3.85
Import and export financing represents short-term financing for the ordinary trading activities of the business.
25. Trade and other payables
As at 31 December
2009$000’s
2008$000’s
Trade payables 57,307 42,632
Accrued expenses 35,602 29,823
Employees’ provident fund* 4,049 2,753
VAT and sales tax payables 3,033 1,408
Dividends payable** 2,348 2,495
Social security withholdings 856 745
Income tax withholdings 1,456 1,037
Other payables 2,967 1,110
107,618 82,003
*The employees’ provident fund liability mainly represents the outstanding contributions due to the Hikma Pharmaceuticals Limited – Jordan retirement benefit plan, on which the fund receives 5% interest.**Dividends payable includes USD 2,165,000 (2008: USD 2,303,000) due to the previous shareholders of APM.

106 Hikma Pharmaceuticals PLC Annual report 2009
Notes to the consolidated financial statements continued
26. Other provisionsOther provisions represent the end of service indemnity provisions of Hikma Pharmaceuticals Limited – Jordan, Hikma Italia, JPI, AMC, APM, Hikma Pharma Co. (Tunisia) and Pharma Ixir Co. Ltd (Sudan). This end of service indemnity comprises one month’s salary payable for each year employed for each employee in all the above companies except Hikma Italia.
The provision for end of service indemnity for Hikma Italia is calculated (as required by Italian law) by dividing the employees’ remuneration for the year by 13.5 and it is subject to revaluation on an annual basis.
Movements on the provision for end of service indemnity:
2009$000’s
2008$000’s
1 January 5,392 4,475
Additions 2,365 1,592
Utilisation (1,611) (625)
Translation adjustments 7 (50)
31 December 6,153 5,392
27. Long-term financial debts
As at 31 December
2009$000’s
2008$000’s
Total loans 147,358 135,800
Less: current portion of loans (Note 24) (31,239) (25,386)
Long-term financial loans 116,119 110,414
Breakdown by maturity:
Within one year 31,239 25,386
In the second year 49,476 41,023
In third year 30,587 22,705
In the fourth year 24,701 20,896
In the fifth year 4,623 15,261
Thereafter 6,732 10,529
147,358 135,800
Breakdown by currency:
USD 99,739 81,287
Euro 30,240 32,345
Jordanian Dinar 103 2,666
Algerian Dinar 11,699 11,960
Saudi Riyal 3,125 6,242
Egyptian Pound 2,452 1,300
147,358 135,800
The loans are shown on an undiscounted basis.At 31 December 2009, import and export financing, short-term loans and the current and long-term portion of long-term loans total
USD 160,512,000 (2008: USD 207,470,000).Loans amounting to USD 45,707,000 (2008: USD 42,872,000) are secured on property, plant and equipment.

107
Governance and fi
nancial results
28. Obligations under finance leases
Minimum leasepayments
Present value of minimumlease payments
2009$000’s
2008$000’s
2009$000’s
2008$000’s
Amounts payable under finance leases:
Within one year 2,274 1,512 1,826 1,221
In the second to fifth years inclusive 7,473 6,173 6,675 5,496
9,747 7,685 8,501 6,717
Less: Interest lease charges (1,246) (968)
Present value of minimum lease payments payable 8,501 6,717
It is the Group’s policy to lease certain of its fixtures and equipment under finance leases. The average lease term is four years (2008: five years). For the year ended 31 December 2009, the average effective borrowings rate was between 1.8% and 7.0% (2008: between 3.9% and 7.0%).
29. Financial policies for risk management and their objectives
Credit and concentration of riskThe Group’s principal financial assets are cash and cash equivalents, trade and other receivables, and investments.
The Group’s credit risk is primarily attributable to its trade receivables. The amounts presented in the balance sheet are net of allowances for doubtful debts, chargebacks in the US, expired goods and without recourse discounts. A provision for impairment is made where there is an identified loss event which, based on previous experience, is evidence of a reduction in the recoverability of the cash flows.
The credit risk on liquid funds and derivative financial instruments is limited because the counterparties are banks with high credit-ratings assigned by international credit-rating agencies.
In line with local market practice, clients in the MENA region are offered relatively longer payment terms compared to clients in Europe and the US. During the year ended 31 December 2009, the Group’s largest three clients in the MENA region represented 21% of Group Turnover, 15% in Saudi Arabia and two customers in Algeria making up 4% and 2% each. The amount of receivables due from customers based in the Algerian market at 31 December 2009 is USD 32,016,596 (2008: USD 32,784,000) and Saudi Arabia is USD 53,373,000 (2008: USD 44,366,000). The Group manages this risk through the implementation of stringent credit policies and procedures and certain credit insurance agreements.
Trade receivable exposures are managed locally in the operating units where they arise. Credit limits are set as deemed appropriate for the customer, based on a number of qualitative and quantitative factors related to the creditworthiness of a particular customer. The Group is exposed to a variety of customers ranging from government backed agencies and large private wholesalers to privately owned pharmacies, and the underlying local economic risks vary across the Group. Typical credit terms in the US range from 30–60 days, in Europe 60–120 days, and MENA 180–360 days. Where appropriate, the Group endeavours to minimise risks by the use of trade finance instruments such as letters of credit and insurance.
Market riskThe Group’s objective is to reduce, where it is deemed appropriate to do so, fluctuations in earnings and cash flow associated with changes in interest rates and foreign currency rates. The Group is exposed to foreign exchange and interest rate risk. Management actively monitors these exposures to manage the volatility relating to these exposures by entering into a variety of derivative financial instruments.
Foreign exchange riskThe Group uses the USD as its functional currency and is therefore exposed to foreign exchange movements primarily in the Euro and Algerian Dinar. Consequently, where possible the Group enters into various contracts, which change in value as foreign exchange rates change to hedge against the risk of movement in foreign denominated assets and liabilities.
Interest rate riskThe Group manages its exposures to interest rate risks by changing the proportion of debt that is fixed by entering into interest rate swap agreements. Using these derivative financial instruments has not had a material impact on the Group’s financial position at 31 December 2009 or the Group’s results of operations for the year then ended.

108 Hikma Pharmaceuticals PLC Annual report 2009
Notes to the consolidated financial statements continued
29. Financial policies for risk management and their objectives continued
As at 31 December 2009 As at 31 December 2008
Fixed rate$000’s
Floating rate$000’s
Total$000’s
Fixed rate$000’s
Floating rate$000’s
Total$000’s
Financial liabilities
Interest bearing loans and borrowings 40,444 144,493 184,937 31,670 202,761 234,431
Financial assets
Cash and cash equivalents – 65,663 65,663 – 62,727 62,727
An interest rate sensitivity analysis assumes an instantaneous 100 basis point change in interest rates in all currencies from their levels at 31 December 2009, with all other variables held constant. Based on the composition of our debt portfolio as at 31 December 2009, a 1% increase/decrease in interest rates would result in an additional USD 1.4 million (2008: USD 2.0 million) in interest expense/income being incurred per year.
Fair value of financial assets and liabilitiesThe fair value of financial assets and liabilities are included at the amount at which the instrument could be exchanged in a current transaction between willing parties, other than in a forced or liquidation sale. The following methods and assumptions were used to estimate the fair value:
Cash and cash equivalents – approximates to the carrying amount;
Short-term loans and overdrafts – approximates to the carrying amount because of the short maturity of these instruments;
Long-term loans – approximates to the carrying amount in the case of floating rate bank loans and other loans;
Forward exchange contracts – based on market prices and exchange rates at the balance sheet date;
Receivables and payables – approximates to the carrying amount; and
Lease obligations – approximates to the carrying value.
Management considers that the book value of the Group’s financial assets and liabilities does not materially differ from their fair value.
Currency riskCurrency risks as defined by IFRS 7 arise on account of financial instruments being denominated in a currency that is other than the functional currency of the booking entity and being of a monetary nature.
The currencies that have a significant impact on the Group accounts and the exchange rates used are as follows:
Period end rates Average rates
2009 2008 2009 2008
USD/EUR 0.6977 0.7094 0.7170 0.6797
USD/Sudanese Pound 2.2398 2.1840 2.3173 2.0924
USD/Algerian Dinar 72.7309 71.1999 72.6817 64.4330
USD/Saudi Riyal 3.7495 3.7495 3.7495 3.7495
USD/British Pound 0.6278 0.6907 0.6386 0.5390
USD/Jordanian Dinar 0.7090 0.7090 0.7090 0.7090
USD/Egyptian Pound 5.5051 5.5375 5.5776 5.4557
The Jordanian Dinar and Saudi Riyal have no impact on the statement of comprehensive income as those currencies are pegged against the US Dollar.

109
Governance and fi
nancial results
29. Financial policies for risk management and their objectives continued
Net foreign currency financial assets/(liabilities)
2009US Dollar
$000’sEuro
$000’sSterling
$000’sAlgerian Dinar
$000’sJapanese Yen
$000’sOthers$000’s
Functional currency of entity:
– Jordanian Dinar 43,147 (5,612) 100 – (551) 1,756
– Euro (1,816) – – – – –
– Algerian Dinar (36,699) (929) (2) – – –
– Saudi Riyal 2,092 1,107 (11) 380 (1,783) –
– Sudanese Pound (10,527) – – – – –
– Egyptian Pound (1,972) 840 1 – – (7)
(5,775) (4,594) 88 380 (2,334) 1,749
Sensitivity analysis:
Impact on statement of comprehensive income assuming 1% appreciation of foreign currency against functional currency as at year end
2009US Dollar
$000’sEuro
$000’sSterling
$000’sAlgerian Dinar
$000’sJapanese Yen
$000’sOthers$000’s
Functional currency of entity:
– Jordanian Dinar 431 (56) 1 – (6) 18
– Euro (18) – – – – –
– Algerian Dinar (367) (9) – – – –
– Saudi Riyal 21 11 – 4 (18) –
– Sudanese Pound (105) – – – – –
– Egyptian Pound (20) 8 – – – –
(58) (46) 1 4 (24) 18
Net foreign currency financial assets/(liabilities)
2008US Dollar
$000’sEuro
$000’sSterling$000’s
Algerian Dinar$000’s
Japanese Yen$000’s
Others$000’s
Functional currency of entity:
– Jordanian Dinar 33,112 (7,068) 509 – (701) (24)
– Euro (1,143) – – – – –
– Algerian Dinar (31,718) (43) (2) – – –
– Saudi Riyal (2,085) 813 (15) 543 (70) –
– Sudanese Pound (13,697) – – – – –
– Egyptian Pound 374 435 – – – (29)
(15,157) (5,863) 492 543 (771) (53)

110 Hikma Pharmaceuticals PLC Annual report 2009
Notes to the consolidated financial statements continued
29. Financial policies for risk management and their objectives continuedSensitivity analysis:
Impact on statement of comprehensive income assuming 1% appreciation of foreign currency against functional currency as at year end
2008US Dollar
$000’sEuro
$000’sSterling$000’s
Algerian Dinar$000’s
Japanese Yen$000’s
Others$000’s
Functional currency of entity:
– Jordanian Dinar 331 (71) 5 – (7) –
– Euro (11) – – – – –
– Algerian Dinar (317) – – – – –
– Saudi Riyal (21) 8 – 5 (1) –
– Sudanese Pound (137) – – – – –
– Egyptian Pound 4 4 – – – –
(151) (59) 5 5 (8) –
Liquidity risk of assets (liabilities)
2009
Less thanone year
$000’s
More thanone year
$000’sTotal
$000’s
Cash and cash equivalents 65,663 – 65,663
Trade receivables 203,250 – 203,250
Interest bearing loans and borrowings (44,393) (116,119) (160,512)
Interest bearing overdrafts (15,924) – (15,924)
Interest bearing finance lease (2,274) (7,473) (9,747)
Trade payables (57,307) – (57,307)
149,015 (123,592) 25,423
2008
Less thanone year
$000’s
More thanone year
$000’sTotal
$000’s
Cash and cash equivalents 62,727 – 62,727
Trade receivables 173,958 – 173,958
Interest bearing loans and borrowings (97,056) (110,414) (207,470)
Interest bearing overdrafts (20,244) – (20,244)
Interest bearing finance lease (1,512) (6,173) (7,685)
Trade payables (42,632) – (42,632)
75,241 (116,587) (41,346)
At 31 December 2009 the Group had undrawn facilities of USD 193,152,058 (2008: USD 120,800,000). USD 95,451,783 (2008: USD 33,000,000) of these was committed and the remainder was uncommitted.
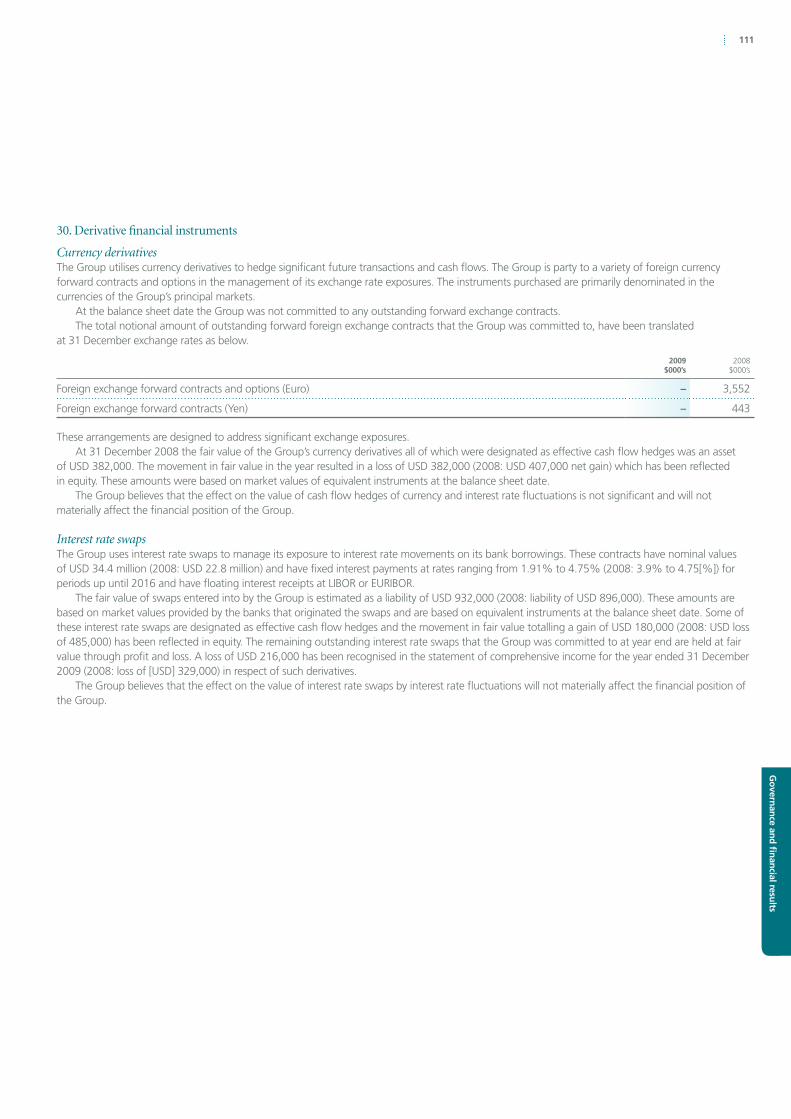
111
Governance and fi
nancial results
30. Derivative financial instruments
Currency derivativesThe Group utilises currency derivatives to hedge significant future transactions and cash flows. The Group is party to a variety of foreign currency forward contracts and options in the management of its exchange rate exposures. The instruments purchased are primarily denominated in the currencies of the Group’s principal markets.
At the balance sheet date the Group was not committed to any outstanding forward exchange contracts.The total notional amount of outstanding forward foreign exchange contracts that the Group was committed to, have been translated
at 31 December exchange rates as below.
2009 $000’s
2008 $000’s
Foreign exchange forward contracts and options (Euro) – 3,552
Foreign exchange forward contracts (Yen) – 443
These arrangements are designed to address significant exchange exposures.At 31 December 2008 the fair value of the Group’s currency derivatives all of which were designated as effective cash flow hedges was an asset
of USD 382,000. The movement in fair value in the year resulted in a loss of USD 382,000 (2008: USD 407,000 net gain) which has been reflected in equity. These amounts were based on market values of equivalent instruments at the balance sheet date.
The Group believes that the effect on the value of cash flow hedges of currency and interest rate fluctuations is not significant and will not materially affect the financial position of the Group.
Interest rate swapsThe Group uses interest rate swaps to manage its exposure to interest rate movements on its bank borrowings. These contracts have nominal values of USD 34.4 million (2008: USD 22.8 million) and have fixed interest payments at rates ranging from 1.91% to 4.75% (2008: 3.9% to 4.75[%]) for periods up until 2016 and have floating interest receipts at LIBOR or EURIBOR.
The fair value of swaps entered into by the Group is estimated as a liability of USD 932,000 (2008: liability of USD 896,000). These amounts are based on market values provided by the banks that originated the swaps and are based on equivalent instruments at the balance sheet date. Some of these interest rate swaps are designated as effective cash flow hedges and the movement in fair value totalling a gain of USD 180,000 (2008: USD loss of 485,000) has been reflected in equity. The remaining outstanding interest rate swaps that the Group was committed to at year end are held at fair value through profit and loss. A loss of USD 216,000 has been recognised in the statement of comprehensive income for the year ended 31 December 2009 (2008: loss of [USD] 329,000) in respect of such derivatives.
The Group believes that the effect on the value of interest rate swaps by interest rate fluctuations will not materially affect the financial position of the Group.

112 Hikma Pharmaceuticals PLC Annual report 2009
Notes to the consolidated financial statements continued
31. Share capital
2009$000’s
2008$000’s
Authorised:
500,000,000 Ordinary Shares of 10p each 88,700 88,700
2009 2008
Number ‘000 $000’s Number ‘000 $000’s
Issued and fully paid – included in shareholders’ equity: At 1 January 189,238 33,857 170,734 30,229
Issued during the year 2,390 379 18,504 3,628
At 31 December 191,628 34,236 189,238 33,857
On 17 January 2008, a total of 17,000,000 new Ordinary Shares of 10 pence each in the Group were placed at a price of 480 pence per share, raising gross proceeds of approximately GBP 81.6 million (USD 160.3 million). As part of the Placing 5.23 million shares were placed with Darhold Limited at the Placing Price and 333,000 shares were placed with the Darwazah family and other connected individuals at the Placing Price. The total number of shares issued represents 9.96% of Hikma’s issued ordinary share capital prior to the placing.
In 2008 the Group used the proceeds from the placing to reduce borrowings incurred in connection with its JOD 116.0 million (USD 163.8 million) acquisition of Arab Pharmaceutical Manufacturing Company thereby providing the Group with increased flexibility to finance future growth.
The cost of the 2008 placing which amounted to USD 2,484,000 was offset against share premium.
32. Non-controlling interest
2009$000’s
2008$000’s
At 1 January 5,786 6,177
Non-controlling interest share of profit/(loss) 1,635 (6)
Other movements including dividends paid – (385)
Currency translation loss (49) –
At 31 December 7,372 5,786

113
Governance and fi
nancial results
33. Own sharesOwn shares represent 450,000 (2008: 250,000) Ordinary Shares in the Company held by Lloyds TSB Offshore Trust, an independent trustee, having a market value at 31 December 2009 of GBP 2,295,000 (2008: 875,000). The consideration paid to acquire those shares was USD 2,203,000 (2008: USD 1,124,000).The trust holds these shares to meet long-term commitments in relation to employee share plans.
34. Net cash from operating activities
2009$000’s
2008$000’s
Profit before tax 94,787 64,034
Adjustments for:
Depreciation and amortisation of:
Property, plant and equipment 25,199 25,067
Intangible assets 8,949 8,055
Losses/(gains) on disposal of property, plant and equipment 236 (6)
Gains on disposal of intangible assets (903) (832)
Movement on provisions 761 917
Movement on deferred income (201) 416
Cost of equity settled employee share scheme 4,616 3,384
Finance income (514) (817)
Interest and bank charges 12,827 17,545
Cash flow before working capital 145,757 117,763
Change in trade and other receivables (29,949) (10,903)
Change in other current assets (190) 1,564
Change in inventories (8,278) (19,327)
Change in trade and other payables 24,262 (693)
Change in other current liabilities 3,164 (5,751)
Cash generated by operations 134,766 82,653
Income tax paid (15,787) (7,684)
Net cash generated from operating activities 118,979 74,969
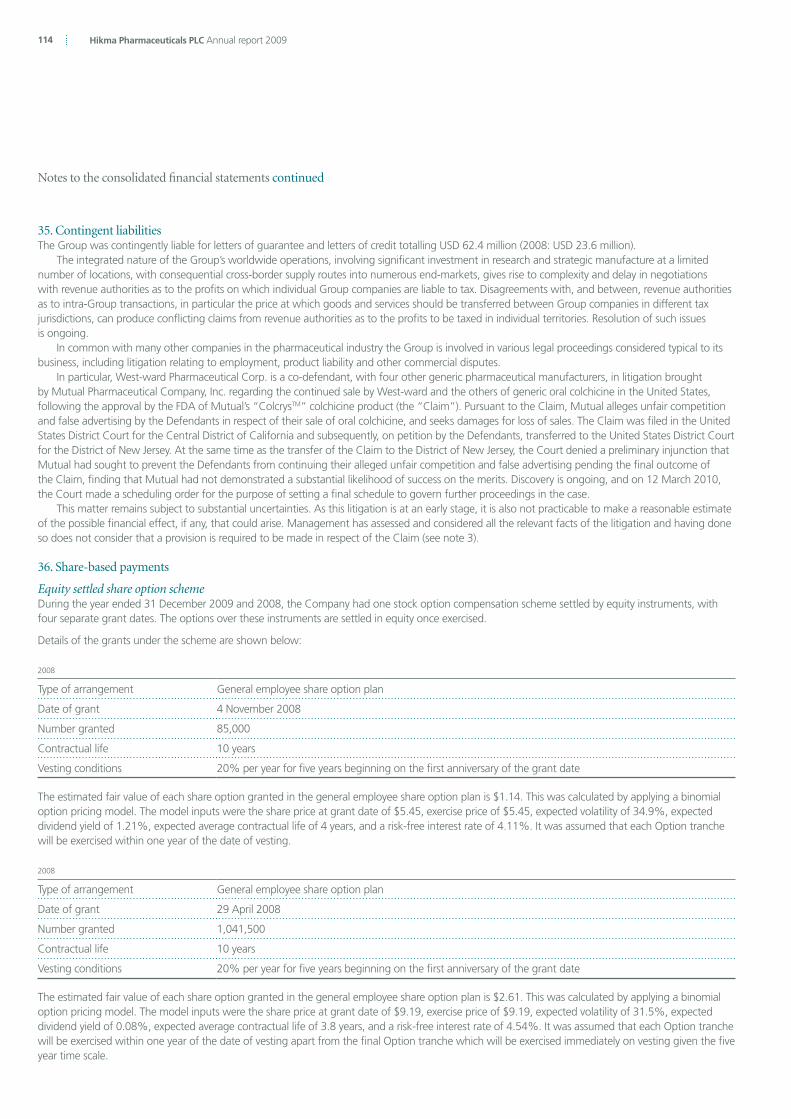
114 Hikma Pharmaceuticals PLC Annual report 2009
Notes to the consolidated financial statements continued
35. Contingent liabilitiesThe Group was contingently liable for letters of guarantee and letters of credit totalling USD 62.4 million (2008: USD 23.6 million).
The integrated nature of the Group’s worldwide operations, involving significant investment in research and strategic manufacture at a limited number of locations, with consequential cross-border supply routes into numerous end-markets, gives rise to complexity and delay in negotiations with revenue authorities as to the profits on which individual Group companies are liable to tax. Disagreements with, and between, revenue authorities as to intra-Group transactions, in particular the price at which goods and services should be transferred between Group companies in different tax jurisdictions, can produce conflicting claims from revenue authorities as to the profits to be taxed in individual territories. Resolution of such issues is ongoing.
In common with many other companies in the pharmaceutical industry the Group is involved in various legal proceedings considered typical to its business, including litigation relating to employment, product liability and other commercial disputes.
In particular, West-ward Pharmaceutical Corp. is a co-defendant, with four other generic pharmaceutical manufacturers, in litigation brought by Mutual Pharmaceutical Company, Inc. regarding the continued sale by West-ward and the others of generic oral colchicine in the United States, following the approval by the FDA of Mutual’s “ColcrysTM” colchicine product (the “Claim”). Pursuant to the Claim, Mutual alleges unfair competition and false advertising by the Defendants in respect of their sale of oral colchicine, and seeks damages for loss of sales. The Claim was filed in the United States District Court for the Central District of California and subsequently, on petition by the Defendants, transferred to the United States District Court for the District of New Jersey. At the same time as the transfer of the Claim to the District of New Jersey, the Court denied a preliminary injunction that Mutual had sought to prevent the Defendants from continuing their alleged unfair competition and false advertising pending the final outcome of the Claim, finding that Mutual had not demonstrated a substantial likelihood of success on the merits. Discovery is ongoing, and on 12 March 2010, the Court made a scheduling order for the purpose of setting a final schedule to govern further proceedings in the case.
This matter remains subject to substantial uncertainties. As this litigation is at an early stage, it is also not practicable to make a reasonable estimate of the possible financial effect, if any, that could arise. Management has assessed and considered all the relevant facts of the litigation and having done so does not consider that a provision is required to be made in respect of the Claim (see note 3).
36. Share-based payments
Equity settled share option schemeDuring the year ended 31 December 2009 and 2008, the Company had one stock option compensation scheme settled by equity instruments, with four separate grant dates. The options over these instruments are settled in equity once exercised.
Details of the grants under the scheme are shown below:
2008
Type of arrangement General employee share option plan
Date of grant 4 November 2008
Number granted 85,000
Contractual life 10 years
Vesting conditions 20% per year for five years beginning on the first anniversary of the grant date
The estimated fair value of each share option granted in the general employee share option plan is $1.14. This was calculated by applying a binomial option pricing model. The model inputs were the share price at grant date of $5.45, exercise price of $5.45, expected volatility of 34.9%, expected dividend yield of 1.21%, expected average contractual life of 4 years, and a risk-free interest rate of 4.11%. It was assumed that each Option tranche will be exercised within one year of the date of vesting.
2008
Type of arrangement General employee share option plan
Date of grant 29 April 2008
Number granted 1,041,500
Contractual life 10 years
Vesting conditions 20% per year for five years beginning on the first anniversary of the grant date
The estimated fair value of each share option granted in the general employee share option plan is $2.61. This was calculated by applying a binomial option pricing model. The model inputs were the share price at grant date of $9.19, exercise price of $9.19, expected volatility of 31.5%, expected dividend yield of 0.08%, expected average contractual life of 3.8 years, and a risk-free interest rate of 4.54%. It was assumed that each Option tranche will be exercised within one year of the date of vesting apart from the final Option tranche which will be exercised immediately on vesting given the five year time scale.
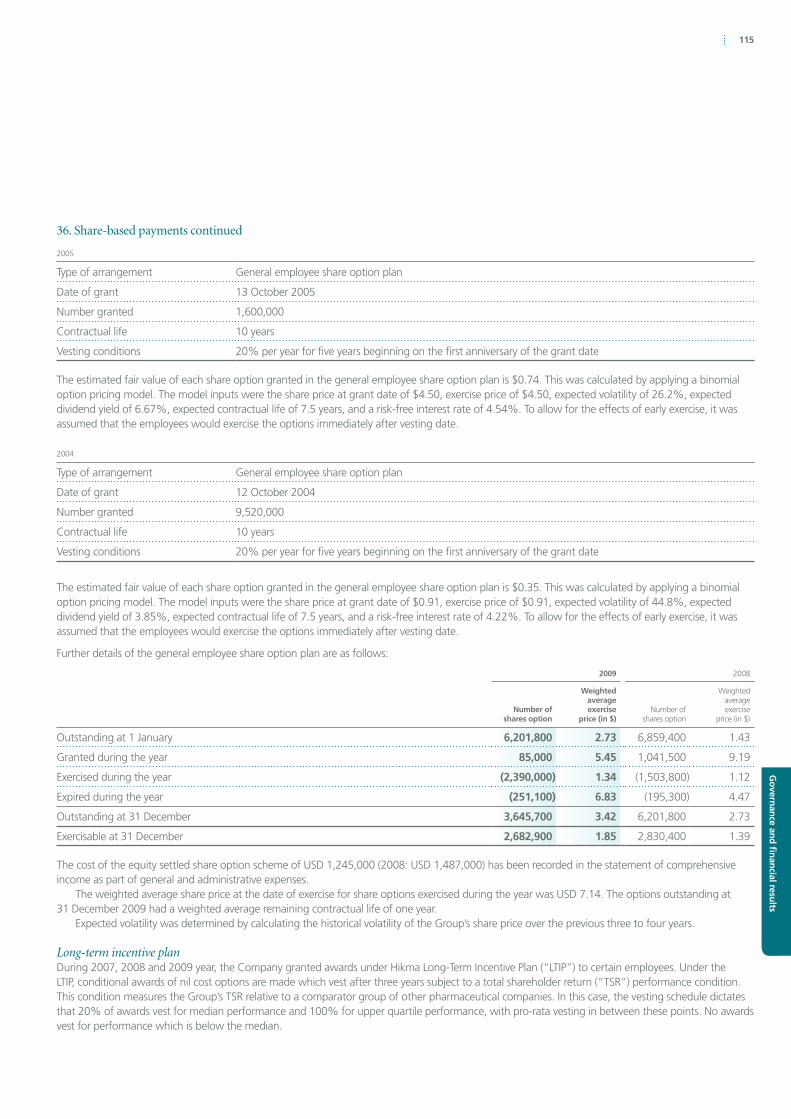
115
Governance and fi
nancial results
36. Share-based payments continued
2005
Type of arrangement General employee share option plan
Date of grant 13 October 2005
Number granted 1,600,000
Contractual life 10 years
Vesting conditions 20% per year for five years beginning on the first anniversary of the grant date
The estimated fair value of each share option granted in the general employee share option plan is $0.74. This was calculated by applying a binomial option pricing model. The model inputs were the share price at grant date of $4.50, exercise price of $4.50, expected volatility of 26.2%, expected dividend yield of 6.67%, expected contractual life of 7.5 years, and a risk-free interest rate of 4.54%. To allow for the effects of early exercise, it was assumed that the employees would exercise the options immediately after vesting date.
2004
Type of arrangement General employee share option plan
Date of grant 12 October 2004
Number granted 9,520,000
Contractual life 10 years
Vesting conditions 20% per year for five years beginning on the first anniversary of the grant date
The estimated fair value of each share option granted in the general employee share option plan is $0.35. This was calculated by applying a binomial option pricing model. The model inputs were the share price at grant date of $0.91, exercise price of $0.91, expected volatility of 44.8%, expected dividend yield of 3.85%, expected contractual life of 7.5 years, and a risk-free interest rate of 4.22%. To allow for the effects of early exercise, it was assumed that the employees would exercise the options immediately after vesting date.
Further details of the general employee share option plan are as follows:
2009 2008
Number of shares option
Weighted average exercise
price (in $)Number of
shares option
Weighted average exercise
price (in $)
Outstanding at 1 January 6,201,800 2.73 6,859,400 1.43
Granted during the year 85,000 5.45 1,041,500 9.19
Exercised during the year (2,390,000) 1.34 (1,503,800) 1.12
Expired during the year (251,100) 6.83 (195,300) 4.47
Outstanding at 31 December 3,645,700 3.42 6,201,800 2.73
Exercisable at 31 December 2,682,900 1.85 2,830,400 1.39
The cost of the equity settled share option scheme of USD 1,245,000 (2008: USD 1,487,000) has been recorded in the statement of comprehensive income as part of general and administrative expenses.
The weighted average share price at the date of exercise for share options exercised during the year was USD 7.14. The options outstanding at 31 December 2009 had a weighted average remaining contractual life of one year.
Expected volatility was determined by calculating the historical volatility of the Group’s share price over the previous three to four years.
Long-term incentive planDuring 2007, 2008 and 2009 year, the Company granted awards under Hikma Long-Term Incentive Plan (“LTIP”) to certain employees. Under the LTIP, conditional awards of nil cost options are made which vest after three years subject to a total shareholder return (“TSR”) performance condition. This condition measures the Group’s TSR relative to a comparator group of other pharmaceutical companies. In this case, the vesting schedule dictates that 20% of awards vest for median performance and 100% for upper quartile performance, with pro-rata vesting in between these points. No awards vest for performance which is below the median.

116 Hikma Pharmaceuticals PLC Annual report 2009
Notes to the consolidated financial statements continued
36. Share-based payments continued Details of the grants under the plan are shown below:
19 May 2009
Type of arrangement Long-Term Incentive Plan
Date of grant 19 May 2009
Number granted 200,000
Contractual life 10 years
Vesting conditions After three years subject to a TSR performance condition
The estimated fair value of each share option granted in the LTIP is $3.89. This was calculated by applying the Monte Carlo Simulation methodology for estimation of the fair value. The model inputs were as follows:(a) the exercise price of the share award of nil;(b) the life of the share award of three years;(c) the current price of the underlying shares on the date of grant of $6.67;(d) the volatility of the Company’s share returns of 38.98%;(e) expected dividend yield of 1.22%; and(f) the risk-free interest rate for the life of the share award of 1.92%.
19 March 2009
Type of arrangement Long-Term Incentive Plan
Date of grant 19 March 2009
Number granted 920,000
Contractual life 10 years
Vesting conditions After three years subject to a TSR performance condition
The estimated fair value of each share option granted in the LTIP is $2.94. This was calculated by applying the Monte Carlo Simulation methodology for estimation of the fair value. The model inputs were as follows:(a) the exercise price of the share award of nil;(b) the life of the share award of three years;(c) the current price of the underlying shares on the date of grant of $5.11;(d) the volatility of the Company’s share returns of 38.98%;(e) expected dividend yield of 1.47%; and(f) the risk-free interest rate for the life of the share award of 1.88%.
29 April 2008
Type of arrangement Long-Term Incentive Plan
Date of grant 29 April 2008
Number granted 700,000
Contractual life 10 years
Vesting conditions After three years subject to a TSR performance condition
The estimated fair value of each share option granted in the LTIP is $5.46. This was calculated by applying the Monte Carlo Simulation methodology for estimation of the fair value. The model inputs were as follows:(a) the exercise price of the share award of nil;(b) the life of the share award of three years;(c) the current price of the underlying shares on the date of grant of $9.22;(d) the volatility of the Company’s share returns of 31.47%;(e) expected dividend yield of 0.08%; and(f) the risk-free interest rate for the life of the share award of 4.5%.

117
Governance and fi
nancial results
36. Share-based payments continued
10 September 2007
Type of arrangement Long-Term Incentive Plan
Date of grant 10 September 2007
Number granted 150,000
Contractual life 10 years
Vesting conditions After three years subject to a TSR performance condition
The estimated fair value of each share option granted in the LTIP is $4.70. This was calculated by applying the Monte Carlo Simulation methodology for estimation of the fair value. The model inputs were as follows:(a) the exercise price of the share award of nil;(b) the life of the share award of three years;(c) the current price of the underlying shares on the date of grant of $8.28;(d) the volatility of the Company’s share returns of 34.64%;(e) expected dividend yield of 0.075%; and(f) the risk-free interest rate for the life of the share award of 4.998%.
23 April 2007
Type of arrangement Long-Term Incentive Plan
Date of grant 23 April 2007
Number granted 466,000
Contractual life 10 years
Vesting conditions After three years subject to a TSR performance condition
The estimated fair value of each share option granted in the LTIP is $4.47. This was calculated by applying the Monte Carlo Simulation methodology for estimation of the fair value. The model inputs were as follows:(a) the exercise price of the share award of nil;(b) the life of the share award of three years;(c) the current price of the underlying shares on the date of grant of $7.69;(d) the volatility of the Company’s share returns of 34.64%;(e) expected dividend yield of 0.075%; and(f) the risk-free interest rate for the life of the share award of 5.45%.
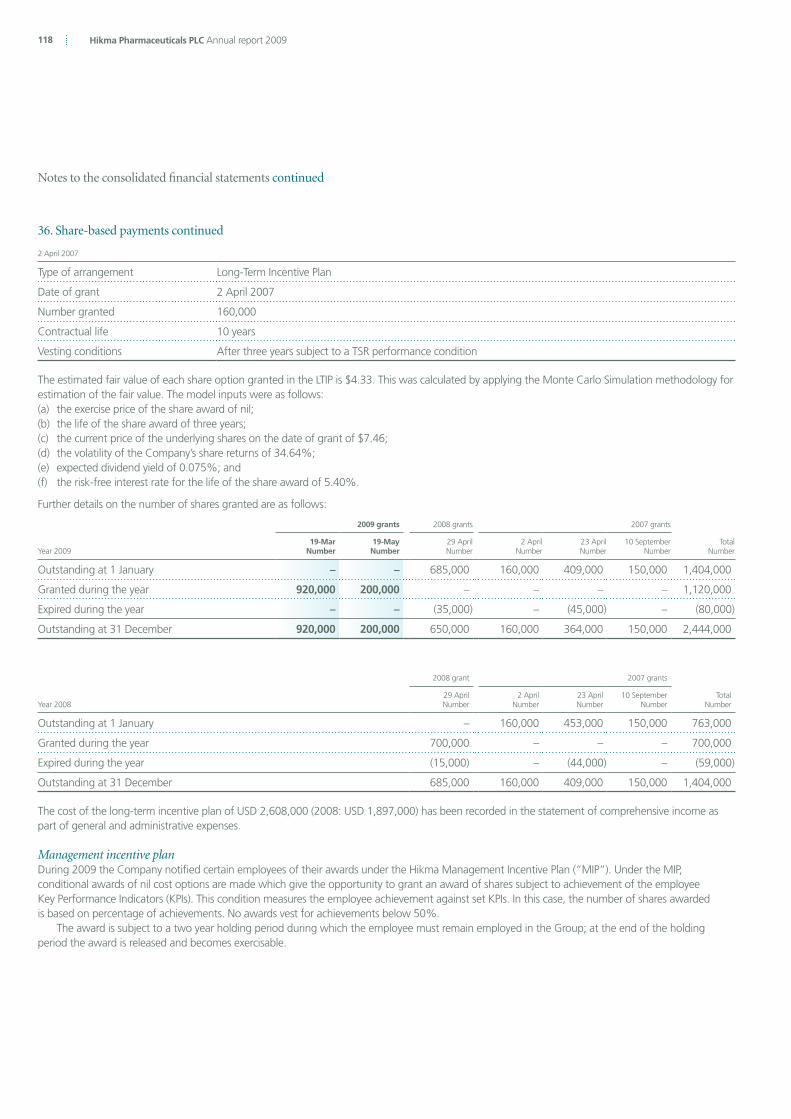
118 Hikma Pharmaceuticals PLC Annual report 2009
Notes to the consolidated financial statements continued
36. Share-based payments continued
2 April 2007
Type of arrangement Long-Term Incentive Plan
Date of grant 2 April 2007
Number granted 160,000
Contractual life 10 years
Vesting conditions After three years subject to a TSR performance condition
The estimated fair value of each share option granted in the LTIP is $4.33. This was calculated by applying the Monte Carlo Simulation methodology for estimation of the fair value. The model inputs were as follows:(a) the exercise price of the share award of nil;(b) the life of the share award of three years;(c) the current price of the underlying shares on the date of grant of $7.46;(d) the volatility of the Company’s share returns of 34.64%;(e) expected dividend yield of 0.075%; and(f) the risk-free interest rate for the life of the share award of 5.40%.
Further details on the number of shares granted are as follows:
Year 2009
2009 grants 2008 grants 2007 grants
19-MarNumber
19-MayNumber
29 AprilNumber
2 AprilNumber
23 AprilNumber
10 SeptemberNumber
TotalNumber
Outstanding at 1 January – – 685,000 160,000 409,000 150,000 1,404,000
Granted during the year 920,000 200,000 – – – – 1,120,000
Expired during the year – – (35,000) – (45,000) – (80,000)
Outstanding at 31 December 920,000 200,000 650,000 160,000 364,000 150,000 2,444,000
Year 2008
2008 grant 2007 grants
29 AprilNumber
2 AprilNumber
23 AprilNumber
10 SeptemberNumber
TotalNumber
Outstanding at 1 January – 160,000 453,000 150,000 763,000
Granted during the year 700,000 – – – 700,000
Expired during the year (15,000) – (44,000) – (59,000)
Outstanding at 31 December 685,000 160,000 409,000 150,000 1,404,000
The cost of the long-term incentive plan of USD 2,608,000 (2008: USD 1,897,000) has been recorded in the statement of comprehensive income as part of general and administrative expenses.
Management incentive plan During 2009 the Company notified certain employees of their awards under the Hikma Management Incentive Plan (“MIP”). Under the MIP, conditional awards of nil cost options are made which give the opportunity to grant an award of shares subject to achievement of the employee Key Performance Indicators (KPIs). This condition measures the employee achievement against set KPIs. In this case, the number of shares awarded is based on percentage of achievements. No awards vest for achievements below 50%.
The award is subject to a two year holding period during which the employee must remain employed in the Group; at the end of the holding period the award is released and becomes exercisable.

Governance and fi
nancial results
119
36. Share-based payments continued Details of the grants under the plan are shown below:
19 March 2009
Type of arrangement Management Incentive Plan
Date of notification 19 March 2009
Estimated date of grant March 2010
Maximum number granted 356,000
Contractual life 10 years
Vesting conditions After two years subject to achievement of KPIs
The cost of the management incentive plan of USD 763,000 (2008: USD nil) has been recorded in the statement of comprehensive income as part of general and administrative expenses.
37. Operating lease arrangements
2009$000’s
2008$000’s
Minimum lease payments under operating leases recognised in the statement of comprehensive income for the year 3,012 2,334
At the balance sheet date, the Group had outstanding commitments for future minimum lease payments under non-cancellable operating leases, which fall due as follows:
2009$000’s
2008$000’s
Within one year 1,961 1,742
In the second to fifth years inclusive 4,044 5,340
After five years 959 1,918
6,964 9,000
Operating lease payments represent rentals payable by the Group for certain of its office properties. Leases are negotiated for a term of 1 to 7.5 years.
38. Related party balancesTransactions between the Company and its subsidiaries have been eliminated on consolidation and are not disclosed in this note. Transactions between the Group and its associate and other related parties are disclosed below.
Trading transactions:During the year, Group companies entered into the following transactions with related parties:
Darhold Limited: is a related party of the Group because it is considered one of the major shareholders of Hikma Pharmaceuticals PLC with ownership percentage of 29.8% at the end of 2009 (2008: 30.2%). Further details on the relationship between Mr. Samih Darwazah, Mr. Said Darwazah, Mr. Mazen Darwazah and Mr. Ali Al-Husry, and Darhold Limited are given in the Directors’ Report.
Other than dividends (as paid to all shareholders), there were no transactions between the Group and Darhold Limited in the year.

120 Hikma Pharmaceuticals PLC Annual report 2009
Notes to the consolidated financial statements continued
38. Related party balances continued
Capital Bank – Jordan: is a related party of the Group because during the year one board member of the Bank is also a board member at Hikma Pharmaceuticals PLC. Total cash balances at Capital Bank – Jordan were USD 3,294,000 (2008: USD 217,000). Loans and overdrafts granted by Capital Bank to the Group amounted to USD 77,000 (2008: USD 207,000) with interest rates ranging between 8.75% and 3MLIBOR + 3. Total interest expense incurred against Group facilities was USD 28,000 (2008: USD 86,000). Total interest income received was 37,000 (2008: USD 1,500) and total commission paid in the year was USD 17,000 (2008: USD 11,300).
Jordan International Insurance Company: is a related party of the Group because one board member of the company is also a Board member at Hikma Pharmaceuticals PLC. Total insurance premiums paid by the Group to Jordan International Insurance Company during the year were USD 1,686,000 (2008: USD 1,351,000). The Group’s insurance expense for Jordan International Insurance Company contracts in the year 2009 was USD 2,006,000 (2008: USD 1,490,000). The amounts due to Jordan International Insurance Company at the year end were USD 129,000 (2008: USD 93,000).
Mena Innovative Technology: is a related party because the Group holds a minority stake in this company (see note 18) and because the majority shareholder is the wife of Mr. Nabil Rizk – a chairman of West-ward Pharmaceuticals.Total purchases during the year were USD nil (2008: USD 1,000). Purchases were made at market price discounted to reflect the quantity of goods purchased. At 31 December 2009, the Group has no outstanding balance with Mena Innovation Technology (2008: USD nil).
Tunisian Companies: Amounts due from the two Tunisian companies the Group has invested in net of provisions are USD 491,000 (2008: USD 474,000) and USD 1,052,000 (2008: USD 793,000) due from Societe Hikma Medicef Limited-Tunisia and Societe D’Industries Pharmaceutiques Ibn Al Baytar S.A. – Tunisia, respectively. The provision for doubtful debts related to balances above was USD 327,000 (2008: USD 303,000).
Mr. Yousef Abd Ali: Mr. Yousef Abd Ali is a related party of the Group because he holds a non-controlling interest in Hikma Lebanon of 33%, the amount owed to Mr. Yousef by the Group as at 31 December 2009 was USD 279,000 (2008: USD 161,000).
Labatec – Pharma SA: is a related party of the Group because it is owned by Mr. Samih Darwazah. During 2009 the Group total sales to Labatec – Pharma SA amounted to USD 42,000 (2008: 30,000) and the Group total purchases from Labatec amounted to USD 393,000. At 31 December 2009 the amount owed to Labatec Pharma by the Group was USD 149,000 (2008: nil).
King and Spalding: is a related party of the Group because the partner of the firm is a board member and a company secretary of West-ward. King and Spalding is an outside legal counsel firm that handles general legal matters for West-ward. During 2009 fees of USD 55,000 (2008: 217,000) were paid for legal services provided.
Remuneration of key management personnelThe remuneration of the key management personnel (comprising the Executive and Non-Executive Directors and certain of senior management as set out in the Directors’ report) of the Group is set out below in aggregate for each of the categories specified in IAS 24 Related Party Disclosures. Further information about the remuneration of the individual Directors is provided in the audited part of the Remuneration Committee Report on pages 64 to 70.
2009$000’s
2008$000’s
Short-term employee benefits 5,918 5,363
Share-based payments 2,002 1,312
Post employment benefits 31 61
7,951 6,736
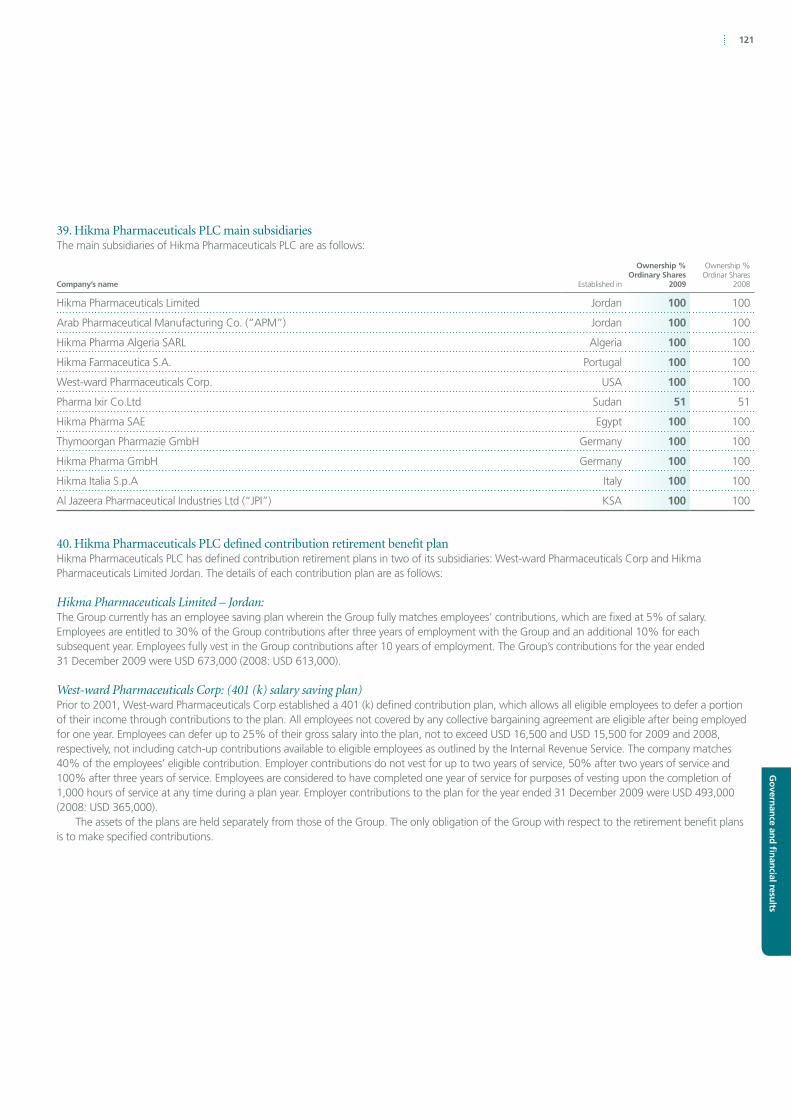
121
Governance and fi
nancial results
39. Hikma Pharmaceuticals PLC main subsidiariesThe main subsidiaries of Hikma Pharmaceuticals PLC are as follows:
Company’s name Established in
Ownership %Ordinary Shares
2009
Ownership %Ordinar Shares
2008
Hikma Pharmaceuticals Limited Jordan 100 100
Arab Pharmaceutical Manufacturing Co. (“APM”) Jordan 100 100
Hikma Pharma Algeria SARL Algeria 100 100
Hikma Farmaceutica S.A. Portugal 100 100
West-ward Pharmaceuticals Corp. USA 100 100
Pharma Ixir Co.Ltd Sudan 51 51
Hikma Pharma SAE Egypt 100 100
Thymoorgan Pharmazie GmbH Germany 100 100
Hikma Pharma GmbH Germany 100 100
Hikma Italia S.p.A Italy 100 100
Al Jazeera Pharmaceutical Industries Ltd (“JPI”) KSA 100 100
40. Hikma Pharmaceuticals PLC defined contribution retirement benefit planHikma Pharmaceuticals PLC has defined contribution retirement plans in two of its subsidiaries: West-ward Pharmaceuticals Corp and Hikma Pharmaceuticals Limited Jordan. The details of each contribution plan are as follows:
Hikma Pharmaceuticals Limited – Jordan:The Group currently has an employee saving plan wherein the Group fully matches employees’ contributions, which are fixed at 5% of salary. Employees are entitled to 30% of the Group contributions after three years of employment with the Group and an additional 10% for each subsequent year. Employees fully vest in the Group contributions after 10 years of employment. The Group’s contributions for the year ended 31 December 2009 were USD 673,000 (2008: USD 613,000).
West-ward Pharmaceuticals Corp: (401 (k) salary saving plan)Prior to 2001, West-ward Pharmaceuticals Corp established a 401 (k) defined contribution plan, which allows all eligible employees to defer a portion of their income through contributions to the plan. All employees not covered by any collective bargaining agreement are eligible after being employed for one year. Employees can defer up to 25% of their gross salary into the plan, not to exceed USD 16,500 and USD 15,500 for 2009 and 2008, respectively, not including catch-up contributions available to eligible employees as outlined by the Internal Revenue Service. The company matches 40% of the employees’ eligible contribution. Employer contributions do not vest for up to two years of service, 50% after two years of service and 100% after three years of service. Employees are considered to have completed one year of service for purposes of vesting upon the completion of 1,000 hours of service at any time during a plan year. Employer contributions to the plan for the year ended 31 December 2009 were USD 493,000 (2008: USD 365,000).
The assets of the plans are held separately from those of the Group. The only obligation of the Group with respect to the retirement benefit plans is to make specified contributions.

122 Hikma Pharmaceuticals PLC Annual report 2009
Notes2009
$000’s2008
$000’s
Non-current assets
Investment in subsidiaries 43 1,523,127 1,523,127
Due from subsidiaries 44 26,678 70,158
Intangible assets 196 246
Property, plant and equipment 165 321
1,550,166 1,593,852
Current assets
Other current assets 481 161
Cash and cash equivalents 45 6,428 13,176
Due from subsidiaries 44 104,316 108,383
Accounts receivable 154 42
111,379 121,762
Total assets 1,661,545 1,715,614
Current liabilities
Other payables 46 292 201
Other current liabilities 1,649 1,588
Short-term debt 47 – 40,000
Due to subsidiaries 48 592,923 592,801
594,864 634,590
Net current liabilities 483,485 512,828
Total liabilities 594,864 634,590
Net assets 1,066,681 1,081,024
Equity
Share capital 53 34,236 33,857
Share premium 54 980,154 977,342
Own shares (2,203) (1,124)
Retained earnings 55 54,494 70,949
Equity attributable to equity holders to the parent 1,066,681 1,081,024
The financial statements of Hikma Pharmaceuticals PLC, registered number 5557954, were approved by the Board of Directors and signed on its behalf by:
Said DarwazahChief Executive Officer
16 March 2010
Company balance sheetat 31 December 2009

123
Governance and fi
nancial results
Paid up capital $000’s
Share premium
$000’s
Retained earnings
$000’s
Own shares $000’s
Total $000’s
At 1 January 2008 30,229 821,428 79,588 – 931,245
Issue of share capital 3,628 155,914 – – 159,542
Own shares – – – (1,124) (1,124)
Cost of equity settled employee share scheme – – 3,384 – 3,384
Net profit for the year – – 2,128 – 2,128
Dividends paid – – (14,151) – (14,151)
At 31 December 2008/1 January 2009 33,857 977,342 70,949 (1,124) 1,081,024
Issue of share capital 379 2,812 – – 3,191
Own shares – – – (1,079) (1,079)
Cost of equity settled employee share scheme – – 4,616 – 4,616
Net loss for the year – – (4,953) – (4,953)
Dividends paid – – (16,118) – (16,118)
At 31 December 2009 34,236 980,154 54,494 (2,203) 1,066,681
As permitted by Section 408 of the Companies Act 2006, the statement of comprehensive income of the Company is not presented as part of these accounts.
Company statement of changes in equityfor the year ended 31 December 2009

124 Hikma Pharmaceuticals PLC Annual report 2009
Company cash flow statementfor the year ended 31 December 2009
2009
$000’s2008
$000’s
(Loss)/profit before tax (4,953) 2,128
Cost of equity settled employee share scheme 998 709
Finance income (3,056) (2,864)
Interest and bank charges 958 1,410
Change in other current assets (320) 716
Change in other payables 91 (775)
Depreciation of property, plant and equipment 158 168
Amortisation of intangible assets 51 1
Losses on disposal of property, plant and equipment – 5
Change in accounts receivable (112) (27)
Change in amounts due from/to subsidiaries 7,807 201,896
Change in other current liabilities (213) (444)
Net cash from operating activities 1,409 202,923
Investing activities
Change in amounts due from/(to) subsidiaries 43,480 (179,475)
Purchase of property, plant and equipment (3) (40)
Proceeds from disposal of property, plant and equipment – 4
Purchase of intangible assets – (247)
Interest income 3,056 2,864
Net cash from/(used in) investing activities 46,533 (176,894)
Financing activities
Proceeds from share issuance 3,191 162,026
Costs of share issue – (2,484)
Decrease in short-term debts (40,000) (158,000)
Interest paid (684) (1,524)
Purchase of own shares (1,079) (1,124)
Dividends paid (16,118) (14,151)
Net cash used in financing activities (54,690) (15,257)
Net (decrease)/increase in cash and cash equivalents (6,748) 10,772
Cash and cash equivalents at beginning of the year 13,176 2,404
Cash and cash equivalents at end of the year 6,428 13,176

125
Governance and fi
nancial results
Notes to the Company financial statements
41. Adoption of new and revised StandardsThe impact on the company of new and revised standards is the same as for the Group. Details are given in Note 1 to the consolidated financial statements.
42. Significant accounting policiesThe separate financial statements of the Company are presented as required by the Companies Act 2006. As permitted by that Act, the separate financial statements have been prepared in accordance with International Financial Reporting Standards and UK company law.
The financial statements have been prepared on the historical cost basis. The principal accounting policies adopted are the same as those set out in Note 2 to the consolidated financial statements with the addition of the policy as noted below.
Investments in subsidiaries are stated at cost less, where appropriate, provisions for impairment.
43. Investment in subsidiariesInvestment in subsidiaries represents the following:
Company’s name Established in
Ownership% Ordinary Shares
2009
Ownership% Ordinary Shares
2008
Hikma Pharma Limited – Jersey UK 100 100
Hikma Holdings (UK) Limited UK 100 100
Al Jazeera Pharmaceutical Industries Ltd (“JPI”) K.S.A 52.5* 52.5*
Hikma Pharmaceuticals Limited Jordan 22.8* 22.8*
*The remaining shares are held by other Group companies.
On 23 July 2008 a loan of USD 169,760,000 from the Company to Hikma Pharmacuticals Limited – Jordan was converted to equity, giving the Company a 22.8% share.
The investments in subsidiaries are all stated at cost.
44. Due from subsidiaries
Non-current assets
As at 31 December
2009$000’s
2008$000’s
Hikma Investment 8,160 55,459
West-ward Pharmaceuticals Corp 8,424 8,000
Hikma Italia S.p.A 4,420 4,234
Hikma Pharma Limited – Jersey 5,674 2,465
26,678 70,158
These balances represent loans that carry interest of 2.2% to 4.8% (2008: 3.9% to 4.8%) per annum charged on the outstanding loan balances.
Current assets
As at 31 December
2009$000’s
2008$000’s
Due from Hikma Pharma Limited – Jersey 4,431 2,736
Due from Hikma Pharmaceuticals – Jordan – 97
Due from Hikma Farmaceutica – Portugal 445 208
Due from Hikma Pharma – Germany 883 587
Due from Hikma UK Limited 96,707 103,544
Due from Hikma Limited 306 429
Others 1,544 782
104,316 108,383
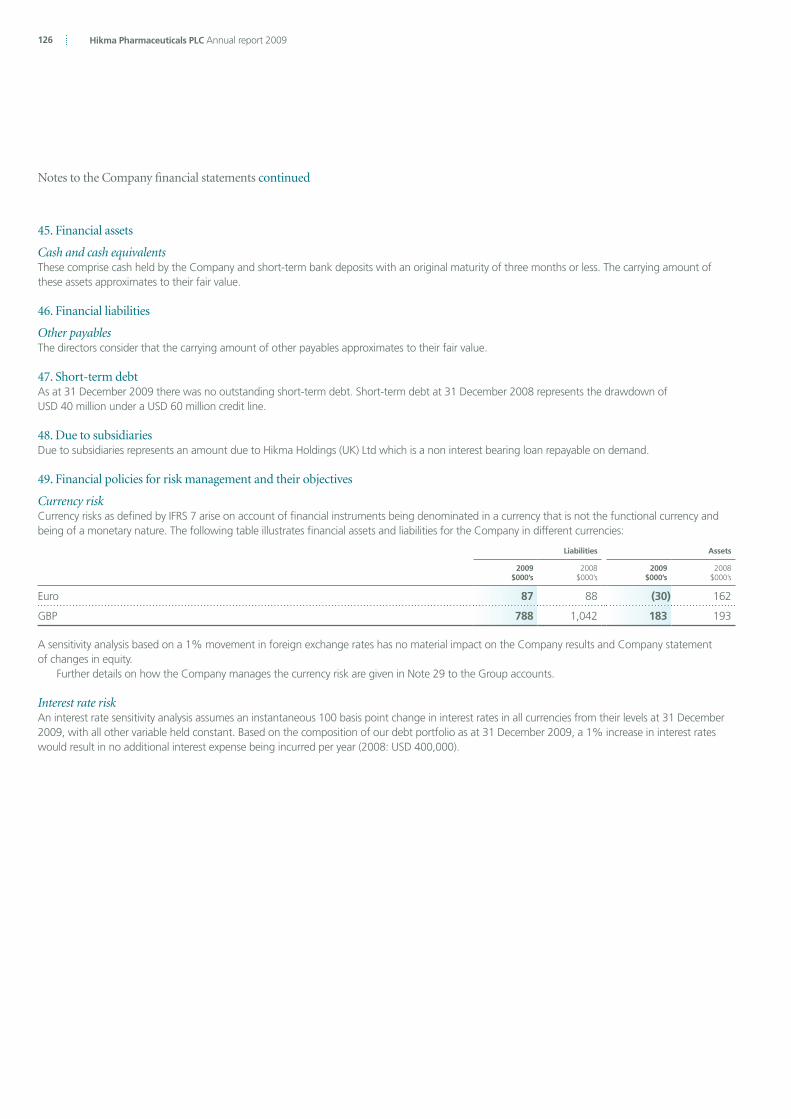
126 Hikma Pharmaceuticals PLC Annual report 2009
Notes to the Company financial statements continued
45. Financial assets
Cash and cash equivalentsThese comprise cash held by the Company and short-term bank deposits with an original maturity of three months or less. The carrying amount of these assets approximates to their fair value.
46. Financial liabilities
Other payablesThe directors consider that the carrying amount of other payables approximates to their fair value.
47. Short-term debtAs at 31 December 2009 there was no outstanding short-term debt. Short-term debt at 31 December 2008 represents the drawdown of USD 40 million under a USD 60 million credit line.
48. Due to subsidiariesDue to subsidiaries represents an amount due to Hikma Holdings (UK) Ltd which is a non interest bearing loan repayable on demand.
49. Financial policies for risk management and their objectives
Currency riskCurrency risks as defined by IFRS 7 arise on account of financial instruments being denominated in a currency that is not the functional currency and being of a monetary nature. The following table illustrates financial assets and liabilities for the Company in different currencies:
Liabilities Assets
2009$000’s
2008$000’s
2009$000’s
2008$000’s
Euro 87 88 (30) 162
GBP 788 1,042 183 193
A sensitivity analysis based on a 1% movement in foreign exchange rates has no material impact on the Company results and Company statement of changes in equity.
Further details on how the Company manages the currency risk are given in Note 29 to the Group accounts.
Interest rate risk An interest rate sensitivity analysis assumes an instantaneous 100 basis point change in interest rates in all currencies from their levels at 31 December 2009, with all other variable held constant. Based on the composition of our debt portfolio as at 31 December 2009, a 1% increase in interest rates would result in no additional interest expense being incurred per year (2008: USD 400,000).
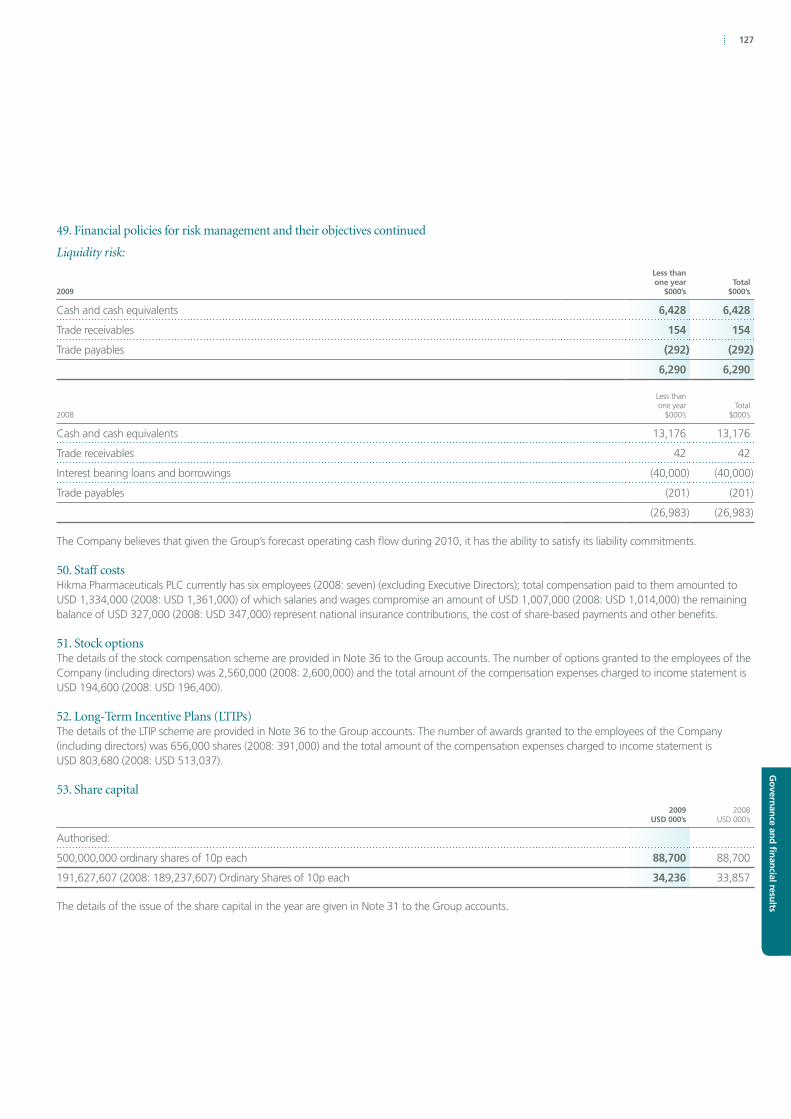
127
Governance and fi
nancial results
49. Financial policies for risk management and their objectives continued
Liquidity risk:
2009
Less than one year
$000’sTotal
$000’s
Cash and cash equivalents 6,428 6,428
Trade receivables 154 154
Trade payables (292) (292)
6,290 6,290
2008
Less than one year
$000’sTotal
$000’s
Cash and cash equivalents 13,176 13,176
Trade receivables 42 42
Interest bearing loans and borrowings (40,000) (40,000)
Trade payables (201) (201)
(26,983) (26,983)
The Company believes that given the Group’s forecast operating cash flow during 2010, it has the ability to satisfy its liability commitments.
50. Staff costsHikma Pharmaceuticals PLC currently has six employees (2008: seven) (excluding Executive Directors); total compensation paid to them amounted to USD 1,334,000 (2008: USD 1,361,000) of which salaries and wages compromise an amount of USD 1,007,000 (2008: USD 1,014,000) the remaining balance of USD 327,000 (2008: USD 347,000) represent national insurance contributions, the cost of share-based payments and other benefits.
51. Stock optionsThe details of the stock compensation scheme are provided in Note 36 to the Group accounts. The number of options granted to the employees of the Company (including directors) was 2,560,000 (2008: 2,600,000) and the total amount of the compensation expenses charged to income statement is USD 194,600 (2008: USD 196,400).
52. Long-Term Incentive Plans (LTIPs)The details of the LTIP scheme are provided in Note 36 to the Group accounts. The number of awards granted to the employees of the Company (including directors) was 656,000 shares (2008: 391,000) and the total amount of the compensation expenses charged to income statement is USD 803,680 (2008: USD 513,037).
53. Share capital
2009USD 000’s
2008USD 000’s
Authorised:
500,000,000 ordinary shares of 10p each 88,700 88,700
191,627,607 (2008: 189,237,607) Ordinary Shares of 10p each 34,236 33,857
The details of the issue of the share capital in the year are given in Note 31 to the Group accounts.

128 Hikma Pharmaceuticals PLC Annual report 2009
Notes to the Company financial statements continued
54. Share premium
Share premiumUSD 000’s
Balance at 1 January 2009 977,342
Premium arising on exercise of stock options 2,812
Balance at 31 December 2009 980,154
55. Net income for the yearAs permitted by section 408 of the Companies Act 2006, the statement of comprehensive income of the Company is not presented as part of these accounts.
Included in the net income for the year is an amount of USD nil (2008: USD 8,000,000) representing dividends received and USD 998,000 (2008: USD 709,000) representing the current year charge of stock option and LTIPs expenses relating to the Company’s employees. The remaining USD 3,618,000 (2008: USD 2,675,000) of the Group’s stock option and LTIPs charge is recharged to subsidiary companies.
56. Related partyTransactions between the Company and its subsidiaries and associates are disclosed in Note 38.
Amounts repayable to and from subsidiaries are disclosed in Notes 45 and 48.
Other transactions with related parties include management charges for services provided to the subsidiary companies and transactions with key management personnel. Compensation paid to key management personnel is disclosed at Note 38. Details of directors’ remuneration are disclosed in the Remuneration Committee Report on pages 64 to 70.
More details on the general information of the ultimate parent of the Group are disclosed in Note 2.

129
Shareholder information
2010 financial calendar
17 March 2009 preliminary results and final dividend announced
14 April 2009 final dividend ex-dividend date
16 April 2009 final dividend record date
13 May Annual General Meeting
27 May 2009 final dividend paid to shareholders
26 August* 2010 interim results and interim dividend announced
8 September* 2010 interim dividend ex-dividend date
10 September* 2010 interim dividend record date
14 October* 2010 interim dividend paid to shareholders
*Provisional dates
Shareholding enquiriesEnquiries or information concerning existing shareholdings should be directed to the Company’s registrars, Capita Registrars either:
in writing to Shareholder Services, Capita Registrars, The Registry, 34 Beckenham Road, Beckenham, Kent BR3 4TU;
by telephone from within the UK on 0870 162 3100;
by telephone from outside the UK on +44 208 639 2157; or
through the website www.capitaregistrars.co.uk.
In addition to general enquiries – for example changes of address, change of name, loss of a share certificate – the Registrar can also assist with the following:
Mandating the dividend payments Shareholders who currently receive their dividend by cheque can request a dividend mandate form from the registrar and have their dividend paid direct into their bank account on the same day as the dividend is paid. The tax voucher is sent direct to the shareholders registered address.
International Payment SystemIf you are an overseas shareholder the Registrar is now able to pay dividends in several foreign currencies for an administrative charge of £5.00, which is deducted from the payment. Contact the registrar for further information.
Dividend Payments – Currency electionsThe Company declares dividends in US Dollar. However, shareholders can opt to receive the dividend in Pounds Sterling. The Company will no longer be distributing currency election forms for each dividend, so if you wish to change the currency in which you receive your dividend you must write to the registrars at the above address.
WebsitePress releases, the share price and other information on the Group are available on the Company’s website www.hikma.com.
Share listings
LondonThe Company’s Ordinary Shares are admitted to the Official List of the London Stock Exchange. They are listed under EPIC – HIK, SEDOL – B0LCW08 GB and ISIN – GB00B0LCW083.
Further information on this market, its trading systems and current trading in Hikma Pharmaceuticals PLC shares can be found on the London Stock Exchange website www.londonstockexchange.com.
Global Depository ReceiptsThe Company also has listed Global Depository Receipts (“GDRs”) on NasdaqDubai. They are listed under EPIC – HIK and ISIN – US4312882081. Further information on NasdaqDubai, its trading systems and current trading in Hikma Pharmaceuticals PLC GDRs can be found on the website www.nasdaqdubai.com.
American Depository Receipt (ADRs)Hikma Pharmaceuticals PLC has an ADR programme for which Bank of New York Mellon acts as Depositary. One ADR equates to 2 Hikma Ordinary Shares. ADRs are traded as a level 1 Over-the-Counter (OTC) programme under the symbol HKMPY. Enquiries should be made to: BNY Mellon Shareowner Services PO Box 358516 Pittsburgh, PA 15252-8516 Telephone: +1 201 680 6825 Telephone: +1 888 BNY ADRS (toll-free within the US) Email: [email protected]
Shareholder fraudThe Financial Services Authority has issued a number of warnings to shareholders regarding boiler room scams. Over the last year many companies have become aware that shareholders have received unsolicited phone calls or correspondence concerning investment matters. These are typically from overseas based ‘brokers’ who target UK shareholders, offering to sell them what often turn out to be worthless or high risk shares in US or UK investments. These operations are commonly known as boiler rooms. These brokers can be very persistent and extremely persuasive. Shareholders are advised to be very cautious of unsolicited advice, offers to buy shares at a discount or offers of free company reports. If you receive any unsolicited investment advice:
Obtain the correct name of the person and organisations.
Check they are authorised by the FSA by looking the firm up on www.fsa.gov.uk/register.
Report the matter to the FSA either by calling 0845 606 1234 or visit www.moneymadeclear.fsa.gov.uk.
If the caller persists, hang up.
Details of the share dealing facilities sponsored by the Company are included in Company mailings and are on the Company website.
The Company’s website is www.hikma.com and the registered office is 13 Hanover Square, London, W1S 1HW. Telephone number + 44 207 399 2760.
Governance and fi
nancial results
130 Hikma Pharmaceuticals PLC Annual report 2009
Shareholder information continued
Articles of AssociationThe Articles of Association of the Company (the “Articles”) are the internal rules by which the Company is governed, covering matters such as the removal and appointment of directors and the powers and rights of shareholders. The Articles can only be changed by special resolution of the shareholders.
The Company is proposing to adopt new Articles to take account of:
changes to the law and practice since the existing Articles were last updated;
the Companies (Shareholders’ Rights) Regulations 2009;
the implementation on 1 October 2009 of the last parts of the Companies Act 2006..
The principal changes introduced in the new Articles are summarised in Appendix A of the Notice of Annual General Meeting accompanying this document. Other changes, which are of a minor, technical or clarifying nature and also some more changes which merely reflect changes made by the Companies Act 2006 and the Companies (Shareholders’ Rights) Regulations 2009 have not been noted in Appendix A. The new Articles, showing all the changes from the existing Articles are available for inspection at the Company’s registered office – 13 Hanover Square, London W1H 1SW – during normal business hours on Monday to Friday. They are also available at the offices of Ashurst LLP, Broadwalk House, 5 Appold Street, London EC2A 2HA during normal business hours on Monday to Friday, in each case from the date of the Notice of Annual General Meeting until the close of the Annual General Meeting (Saturdays, Sundays and public holidays excepted). They will also be available for inspection at the place of the meeting for at least 15 minutes prior to and during the meeting.
131
Governance and fi
nancial results
Principal Group companies
Hikma Pharmaceuticals PLC
Registered in England and Wales number 5557934Registered office:
13 Hanover Square London W1S 1HW
UK
Telephone: +44 (0)20 7399 2760Facsimile: +44 (0)20 7399 2761
E-mail: [email protected]
Hikma Pharmaceuticals Limited
P.O. Box 18240011118 Amman
Jordan
Telephone: +962 6 5802900Facsimile: +962 6 5827102
West-ward Pharmaceutical Corporation
465 Industrial Way WestEatontown
New Jersey 07724USA
Telephone: +1 732 542 1191Facsimile: +1 732 542 6150
Hikma Farmacêutica S.A.
Estrada Rio Da Mo no. 88A, 8B – Fervença
2705-906 Terrugem SNTPortugal
Telephone: +351 21 9608410Facsimile: +351 21 9615102

132 Hikma Pharmaceuticals PLC Annual report 2009
Auditors
Deloitte LLP2 New Street SquareLondon EC4A 3BZ
UK
Brokers
Citigroup Global Markets LimitedCitigroup CentreCanada SquareLondon E14 5LB
UK
Merrill LynchMerrill Lynch Financial Centre
2 King Edward StreetLondon EC1A 1HQ
UK
Legal Advisers
AshurstBroadwalk House5 Appold Street
London EC2A 2HAUK
Public Relations
Brunswick Group LLP16 Lincoln’s Inn Fields London WC2A 3ED
UK
ADR Depositary Bank
BNY Mellon Shareowner Services PO Box 358516
Pittsburgh, PA 15252-8516 USA
Advisers

For more information visit our website
www.hikma.com
Hikma Pharmaceuticals PLC Since Hikma was founded, we have grown into
a successful multinational pharmaceutical group. Our business today is diverse in its product line
and the breadth of its geographic coverage. This diversification will ensure that we maintain
our track record of strong growth
About this annual report
Produced and designed by Radley Yeldar www.ry.com
This report is printed on “Look!” paper. This paper is made from virgin wood fibre from well-managed forests independently certified according to the rules of
the Forest Stewardship Council (FSC). It is manufactured at a mill that is certified to ISO14001 and EMAS environmental standards. The mill uses pulps that are totally chlorine
free (TCF), and some pulp is bleached using an elemental chlorine fee (ECF) process. The inks in printing this report are all vegetable-based.
Printed at St Ives Westerham Press Ltd, ISO14001, FSC certified and CarbonNeutral®

Hikma Pharmaceuticals PLC 13 Hanover Square London W1S 1 HW UK
www.hikma.com
Hikma Pharmaceuticals PLC Annual report 2009
Hikm
a Pharm
aceuticals PLC
Annual report 2009
Delivering...