Delivering Disciplined Growth · 2015-10-15 · Kinross Gold Corporation BMO Sales Desk...
24
Kinross Gold Corporation BMO Sales Desk Presentation April 20, 2010 1 Delivering Disciplined Growth BMO Sales Desk Presentation Toronto, ON April 20, 2010 Cautionary Statement on Forward‐Looking Information All statements, other than statements of historical fact, contained or incorporated by reference in this presentation, including any information as to the future financial or operating performance of Kinross, constitute “forward‐looking information” or “forward‐looking statements” within the meaning of certain securities laws, including the provisions of the Securities Act (Ontario) and the provisions for “safe harbour” under the United States Private Securities Litigation Reform Act of 1995 and are based on expectations, estimates and projections as of the date of this presentation. Forward‐looking statements include, without limitation, possible events, statements with respect to possible events, the future price of gold and silver, the estimation of mineral reserves and resources and the realization of such estimates, the timing and amount and costs of estimated future production, expected capital expenditures, development and mining activities, permitting time lines, currency fluctuations, requirements for additional capital, government regulation, environmental risks, unanticipated reclamation expenses, title disputes or claims. The words “plan”, “expects”, “does not expect”, “is expected”, “budget”, “scheduled”, “estimates”, “forecasts”, “targets”, “intends”, “anticipates”, “does not anticipate”, or “believes”, or variations of such words and phrases or statements that certain actions, events or results “may”, “could”, “would”, “should”, “might”, or “will be taken”, “occur”, or “be achieved” and similar expressions identify forward‐looking statements. Forward‐looking statements are necessarily based upon a number of estimates and assumptions that, while considered reasonable by Kinross as of the date of such statements, are inherently subject to significant business, economic and competitive uncertainties and contingencies. Statements representing management’s financial and other outlook have been prepared solely for purposes of expressing their current views regarding the Company’s financial and other outlook and may not be appropriate for any other purpose. Many of these uncertainties and contingencies can affect, and could cause, Kinross’ actual results to differ materially from those expressed or implied in any forward‐looking statement made by, or on behalf of, Kinross. There can be no assurance that forward‐looking statements will prove to be accurate, as actual results and future events could differ materially from those anticipated in such statements. All of the forward‐looking statements made in this presentation are qualified by these cautionary statements and those made in our filings with the securities regulators of Canada and the U.S., including but not limited to those cautionary statements made in the “Risk Factors” section of our most recently filed Annual Information Form, the “Risk Analysis” section of our most recently filed Management’s Discussion and Analysis and the “Cautionary Statement on Forward‐ Looking Information” in our news release dated February 17, 2010, to which readers are referred and which are incorporated by reference in this presentation, and all of which qualify any and all forward‐looking statements made in this presentation. These factors are not intended to represent a complete list of the factors that could affect Kinross. Kinross disclaims any intention or obligation to update or revise any forward‐looking statements or to explain any material difference between subsequent actual events and such forward‐looking statements, except to the extent required by applicable law. 2 Other information Where we say “we”, “us”, “our”, the “Company”, or “Kinross” in this presentation, we mean Kinross Gold Corporation and/or one or more or all of its subsidiaries, as may be applicable. The technical information about the Company’s mineral properties contained in this presentation has been prepared under the supervision of Mr. Rob Henderson, an officer of the Company who is a “qualified person” within the meaning of National Instrument 43‐101.
Transcript of Delivering Disciplined Growth · 2015-10-15 · Kinross Gold Corporation BMO Sales Desk...
Kinross Gold CorporationBMO Sales Desk Presentation
April 20, 2010
1
Delivering Disciplined Growth
BMO Sales Desk PresentationToronto, ON
April 20, 2010
Cautionary Statement on Forward‐Looking Information
All statements, other than statements of historical fact, contained or incorporated by reference in this presentation, including any information as to the futurefinancial or operating performance of Kinross, constitute “forward‐looking information” or “forward‐looking statements” within the meaning of certainsecurities laws, including the provisions of the Securities Act (Ontario) and the provisions for “safe harbour” under the United States Private Securities LitigationReform Act of 1995 and are based on expectations, estimates and projections as of the date of this presentation. Forward‐looking statements include, withoutlimitation, possible events, statements with respect to possible events, the future price of gold and silver, the estimation of mineral reserves and resources andthe realization of such estimates, the timing and amount and costs of estimated future production, expected capital expenditures, development and miningactivities, permitting time lines, currency fluctuations, requirements for additional capital, government regulation, environmental risks, unanticipatedp g y q p g g preclamation expenses, title disputes or claims. The words “plan”, “expects”, “does not expect”, “is expected”, “budget”, “scheduled”, “estimates”, “forecasts”,“targets”, “intends”, “anticipates”, “does not anticipate”, or “believes”, or variations of such words and phrases or statements that certain actions, events orresults “may”, “could”, “would”, “should”, “might”, or “will be taken”, “occur”, or “be achieved” and similar expressions identify forward‐looking statements.Forward‐looking statements are necessarily based upon a number of estimates and assumptions that, while considered reasonable by Kinross as of the date ofsuch statements, are inherently subject to significant business, economic and competitive uncertainties and contingencies. Statements representingmanagement’s financial and other outlook have been prepared solely for purposes of expressing their current views regarding the Company’s financial andother outlook and may not be appropriate for any other purpose. Many of these uncertainties and contingencies can affect, and could cause, Kinross’ actualresults to differ materially from those expressed or implied in any forward‐looking statement made by, or on behalf of, Kinross. There can be no assurance thatforward‐looking statements will prove to be accurate, as actual results and future events could differ materially from those anticipated in such statements. Allof the forward‐looking statements made in this presentation are qualified by these cautionary statements and those made in our filings with the securitiesregulators of Canada and the U.S., including but not limited to those cautionary statements made in the “Risk Factors” section of our most recently filed AnnualInformation Form, the “Risk Analysis” section of our most recently filed Management’s Discussion and Analysis and the “Cautionary Statement on Forward‐Looking Information” in our news release dated February 17, 2010, to which readers are referred and which are incorporated by reference in this presentation,and all of which qualify any and all forward‐looking statements made in this presentation. These factors are not intended to represent a complete list of thefactors that could affect Kinross. Kinross disclaims any intention or obligation to update or revise any forward‐looking statements or to explain any materialdifference between subsequent actual events and such forward‐looking statements, except to the extent required by applicable law.
2
Other information
Where we say “we”, “us”, “our”, the “Company”, or “Kinross” in this presentation, we mean Kinross Gold Corporation and/or one or more or all of itssubsidiaries, as may be applicable.
The technical information about the Company’s mineral properties contained in this presentation has been prepared under the supervision of Mr. RobHenderson, an officer of the Company who is a “qualified person” within the meaning of National Instrument 43‐101.
Kinross Gold CorporationBMO Sales Desk Presentation
April 20, 2010
2
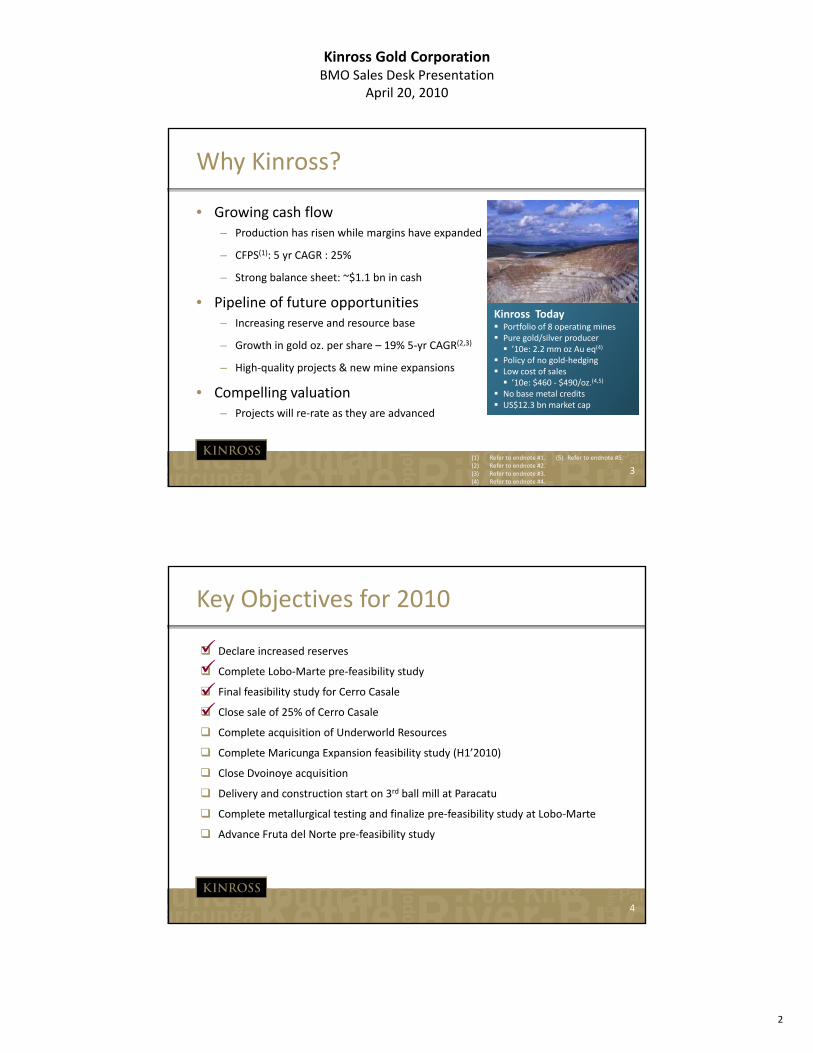
Why Kinross?
• Growing cash flow– Production has risen while margins have expanded
– CFPS(1): 5 yr CAGR : 25%
– Strong balance sheet: ~$1.1 bn in cash
• Pipeline of future opportunities– Increasing reserve and resource base
– Growth in gold oz. per share – 19% 5‐yr CAGR(2,3)
High quality projects & new mine expansions
Kinross Today Portfolio of 8 operating mines Pure gold/silver producer ’10e: 2.2 mm oz Au eq(4)
Policy of no gold‐hedging
Kinross Today Portfolio of 8 operating mines Pure gold/silver producer ’10e: 2.2 mm oz Au eq(4)
Policy of no gold‐hedging
3
– High‐quality projects & new mine expansions
• Compelling valuation– Projects will re‐rate as they are advanced
Low cost of sales ’10e: $460 ‐ $490/oz.(4,5)
No base metal credits US$12.3 bn market cap
Low cost of sales ’10e: $460 ‐ $490/oz.(4,5)
No base metal credits US$12.3 bn market cap
(1) Refer to endnote #1. (5) Refer to endnote #5.(2) Refer to endnote #2.(3) Refer to endnote #3.(4) Refer to endnote #4.
Key Objectives for 2010
Declare increased reserves
Complete Lobo‐Marte pre‐feasibility study
Final feasibility study for Cerro Casale
Close sale of 25% of Cerro Casale
Complete acquisition of Underworld Resources
Complete Maricunga Expansion feasibility study (H1’2010)
Close Dvoinoye acquisition
Delivery and construction start on 3rd ball mill at Paracatu
4
Complete metallurgical testing and finalize pre‐feasibility study at Lobo‐Marte
Advance Fruta del Norte pre‐feasibility study
Kinross Gold CorporationBMO Sales Desk Presentation
April 20, 2010
3
Next wave of growth
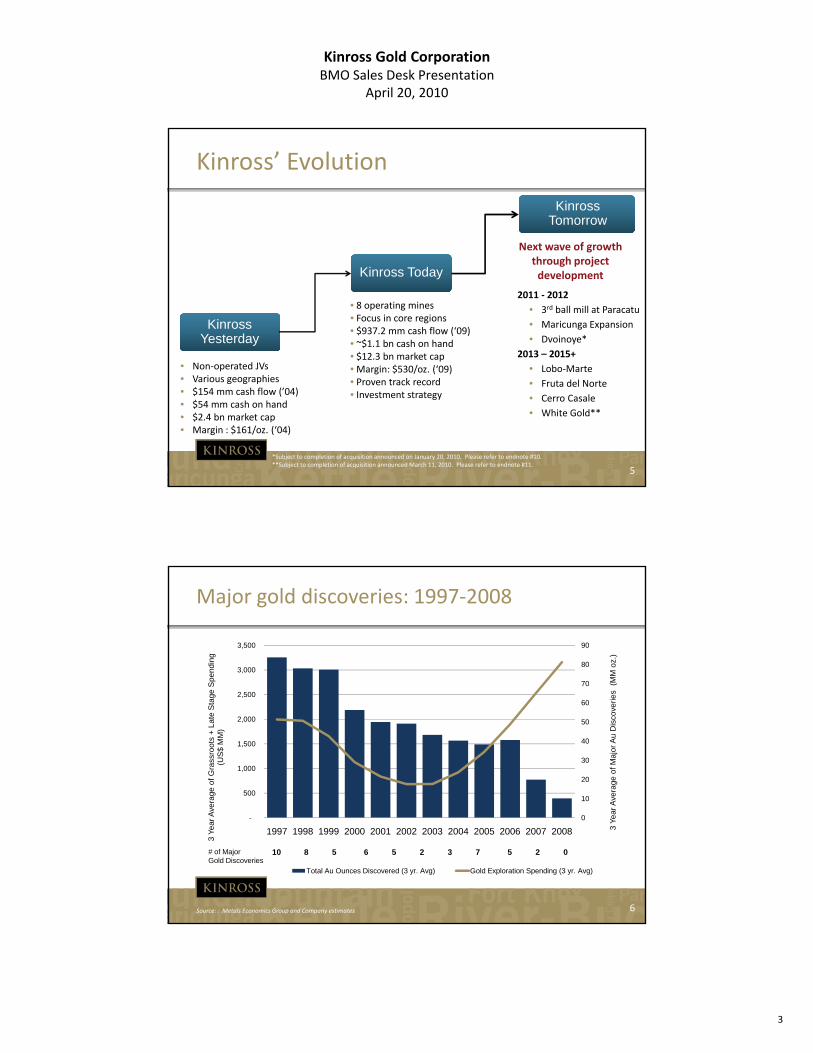
Kinross’ Evolution
Kinross Tomorrow
• Non‐operated JVs
• 8 operating mines• Focus in core regions• $937.2 mm cash flow (‘09)• ~$1.1 bn cash on hand• $12.3 bn market capM i $530/ (‘09)
Next wave of growth through project development
2011 ‐ 2012
• 3rd ball mill at Paracatu
• Maricunga Expansion
• Dvoinoye*
2013 – 2015+
• Lobo Marte
Kinross Yesterday
Kinross Today
5
Non operated JVs• Various geographies• $154 mm cash flow (’04)• $54 mm cash on hand• $2.4 bn market cap• Margin : $161/oz. (‘04)
• Margin: $530/oz. (‘09)• Proven track record• Investment strategy
• Lobo‐Marte
• Fruta del Norte
• Cerro Casale
• White Gold**
*Subject to completion of acquisition announced on January 20, 2010. Please refer to endnote #10.**Subject to completion of acquisition announced March 11, 2010. Please refer to endnote #11.
Major gold discoveries: 1997‐2008
70
80
90
3,000
3,500
(MM
oz.
)
Sp
en
din
g
10
20
30
40
50
60
70
500
1,000
1,500
2,000
2,500
Ave
rage
of
Ma
jor A
u D
isco
verie
s (
era
ge o
f G
rass
roo
ts +
La
te S
tage
S(U
S$
MM
)
6Source: : Metals Economics Group and Company estimates
0-
1997 1998 1999 2000 2001 2002 2003 2004 2005 2006 2007 2008 3 Y
ea
r A
3 Y
ea
r Ave
Total Au Ounces Discovered (3 yr. Avg) Gold Exploration Spending (3 yr. Avg)
10 5 6 5 2 3 7 5 08 2# of Major Gold Discoveries
Kinross Gold CorporationBMO Sales Desk Presentation
April 20, 2010
4
United StatesBrazil Chile
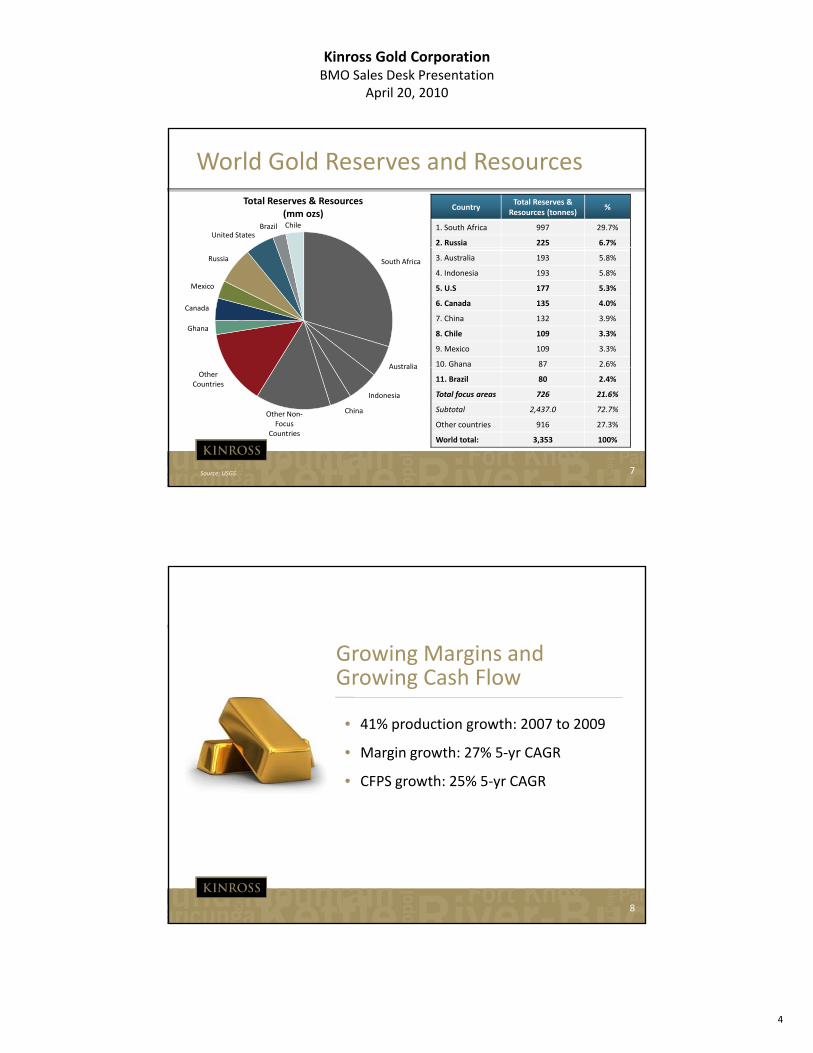
World Gold Reserves and Resources
Total Reserves & Resources(mm ozs)
CountryTotal Reserves &
Resources (tonnes)%
1. South Africa 997 29.7%
2. Russia 225 6.7%
South Africa
Australia
Ghana
Canada
Mexico
Russia 3. Australia 193 5.8%
4. Indonesia 193 5.8%
5. U.S 177 5.3%
6. Canada 135 4.0%
7. China 132 3.9%
8. Chile 109 3.3%
9. Mexico 109 3.3%
10. Ghana 87 2.6%
7
Australia
Indonesia
ChinaOther Non‐Focus
Countries
Other Countries
Source: USGS
11. Brazil 80 2.4%
Total focus areas 726 21.6%
Subtotal 2,437.0 72.7%
Other countries 916 27.3%
World total: 3,353 100%
Growing Margins and Growing Cash Flow
• 41% production growth: 2007 to 2009
• Margin growth: 27% 5‐yr CAGR
• CFPS growth: 25% 5‐yr CAGR
g
8
Kinross Gold CorporationBMO Sales Desk Presentation
April 20, 2010
5
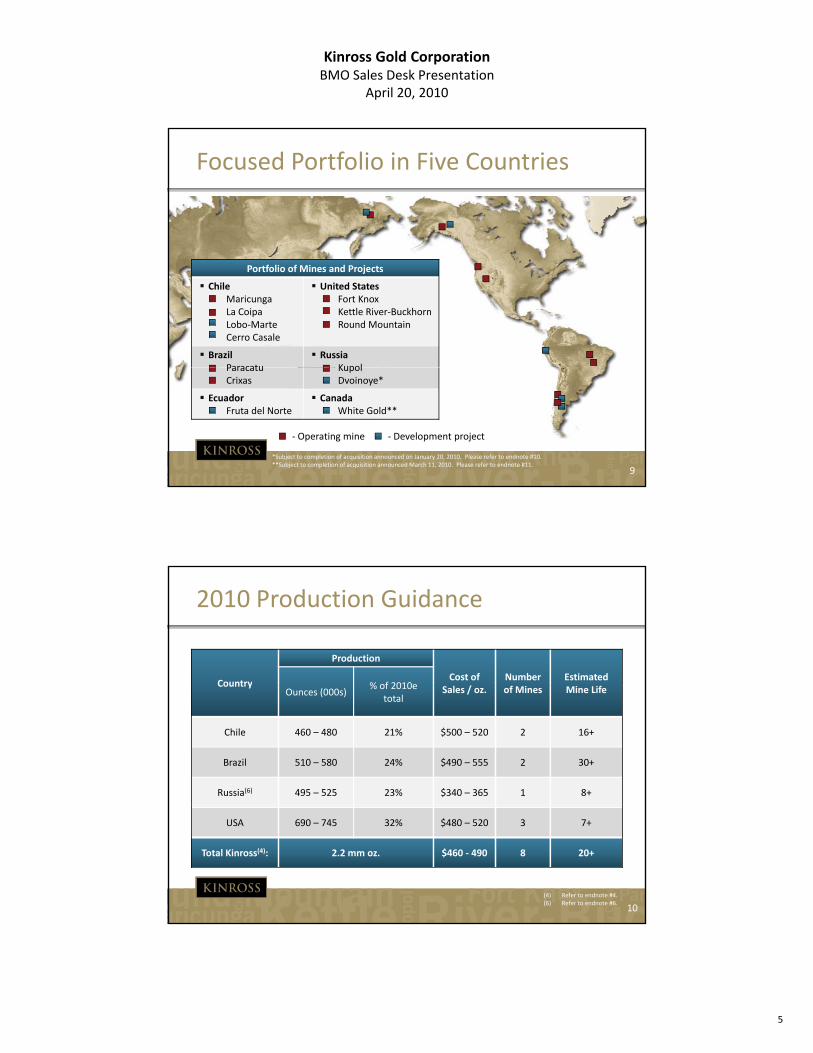
Focused Portfolio in Five Countries
Portfolio of Mines and Projects
Chile• Maricunga• La Coipa• Lobo‐Marte• Cerro Casale
United States• Fort Knox• Kettle River‐Buckhorn• Round Mountain
Brazil Paracatu
Russia• Kupol
9
Paracatu Crixas
• Kupol• Dvoinoye*
Ecuador• Fruta del Norte
CanadaWhite Gold**
‐ Operating mine ‐ Development project
*Subject to completion of acquisition announced on January 20, 2010. Please refer to endnote #10.**Subject to completion of acquisition announced March 11, 2010. Please refer to endnote #11.
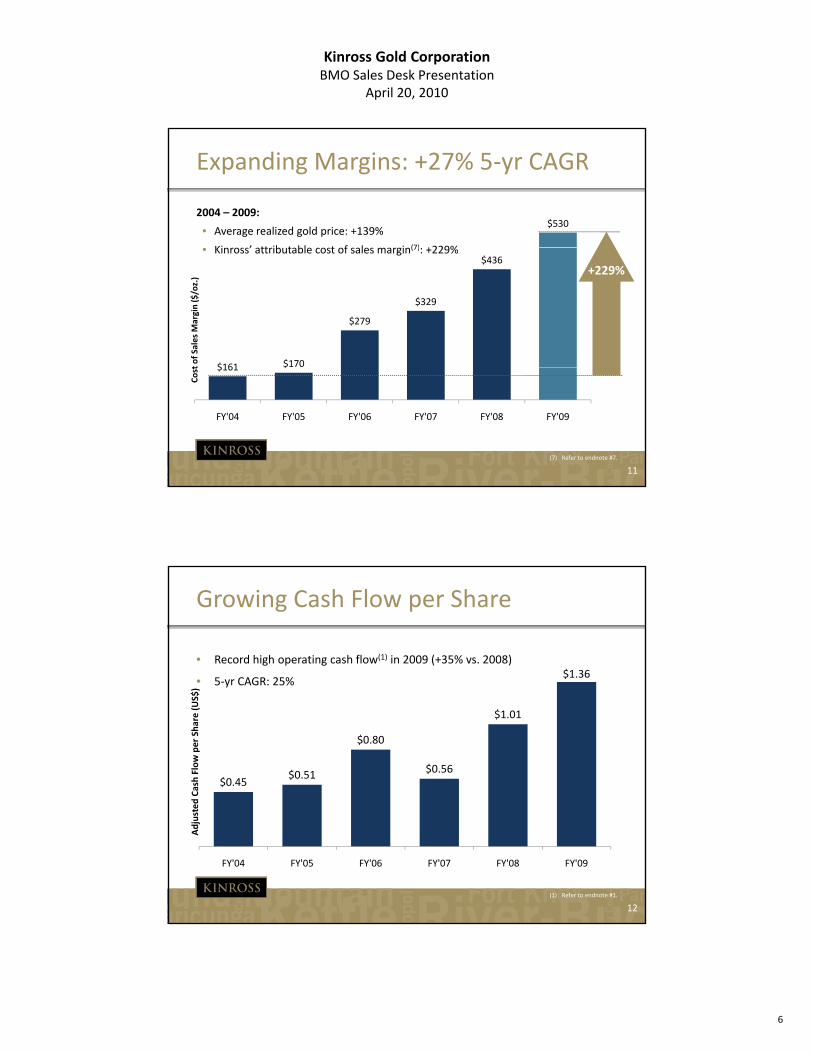
2010 Production Guidance
Country
Production
Cost of Number Estimated % of 2010eCountry
Sales / oz. of Mines Mine LifeOunces (000s)% of 2010e
total
Chile 460 – 480 21% $500 – 520 2 16+
Brazil 510 – 580 24% $490 – 555 2 30+
Russia(6) 495 – 525 23% $340 – 365 1 8+
10
USA 690 – 745 32% $480 – 520 3 7+
Total Kinross(4): 2.2 mm oz. $460 ‐ 490 8 20+
(4) Refer to endnote #4.(6) Refer to endnote #6.
Kinross Gold CorporationBMO Sales Desk Presentation
April 20, 2010
6
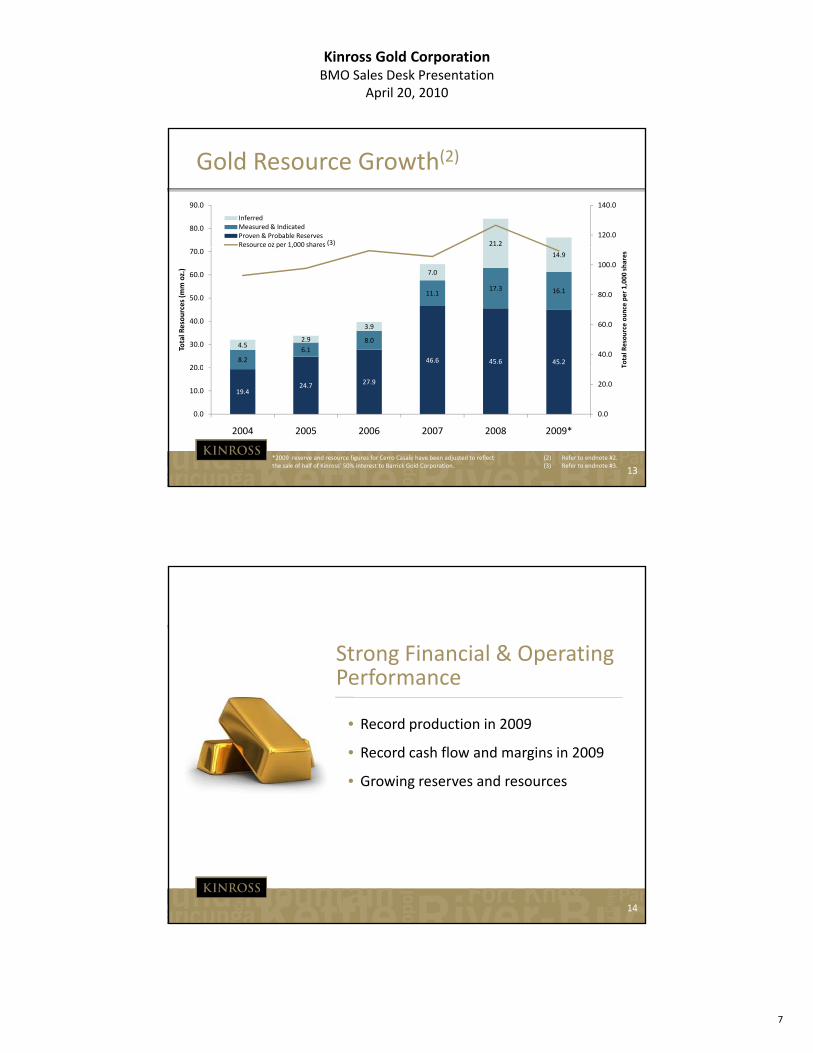
Expanding Margins: +27% 5‐yr CAGR
$5302004 – 2009:
• Average realized gold price: +139%
Ki ’ tt ib t bl t f l i (7) +229%
$161 $170
$279
$329
$436
t of Sales Margin ($/oz.)
• Kinross’ attributable cost of sales margin(7): +229%
+229%
11
$161 $
FY'04 FY'05 FY'06 FY'07 FY'08 FY'09
Cost
(7) Refer to endnote #7.
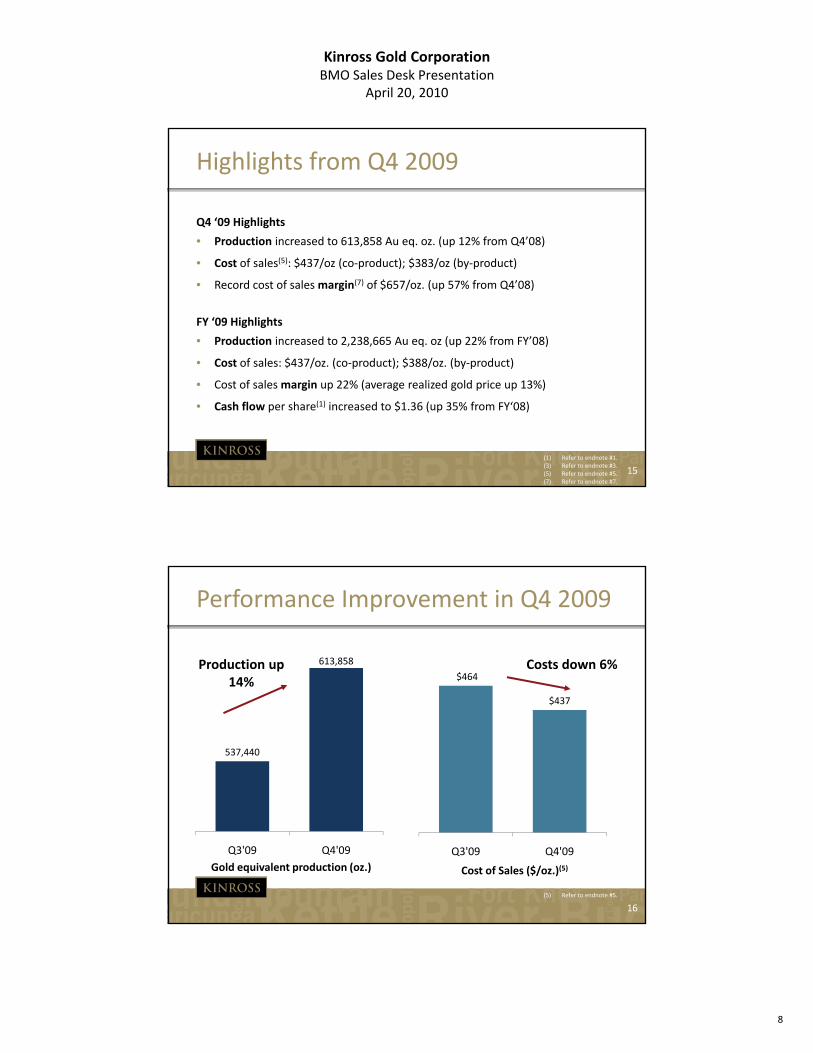
• Record high operating cash flow(1) in 2009 (+35% vs. 2008)
• 5‐yr CAGR: 25%
Growing Cash Flow per Share
$1.365 yr CAGR: 25%
$0.45$0.51
$0.80
$0.56
$1.01
ed Cash Flow per Share (US$)
12
FY'04 FY'05 FY'06 FY'07 FY'08 FY'09
Adjuste
(1) Refer to endnote #1.
Kinross Gold CorporationBMO Sales Desk Presentation
April 20, 2010
7
21.2120.0
140.0
80.0
90.0
InferredMeasured & IndicatedProven & Probable ReservesResource oz per 1,000 shares
Gold Resource Growth(2)
(3)
46.6 45.6 45.28.2
6.1
8.0
11.117.3 16.1
4.52.9
3.9
7.0
14.9
40.0
60.0
80.0
100.0
20 0
30.0
40.0
50.0
60.0
70.0
Total R
esource ounce per 1,000 shares
Total Resources (mm oz.)
p ,
13
19.424.7 27.9
0.0
20.0
0.0
10.0
20.0
2004 2005 2006 2007 2008 2009*
T
(2) Refer to endnote #2.(3) Refer to endnote #3.
*2009 reserve and resource figures for Cerro Casale have been adjusted to reflect the sale of half of Kinross’ 50% interest to Barrick Gold Corporation.
Strong Financial & Operating Performance
• Record production in 2009
• Record cash flow and margins in 2009
• Growing reserves and resources
14
Kinross Gold CorporationBMO Sales Desk Presentation
April 20, 2010
8
Highlights from Q4 2009
Q4 ‘09 Highlights
• Production increased to 613,858 Au eq. oz. (up 12% from Q4’08)
• Cost of sales(5): $437/oz (co‐product); $383/oz (by‐product)
• Record cost of sales margin(7) of $657/oz. (up 57% from Q4’08)
FY ‘09 Highlights
• Production increased to 2,238,665 Au eq. oz (up 22% from FY’08)
• Cost of sales: $437/oz. (co‐product); $388/oz. (by‐product)
15
$ / ( p ); $ / ( y p )
• Cost of sales margin up 22% (average realized gold price up 13%)
• Cash flow per share(1) increased to $1.36 (up 35% from FY‘08)
(1) Refer to endnote #1.(3) Refer to endnote #3.(5) Refer to endnote #5.(7) Refer to endnote #7.
Performance Improvement in Q4 2009
613,858Production up 14% $464
Costs down 6%
537,440
14%$437
16
Q3'09 Q4'09 Q3'09 Q4'09
Gold equivalent production (oz.) Cost of Sales ($/oz.)(5)
(5) Refer to endnote #5.
Kinross Gold CorporationBMO Sales Desk Presentation
April 20, 2010
9
COS Margin(6)
+9%$492/oz
(in millions, except ounces and per share amounts)
2008 2009 % ChangeRealized Gold Price
13%
COS Margin(7)
+22%
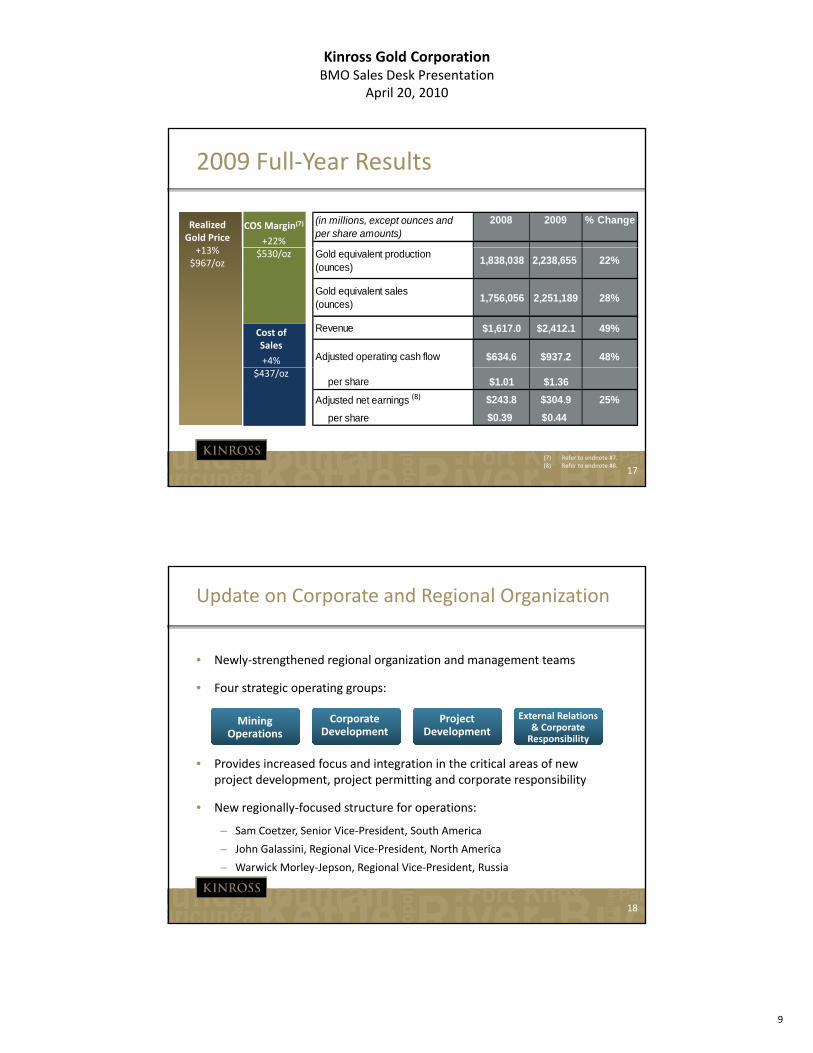
2009 Full‐Year Results
Gold equivalent production(ounces)
1,838,038 2,238,655 22%
Gold equivalent sales(ounces)
1,756,056 2,251,189 28%
Revenue $1,617.0 $2,412.1 49%
Adjusted operating cash flow $634.6 $937.2 48%
+13%$967/oz
Cost of Sales
+4%
$530/oz
17
per share $1.01 $1.36
Adjusted net earnings $243.8 $304.9 25%
per share $0.39 $0.44
$437/oz
(8)
(7) Refer to endnote #7.(8) Refer to endnote #8.
Update on Corporate and Regional Organization
• Newly‐strengthened regional organization and management teams
F t t i ti• Four strategic operating groups:
• Provides increased focus and integration in the critical areas of new project development, project permitting and corporate responsibility
N i ll f d t t f ti
Mining Operations
Corporate Development
Project Development
External Relations & Corporate Responsibility
18
• New regionally‐focused structure for operations:
– Sam Coetzer, Senior Vice‐President, South America
– John Galassini, Regional Vice‐President, North America
– Warwick Morley‐Jepson, Regional Vice‐President, Russia
Kinross Gold CorporationBMO Sales Desk Presentation
April 20, 2010
10
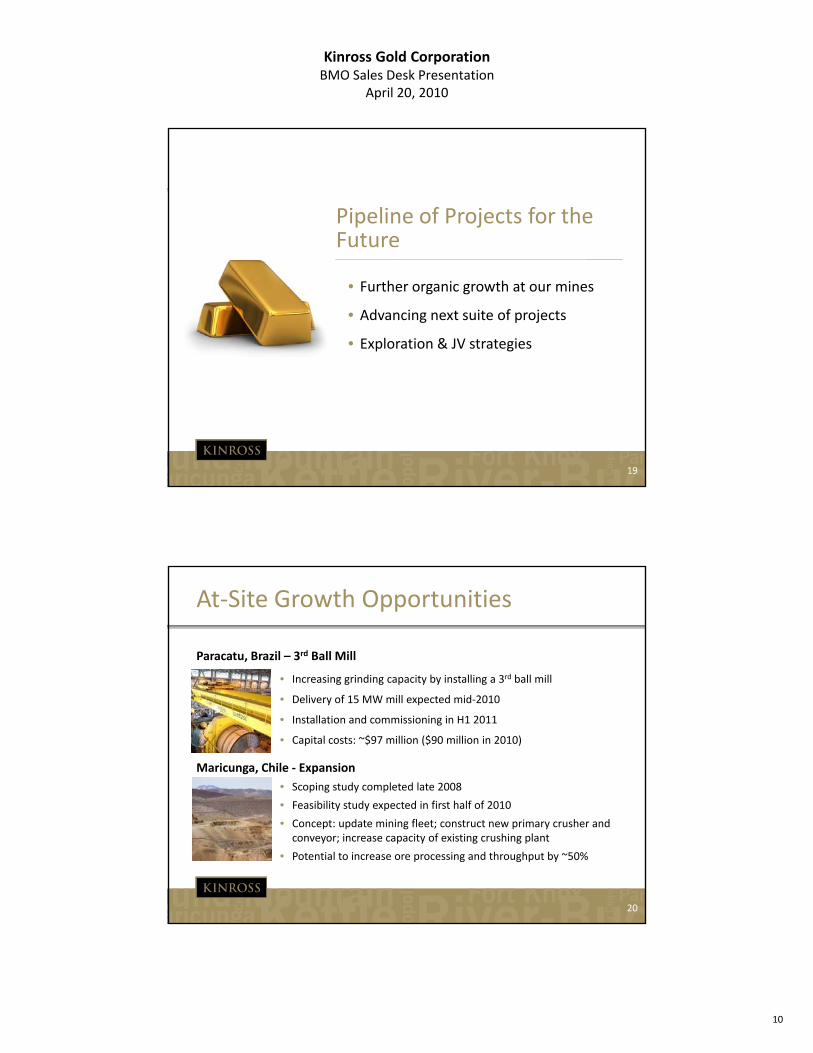
Pipeline of Projects for the Future
• Further organic growth at our mines
• Advancing next suite of projects
• Exploration & JV strategies
19
At‐Site Growth Opportunities
Paracatu, Brazil – 3rd Ball Mill
• Increasing grinding capacity by installing a 3rd ball mill
Maricunga, Chile ‐ Expansion
• Scoping study completed late 2008
• Feasibility study expected in first half of 2010
• Delivery of 15 MW mill expected mid‐2010
• Installation and commissioning in H1 2011
• Capital costs: ~$97 million ($90 million in 2010)
20
• Feasibility study expected in first half of 2010
• Concept: update mining fleet; construct new primary crusher and conveyor; increase capacity of existing crushing plant
• Potential to increase ore processing and throughput by ~50%
Kinross Gold CorporationBMO Sales Desk Presentation
April 20, 2010
11
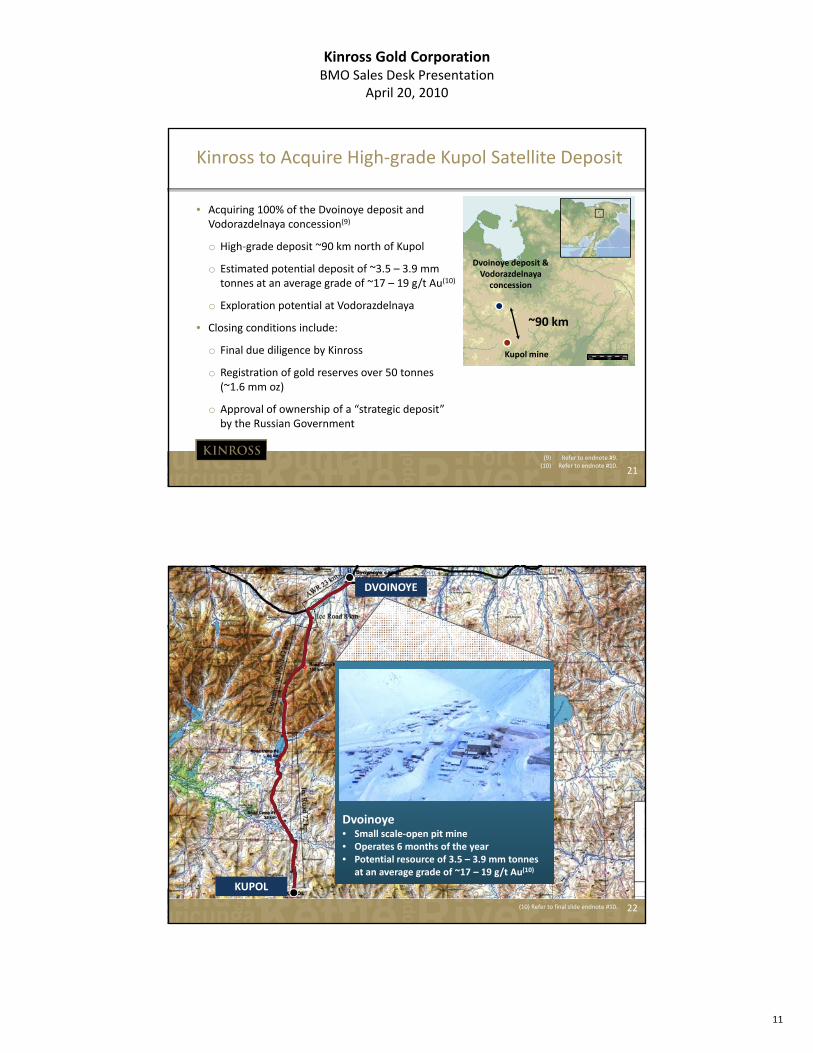
Kinross to Acquire High‐grade Kupol Satellite Deposit
• Acquiring 100% of the Dvoinoye deposit and Vodorazdelnaya concession(9)
o High‐grade deposit ~90 km north of Kupolo High grade deposit 90 km north of Kupol
o Estimated potential deposit of ~3.5 – 3.9 mm tonnes at an average grade of ~17 – 19 g/t Au(10)
o Exploration potential at Vodorazdelnaya
• Closing conditions include:
o Final due diligence by Kinross Kupol mine
Dvoinoye deposit & Vodorazdelnaya
concession
~90 km
21
o Registration of gold reserves over 50 tonnes (~1.6 mm oz)
o Approval of ownership of a “strategic deposit” by the Russian Government
(9) Refer to endnote #9.(10) Refer to endnote #10.
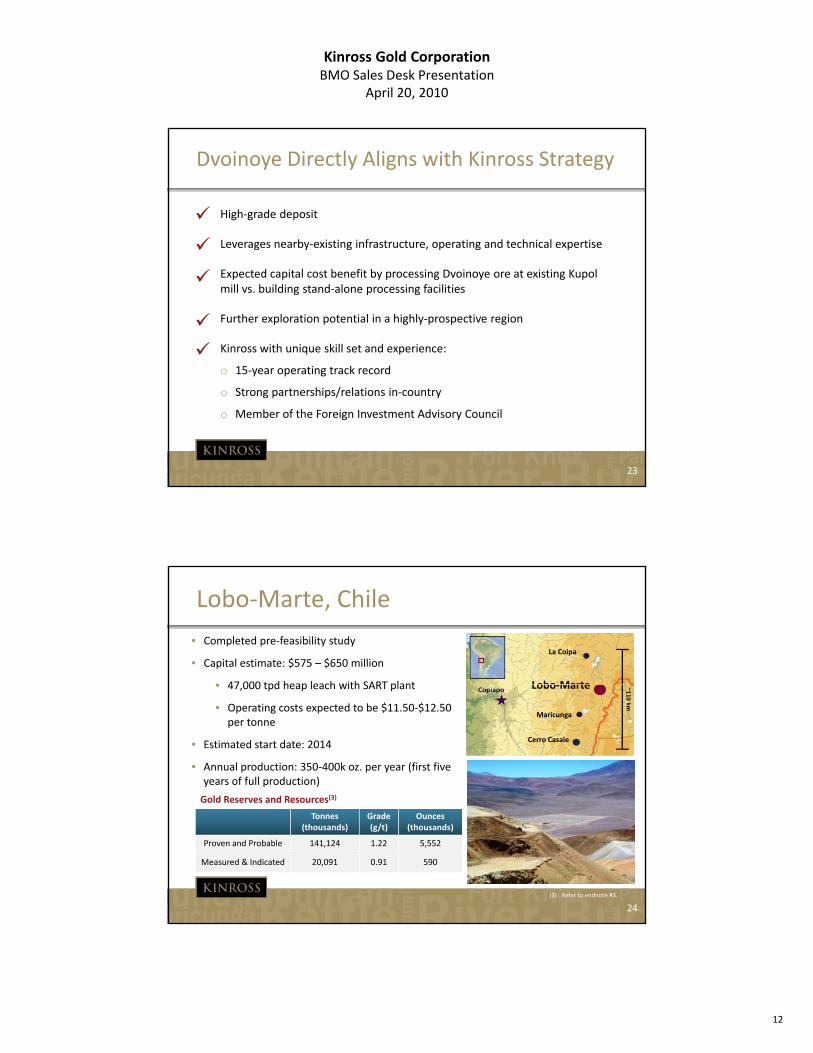
DVOINOYE
22(10) Refer to final slide endnote #10.
KUPOL
Dvoinoye• Small scale‐open pit mine• Operates 6 months of the year• Potential resource of 3.5 – 3.9 mm tonnes
at an average grade of ~17 – 19 g/t Au(10)
Dvoinoye• Small scale‐open pit mine• Operates 6 months of the year• Potential resource of 3.5 – 3.9 mm tonnes
at an average grade of ~17 – 19 g/t Au(10)
Kinross Gold CorporationBMO Sales Desk Presentation
April 20, 2010
12
Dvoinoye Directly Aligns with Kinross Strategy
High‐grade deposit
Leverages nearby‐existing infrastructure, operating and technical expertise
Leverages nearby existing infrastructure, operating and technical expertise
Expected capital cost benefit by processing Dvoinoye ore at existing Kupol mill vs. building stand‐alone processing facilities
Further exploration potential in a highly‐prospective region
Kinross with unique skill set and experience:
15 ti t k d
23
o 15‐year operating track record
o Strong partnerships/relations in‐country
o Member of the Foreign Investment Advisory Council
• Completed pre‐feasibility study
• Capital estimate: $575 – $650 million
• 47 000 tpd heap leach with SART plant
Lobo‐Marte, Chile
Lobo Marte
La Coipa
• 47,000 tpd heap leach with SART plant
• Operating costs expected to be $11.50‐$12.50 per tonne
• Estimated start date: 2014
• Annual production: 350‐400k oz. per year (first five years of full production)
Lobo‐Marte
Maricunga
Cerro Casale
~110 km
Gold Reserves and Resources(3)
24
Tonnes (thousands)
Grade (g/t)
Ounces(thousands)
Proven and Probable 141,124 1.22 5,552
Measured & Indicated 20,091 0.91 590
(3) Refer to endnote #3.
Kinross Gold CorporationBMO Sales Desk Presentation
April 20, 2010
13
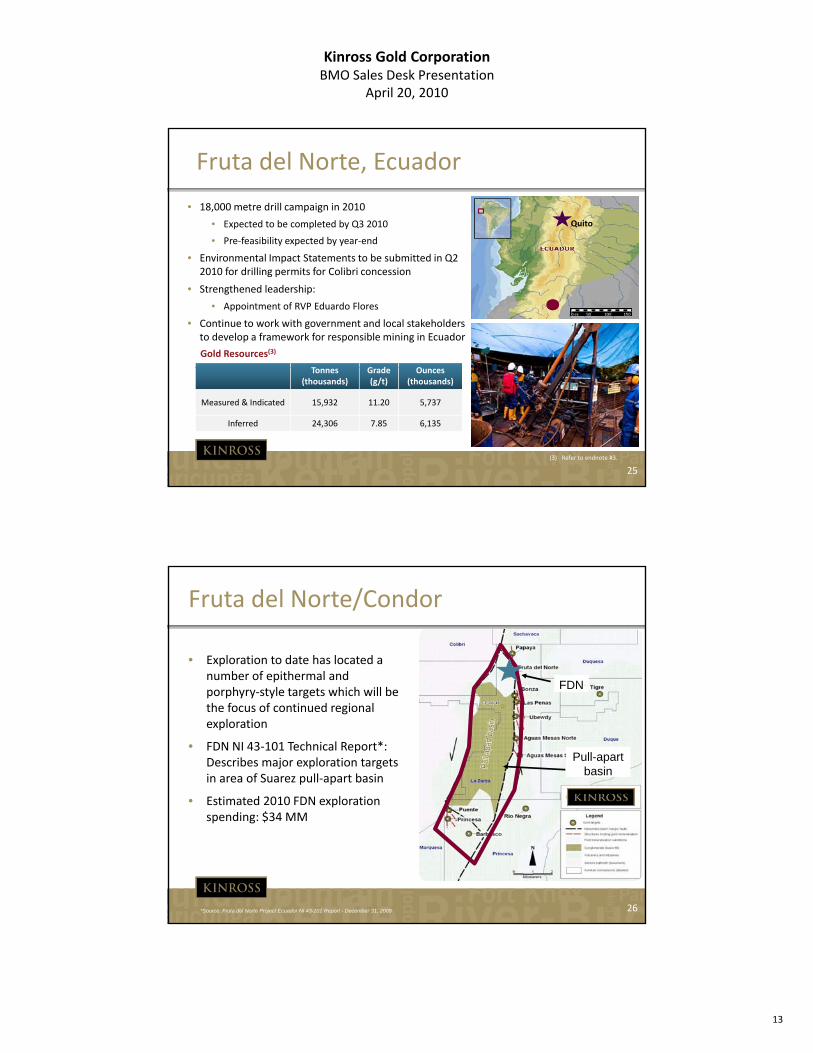
• 18,000 metre drill campaign in 2010
• Expected to be completed by Q3 2010
• Pre‐feasibility expected by year‐end
Fruta del Norte, Ecuador
Quito
• Environmental Impact Statements to be submitted in Q2 2010 for drilling permits for Colibri concession
• Strengthened leadership:
• Appointment of RVP Eduardo Flores
• Continue to work with government and local stakeholders to develop a framework for responsible mining in Ecuador
Gold Resources(3)
T G d O
25
Tonnes (thousands)
Grade (g/t)
Ounces(thousands)
Measured & Indicated 15,932 11.20 5,737
Inferred 24,306 7.85 6,135
(3) Refer to endnote #3.
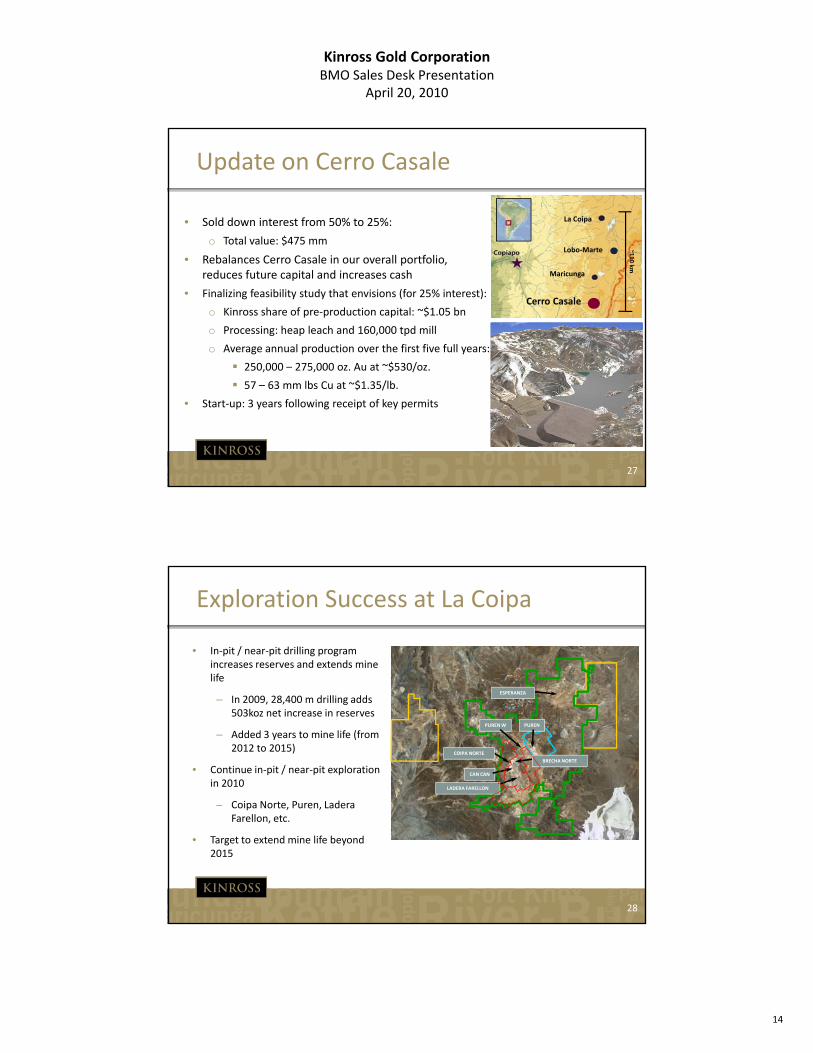
Fruta del Norte/Condor
• Exploration to date has located a number of epithermal and
FDNporphyry‐style targets which will be the focus of continued regional exploration
• FDN NI 43‐101 Technical Report*: Describes major exploration targets in area of Suarez pull‐apart basin
• Estimated 2010 FDN exploration
FDN
Pull-apartbasin
26
Estimated 2010 FDN exploration spending: $34 MM
*Source: Fruta del Norte Project Ecuador NI 43-101 Report - December 31, 2009
Kinross Gold CorporationBMO Sales Desk Presentation
April 20, 2010
14
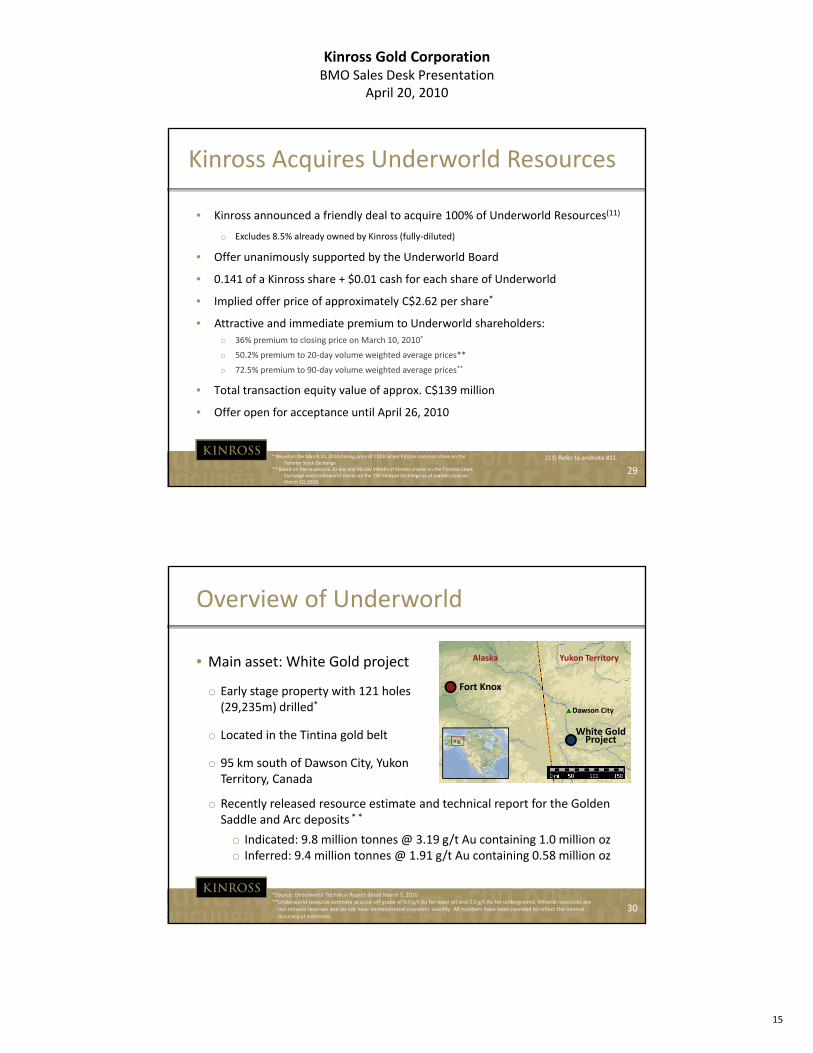
Update on Cerro Casale
• Sold down interest from 50% to 25%:
o Total value: $475 mmL b M t
La Coipa
• Rebalances Cerro Casale in our overall portfolio, reduces future capital and increases cash
Lobo‐Marte
Maricunga
Cerro Casale
~110 km
• Finalizing feasibility study that envisions (for 25% interest):
o Kinross share of pre‐production capital: ~$1.05 bn
o Processing: heap leach and 160,000 tpd mill
o Average annual production over the first five full years:
250 000 – 275 000 oz Au at ~$530/oz
27
250,000 – 275,000 oz. Au at $530/oz.
57 – 63 mm lbs Cu at ~$1.35/lb.
• Start‐up: 3 years following receipt of key permits
Exploration Success at La Coipa
• In‐pit / near‐pit drilling program increases reserves and extends mine life
– In 2009, 28,400 m drilling adds 503koz net increase in reserves
– Added 3 years to mine life (from 2012 to 2015)
• Continue in‐pit / near‐pit exploration in 2010
Coipa Norte Puren Ladera
PUREN
CAN CAN
ESPERANZA
PUREN W
COIPA NORTE
LADERA FARELLON
BRECHA NORTE
28
– Coipa Norte, Puren, LaderaFarellon, etc.
• Target to extend mine life beyond 2015
Kinross Gold CorporationBMO Sales Desk Presentation
April 20, 2010
15
Kinross Acquires Underworld Resources
• Kinross announced a friendly deal to acquire 100% of Underworld Resources(11)
o Excludes 8.5% already owned by Kinross (fully‐diluted)
• Offer unanimously supported by the Underworld Board
• 0.141 of a Kinross share + $0.01 cash for each share of Underworld
• Implied offer price of approximately C$2.62 per share*
• Attractive and immediate premium to Underworld shareholders:o 36% premium to closing price on March 10, 2010*
o 50.2% premium to 20‐day volume weighted average prices**
72 5% i t 90 d l i ht d i **
29
o 72.5% premium to 90‐day volume weighted average prices**
• Total transaction equity value of approx. C$139 million
• Offer open for acceptance until April 26, 2010
* Based on the March 10, 2010 closing price of C$18.54per Kinross common share on the Toronto Stock Exchange
** Based on the respective 20‐day and 90‐day VWAPs of Kinross shares on the Toronto Stock Exchange and Underworld shares on the TSX Venture Exchange as of market close on March 10, 2010
(11) Refer to endnote #11.
Overview of Underworld
• Main asset: White Gold project Alaska Yukon Territory
Fort Knoxo Early stage property with 121 holes (29,235m) drilled*
o Located in the Tintina gold belt
o 95 km south of Dawson City, Yukon Territory, Canada
o Recently released resource estimate and technical report for the Golden
Fort Knox
White Gold Project
Dawson City
30
o Recently released resource estimate and technical report for the Golden Saddle and Arc deposits * *
o Indicated: 9.8 million tonnes @ 3.19 g/t Au containing 1.0 million ozo Inferred: 9.4 million tonnes @ 1.91 g/t Au containing 0.58 million oz
*Source: Underworld Technical Report dated March 3, 2010**Underworld resource estimate at a cut‐off grade of 0.5 g/t Au for open pit and 2.0 g/t Au for underground. Mineral resources are not mineral reserves and do not have demonstrated economic viability. All numbers have been rounded to reflect the relative accuracy of estimates.
Kinross Gold CorporationBMO Sales Desk Presentation
April 20, 2010
16
Valuation
31
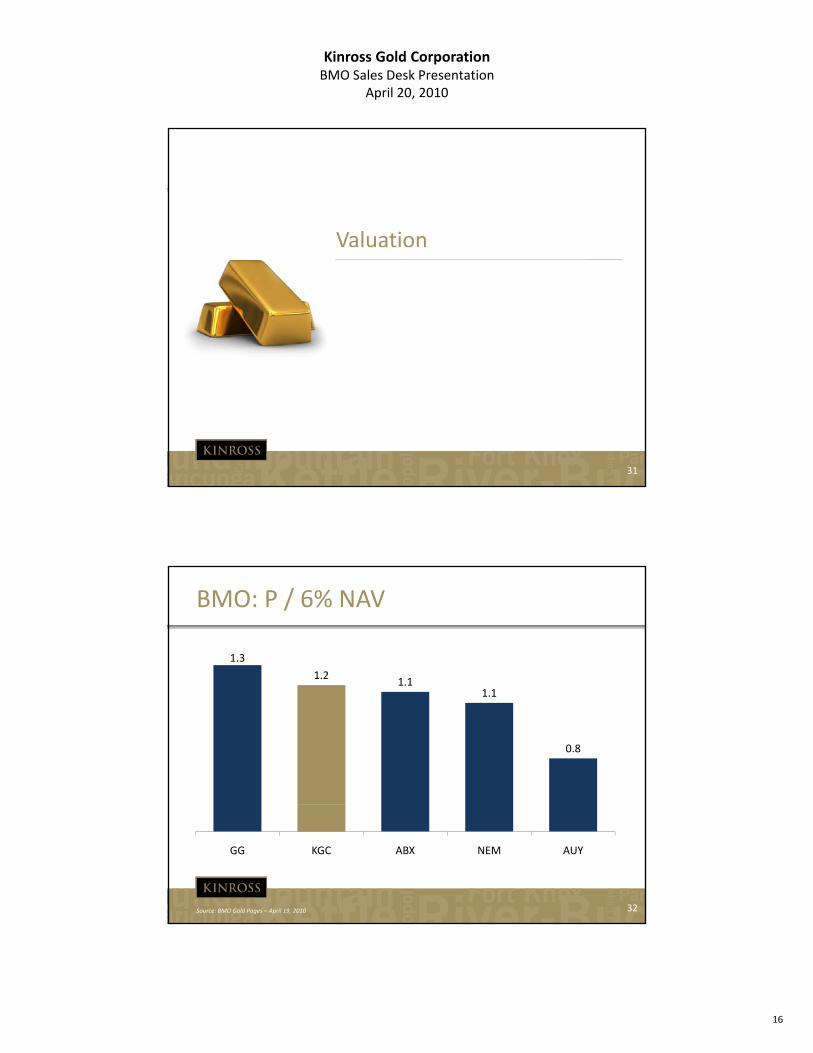
BMO: P / 6% NAV
1.3
1.21.11.1
1.1
0.8
32
GG KGC ABX NEM AUY
Source: BMO Gold Pages – April 19, 2010
Kinross Gold CorporationBMO Sales Desk Presentation
April 20, 2010
17
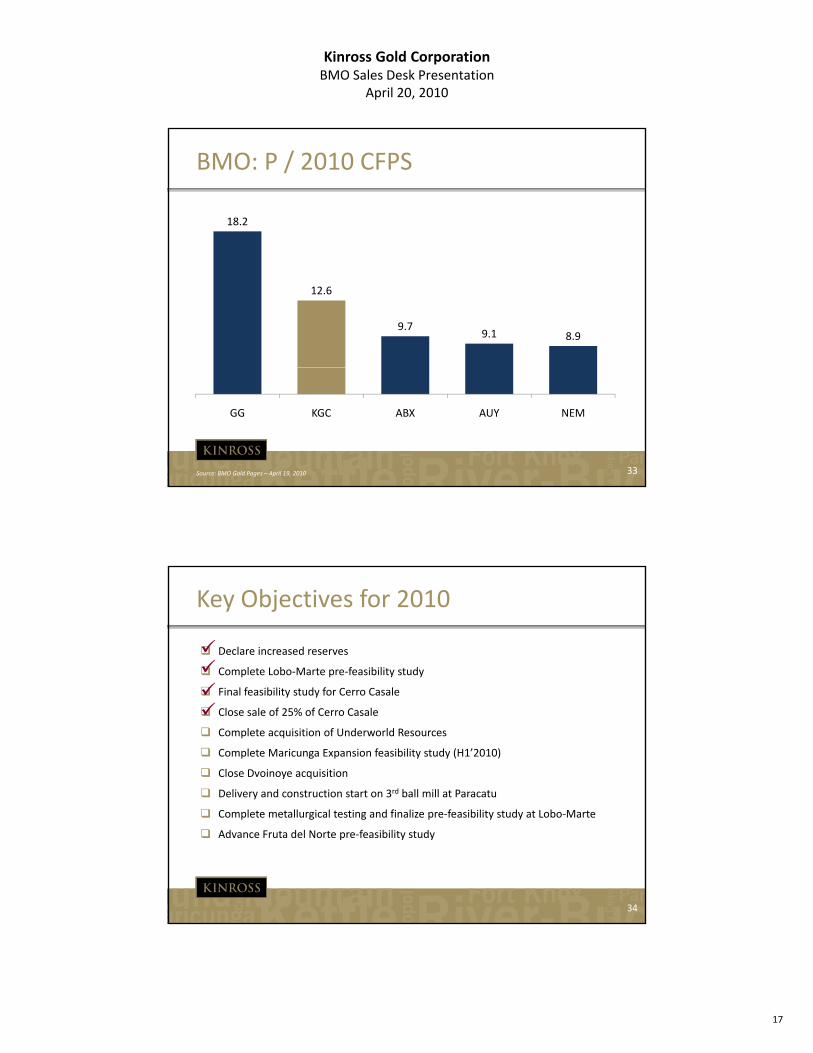
BMO: P / 2010 CFPS
18.2
12.6
9.79.1 8.9
33
GG KGC ABX AUY NEM
Source: BMO Gold Pages – April 19, 2010
Key Objectives for 2010
Declare increased reserves
Complete Lobo‐Marte pre‐feasibility study
Final feasibility study for Cerro Casale
Close sale of 25% of Cerro Casale
Complete acquisition of Underworld Resources
Complete Maricunga Expansion feasibility study (H1’2010)
Close Dvoinoye acquisition
Delivery and construction start on 3rd ball mill at Paracatu
34
Complete metallurgical testing and finalize pre‐feasibility study at Lobo‐Marte
Advance Fruta del Norte pre‐feasibility study
Kinross Gold CorporationBMO Sales Desk Presentation
April 20, 2010
18
35
Endnotes(1) Unless otherwise stated, all cash flow and cash flow per share figures in this presentation are adjusted operating cash flow. Adjusted operating cash flow figures are non‐GAAP
financial measures which are meant to provide additional information and should not be used as a substitute for performance measures prepared in accordance with GAAP. For more information about these non‐GAAP financial measures, and a reconciliation of these non‐GAAP financial measures for the three and twelve months ended December 31, 2009 and December 31, 2008, please refer to the press release dated February 17, 2010, available on our website at www.kinross.com under the heading “Reconciliation of non‐GAAP financial measures”. Comparative figures for the periods 2004 to 2008 represent cash flow from operating activities adjusted for changes in working capital only. Prior to the three and six months ended December 31, 2009, the Company did not prepare a reconciliation of adjusted operating cash flow, and readers should refer to the Company’s financial statements and Management’s Discussion and Analysis for the applicable periods for additional financial information prepared in accordance with GAAP.
(2) Total ounce per 1,000 shares represent the sum of Proven and Probable Mineral Reserves, plus Measured and Indicated Mineral Resources plus Inferred Mineral Resources pro‐forma as at December 31 of the given year, divided by the shares outstanding as at December 31, 2009. Proven and Probable Mineral Reserves, Measured and Indicated Mineral Resources and Inferred Mineral Resources are separate categories under NI 43‐101.
(3) Please refer to Kinross’ Mineral Reserve and Resource Statement at December 31, 2009, contained in our press released dated January 28, 2010, which is available on our website at www.kinross.com. For historical reserve and resource information, refer to Kinross’ public filings, available on our website. Reserve and resource figures for Cerro Casale have been adjusted to reflect the sale of half of Kinross’ 50% interest to Barrick Gold Corporation.
(4) For more information regarding Kinross’ production and cost outlook for 2010, please refer to the press release dated January 14, 2010, available on our website at www.kinross.com.
(5) Cost of sales per ounce is defined as cost of sales as per the financial statements divided by the number of gold equivalent ounces sold, both reduced for Kupol sales attributable to a third‐party 25% shareholder.
(6) Unless otherwise stated, production and cost of sales figures in this presentation are based on Kinross’ share of Kupol production (75%).
(7) Cost of sales margin is defined as the average realized gold price less attributable cost of sales per ounce.
(8) Adjusted net earnings is a non‐GAAP financial measures which are meant to provide additional information and should not be used as a substitute for performance measures prepared in accordance with GAAP. For more information about these non‐GAAP financial measures, and a reconciliation of these non‐GAAP financial measures for the three and twelve months ended December 31, 2009, please refer to the press release dated February 17, 2010, available on our website at www.kinross.com under the heading “Reconciliation of non‐GAAP financial measures”. The Company did not prepare a reconciliation of these non‐GAAP financial measures for periods prior to the three and six months ended June 30 2009 and readers should refer to the Company’s financial statements and Management’s Discussion and Analysis for the applicable periods for
36
months ended June 30, 2009 and readers should refer to the Company s financial statements and Management s Discussion and Analysis for the applicable periods for additional financial information prepared in accordance with GAAP.
(9) For full transaction details, please refer to the news release dated January 20, 2010, available on our website at www.kinross.com
(10) Estimate is based on Northern Gold’s drill results, recently submitted Russian reserve estimates and other information reviewed by Kinross. Under NI 43‐101, the potential tonnage and grade is conceptual in nature, there has been insufficient exploration to define a mineral resource, and it is uncertain if further exploration will result in the targeted deposit being delineated as a mineral resource.
(11) Please refer to the news releases dated March 11 and March 16, 2010 for details on Kinross’ offer for Underworld Resources, and the bid circular dated March 19, 2010, all of which are available on our website at www.kinross.com.
Kinross Gold CorporationBMO Sales Desk Presentation
April 20, 2010
19
Cautionary Note to Shareholders in the U.S.
Information in this presentation, including the documents incorporated by reference herein, has been prepared in accordance with the requirements of securities laws in effect in Canada, which differ from the requirements of United States securities laws. Without limiting the foregoing, this presentation, including the documents incorporated by reference herein, uses terms such as “measured mineral resource”, “indicated mineral resources” and “inferred mineral resources”. United States investors are advised that, while such terms are recognized and required by Canadian securities law, the U.S. Securities and Exchange Commission (“SEC”) does not recognize them. Under United States standards, mineralization may not be classified as a “reserve” unless the determination has been made that the mineralization could be economically and legally produced or extracted at the time the reserve determination is made United States investors are cautioned not to assume that all or any part of measured or indicated mineral resources will ever be converted intomade. United States investors are cautioned not to assume that all or any part of measured or indicated mineral resources will ever be converted into reserves. Further, “inferred mineral resources” have a great amount of uncertainty to their existence and as to whether they can be mined legally or economically. It cannot be assumed that all or any part of “inferred mineral resources” will ever be upgraded to a higher category. Therefore, United States investors are also cautioned not to assume that all or any part of the inferred resources exist, or that they can be mined legally or economically. Disclosure of “contained ounces” is permitted disclosure under Canadian regulations, however, the SEC normally only permits issuers to report “resources” as in place tonnage and grade without reference to unit measures. Accordingly, information concerning descriptions of mineralization and resources contained in this presentation or in the documents incorporated by reference, may not be comparable to information made public by United States companies subject to the reporting and disclosure requirements of the SEC.
National Instrument 43‐101 – Standards of Disclosure for Mineral Project (“NI 43‐101”) is a rule developed by the Canadian Securities Administrators which establishes standards for all public disclosure an issuer makes of scientific and technical information concerning mineral projects. Unless otherwise indicated, all mineral reserve and mineral resource estimates contained in or incorporated by reference in this presentation have been prepared in accordance with NI 43‐101 and the Canadian Institute of Mining, Metallurgy and Petroleum Classification System. These standards differ significantly from the requirements of the SEC, and mineral reserve and mineral resource information contained herein and incorporated by reference herein may not be comparable to similar information disclosed by United States companies.
Other Information
37
This presentation does not constitute an offer to buy or an invitation to sell, or the solicitation of an offer to buy or an invitation to sell, any of the securities of Kinross or Underworld. Such an offer may only be made pursuant to an offer and take‐over bid circular filed with the securities regulatory authorities in Canada. Kinross has filed an offer and take‐over bid circular with Canadian provincial securities regulators. Kinross has also filed with the SEC a registration statement on Form F‐8, which includes the offer and take‐over bid circular. Investors and security holders are urged to read the offer and take‐over bid circular regarding the proposed transaction referred to in these documents, because they contain important information. Investors may obtain a free copy of the offer and take‐over bid circular and other documents filed by Kinross with the Canadian provincial securities regulators on SEDAR at www.sedar.com, and with the SEC at www.sec.gov. The offer and take‐over bid circular and these other documents may also be obtained for free on Kinross’ website.
Appendixpp
38
Kinross Gold CorporationBMO Sales Desk Presentation
April 20, 2010
20
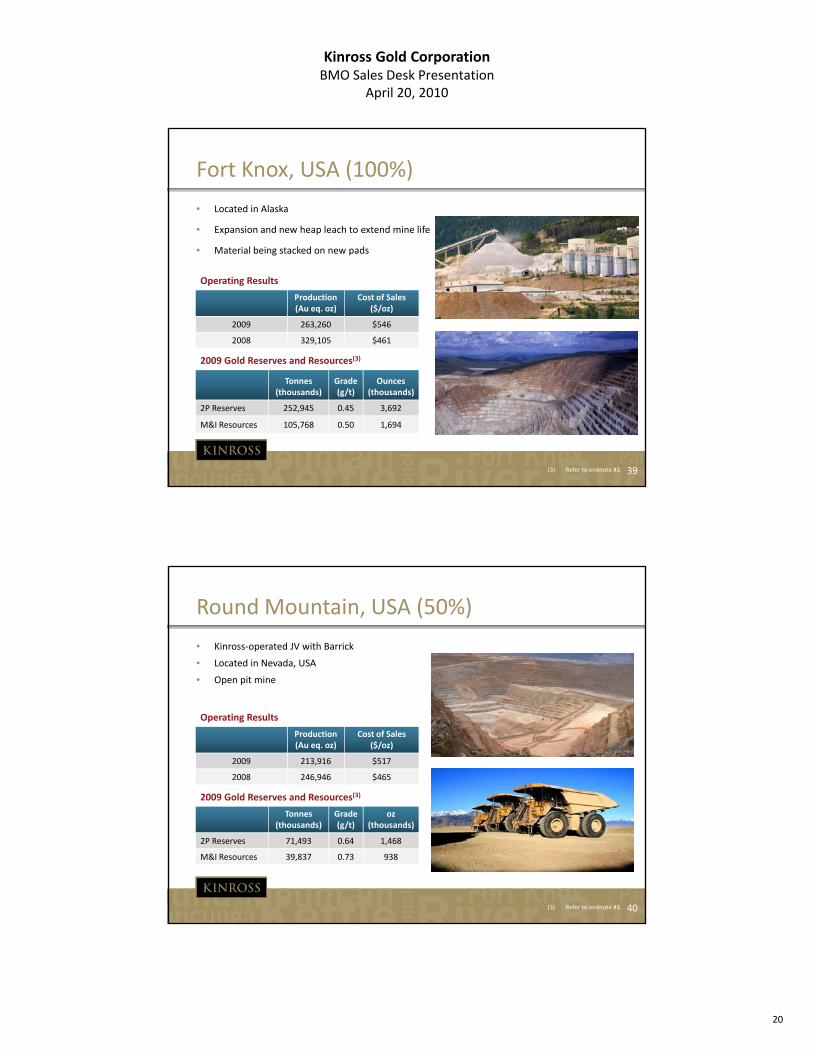
Fort Knox, USA (100%)
• Located in Alaska
• Expansion and new heap leach to extend mine life
M t i l b i t k d d• Material being stacked on new pads
Operating Results
Production (Au eq. oz)
Cost of Sales($/oz)
2009 263,260 $546
2008 329,105 $461
2009 Gold Reserves and Resources(3)
39
Tonnes(thousands)
Grade (g/t)
Ounces(thousands)
2P Reserves 252,945 0.45 3,692
M&I Resources 105,768 0.50 1,694
(3) Refer to endnote #3.
Round Mountain, USA (50%)
• Kinross‐operated JV with Barrick
• Located in Nevada, USA
• Open pit mine
Operating Results
Production (Au eq. oz)
Cost of Sales($/oz)
2009 213,916 $517
2008 246,946 $465
2009 Gold Reserves and Resources(3)
40
Tonnes(thousands)
Grade (g/t)
oz (thousands)
2P Reserves 71,493 0.64 1,468
M&I Resources 39,837 0.73 938
(3) Refer to endnote #3.
Kinross Gold CorporationBMO Sales Desk Presentation
April 20, 2010
21
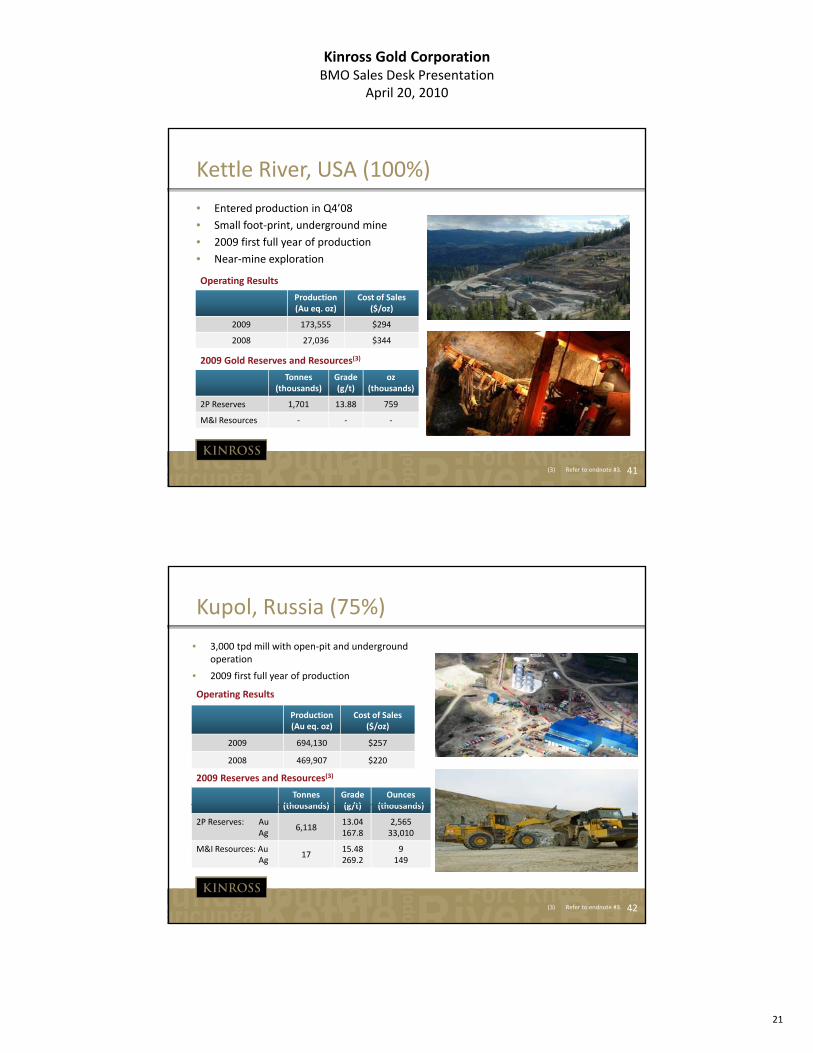
Kettle River, USA (100%)
• Entered production in Q4’08
• Small foot‐print, underground mine
• 2009 first full year of productiony p
• Near‐mine exploration
Operating Results
Production (Au eq. oz)
Cost of Sales($/oz)
2009 173,555 $294
2008 27,036 $344
2009 Gold Reserves and Resources(3)
41
Tonnes(thousands)
Grade (g/t)
oz (thousands)
2P Reserves 1,701 13.88 759
M&I Resources ‐ ‐ ‐
(3) Refer to endnote #3.
Kupol, Russia (75%)
• 3,000 tpd mill with open‐pit and underground operation
• 2009 first full year of production
Operating Results
Production (Au eq. oz)
Cost of Sales($/oz)
2009 694,130 $257
2008 469,907 $220
2009 Reserves and Resources(3)
Tonnes(thousands)
Grade (g/t)
Ounces(thousands)
42
(thousands) (g/t) (thousands)
2P Reserves: AuAg
6,11813.04167.8
2,56533,010
M&I Resources: AuAg
1715.48269.2
9149
(3) Refer to endnote #3.
Kinross Gold CorporationBMO Sales Desk Presentation
April 20, 2010
22
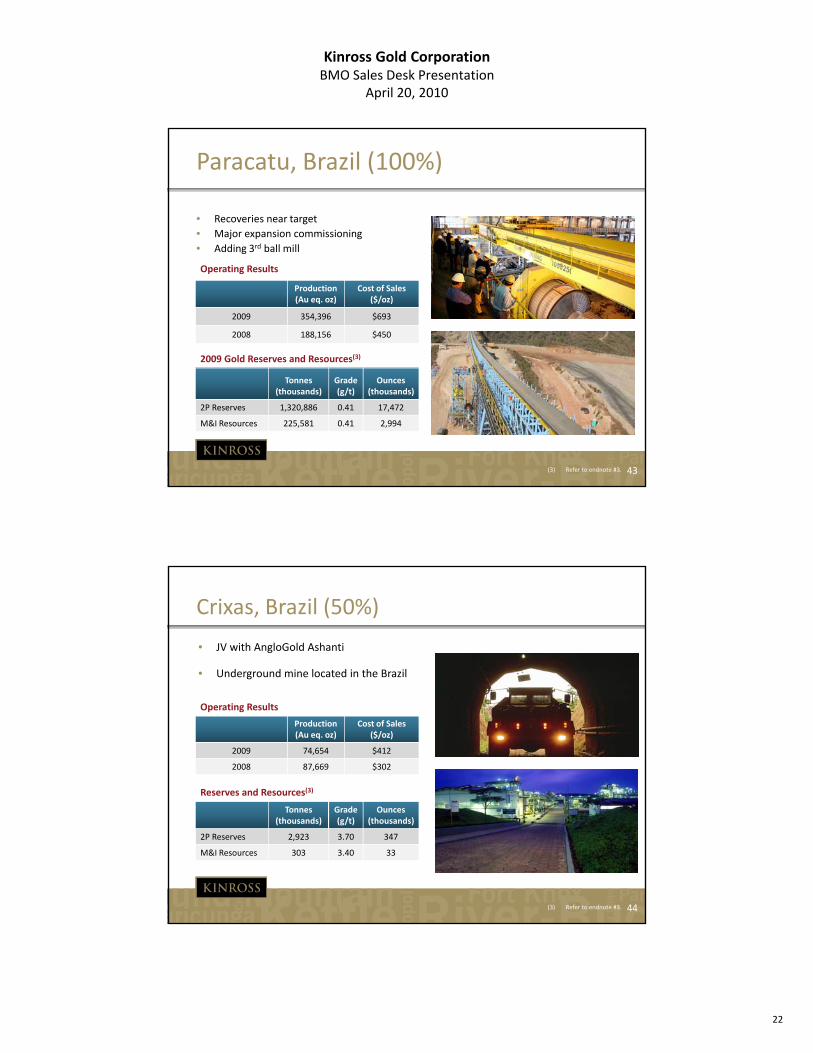
Paracatu, Brazil (100%)
• Recoveries near target
• Major expansion commissioning
• Adding 3rd ball mill
Operating Results
Production (Au eq. oz)
Cost of Sales($/oz)
2009 354,396 $693
2008 188,156 $450
2009 Gold Reserves and Resources(3)
• Adding 3rd ball mill
43
Tonnes(thousands)
Grade (g/t)
Ounces (thousands)
2P Reserves 1,320,886 0.41 17,472
M&I Resources 225,581 0.41 2,994
(3) Refer to endnote #3.
Crixas, Brazil (50%)
• JV with AngloGold Ashanti
• Underground mine located in the Brazil
Operating Results
Production (Au eq. oz)
Cost of Sales($/oz)
2009 74,654 $412
2008 87,669 $302
Reserves and Resources(3)
44
Tonnes(thousands)
Grade (g/t)
Ounces (thousands)
2P Reserves 2,923 3.70 347
M&I Resources 303 3.40 33
(3) Refer to endnote #3.
Kinross Gold CorporationBMO Sales Desk Presentation
April 20, 2010
23
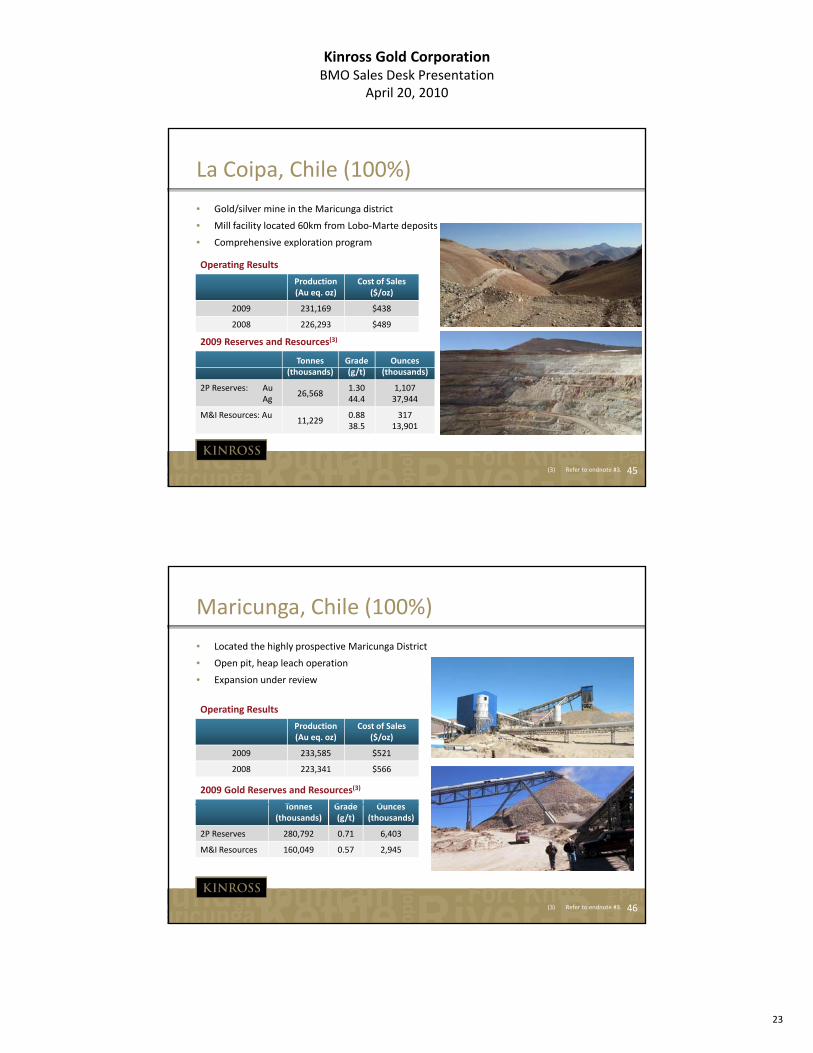
La Coipa, Chile (100%)
• Gold/silver mine in the Maricunga district
• Mill facility located 60km from Lobo‐Marte deposits
• Comprehensive exploration program
Operating Results
Production (Au eq. oz)
Cost of Sales($/oz)
2009 231,169 $438
2008 226,293 $489
2009 Reserves and Resources(3)
Tonnes Grade Ounces
45
(thousands) (g/t) (thousands)
2P Reserves: AuAg
26,5681.3044.4
1,10737,944
M&I Resources: Au11,229
0.8838.5
31713,901
(3) Refer to endnote #3.
Maricunga, Chile (100%)
• Located the highly prospective Maricunga District
• Open pit, heap leach operation
• Expansion under review
Operating Results
Production (Au eq. oz)
Cost of Sales($/oz)
2009 233,585 $521
2008 223,341 $566
2009 Gold Reserves and Resources(3)
T G d O
46
Tonnes(thousands)
Grade (g/t)
Ounces(thousands)
2P Reserves 280,792 0.71 6,403
M&I Resources 160,049 0.57 2,945
(3) Refer to endnote #3.
Kinross Gold CorporationBMO Sales Desk Presentation
April 20, 2010
24
47