DELIVERING CONSOLIDATED GROWTH THROUGH 2021 …
32
DELIVERING GROWTH THROUGH TRUSTED BRANDS CONSOLIDATED HALF-YEAR REPORT 2021
Transcript of DELIVERING CONSOLIDATED GROWTH THROUGH 2021 …
DELIVERING GROWTH THROUGH TRUSTED BRANDS
CONSOLIDATED HALF-YEAR REPORT
2021

TABLE OF CONTENTS
OUR MANAGEMENT REViEW03 Performance at a glance04 Message from the Chairman05 Message from the CEO06 Highlights08 Sustainability09 Essential business priorities
OUR PERFORMANCE REViEW11 Market overview12 Performance review16 Financial outlook
OUR CONDENSED iNTERiM CONSOLiDATED FiNANCiAL STATEMENTS18 Primary statements22 Notes30 Glossary31 Corporate calendar
CREATE THE FUTURE OF DAiRY TO BRiNG HEALTH AND iNSPiRATiON TO THE WORLD, NATURALLY.
ViSiON

HALF-YEAR 2021 PERFORMANCE AT A GLANCE
2021 target: >50% 2021 target: >23.5%
Revenue
5.4(billion EUR)
2021 target: EUR 10.3-10.6 billion
5.4
5.4
5.2
HY 2021
HY 2020
HY 2019
Profit share 2)
3.0%(of revenue)
2021 target: 2.8-3.2%
3.0%
3.0%
2.3%
HY 2021
HY 2020
HY 2019
Performance price 1)
38.6(EUR-cent/kg)
38.6
37.0
36.1
HY 2021
HY 2020
HY 2019
Milk volume
7.0(billion kg)
7.0
7.0
7.0
HY 2021
HY 2020
HY 2019
29(million EUR)
Accumulated savings at HY 2021: 383 Accumulated savings at HY 2021: 562
2021 target: 1-3%
Strategic branded volume driven revenue growth
5.6%
International share 3)
24.5%
Calcium savings excluding estimated inflation
82(million EUR)
Brand share
49.2%5.6% 49.2% 24.5% 82
10.4% 48.3% 24.2% 143
4.6% 45.7% 21.0% 142
195
HY 2021 HY 2021 HY 2021 HY 2021
HY 2020 HY 2020 HY 2020 2020
HY 2019 HY 2019 HY 2019 2019
2018
1) The milk conversion factor from litre into kg was 1.02 for milk volumes until 30 June, 2021. Effective from 1 July 2021, the milk conversion factor is 1.03. 2) Based on profit allocated to owners of Arla Foods amba. 3) International share is based on retail and foodservice revenue, excluding revenue from third-party manufacturing, Arla Foods Ingredients and trading activities.
29
130
110
114
HY 2021
2020
2019
2018
Leverage
2.8
2021 target: 2.8-3.4
2.8
2.6
3.0
HY 2021
HY 2020
HY 2019
3 ARLA FOODS HALF-YEAR REPORT 2021
Our Management Review Our Performance Review Our Condensed Interim Consolidated Financial Statements

HiGH ENGAGEMENT TO DEVELOP OUR COOPERATiVE
Sound half-year results but increasing uncertainty aheadWe close another turbulent half year with good results and a satisfactory performance price to our farmer owners despite the Covid-19 pandemic stretching longer into 2021 than expected. As the economy picks up ahead of us lies a challenging second half of the year. Inflation is increasing around the world, pushing dairy production costs up both for farmers and Arla as a company.
Positive milk price developmentWe entered 2021 in a strong position, and now we close the half year on a positive note, as our retail business, supported by our strong brand portfolio, is flourishing. Thanks to the strong commitment from Arla’s farmer owners and employees all over
dialogue and our right to voice our opinions, ask questions and bring ideas forward. Through the initiative Coop 2.0 we aim to strengthen this aspect further as we engage in dialogue about what the future of dairy looks like, how our business and cooperative can support each other in responding to the challenges lying ahead, and how to improve our democratic processes and member engagement. As Chairman of the Board of Directors I am both happy and grateful that Arla members are eager to involve themselves in this important process of developing our cooperative for the future, and it is positive to see that there is a high level of alignment across countries on what topics to focus on.
With this in mind I am very much looking forward to getting our meeting structure back to normal as our member countries begin to reopen. Hopefully it will be possible to conduct physical meetings at all levels in a safe way as the year progresses. These meetings are key to our democracy and will be resumed as soon as possible.
Jan Toft Nørgaard Chairman of the Board of Directors
Among the world’s most climate-efficient dairy farmersData from approximately 8,000 Climate Checks across Arla farms in 2020 have now been validated and analysed, documenting that Arla farmers are among the most climate-efficient dairy farmers in the world. Thanks to the considerable effort we as farmer owners have put into the Climate Check programme we have a strong tool to guide our next steps on our sustainability journey, measure our progress and showcase the great work being done at the farms. Politicians and consumers have responded positively to the first results and our transparency. We now need to continue on our journey to become even more climate-efficient.
Developing our cooperative for the futureA strong cooperative thrives on open and honest
THANkS TO THE CONSiDERABLE EFFORT WE AS FARMER OWNERS PUT iNTO THE CLiMATE CHECk PROGRAMME WE HAVE A STRONG TOOL TO GUiDE OUR NExT STEPS ON OUR SUSTAiNABiLiTY jOURNEY
the world, we continue to adapt to the ongoing challenges presented by the pandemic as markets and consumers adjust their behaviour.
Month by month we saw the pre-paid milk price increase in the first half of 2021, following increased commodity prices and a solid performance across the business, and we close the half year with a competitive performance price of 38.6 EUR-cent/kg of milk. This is a welcome but also necessary development as dairy farmers all over Europe are facing increasing production costs. The high inflationary pressure results in rising prices of feed, energy and wages, putting extra strain on farmers who are already pressured by the growing requirements from politicians and consumers.
Performance price 1)
38.6(EUR-cent/kg)
38.6
37.0
36.1
HY 2021
HY 2020
HY 2019
1) The milk conversion factor from litre into kg was 1.02 for milk volumes until 30 June, 2021. Effective from 1 July 2021, the milk conversion factor is 1.03.4 ARLA FOODS HALF-YEAR REPORT 2021
Our Management Review Our Performance Review Our Condensed Interim Consolidated Financial Statements

OUR MOMENTUM CONTiNUED THROUGH ExCELLENT ExECUTiON
As the impact of the Covid-19 pandemic persisted in the first half of 2021, we continued to manage our business effectively in this volatile environment and deliver a financial performance at the top end of our expectations, thanks to the unflagging commitment of our colleagues and farmer owners.
Revenue increased slightly by 1.2 per cent to EUR 5,441 million compared to EUR 5,377 million in the first half of 2020. Performance was above our industry peers leading to a pre-paid milk price to our farmer owners that increased in five consecutive months, closing on a 36.0 EURcent/kg of milk.
Driven by the pressure on supply chains during the reopening, a general inflation in prices for energy, feed, ingredients, logistic etc. has negatively influenced both our business and our owners’ economy. I am pleased that during the first half we were, to a high degree, able to offset this by price increases.
Our financial position remains robust with a leverage of 2.8, the low end of our target range. Our Calcium initiatives performed above expectations, however the savings were hit hard by the increasing inflation, and we achieved net savings of EUR 29 million. This was essential to deliver our competitive performance price.
Strong branded growth across-the-boardFollowing a 2020 of exceptional branded growth, most European markets and international regions continued to deliver at the top end of our expectations, leading to a 5.6 per cent volume growth for our strategic brands.
Foodservice is recovering in many markets, leading to the start of a rebalancing of demand between retail and foodservice, however it was still some way from pre-Covid-19 levels in the first half of the year as retail sales continued to dominate our performance. The on-going demand for Arla®, Lurpak®, Castello®, Puck® and Starbucks™ demonstrates how well our brand concepts resonate with consumers.
Arla Foods Ingredients secured revenue growth of 7.0 per cent, while the continued demand in retail caused a decrease in the share of milk solids sold by Global Industry Sales.
TOGETHER WiTH OUR FARMER OWNERS, WE CONTiNUED TO RAiSE THE BAR ON SUSTAiNABiLiTY
5.6%
10.4%
4.6%
HY 2021
HY 2020
HY 2019
Strategic branded volume driven revenue growth
5.6%Further action on the sustainability agendaTogether with our farmer owners, we continued to raise the bar on sustainability. After implementing the first round of Climate Checks in all seven owner countries, we have identified our overall carbon footprint average at 1.15 CO₂e per litre of milk at farmgate, and we have pinpointed the five most effective levers as our first steps towards a 30 per cent reduction by 2030.
A key business priority is to find ways to commercialise our owners’ climate actions, mainly through the Arla® brand. One of the latest examples is the launch of carbon neutral organic milk achieved through carbon reductions and compensation in the Netherlands, our third European market to launch this type of product.
Expectations for the second half In the second half, we expect the rebalancing of demand between retail and foodservice to continue to play out and slow down branded growth, while the broad inflationary environment will continue to provide challenges to the Company and to our farmers. While our recipe for managing Covid-19 has been successful, we have to manage the transition to the next normal just as well.
Before the end of the year, we plan to present our new Group strategy. Since 2015, our Good Growth strategy has successfully improved the quality and resilience of Arla, and the new strategy will build on these strengths to ensure a continued competitive milk price to our owners as well as strong value creation for our customers and consumers.
Peder TuborghCEO
5 ARLA FOODS HALF-YEAR REPORT 2021
Our Management Review Our Performance Review Our Condensed Interim Consolidated Financial Statements

HIGHLIGHTSWe continued our growth journey into 2021 at the same high pace as the year before, driven by high performance across our brands and segments. Combined with increasing commodity prices, this enabled us to pay out a competitive pre-paid milk price to our farmer owners. We also introduced a new member engagement platform for democratic discussion among our farmer owners to ensure a successful future for our cooperative.
CALCiUM DELiVERED AS ExPECTEDOur transformation and efficiencyprogramme, Calcium, delivered savings ofEUR 82 million excluding inflation, equalto a net saving of EUR 29 million. Savings primarily came from optimised supply chain operations, in-sourcing of marketing activities and optimised trade investments. The net saving was visibly impacted by the significant increase in inflation.
Read more on page 15
STRENGTHENiNG OUR FARMER DEMOCRACYIn March, we introduced Coop 2.0 to our farmer owners to kick-start a debate on how to be successful together in the future in light of the external realities we are facing. Building on 800+ lines of member feedback, we launched CoopTalks, a series of articles, podcasts and
webinars with the aim of bringing perspective on relevant topics, ranging from understanding what the future of dairy looks like, how the business and cooperative can support each other in responding to this and how to improve our democratic processes and member engagement.
ExCEEDiNG OUR BRANDED GROWTH ExPECTATiONSCovid-19 continued to impact our business with long periods of lockdowns in many markets. We increased our market share and grew our strategic brands by 5.6 per cent in the first half of 2021, driven by our strong operations, the agility of our business in a continued uncertain environment as well as high consumer confidence in Arla brands. The foodservice business slowly climbed back as restaurants started to open, and the initial decline was offset by the overall growth in retail. Our e-commerce business also continued growing at a fast pace with a revenue increase of 34 per cent compared to the same period last year.
Read more on page 13
SOLiD MiLk PRiCE TO OUR FARMER OWNERSContinued strong brand performance and increasing commodity prices enabled Arla to pay out a strong pre-paid milk price to our farmer owners of 36.0 EUR-cent/kg, which is an increase of 1.6 EUR-cent/kg compared to the same period last year. This positions Arla among the market leaders in Europe and supports our farmer owners, who also face increasing production costs at their farms.
Read more on page 12
6 ARLA FOODS HALF-YEAR REPORT 2021
Our Management Review Our Performance Review Our Condensed Interim Consolidated Financial Statements

HIGHLIGHTS (CONTiNUED)
With Arla’s Stronger People – Stronger Planet strategy we continued our focus on improving the environment for future generations, increasing access to healthy dairy nutrition and inspiring good food habits. We took further steps towards our ambition to become carbon net zero by 2050, and we reached more people with our nutritious and affordable products in emerging markets.
PROViDiNG ACCESS TO AFFORDABLE NUTRiTiONThe recently published ATNI (Access To Nutrition Index), which assesses how top 25 global food and beverage companies contribute to the Sustainable Development Goals on nutrition, shows that Arla has consistently improved over the past five years, now ranking number five. Arla has a target to provide access to affordable nutrition to 76 million low-income consumers annually, and we are happy to have improved our accessibility score since 2016. This progress is, among other things, a result of Arla’s focus on expanding rural distribution networks and empowering a female sales force in Bangladesh as well as Arla Foods Ingredients’ continuous product innovation.
LAUNCHiNG RECYCLABLE LURPAk® PACkAGiNGIn March, we started the launch of our new 100 per cent recyclable Lurpak® Spreadable tubs and lids in the UK, Denmark and Greece. In the UK alone, we sell 85 million packs of our 500 gram Lurpak® Spreadable a year, so this is a major step towards our goal of full circularity for our packaging. We plan to roll out to all markets during 2021, and we will update our pack design to incorporate on-pack recycling labels on the back of the pack to help consumers understand how they can dispose of their packaging.
PREPARiNG FOR FUTURE GROWTH iN GHANAIn just three years, Arla’s business in Ghana has increased its sales volumes by almost 3,000 tonnes. From the relatively small warehouse in Ghana’s capital Accra, bulk bags of Dano milk powder from our Pronsfeld dairy was repacked into sachets, but the rapid growth and ambitions for the future called for better facilities. In February, we opened the upgraded facilities, which in addition to providing better working conditions for our colleagues in Ghana, will increase capacity and enable more efficient packaging.
SAViNG 21 TONNES OF PLASTiC iN SWEDENWe continuously work to reduce material usage and increase the amount of recyclable packaging for our products. In Sweden, we removed the plastic spoons from our KESO® Cottage Cheese, Yoggi® and Arla KO® Greek yoghurts – in total 6.9 million spoons or 21 tonnes of plastic.
7 ARLA FOODS HALF-YEAR REPORT 2021
Our Management Review Our Performance Review Our Condensed Interim Consolidated Financial Statements

LEADING TOWARDS A SUSTAINABLE FUTURE FOR DAIRY FARMING
Externally verified data from Arla’s Climate Check programme confirmed that our farmer owners are on track towards reaching Arla’s science-based target of 30 per cent reduction by 2030 and towards Arla’s ambition to become carbon net zero by 2050. The data will serve as a foundation for driving further carbon emission reductions at Arla farms and contribute to driving the agenda for the future of sustainable dairy farming.
ARLA FARMERS AMONG THE MOST CLiMATE-EFFiCiENT Recently published data from our Climate Check Programme, which was verified by an external climate advisor, confirmed that Arla farmers are among the most climate-efficient dairy farmers in the world with 1.15 kg of CO₂e per kilo of milk, including peatlands 1).
For the last decades, our farmer owners haveworked steadily towards sustainable farming and implementing green opportunities on their farms, such as circular farming practices, renewable energy and biodiversity and now also Climate Checks. Through our Climate Check programme, which is one of the world’s largest externally validated set of climate data, approximately 8,000 farmer owners assessed and submitted data to more than 200 questions about their herd, feed production, energy usage etc.
The data also revealed five universal levers for a lower carbon footprint for dairy on all types of Arla farms:
Better feed efficiency to improve milk yield Precision feeding to reduce surplus protein in
feed ration A healthy and long life for the cow to improve
milk yield
Precise fertilizer management to reduce nitrogen surplus from feed production
Better land use management to ensure better crop yields.
With governments across our European markets initiating policy and legislation to reduce carbon emissions, we have been in dialogue with politicians and officials to enhance their under-standing of the positive role that dairy plays in sustainability and nutrition. Our Climate Check programme and the work our owners are doing to reduce their carbon footprint have been recognised as industry leading by the EU Commission and welcomed by governments in several of our core markets.
ARLA FARMERS CLOSE THE LOOP ON RENEWABLE ENERGYAs part of Arla’s carbon net zero ambition, we also aim to increase our share of renewable energy in our operations. In 2020, we bought green electricity certificates in the open market covering 41 per cent of our total electricity use in our operations. However, as 24 per cent of our farmer owners currently produce renewable energy from solar panels and wind turbines, we see a potential in closing the loop by buying Guarantees of Origin directly from our farmer owners. This will secure our farmers a better price for their power and give the dairy cooperative direct access to more green
1) Peatlands help preserve biodiversity by storing more carbon than other vegetation types. 2) Due to legislation in Germany and Luxembourg for farmers to pass their Guarantees of Origin to the government, 14 per cent of our owners will currently be able to sell their Guarantees of Origin directly to the cooperative.
THE GREEN POWER LOOP PRESENT AND FUTURE
Farmer/Owner Utility company Any company Arla
100%
PR
ES
EN
TF
UT
UR
E
electricity certificates. We estimate that approximately one fifth of Arla’s total electricity usage can be covered by farmer-produced Guarantees of Origin 2).
Technically, the loop is created via the Guarantees of Origin which are issued for the electricity from renewable sources produced on the farm. Until now, the farmers’ only option was to sell their Guarantees of Origin as a commodity for resale. By selling their Guarantees of Origin directly to Arla, the other parties are left out of the transaction and the farmers are rewarded with the full market value that Arla would pay for Guarantees of Origin on the open market.
8 ARLA FOODS HALF-YEAR REPORT 2021
Our Management Review Our Performance Review Our Condensed Interim Consolidated Financial Statements

ESSENTiAL BUSiNESS PRiORiTiES FOR 2021
Arla’s essential business priorities are the annual focus points on our strategic journey. They are set by our Executive Management Team and approved by the Board of Directors. We follow up on our progress on a monthly basis.
CONTiNUE STRONG OPERATiONS iN LiGHT OF COViD-19
Maintain operational stability and security of supply for our customers. Sustain and further develop branded market positions captured during Covid-19, while engaging and securing the safety of our employees.
Satisfactory progress
DELiVER CALCiUM AND EMBED NEW WAYS OF WORkiNG
Deliver the last stretch of EUR >45 million to reach our 2021 target of EUR 400 million in sustainable cost savings, and continue to build our future pipeline, while anchoring the transformation and embedding Covid-19 learnings across the organisation.
Satisfactory progress
WiN WiTH FORESiGHT iN CHANGiNG CONSUMER TRENDS
Step up health and sustainability proposition through big plays for the Arla brand, while developing our strategic brands to capture consumers’ demand for value offering.
Good progress
DELiVER MiSSiON-CRiTiCAL PROjECTS
Navigate outcome of Brexit and minimise friction costs, secure more whey for AFI and deliver on key investment projects.
Good progress
POWER UP GROWTH CHANNELS AND kEY CUSTOMERS
Protect and develop strategic positions with our top customers, step up e-commerce and drive new concepts for foodservice.
Good progress
DEMONSTRATE AND ACCELERATE SUSTAiNABiLiTY
Accelerate our sustainability agenda and demonstrate our progress, while further building on our strong farmer owner engagement and progress.
Good progress
WiN THE FUTURE
Create even stronger member relations where trust in the cooperative is further enhanced, while defining a new group strategy to set the future course for Arla.
Satisfactory progress
Limited progress Satisfactory progress Good progress9 ARLA FOODS HALF-YEAR REPORT 2021
Our Management Review Our Performance Review Our Condensed Interim Consolidated Financial Statements
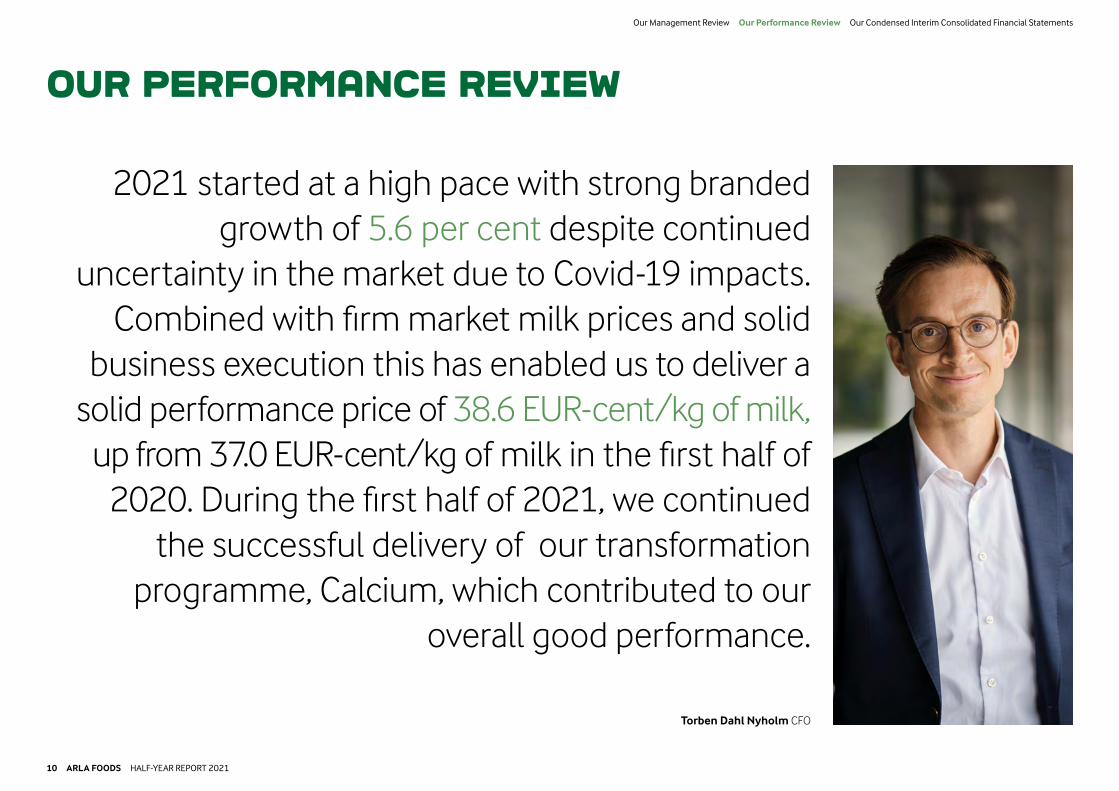
OUR PERFORMANCE REViEW
2021 started at a high pace with strong branded growth of 5.6 per cent despite continued
uncertainty in the market due to Covid-19 impacts. Combined with firm market milk prices and solid
business execution this has enabled us to deliver a solid performance price of 38.6 EUR-cent/kg of milk,
up from 37.0 EUR-cent/kg of milk in the first half of 2020. During the first half of 2021, we continued
the successful delivery of our transformation programme, Calcium, which contributed to our
overall good performance.
Torben Dahl Nyholm CFO
10 ARLA FOODS HALF-YEAR REPORT 2021
Our Management Review Our Performance Review Our Condensed Interim Consolidated Financial Statements

Despite the continued uncertainty caused by Covid-19, the global economy recovered fast and was growing steadily throughout the first half of 2021. The inflationary pressure caused by high economic activity led to increased global commodity prices, which hit producers hard. In a European context, the impacts of Brexit seemed to be modest due to the Free Trade Agreement between the EU and the UK.
GLOBAL ECONOMY RECOVERED FASTER THAN ExPECTED2021 started with Covid-19 lockdowns in many countries continuing also into the second quarter of the year. This naturally had a negative impact on the foodservice industry as restaurants, cafés and canteens were out of business for a long time. Without options to eat out, consumers continued to cook more at home, driving retail sales up in the first half of 2021. Online grocery shopping was also steadily growing, with one third of the UK’s population buying groceries online at least once a week 1) . The channel penetration for dairy products reached 30 per cent 2) .
HiGH iNFLATiONARY PRESSURE DROVE PRiCES UPThe better-than-expected economic activity and increased consumer purchasing power enabled by government support packages led to increasing inflationary pressure on raw materials, most visibly seen in steel, oil and oil-related products, construction materials and agricultural products. By 30 June 2021, raw material prices had generally increased by 60 per cent compared to the same date last year3), and the price of a barrel of oil increased from USD 41.15 to USD 75.13 – an increase of 82 per cent. The increasing commodity prices put pressure on input costs for many manufacturing companies, including Arla.
STABLE MiLk SUPPLY iN EUROPEThe European milk intake and production increased slightly by 0.5 per cent compared to the same period last year. Milk intake and production generally decreased in big countries like Germany and France, but this was offset by growth in small countries like Ireland. The supply flow was stable, but high inflation in raw material and feed prices as well as challenging weather conditions put pressure on milk production.
INCREASiNG MiLk COMMODiTY PRiCES European and global dairy commodity markets slowly started to recover after Covid-19. Similarly to other commodities, dairy prices increased steadily throughout the first quarter of the year and stabilised at solid levels during the second quarter. The Global Dairy Trade (GDT) Price Index was up by 15.0 per cent in early March, but stabilised again during the second quarter of the year4).
CALM FOREiGN ExCHANGE MARkETThe first half of 2021 was characterised by relatively stable exchange rates despite continued Covid-19 uncertainty. Compared to EUR, the average rate for USD weakened 9.3 per cent while the SEK improved 5.0 per cent. The GBP remained steady in the first half of 2021, with a slight strengthening of 0.6 per cent against the EUR.
DAIRY SECTOR IMPACTED BY BRExITThe friction caused by Brexit impacted the UK/EU dairy sector with trade in some categories falling significantly year on year 6). In Arla, our preparation helped us navigate the new trading environment and we have only experienced minor disruption to our EU/UK trade. Brexit is however still in its early stages and the situation in the UK continues to evolve. Arla was impacted by the disruption in the local labour market with national driver shortages. We are also preparing for the UK to implement its new border procedures on 1 October 2021.
CONTiNUED UNCERTAiN ECONOMiC OUTLOOkMore than one year into the Covid-19 pandemic, there is still high uncertainty about the global economic outlook even though growing vaccine coverage lifts sentiment. The IMF, however, estimates that the unprecedented decline in 2020 could have been at least three times worse if not for extraordinary governmental support. The global economy is projected to grow by 6 per cent in 20215). This is 0.8 percentage points stronger than projected in October 2020, reflecting additional fiscal support in a few large economies and the expected vaccine- powered recovery in the second half of the year.
Gouda WMP
Q1 Q2 Q3 Q4 Q1 Q22020 2021
20
30
40
50
MARkET OVERVIEW
2017 20192018 20212020
Advanced economies World Emerging market and developing economies
Source: IMF
EUROPEAN DAIRY COMMODiTY PRiCES DEVELOPMENT(EURc/Kg, Milk Utilisation Equivalent)
GROSS DOMESTiC PRODUCT GROWTH RATE(%)
1) IGD, June 2021. 2) Kantar, June 2021. 3) CRB Bloomberg, Macrobond SEB. 4) Global Dairy Trade, https://www.globaldairytrade.info/en/product-results/ 5) World Economic Outlook, Managing Divergent Recoveries, IMF, April 2021. 6) Food & Drink Federation, February 2021.
-10
-5
0
5
10
11 ARLA FOODS HALF-YEAR REPORT 2021
Our Management Review Our Performance Review Our Condensed Interim Consolidated Financial Statements

PERFORMANCE REVIEW
increasing sales prices contributed positively to the revenue increase by EUR 77 million. Currency effects had a negative impact on revenue of EUR 61 million.
COMPETiTiVE PRE-PAiD MiLk PRiCEDespite the continued uncertainty caused by Covid-19, Arla managed to increase the average standard pre-paid milk price to 36.0 EUR-cent/kg, which is an increase of 1.6 EUR-cent/kg compared to the same period last year. This positions Arla at a competitive level and supports our farmer owners through times of increasing production costs at their farms.
Firm execution throughout our value chain combined with increasing market milk prices and changed volume/mix contributed to achieving a solid performance price of 38.6 EUR-cent/kg compared to 37.0 EUR-cent/kg in the first half of 2020. Our transformation and efficiency programme, Calcium, contributed positively by EUR 82 million excluding inflation, equal to EUR 29 million in net savings. Milk intake from our farmer owners and other external sources was overall unchanged at 7 billion kilos, same as in the first half of 2020.
SOLiD RETAiL DRiVEN REVENUE GROWTHDuring the first half of 2021, revenue increased by 1.2 per cent to to EUR 5,441 million compared to EUR 5.377 million in the same period last year. Revenue growth was primarily driven by highersales prices and branded volumes in retail. This was partly offset by a decrease in the foodservice segment in the first quarter due to long periods of lockdowns. High consumer demand put inflationary pressure on commodity prices, and
OWNER MiLk PRiCE 1)
(EUR-cent/kg)
HY 2019
36.1
34.2
HY2020
37.0
34.4
HY2021
38.6
36.0
Standard pre-paid milk price Performance milk price
5,441
5,377
5,232
HY 2021
HY 2020
HY 2019
REVENUE DEVELOPMENT(million EUR)
1) The milk conversion factor from litre into kg was 1.02 for milk volumes until 30 June, 2021. Effective from 1 July 2021, the milk conversion factor is 1.03.12 ARLA FOODS HALF-YEAR REPORT 2021
Our Management Review Our Performance Review Our Condensed Interim Consolidated Financial Statements

PERFORMANCE REVIEW (CONTiNUED)
STEADY BRANDED GROWTH iN LiGHT OF COViD-19Following a year of exceptional branded growth, Arla’s brands continued the growth journey into 2021 delivering strategic branded volume growth of 5.6 per cent, which is above our target range of 1-3 per cent. However, the exceptionally high growth rates started to normalise towards the end of the half year reaching normal levels in the last months, and we expect to see normal growth levels throughout the second half of the year. The growth in the first half of the year can partly be explained by the effects of continued lockdowns
and in-home consumption due to Covid-19 restrictions, but also by an overall executional power, brands that resonate well with consumers, new market share gains and new product launches.
Sales of Starbucks™ licensed products increased by 42.7 per cent in branded volume growth, and Castello® performed above expectations, reaching 7.8 per cent. The Arla® brand also delivered high growth of 6.9 per cent driven by high performance across most categories and sub-brands. After an unprecedented volume growth in the first half of 2020, largely driven by changed consumer behavior
on the back of the Covid lockdowns, Lurpak® almost managed to repeat its historically high sales volumes from last year. Puck® delivered solid 3.0 per cent in branded revenue growth. The overall brand share increased to 49.2 per cent compared to 48.3 per cent in the first half of last year.
Foodservice slowly started recovering in many markets; however it was still not back to pre-Covid-19 levels in the first half of the year where retail sales continued to to be the main driver of our performance.
BRANDED VOLUME GROWTH BY GLOBAL BRAND
6.9%HY 2020: 3.3%
-0.8%HY 2020: 17.7%
7.8%HY 2020: -0.5%
3.1%HY 2020: 16.7%
42.7%HY 2020: 13.1%%
5.6%
10.4%
4.6%
HY 2021
HY 2020
HY 2019
BRANDED VOLUME GROWTH DEVELOPMENTHY 2019 to HY 2021
13 ARLA FOODS HALF-YEAR REPORT 2021
Our Management Review Our Performance Review Our Condensed Interim Consolidated Financial Statements

PERFORMANCE REVIEW (CONTiNUED)
EUROPEOur European commercial segment delivered overall branded growth of 2.5 per cent, primarily driven by Starbucks™ at 41.3 per cent, Castello® at 4.2 per cent and the Arla® brand at 2.5 per cent. Especially the Arla sub-brands LactoFREE® and Fill N’ Fuel grew strongly by 14.4 and 13.5 per cent, respectively. Markets continued to grow, led by Netherlands/France/Belgium, UK and Denmark with 9.5, 4.6 and 2.4 per cent, respectively. The brand share of the European segment increased to 55 per cent compared to 53 per cent last year. Revenue increased slightly to EUR 3,199 million compared to EUR 3,178 million in the same period last year. Long periods of lockdowns caused a small decline in foodservice in the first quarter of the year; however, significant growth was seen in the second quarter as restaurants started to reopen. The e-commerce business grew at a fast pace with revenue growth of 34 per cent com-pared to the same period last year.
INTERNATiONALOur International segment grew branded volumes across all regions and main brands in the first half of 2021. Starbucks™ delivered high growth of 45.1 per cent, followed by the Arla® brand at 24.7 per cent and Castello® at 11.0 per cent. Sales from Kraft® branded products were at the same level as in the first half of 2020. The long periods of increased in-home consumption impacted positively on sales, and the higher costs for products and services as well as the adverse effects of a declining USD were to a high degree offset by price increases. Thus, revenue grew modestly to EUR 1,037 million compared to EUR 1,024 million last year. The brand share of the International segment increased slightly to 88 per cent compared to 87 per cent in the first half of 2020.
ARLA FOODS INGREDiENTSArla Foods Ingredients (AFI) continued to meet increasing customer demands for protein and lactose ingredients, and revenue grew to EUR 387 million compared to EUR 360 million in the same period last year. The value-add whey volumes grew by 9.8 per cent to a total value-add share of 69.6 per cent due to succesfully utilising additional new raw materials, recently secured through new strategic sourcing arrangements. AFI’s child nutrition manufacturing business performed in line with the same period last year with a revenue of EUR 78 million. New product launches from our customers showed positive indications for the future for this part of the business.
GLOBAL INDUSTRY SALESOur Global Industry Sales business had a positive start of the year as commodity markets started to recover after Covid-19. This was driven by high global demand. Commodity prices generally increased during the first half of 2021 and by the end of the period, prices reached a higher level compared to the same period last year. Due to the increased sales through Arla’s retail channels, the overall share of milk solids sold by our Global Industry Sales fell to 23.1 per cent compared to 23.6 per cent last year. Despite the decrease in volume the revenue increased slightly to EUR 818 million compared to EUR 815 million in the first half of 2020 as a result of the price increases.
COMMERCiAL SEGMENTS
14 ARLA FOODS HALF-YEAR REPORT 2021
Our Management Review Our Performance Review Our Condensed Interim Consolidated Financial Statements

PERFORMANCE REVIEW (CONTiNUED)
CALCiUM SAViNGS ON TARGETOur transformation and efficiency programme delivered EUR 82 million excluding inflation, that translates to EUR 29 million net savings in the first half of 2021. This brings total savings since the start of the programme in 2018 to EUR 562 million excluding inflation, equal to a net saving of EUR 383 million. Savings primarily came from optimised supply chain operations, in-sourcing of marketing activities and optimised trade investments. The surprisingly fast macroeconomic recovery after Covid-19 lead to significantly higher than expected inflation, which challenges our ability to reach our original net savings target of EUR 400 million for the 4-year programme. Savings excluding inflation are, however, exceeding the targets both for the first half of 2021 and for the full programme.
NET PROFiT WiTHiN TARGET RANGEIn the first half of 2021, Arla achieved a net profit of EUR 165 million, or 3.0 per cent of revenue, which
Cash flow from investing activities amounted to EUR 208 million in the first half of 2021, compared to EUR 194 million in the same period last year. We continued the execution of our four key CAPEX investment projects in the first half of 2021. In Germany, the construction of a new powder tower in Pronsfeld proceeded well. In Bahrain, we extended our production site to encompass the entire production of Kraft® and Puck® products. In Denmark, we continued with the capacity increase of the mozzarella production at Branderup dairy as well as the construction of our new AFI Innovation Centre. Our investments, totalled at EUR 256 million for the first half of 2021.
Cash flow from financing activities decreased to EUR -69 million, primarily explained by the extraordinary high supplementary payment to our farmer owners of EUR 228 million related to the 2020 profit appropriation, offset by the issuing of green bonds and newly obtained loans.
is in the middle of our target range of 2.8-3.2 per cent.
ROBUST FiNANCiAL POSiTiON The first half of 2021 proved that Arla continued to be in a robust financial position. With a leverage of 2.8, we ended at the low end of our target range of 2.8-3.4.
Cash flow from operating activities decreased to EUR 274 million in the first half of 2021 compared to EUR 477 million in the same period last year. A positive development in EBITDA was offset by increased cash tied up in working capital. Measured in days of turnover, net working capital increased to 36 days compared to 30 days end of June last year. The increase was due to the deliberately reduced utilisation of trade receivable finance programmes as part of capital structure optimisation.
CALCiUM SAViNGS(million EUR)
Net profit
3.0% (of revenue)
Calcium savings
29 (million EUR)
Calcium savings, excluding estimated inflation
82 (million EUR)
Net working capital*
36 (days)
Leverage
2.8 *Trailing three months average number 2018
114
195
2019
110142
2020
130143
Calcium savings excluding estimated inflation Calcium savings
Half-year 2021
29
Accumulated savings at half year 2021
82
562
383
15 ARLA FOODS HALF-YEAR REPORT 2021
Our Management Review Our Performance Review Our Condensed Interim Consolidated Financial Statements

FINANCIAL OUTLOOK
After a strong first half of 2021, we increase our guidance for revenue and strategic branded volume driven revenue growth for the full year 2021. Our expectations for Calcium are challenged due to high inflationary pressure into the second half of 2021.
ImprOved OUTLOOKFOr impOrTANT KpIsOur expectations for revenue growth are adjusted up from EUR 10.3-10.6 to 10.6-11.00. Leverage is adjusted from 2.8-3.4 to ≤ 2.8. Our strategic branded volume driven revenue growth guidance is up from 1-3 per cent to 3-4 per cent.
We maintain our guidance on international share, brand share and profit share as communicated in the Annual Report 2020.
INFLATiON ChALLeNges CALCiUm NeT deLiveryAccelerated work on our efficiency pipeline across our value chain will continue to deliver added value during the second half of 2021. However, due to significant impacts from the expected inflationary pressure in the second half of the year, we adjust our guidance for Calcium savings for 2021 to EUR < 20 million. Excluding inflation, full-year savings are expected to exceed EUR 150 million which is ahead of our initial expectations for 2021. Accelerated work on our efficiency pipeline across our value chain will likely not fully compensate for the high pressure from inflation.
Revenue
10.6-11.0EURb (adjusted from 10.3-10.6)
Profit share
2.8-3.2%(unchanged)
Calcium savings
< 20EURm (adjusted from >45)
Calcium savings excluding estimated inflation
> 150EURm
Leverage
≤ 2.8(adjusted from 2.8-3.4)
Strategic branded volume driven revenue growth
3-4%(adjusted from 1-3%)
Brand share
≥ 50%(adjusted from > 50%)
International share
> 23.5%(unchanged)
2021 TArgeTs
16 ARLA FOODS HALF-YEAR REPORT 2021
Our Management Review Our Performance Review Our Condensed Interim Consolidated Financial Statements
OUR CONDENSEDINTERIMCONSOLIDATEDFINANCIALSTATEMENTS

(EURm) Note Half-year2021
Half-year2020
Develop-ment, %
Full-year2020
Revenue 1.1 5,441 5,377 1 10,644Production costs 1.2 -4,287 -4,203 2 -8,301 Gross profit 1,154 1,174 -2 2,343
Sales and distribution costs 1.2 -734 -745 -1 -1,483 Administration costs 1.2 -207 -203 2 -439 Other operating income 49 17 188 61Other operating costs -31 -31 - -52 Share of results after tax in joint ventures and associates 3.1 21 6 250 28 Earnings before interest and tax (EBIT) 252 218 16 458
Specification: EBITDA 485 443 9 909Depreciation, amortisation and impairment losses 1.2 -233 -225 4 -451 Earnings before interest and tax (EBIT) 252 218 15 458
Financial income 8 3 167 7 Financial costs -49 -38 29 -79 Profit before tax 211 183 15 386
Tax -39 -17 129 -34Profit for the period 172 166 3 352
Non-controlling interests -7 -3 133 -7 Arla Foods amba's share of profit for the period 165 163 1 345
INCOME STATEMENT
COMPREHENSiVE iNCOME
(EURm) Note Half-year2021
Half-year2020
Full-year2020
Profit for the period 172 166 352
Other comprehensive income Items that will not be reclassified to the income statement: Remeasurements of defined benefit schemes 12 23 5 Tax on remeasurements of defined benefit schemes -3 -3 4
Items that may be reclassified subsequently to the income statement:
Value adjustments of hedging instruments 13 25 41 Fair value adjustment of certain financial assets -1 -1 -3 Adjustments related to foreign currency translation 87 -56 -84 Tax on items that may be reclassified to the income statement - - -Other comprehensive income, net of tax 108 -12 -37
Total comprehensive income 280 154 315
Allocated as follows: Owners of Arla Foods amba 273 151 308Non-controlling interests 7 3 7 Total 280 154 315
18 ARLA FOODS HALF-YEAR REPORT 2021
Our Management Review Our Performance Review Our Condensed Interim Consolidated Financial Statements

BALANCE SHEET
(EURm) Note Half-year2021
Half-year2020
Develop-ment, %
Year-end2020
AssetsNon-current assetsIntangible assets and goodwill 3.1 951 941 1 931 Property, plant, equipment and right of use assets 3.1 2,960 2,721 9 2,915 Investments in associates and joint ventures 3.1 507 460 10 470 Deferred tax 20 30 -33 29 Pension assets 4.1 59 37 59 40 Other non-current assets 30 21 43 28 Total non-current assets 4,527 4,210 8 4,413
Current assets Inventory 2.1 1,203 1,154 4 1,080 Trade receivables 2.1 947 771 23 811 Derivatives 20 75 -73 57 Other receivables 279 252 11 424Securities 426 425 0 420 Cash and cash equivalents 124 150 -17 126 Total current assets 2,999 2,827 6 2,918
Total assets 7,526 7,037 7 7,331
(EURm) Note Half-year2021
Half-year2020
Develop-ment, %
Year-end2020
Equity and liabilitiesEquityCommon capital 1,973 1,927 2 1,968Individual capital 500 464 8 513Other equity accounts -19 -104 -82 -118 Profit for the period 165 163 1 -Proposed supplementary payment to owners - - 0 223 Equity attributable to the owners of Arla Foods amba 2,619 2,450 7 2,586Non-controlling interests 48 46 4 53 Total equity 2,667 2,496 7 2,639
LiabilitiesNon-current liabilitiesPension liabilities 4.1 233 235 -1 247 Provisions 25 25 0 21 Deferred tax 74 75 -1 64Loans 4.1 2,189 1,887 16 1,964 Total non-current liabilities 2,521 2,222 13 2,296
Current liabilitiesLoans 4.1 767 740 4 695
Trade and other payables 2.1 1,184 1,123 5 1,212 Provisions 22 9 144 25 Derivatives 40 83 -52 66 Current tax 13 9 44 11 Other current liabilities 312 355 -12 387Total current liabilities 2,338 2,319 1 2,396
Total liabilities 4,859 4,541 7 4,692
Total equity and liabilities 7,526 7,037 7 7,331
19 ARLA FOODS HALF-YEAR REPORT 2021
Our Management Review Our Performance Review Our Condensed Interim Consolidated Financial Statements

EqUiTY
Common capital Individual capital Other equity accounts
(EURm) Cap
ital a
ccou
nt
Rese
rve
for
spec
ial p
urpo
ses
Profi
t for
th
e pe
riod
Con
trib
uted
in
divi
dual
ca
pita
l
Del
iver
y-ba
sed
owne
r ce
rtifi
cate
s
Inje
cted
indi
vidu
al
capi
tal
Supp
lem
enta
ry
paym
ent
Rese
rve
for v
alue
ad
just
men
t of
hedg
ing
inst
rum
ents
Rese
rve
for f
air
valu
e th
roug
h O
CI
Rese
rve
for
fore
ign
exch
ange
ad
just
men
ts
Tota
l bef
ore
non-
cont
rolli
ng
inte
rest
s
Non
-con
trol
ling
inte
rest
s
Tota
l Equ
ity a
fter
no
n-co
ntro
lling
in
tere
sts
Equity at 1 January 2021 878 1,090 - 302 65 146 223 -53 9 -74 2,586 53 2,639Profit for the period - - 165 - - - - - - - 165 7 172Other comprehensive income 9 - - - - - - 13 -1 87 108 - 108Total comprehensive income 9 - 165 - - - - 13 -1 87 273 7 280Payments to owners 1 - - -11 -4 -4 - - - - -18 - -18Transactions with non-controlling interests 6 - - - - - - - - - 6 -14 -8Supplementary payment related to 2020 - - - - - - -228 - - - -228 - -228Foreign exchange adjustments -11 - - 1 - 5 5 - - - - 2 2Total transactions with owners -4 - - -10 -4 1 -223 - - - -240 -12 -252
Equity at 30 June 2021 883 1,090 165 292 61 147 - -40 8 13 2,619 48 2,667
Equity at 1 January 2020 885 1,009 - 271 68 159 127 -94 12 10 2,447 47 2,494Profit for the period - - 163 - - - - - - - 163 3 166Other comprehensive income 20 - - - - - - 25 -1 -56 -12 - -12Total comprehensive income 20 - 163 - - - - 25 -1 -56 151 3 154Payments to owners - - - -10 -4 -7 - - - - -21 - -21Transactions with non-controlling interests - - - - - - - - - - - -4 -4Supplementary payment related to 2019 - - - - - - -127 - - - -127 - -127Foreign exchange adjustments 13 - - - -2 -11 - - - - - - -Total transactions with owners 13 - - -10 -6 -18 -127 - - - -148 -4 -152Equity at 30 June 2020 918 1,009 163 261 62 141 - -69 11 -46 2,450 46 2,496
20 ARLA FOODS HALF-YEAR REPORT 2021
Our Management Review Our Performance Review Our Condensed Interim Consolidated Financial Statements

CASH FLOW
(EURm) Note Half-year2021
Half-year2020
Full-year 2020
EBITDA 485 443 909 Reversal of share of results in joint ventures and associates 3.1 -21 -6 -28 Reversal of other operating items without cash impact -29 18 53Change in net working capital 2.1 -274 -14 4 Change in other receivables and other current liabilities 144 69 -137Dividends received from joint ventures and associates 9 6 8 Interest paid -24 -28 -53 Interest received 3 1 3 Taxes paid -19 -12 -28 Cash flow from operating activities 274 477 731
Investment in intangible fixed assets 3.1 -26 -29 -53 Investment in property, plant and equipment 3.1 -194 -193 -478 Sale of property, plant and equipment 3.1 13 17 19Operating investing activities -207 -205 -512
Sale of financial assets 7 11 22 Acquisition of financial assets -8 - -5Sale of enterprises - - 7 Financial investing activities -1 11 24 Cash flow from investing activities -208 -194 -488 Supplementary payment regarding the previous financial year -228 -127 -127 Paid in and out from equity regarding individual capital instruments -18 -21 -22 Paid out to non-controlling interests -8 -4 -18New loans obtained 256 62 149Other changes in loans -17 -179 -173Payment of lease debt -35 -33 -66 Payment to pension plans -19 -17 -36 Cash flow from financing activities -69 -319 -293
Net cash flow -3 -36 -50
(EURm) Note Half-year2021
Half-year2020
Full-year 2020
Cash and cash equivalents at 1 January 126 187 187Net cash flow for the period -3 -36 -50Exchange rate adjustment of cash funds 1 -1 -11Cash and cash equivalents at 30 June 124 150 126
Free operating cash flow
Cash flow from operating activities 274 477 731Operating investing activities -207 -205 -512Free operating cash flow 67 272 219
Free cash flowCash flow from operating activities 274 477 731Cash flow from investing activities -208 -194 -488 Free cash flow 66 283 243
Operating cash flow impacted by higher milk prices
Cash flow from operating activities decreased by EUR 203 million to EUR 274 million compared to EUR 477 million in the first half of last year. The development was a result of cash tied up in working capital mainly from reduced trade receivable finance programmes, and also from increased inventory driven by higher milk prices. These effects were partly offset by a higher EBITDA and by settlements of VAT receivables positions. Cash flow from investing activities amounted to EUR -208 million consistent with the same period last year. The majority of CAPEX investments in the first half of 2021 comprised of continued execution of the key projects on our sites Pronsfeld in Germany, Bahrain, Branderup and AFI Innovation Center in Denmark.
Free cash flow for the half-year totalled EUR 66 million representing a decrease of EUR 217 million compared to same period last year.
Cash flow from financing activities amounted to EUR -69 million compared to EUR -319 million last year. An extraordinarily high supplementary payment of EUR 228 million from the 2020 profit appropriation was paid out in March 2021. Individual capital of EUR 18 million was paid out to owners who either resigned or retired from Arla. New loans obtained of EUR 256 million included a green bond issue in Sweden of EUR 148 million.
Cash and cash equivalents amounted to EUR 124 million, compared to EUR 150 million at the end of the same period last year.
21 ARLA FOODS HALF-YEAR REPORT 2021
Our Management Review Our Performance Review Our Condensed Interim Consolidated Financial Statements
INTRODUCTiON TO NOTESThe following sections provide additional disclosures supplementing the primary financial statements.
BASiS FOR PREPARATiONThe condensed interim consolidated report is prepared according to the same accounting policies as applied in the consolidated annual report for 2020.
Arla’s consolidated annual report is prepared in accordance with the International Financial Reporting Standards (IFRS) as adopted by the EU and additional disclosure requirements in the Danish Financial Statement Act.
This condensed interim consolidated report for 2021 is issued on a voluntarily basis, and management has decided not to fully apply IAS 34 in terms of disclosures for interim reporting.
In response to the Guidelines on Alternative Performance Measures (APMs) issued by the European Securities and Markets Authority (ESMA), we have provided additional information on the APMs used by the group. These APMs are deemed critical to understanding the financial performance and financial position of the group. As they are not defined by IFRS, they may not be directly comparable with other companies who use similar measures. Definitions are provided in the Glossary and Note 1.3
The functional currency of the parent company is DKK. The presentation currency of the parent company and of the group is EUR.
These condensed interim financial statements are prepared to the million EUR nearest.
CURRENCY ExPOSUREThe group’s financial position is significantly exposed to currencies, both due to transactions conducted in currencies other than the EUR and due to the translation of financial reporting from entities not part of the Eurozone. The most significant exposure relates to financial reporting from entities operating in GBP and SEK, and to transactions relating to sales in USD or USD-related currencies.
CONSOLiDATED FiNANCiAL STATEMENTSThe consolidated financial statements are prepared as a compilation of the parent company’s and the individual subsidiaries’ financial statements, in line with the group’s accounting policies. Revenue, costs, assets and liabilities, along with items included in equity of subsidiaries are aggregated and presented on a line-by-line basis. Intra-group shareholdings, balances and transactions, as well as unrealised income and expenses arising from intra-group transactions are eliminated.
The consolidated financial statements comprise Arla Foods amba (parent company) and the subsidiaries in which the parent company directly or indirectly holds more than 50 per cent of the voting rights, or otherwise maintains control to obtain benefits from its activities. Entities in which the group exercises joint control through a contractual arrangement are considered to be joint ventures. Entities in which the group exercises a significant but not a controlling influence, are considered as associates.
Unrealised gains arising from transactions with joint ventures and associates, i.e. profits from sales to joint ventures or associates and whereby the customer pays with funds partly owned by the group, are eliminated against the carrying amount of the investment in proportion to the group’s interest in the company. Unrealised losses are eliminated in the same manner, but only to the extent that there is no evidence of impairment.
TRANSLATiON OF TRANSACTiONS AND MONETARY iTEMS iN FOREiGN CURRENCiESFor each reporting entity in the group, a functional currency is determined, being the currency used in the primary economic environment where the entity operates. Where a reporting entity transacts in a foreign currency, it will record the transaction in its functional currency using the transaction date rate. Monetary
assets and liabilities denominated in foreign currencies are translated into the functional currency using the exchange rate applicable at the reporting date. Exchange differences are recognised in the income statement under financial items. Non-monetary items, for example property, plant and equipment which are measured based on historical cost in a foreign currency, are translated into the functional currency upon initial recognition.
TRANSLATiON OF FOREiGN OPERATiONS The assets and liabilities of consolidated entities, including the share of net assets and goodwill of joint ventures and associates with a functional currency other than EUR, are translated into EUR using the half- year-end exchange rate. The revenue, costs and share of the results for the year are translated into EUR using the average monthly exchange rate if this does not differ materially from the transaction date rate. Foreign currency differences are recognised in other comprehensive income and accumulated in the translation reserve.
ADOPTiON OF NEW OR AMENDED IFRS The group implemented all new standards and interpretations effective in the EU from 2021. IASB issued a number of new or amended and revised accounting standards and interpretations that have not yet come into effect. Arla will adopt these new standards when they become mandatory. No material impact is expected.
NOTE 1REVENUE AND COSTSDetails on the group’s performance and rentability are disclosed in Note 1.
NOTE 2NET WORkiNG CAPiTALDetails on the development and composition of inventory and trade balances are disclosed in Note 2.
NOTE 3CAPiTAL EMPLOYEDDetails on production capacity, intangible assets and financial investments held by the group are disclosed in Note 3.
NOTE 4FUNDiNGDetails on funding of the group’s activities are disclosed in Note 4.
22 ARLA FOODS HALF-YEAR REPORT 2021
Our Management Review Our Performance Review Our Condensed Interim Consolidated Financial Statements
Revenue and cost
1.1 REVENUE
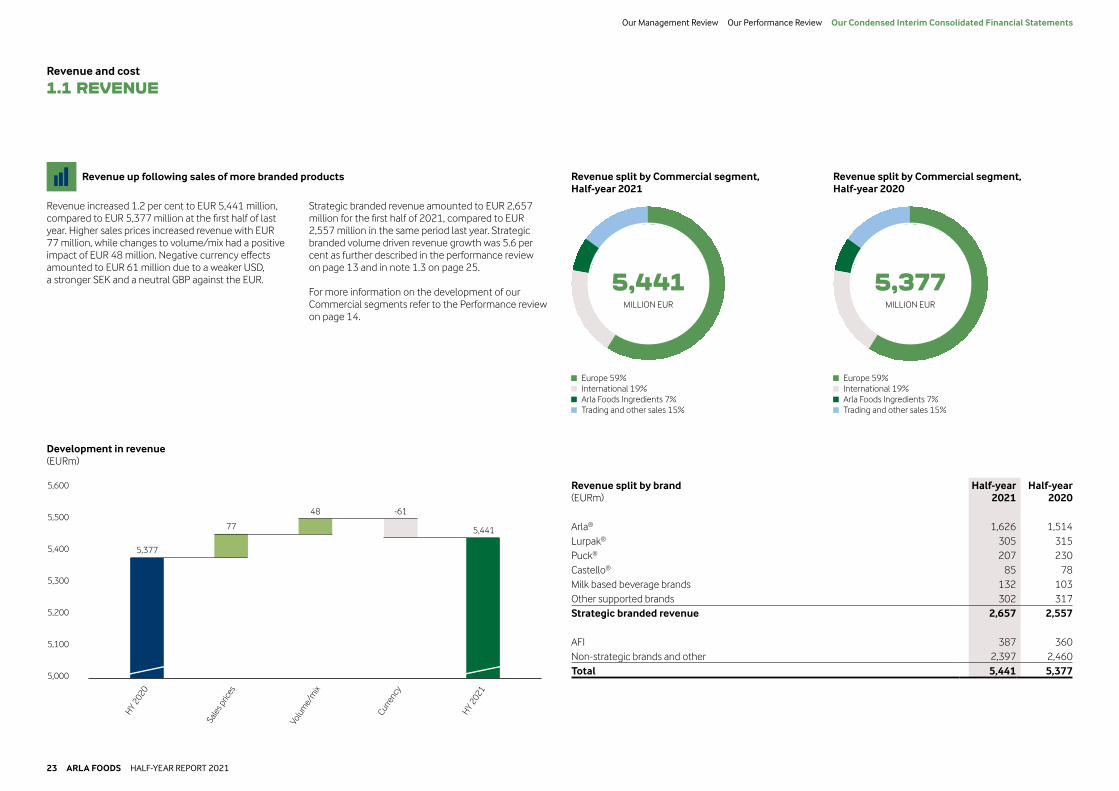
Revenue up following sales of more branded products
Revenue increased 1.2 per cent to EUR 5,441 million, compared to EUR 5,377 million at the first half of last year. Higher sales prices increased revenue with EUR 77 million, while changes to volume/mix had a positive impact of EUR 48 million. Negative currency effects amounted to EUR 61 million due to a weaker USD, a stronger SEK and a neutral GBP against the EUR.
Strategic branded revenue amounted to EUR 2,657 million for the first half of 2021, compared to EUR 2,557 million in the same period last year. Strategic branded volume driven revenue growth was 5.6 per cent as further described in the performance review on page 13 and in note 1.3 on page 25.
For more information on the development of our Commercial segments refer to the Performance review on page 14.
5,377
77
48 -61
5,441
HY 2020
Sale
s pric
es
Volu
me/
mix
Curre
ncy
HY 2021
Development in revenue(EURm)
5,000
5,100
5,200
5,300
5,400
5,500
5,600
Revenue split by Commercial segment, Half-year 2021
Revenue split by Commercial segment, Half-year 2020
5,441MILLION EUR
5,377MILLION EUR
Europe 59% International 19% Arla Foods Ingredients 7% Trading and other sales 15%
Europe 59% International 19% Arla Foods Ingredients 7% Trading and other sales 15%
Revenue split by brand(EURm)
Half-year2021
Half-year2020
Arla® 1,626 1,514Lurpak® 305 315Puck® 207 230Castello® 85 78Milk based beverage brands 132 103Other supported brands 302 317Strategic branded revenue 2,657 2,557
AFI 387 360Non-strategic brands and other 2,397 2,460Total 5,441 5,377
23 ARLA FOODS HALF-YEAR REPORT 2021
Our Management Review Our Performance Review Our Condensed Interim Consolidated Financial Statements

Revenue and cost
1.2 COSTS
Higher milk price to farmers and changed brand mix increased costs
Operational costs amounted to EUR 5,228 million compared to EUR 5,151 million in the first half of last year, representing an increase of 1.5 per cent.
Production costs increased with EUR 84 million to EUR 4,287 million compared to EUR 4.203 million in the first half of 2020. The overall driver was higher milk prices, which increased the cost of raw milk by EUR 110 million. The prepaid milk price to farmer owners increased EUR 117 million, while costs of other milk decreased EUR 7 million. Production costs excluding the cost of raw milk decreased EUR 26 million compared to the same period last year.
Sales and distribution costs decreased EUR 11 million, primarily due to lower sales costs within our International business.
Staff costs increased to EUR 678 million, compared to EUR 667 million in the first half of last year, due to of insourcing in MENA as well as regular salary adjustments across Arla.
The Calcium savingsnet of inflation were EUR 29 million in the first half of 2021. The net cost effect compared to the first half of 2020 amounted to EUR 18 million and includes reinvestments.
Development in operational costs (EURm)
5,151
HY 2020
Volu
me/
mix
and
othe
r cha
nges
in
oper
atio
nal c
osts
Milk
cost
HY 2021
M&A
Curre
ncy
Calciu
m n
et o
f
rein
vest
men
ts
110
37 -18- -52
5,228
5,000
5,100
5,200
5,300
5,400
Operational costs split by function and type(EURm)
Half-year2021
Half-year2020
Production costs 4,287 4,203 Sales and distribution costs 734 745 Administration costs 207 203 Total 5,228 5,151
Specification:Weighed-in raw milk 2,583 2,473 Other production materials* 880 936 Staff costs 678 667
Transportation costs 347 323 Marketing costs 113 112 Depreciation, amortisation and impairment 233 225 Other costs** 394 415Total 5,228 5,151
Average number of full-time employees 20,304 19,610
*Other production materials includes packaging, additives, consumables and changes in inventory**Other costs mainly includes maintenance, utilities and IT
Weighed-in raw milk(EURm)
Half-year2021
Half-year2020
mkg EURm mkg EURm
Owner milk 6.343 2.345 6,360 2,228 Other milk 596 238 625 245 Total 6,939 2,583 6,985 2,473
24 ARLA FOODS HALF-YEAR REPORT 2021
Our Management Review Our Performance Review Our Condensed Interim Consolidated Financial Statements

Table 1.3.1 Performance price Half-year 2021 Half-year 2020EURm Volume
in mkgEUR-cent/
kgEURm Volume
in mkgEUR-cent/
kg
Owner milk 2,345 6,343 37.0 2,228 6,360 35.0Adjustment to standard milk (4.2% fat, 3.4% protein) -1.0 -0.6Standard pre-paid milk price 36.0 34.4Arla Foods amba's share of profit for the period 165 2.6 163 2.6Total 6,343 38.6* 6,360 37.0
* The milk conversion factor from litre into kg. was 1.02 for milk volumes until 30 June 2021. Effective from 1 July 2021, the milk conversion factor is 1.03.
Revenue and cost
1.3 kEY PERFORMANCE INDICATORS
The alternative performance measures disclosed below are key performance indicators for the group. They are not IFRS requirements.
Strategic branded volume driven revenue growth
Continued strong brand growth
Volume driven revenue growth (VDRG) is defined as revenue growth that is derived from growth in volumes keeping prices constant. VDRG on strategic brands is an alternative performance measure applied to support and understand the non-price revenue growth and performance of our branded business. Strategic
branded VDRG increased 5.6 per cent in the first half of 2021, compared to 10.4 per cent for the first half of last year. Higher sales of branded products in the retail business was the main driver of the continued increase.
Profit share
Profit share in line with expectations
The profit share in Arla is targeted at 2.8-3.2 per cent of revenue, calculated from the profit attributable to our farmer owners. For the first half of 2021 the profit share amounted to EUR 165 million compared to EUR 163
million for the first half of last year. This corresponded to 3.0 per cent of revenue. The profit distributable to farmer owners will be pecified in the profit appropriation at year end.
Table 1.3.2 Strategic branded volume driven revenue growth(EURm)
Half-year2021
Half-year2020
Strategic branded revenue last half-year 2,557 2,220Strategic branded volume driven revenue growth 140 231Price- and exchange rate adjustments -40 106Strategic branded revenue 2,657 2,557
Strategic branded volume driven revenue growth, % 5.6% 10.4%
The calculation of strategic branded VDRG is based on fixed exchange rates and is defined as volume growth of EUR 140 million divided by the net amount of strategic branded revenue last year of EUR 2,557 million and an exchange rate effect from average to fixed exchange rates of EUR -58 million.
Table 1.3.3 Profit share(EURm)
Half-year2021
Half-year2020
Revenue 5,441 5,377Profit for the period 172 166Profit relating to non-controlling interests -7 -3Profit attributable to farmer owners 165 163
Profit share 3.0% 3.0%
Profit share is calculated as EUR 165 million divided by EUR 5.441 million and equals 3.0 per cent at half-year 2021.
Performance price
Strong business performance led to higher performance price
Arla’s performance price is a key measure of the overall performance, expressing the value added to each kilo of milk supplied by our farmer owners. The performance price is calculated as the standardised prepaid milk price, included in production costs, plus Arla Foods amba’s
share of profit for the year, divided by the weighed-in milk volume in the first half of 2021. The performance price was 38.6 EUR-cent/kg owner milk, compared to 37.0 EUR-cent/ kg owner milk for the first half of last year.
25 ARLA FOODS HALF-YEAR REPORT 2021
Our Management Review Our Performance Review Our Condensed Interim Consolidated Financial Statements

Net working capital
2.1 NET WORkiNG CAPiTAL
Net working capital position driven by higher prices and inventory volumes
Net working capital increased by EUR 164 million to EUR 966 million, corresponding to an increase of 20 per cent compared to the carrying amount at 30 June 2020.
Measured in days of turnover* net working capital increased to 36 days compared to 30 days end of June last year. The increase was due to deliberately reduced use of trade receivable finance programmes and higher inventory values.
Trade receivable finance programmes are used as an integrated part of our liquidity management. Together with increased sales prices this was the main reasons for an increase of the trade receivables position of EUR 176 million compared to 30 June 2020.
Inventory increased by EUR 49 million due to higher milk prices and higher volumes partly offset by reclassification of certain spare part positions as of last year.
During the covid-19 pandemic and onwards we have carefully monitored the development in trade receiva-bles. We have not experienced any significant adverse developments in overdues, and the provision for expected losseses decreased by EUR 3 million to a level of EUR 14 million at 30 June 2021.
Trade and other payables increased EUR 61 million to EUR 1.184 as a result of regular business activities.
We continuously strive to optimise our net working capital positions through initiatives such as increased use of global procurement agreements, optimisation of inventory levels, improved payment terms, as well as utili-sation of financing programmes with customers and suppliers when relevant.
* Measured on trailing 3 months data.
Net working capital (EURm)
0
500
1,000
1,500
HY 2017
1,220
1,061
HY 2018
1,091
928
HY 2019
1,141
982
HY 2020
971
802
HY 2021
1,150
966
Net working capital(EURm)
Half-year2021
Half-year2020
Inventory 1,203 1,154Trade receivables 947 771Trade and other payables -1,184 -1,123Net working capital 966 802
Inventory(EURm)
Half-year2021
Half-year2020
Inventory before write-downs 1,223 1,182 Write-downs -20 -28 Total inventory 1,203 1,154
Raw materials and consumables 246 297 Work in progress 392 332 Finished goods and goods for resale 565 525 Total inventory 1,203 1,154
Trade receivables(EURm)
Half-year2021
Half-year2020
Trade receivables before provision for expected losses 961 788 Provision for expected losses -14 -17 Total trade receivables 947 771
Net working capital excluding payables related to owner milk Net working capital
26 ARLA FOODS HALF-YEAR REPORT 2021
Our Management Review Our Performance Review Our Condensed Interim Consolidated Financial Statements
Capital employed
3.1 CAPiTAL EMPLOYED
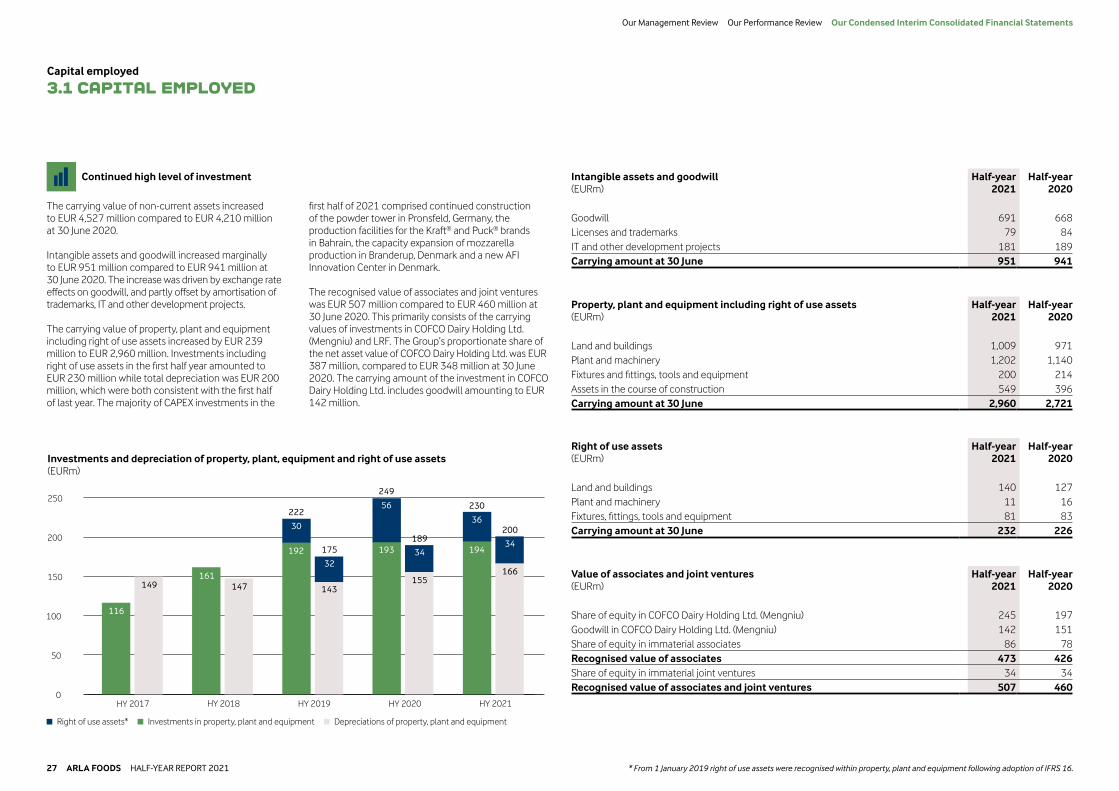
Continued high level of investment
The carrying value of non-current assets increased to EUR 4,527 million compared to EUR 4,210 million at 30 June 2020.
Intangible assets and goodwill increased marginally to EUR 951 million compared to EUR 941 million at 30 June 2020. The increase was driven by exchange rate effects on goodwill, and partly offset by amortisation of trademarks, IT and other development projects.
The carrying value of property, plant and equipment including right of use assets increased by EUR 239 million to EUR 2,960 million. Investments including right of use assets in the first half year amounted to EUR 230 million while total depreciation was EUR 200 million, which were both consistent with the first half of last year. The majority of CAPEX investments in the
first half of 2021 comprised continued construction of the powder tower in Pronsfeld, Germany, the production facilities for the Kraft® and Puck® brands in Bahrain, the capacity expansion of mozzarella production in Branderup, Denmark and a new AFI Innovation Center in Denmark.
The recognised value of associates and joint ventures was EUR 507 million compared to EUR 460 million at 30 June 2020. This primarily consists of the carrying values of investments in COFCO Dairy Holding Ltd. (Mengniu) and LRF. The Group’s proportionate share of the net asset value of COFCO Dairy Holding Ltd. was EUR 387 million, compared to EUR 348 million at 30 June 2020. The carrying amount of the investment in COFCO Dairy Holding Ltd. includes goodwill amounting to EUR 142 million.
Investments and depreciation of property, plant, equipment and right of use assets (EURm)
HY 2017 HY 2019HY 2018 HY 2020 HY 20210
50
100
150
200
250
116
149161
147
192
143
193
155
189
56
34
222
175
30
32
249
194
166
20036
34
230
Right of use assets* Investments in property, plant and equipment Depreciations of property, plant and equipment
Intangible assets and goodwill(EURm)
Half-year2021
Half-year2020
Goodwill 691 668 Licenses and trademarks 79 84 IT and other development projects 181 189 Carrying amount at 30 June 951 941
Property, plant and equipment including right of use assets(EURm)
Half-year2021
Half-year2020
Land and buildings 1,009 971 Plant and machinery 1,202 1,140 Fixtures and fittings, tools and equipment 200 214 Assets in the course of construction 549 396 Carrying amount at 30 June 2,960 2,721
Right of use assets(EURm)
Half-year2021
Half-year2020
Land and buildings 140 127 Plant and machinery 11 16 Fixtures, fittings, tools and equipment 81 83 Carrying amount at 30 June 232 226
Value of associates and joint ventures(EURm)
Half-year2021
Half-year2020
Share of equity in COFCO Dairy Holding Ltd. (Mengniu) 245 197 Goodwill in COFCO Dairy Holding Ltd. (Mengniu) 142 151 Share of equity in immaterial associates 86 78 Recognised value of associates 473 426 Share of equity in immaterial joint ventures 34 34 Recognised value of associates and joint ventures 507 460
* From 1 January 2019 right of use assets were recognised within property, plant and equipment following adoption of IFRS 16.27 ARLA FOODS HALF-YEAR REPORT 2021
Our Management Review Our Performance Review Our Condensed Interim Consolidated Financial Statements
Funding
4.1 FUNDiNG AND PENSiONS
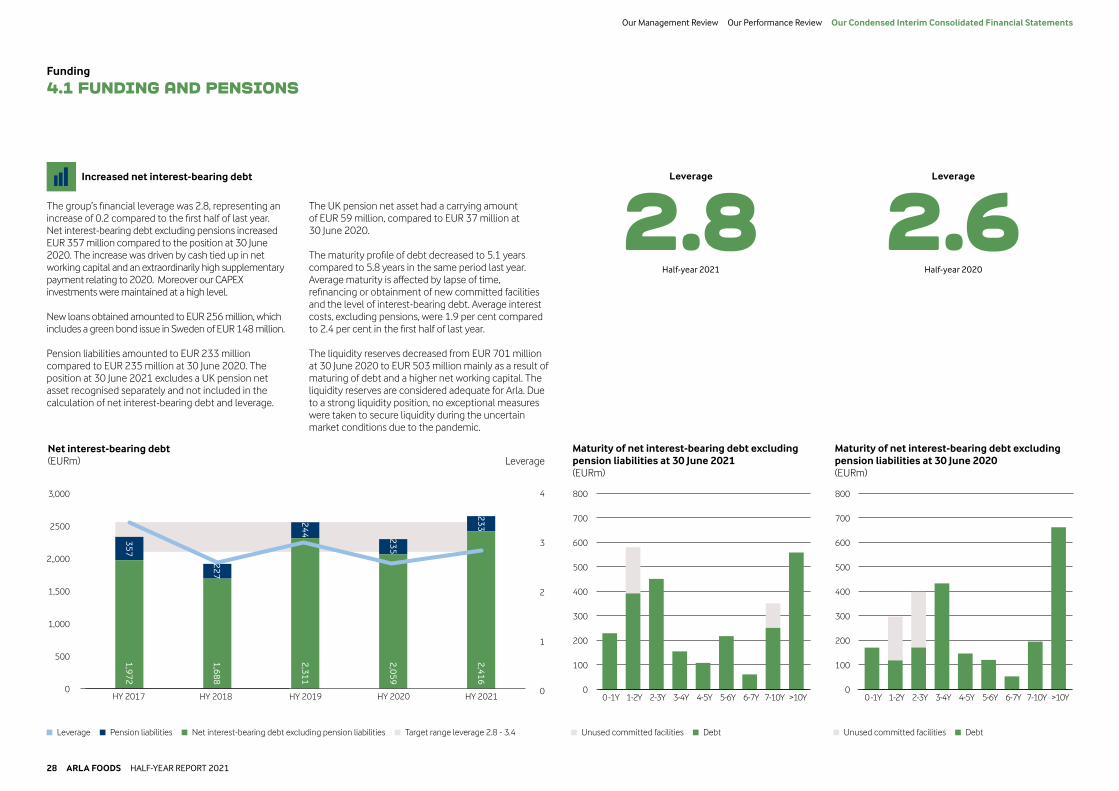
Increased net interest-bearing debt
The group’s financial leverage was 2.8, representing an increase of 0.2 compared to the first half of last year. Net interest-bearing debt excluding pensions increased EUR 357 million compared to the position at 30 June 2020. The increase was driven by cash tied up in net working capital and an extraordinarily high supplementary payment relating to 2020. Moreover our CAPEX investments were maintained at a high level.
New loans obtained amounted to EUR 256 million, which includes a green bond issue in Sweden of EUR 148 million.
Pension liabilities amounted to EUR 233 million compared to EUR 235 million at 30 June 2020. The position at 30 June 2021 excludes a UK pension net asset recognised separately and not included in the calculation of net interest-bearing debt and leverage.
The UK pension net asset had a carrying amount of EUR 59 million, compared to EUR 37 million at 30 June 2020.
The maturity profile of debt decreased to 5.1 years compared to 5.8 years in the same period last year. Average maturity is affected by lapse of time, refinancing or obtainment of new committed facilities and the level of interest-bearing debt. Average interest costs, excluding pensions, were 1.9 per cent compared to 2.4 per cent in the first half of last year.
The liquidity reserves decreased from EUR 701 million at 30 June 2020 to EUR 503 million mainly as a result of maturing of debt and a higher net working capital. The liquidity reserves are considered adequate for Arla. Due to a strong liquidity position, no exceptional measures were taken to secure liquidity during the uncertain market conditions due to the pandemic.
0
500
1,000
1,500
2,,000
2500
3,000
0
1
2
3
4
1,972
1,688
2,311
2,059
2,416
357
227
244
235
233
Net interest-bearing debt (EURm)
Leverage
HY 2017 HY 2019HY 2018 HY 2020 HY 2021
Maturity of net interest-bearing debt excluding pension liabilities at 30 June 2021(EURm)
0
100
200
300
400
500
600
700
800
0-1Y 1-2Y 2-3Y 3-4Y 4-5Y 5-6Y 6-7Y 7-10Y >10Y
Maturity of net interest-bearing debt excluding pension liabilities at 30 June 2020(EURm)
0
100
200
300
400
500
600
700
800
0-1Y 1-2Y 2-3Y 3-4Y 4-5Y 5-6Y 6-7Y 7-10Y >10Y
Leverage
2.8Half-year 2021
Leverage
2.6Half-year 2020
Leverage Pension liabilities Net interest-bearing debt excluding pension liabilities Target range leverage 2.8 - 3.4 Unused committed facilities Debt Unused committed facilities Debt
28 ARLA FOODS HALF-YEAR REPORT 2021
Our Management Review Our Performance Review Our Condensed Interim Consolidated Financial Statements

Funding
4.1 FUNDiNG AND PENSiONS
Liquidity reserves(EURm)
Half-year2021
Half-year2020
Cash and cash equivalents 124 150 Securities (free cash flow) 25 11 Unutilised committed loan facilities 339 406 Unutilised other loan facilities 15 134 Total 503 701
Liquidity reserves, Half-year 2021 Liquidity reserves, Half-year 2020
503MILLION EUR
701MILLION EUR
Cash and cash equivalents 25% Securities (free cash flow) 5% Unutilised committed loan facilities 67% Unutilised other loan facilities 3%
Cash and cash equivalents 21% Securities (free cash flow) 2% Unutilised committed loan facilities 58% Unutilised other loan facilities 19%
Pension liabilities(EURm)
Half-year2021
Half-year2020
Present value of funded liabilities 1,692 1,662Fair value of plan assets -1,524 -1,473Deficit of funded plans 168 189Present value of unfunded liabilities 6 9Net pension liabilities recognised on the balance sheet 174 198
Presented as:Pension assets -59 -37 Pension liabilities 233 235 Net pension liabilities 174 198
The UK pension scheme represented a surplus and the Swedish pension scheme represented a deficit. Surplus is presented as Pension assets and deficit as Pension liabilities.
Assumptions for the actuarial calculations Half-year2021
%
Half-year2020
%
Discount rate, Sweden 1.9 1.5Discount rate, UK 2.0 1.5Expected payroll increase, Sweden 2.4 2.3Expected payroll increase, UK 3.3 2.8Inflation (CPI), Sweden 1.9 1.4Inflation (CPI), UK 2.5 1.7
Exchange rates Closing rate Average rateHalf-year
2021Half-year
2020Change
%Half-year
2021Half-year
2020Change
%
EUR/GBP 0.860 0.914 5.9 0.868 0.873 0.6EUR/SEK 10.147 10.489 3.3 10.129 10.660 5.0EUR/DKK 7.436 7.452 0.2 7.437 7.465 0.4EUR/USD 1.190 1.124 -5.8 1.205 1.102 -9.3EUR/SAR 4.464 4.217 -5.9 4.520 4.137 -9.2
29 ARLA FOODS HALF-YEAR REPORT 2021
Our Management Review Our Performance Review Our Condensed Interim Consolidated Financial Statements

GLOSSARY
Arlagarden® is the name of our quality assurance programme.
Brand share measures the revenue from strategicbrands as a proportion of total revenue, and is defined as the ratio of revenue from strategic branded products and total revenue.
CAPEX is an abbreviation of capital expenditure.
CPI is an abbreviation of Consumer Price Index.
EBIT is an abbreviation of earnings before interest and tax, and a measure of earnings from operations.
EBITDA is an abbreviation of earnings before interest, tax, depreciation and amortisation from ordinary operations.
EBIT margin measures EBIT as a percentage of total revenue.
Equity ratio is the ratio between equity exclusive of minority interests and total assets, and is a measure of the financial strength of Arla.
Free cash flow is defined as cash flow from operating activities after deducting cash flow from investing activities.
International share of business is defined as the revenue from the International zone as a percentage of the revenue from the International and Europe zones.
Leverage is the ratio between net interest-bearingdebt inclusive of pension liabilities and EBITDA. It enables evaluation of the ability to support future debt and obligations; the long-term target range for leverage is between 2.8 and 3.4.
MENA is an acronym referring to the Middle East and North Africa.
Milk volume is defined as total intake of raw milk in kg from owners and contractors.
M&A is an abbreviation of mergers and acquisitions.
Net interest-bearing debt is defined as current and non-current interest-bearing liabilities less securities, cash and cash equivalents, and other interest-bearing assets.
Net interest-bearing debt inclusive of pension liabilities is defined as current and non-current interest-bearing liabilities less securities, cash and cash equivalents, and other interest-bearing assets plus pension liabilities.
Performance price for Arla Foods is defined as the pre-paid milk price plus net profit divided by total member milk volume intake. It measures value creation per kg of owner milk, including retained earnings and supplementary payments.
Pre-paid milk price describes the cash paymentfarmers receive per kg of milk delivered during thesettlement period.
Profit margin is a measure of profitability. It is the amount by which revenue from sales exceeds costs in a business.
Profit share is defined as the ratio between profit for the period allocated to owners of Arla Foods, and total revenue.
Net working capital is the capital tied up ininventories, receivables and payables, includingpayables for owner milk.
Net working capital excluding owner milk isdefined as capital tied up in inventories,receivables and payables, excluding payables for owner milk.
Strategic brands are defined as products sold under branded products such as Arla®, Lurpak®, Castello® and Puck®.
Project management: Consolidation and external reporting, Arla. Design and production: We Love People.Translation: Semantix. Photos: Arla, Jens Bangsbo and Kristian Holm.
Strategic branded volume driven revenue growth is defined as revenue growth associated with growth in volumes from strategic branded products while keeping prices constant.
Trading share is a measure of the total milkconsumption for producing commodity productsrelative to the total milk consumption, i.e. based on volumes. Commodity products are sold with lower or no value added, typically via business-to-business sales for other companies to use in their production as well as via industry sales of cheese, butter or milk powder.
Value-added segment comprises Arla Foods Ingredients products with special functionality and compounds, compared to standard protein concentrates with a protein content of approximately 80 per cent.
Volume driven revenue growth is defined asrevenue growth associated with growth in volumeswhile keeping prices constant.
WMP is an abbreviation referring to whole milk powder.
30 ARLA FOODS HALF-YEAR REPORT 2021
Our Management Review Our Performance Review Our Condensed Interim Consolidated Financial Statements
AUGUSTPublication of the Half-Year Report 2021
26
AUGUSTExtraordinary Board of Representatives meeting
26-27
OCTOBERMeeting of the Board of Representatives
26-27
CORPORATECALENDARFinancial reports and major events
FEBRUARYPublication of the Annual Report 2021
24
FEBRUARYMeeting of the Board of Representatives
23-24
FEBRUARYAnnouncement of the 2021 results
10
31 ARLA FOODS HALF-YEAR REPORT 2021
Our Management Review Our Performance Review Our Condensed Interim Consolidated Financial Statements

Arla Foods UK plc 4 Savannah WayLeeds Valley ParkLeeds, LS10 1 ABEngland Phone +44 113 382 7000E-mail [email protected]
www.arlafoods.co.uk
Arla Foods ambaSønderhøj 14DK-8260 Viby J. DenmarkCVR no.: 25 31 37 63
Phone +45 89 38 10 00E-mail [email protected]
www.arla.com